Abstract
Soil erosion is one of the most critical threats to cultivated land. Yet little information is available in Sub-Saharan Africa, especially on the relative contributions of various forms of erosion. Therefore, this study’s objective was to quantify soil loss by sheet and linear erosion. The study was carried out on the sloping land rangeland of the Potshini catchment of KwaZulu-Natal, South Africa, with an annual average rainfall of 766 mm. The average sheet erosion computed using a network of 1 m2 microplots was 7.7 ton ha−1 y−1 with standard error of 1.97 ton ha−1 y−1 (which corresponded to an ablation rate of between 0.35 to 1.32 mm y−1) while linear erosion, mainly the retreat of gully banks, removed 4.8 ton ha−1 y−1, i.e., 38.4% of total soil losses. Despite removing a lower amount of soil, sheet erosion by depleting fertile, carbon- and nutrient-enriched soil horizons has a great impact on most ecological functions associated with soils.
1. Introduction
Erosion by water is one of the main causes of soil loss and impacts food production [1,2]. Soil erosion by water occurs as sheet and linear erosion. Sheet erosion removes a thin layer of soil from the soil, which has long been unnoticed, but since the early 1990s, it has been identified as one of the major threats to the sustainability of soils [3]. Linear erosion takes place when runoff concentrates and can lead to the formation of rills and gullies.
Most often, sheet and linear erosion have been investigated independently [4], and several questions have arisen: (1) What is the relative contribution of splash, sheet and gully erosion to the overall soil erosion? (2) What are the mechanisms involved and controlling factors? (3) What are the interactions between the different types of water erosion? (4) What are the appropriate remediation techniques at landscape level?
In South Africa, as in many areas of the world, the evaluation and prediction of soil erosion has often been conducted using the universal soil loss equation (USLE) method [5]. However, this method, even in its revised version, does not account for the contribution of linear erosion as pointed out by [6], thus leading to incorrect estimations. When based on field investigations, fluxes of sediments are evaluated within rivers such as by [7] reporting soil erosion rates of 306 g m−2 y−1 at 23 ha level and 0.29 g m−2 y−1 at 1000 ha level, but with no information on the respective contributions of sheet and linear erosion.
Only a few studies in South Africa gathered quantitative data on sheet erosion alone [8,9,10,11,12,13,14,15,16]. Ref [15], using 1 m2 micro-plots installed within the sloping lands of KwaZulu- Natal (South Africa), indicated that splash and little surface runoff remove from its initial place an average of 6.45 ton ha−1 y−1, with values varying from 3 to 13 ton ha−1 y−1 depending on soil surface coverage by plants, slope gradient and soil characteristics, such as bulk density and soil clay content.
Linear erosion and especially deep gullies, locally termed ‘dongas’, are a main concern in South Africa because of their number [17,18,19,20,21] and because they pose severe constraints on the agricultural use of land by rendering much of the farmland inaccessible. Dongas mainly affect steep slope areas dedicated to rangeland [22]. Despite there being numerous studies on gully erosion that have provided information on gully occurrence (e.g., [21]), there is limited quantitative information on the amount of erosion involved. Dongas are associated with the presence of certain parent materials [19], such as unconsolidated colluvions associated with high sodium contents [23,24], and erode easily [20]. Ref [25], using rainfall simulation to assess the mechanisms of gully bank retreat, showed that the dominant mechanism is runoff detachment followed by splash and the fall down of aggregates.
In this context, the main objective of this work is to compare sheet and linear erosion at the catchment level. This study was conducted within an agricultural area under communal grazing and sloping lands of South Africa and specifically at the Potshini catchment, where several research studies have been performed on linear erosion and several others on sheet erosion. Here, we compared the findings by [15], which were obtained using 1 × 1 m runoff plot, and those by [26] on linear erosion using a network of benchmarks at gully banks and gully head cuts.
2. Materials and Methods
2.1. Geology, Climate and Soils
The area is a 1000 ha catchment (longitude: 29.36°; latitude: 28.82°) located within the KwaZulu-Natal province, South Africa (Figure 1). It is under rangeland (highlands) and croplands lowland), and the climate is sub-tropical humid whose particularity is that most of rains occur in summer [27]. The mean annual precipitation from the nearest station (Bergville, which is located 10 km to the east of the study site) is 684 mm y−1, and the potential evaporation is 1600 mm y−1. The mean annual temperature is 13 °C [27]. Altitudes at the study site ranges from 1080 to 1455 m, and the topography is relatively gentle with a mean slope gradient of 16%. Soils were formed from the Karoo Supergroup, which exhibits a succession of fine-grained mudstones, siltstones, sandstones and shales [28]. While the rangeland is freely grazed the whole year, lowlands are manually ploughed for rain-fed beans and maize production, and little fertilization and herbicides are used due to the limited access to funds.
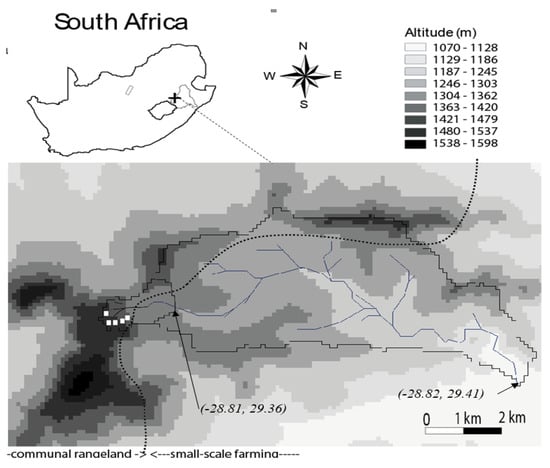
Figure 1.
Location of the study microplots on the landscape and the location of Potshini in KwaZulu-Natal province of South Africa.
The soils are classified as Inanda soil (Soil Classification Working Group, 1991) or Acrisols [29]. Deep Acrisols (>1 m) with a pH of 4.5 and a C content of 1.5% in the 0–10 cm range. A horizon characterizes bottomlands and footslopes, while slopes are characterized by shallow soils (<0.5 m, with a pH of 4.5 and a C content of 1.2%) because of erosion. In the latter, a humiferous A horizon of dark reddish brown (5YR 3/3) color overlays in most bases a massive clayey (40%) Bw horizon (from 30 to 60 cm). In some situations, and due to accelerated erosion, the BW horizon directly outcrops the soil surface.
2.2. Micro-Plots Used for the Estimation of Sheet Erosion
Sheet erosion was assessed using fifteen 1 m2 runoff plots [15] installed at different topographical positions, soil type and overgrazing density. As can be seen in Figure 1, three plot replicates were used per modality: “Deep Acrisols at footslope (F); shallow Acrisols at midslope (M); Shallow Acrisols at terrace (T); Deep reddish Acrisols at shoulder under dolerite (SD); and deep yellowish Acrisols at shoulder under sandstone (SS)” (From [15]).
The metal borders surrounding the plots were inserted in the soil to 0.1 m, and the field measurements were carried out over two years. These were thus assumed to occur under steady-state conditions, as no significant soil cracking or linear erosion occurred. After each runoff event, the total runoff volume (R) was collected and evaluated using graduated containers, and a 800 mL aliquot was sampled for the estimation of sediment concentration (SC) through drying at 110 °C for 48 h. Finally, the total soil losses (SL) were computed as the product of R by SC.
A total of 555 samples were collected during the study, during which 37 runoff events occurred. Each rainstorm was characterized by the amount of rain, the maximum and average rainfall intensity (over 6 min).
2.3. Linear Erosion
Gully bank and gully head cut retreats had a major impact at the study site. Both the survey of gully bank and gully head cut retreats were performed using erosion pins. Erosion pins consist of metallic nails that are set into the gully banks so that the top of the pin gives a datum from which changes in the length that protrudes above the soil surface can be recorded for assessing rates of soil loss over time (Figure 2). This method was adapted from a widely used method developed for soil surface erosion by [30] and is readily available. Measurements of the length that protrudes above the soil surface can be made in a very flexible way, from the storm event level to every 10 years. The 0.15 m pins were inserted into the soil to the soil surface to set a benchmark for soil erosion. Their diameter was of 5 mm, and a metallic washer was placed at their top to ensure first finding the nails after each rain event and second to ensure a more accurate reading of the gully bank retreat. Secondary 0.5 m long and 10 mm thick nails (Figure 2) were also inserted into gully banks to register large erosion rates, such as these due to the collapse of gully banks.
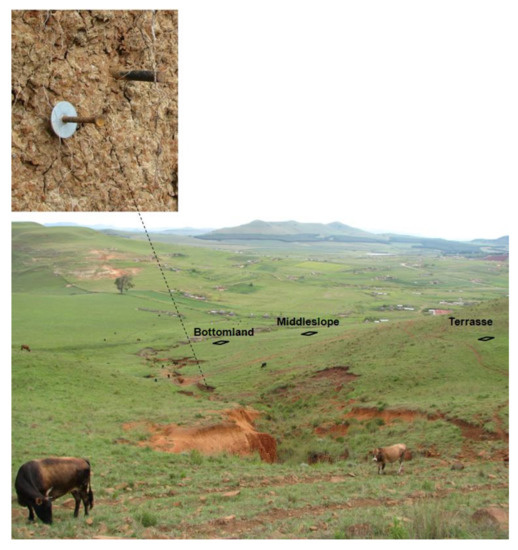
Figure 2.
Landscape features of the Potshini catchment, main gully within the communal rangeland, location of the 1 m2 microplots from the lower part of the landscape and detail of a gully bank showing the pins at the end of the 2007 rainy season.
Pins were installed along soil profiles distant by 10 m and for each profile, they were inserted horizontally at respectively 0.15, 0.5 and 1 m from the soil surface. The 0.5 m long metallic bar was installed at 0.5 m deep (Figure 2). Hundred and ten soil profiles were equipped at 3 gullies, totaling 1076 m of gully banks and 440 data points. The pins were installed in September 2007 and surveyed in April 2008 to estimate the average gully bank retreat to be converted into an average yearly soil loss.
3. Results and Discussion
3.1. The Rainfall Conditions
The 2007–2008 rainy season was characterized by 37 rainfall events causing erosion. The cumulative rainfall amount of these 37 events was 766 mm, and the yearly rainfall amount was 850 mm. The average rainfall amount (RA) of these events was 21 mm with values between 4 and 49 mm, and the average 6 min rainfall intensity (RI) was 13 mm h−1 (4 < RI < 38 mm h−1). The larger events occurred on the 11th of December (RA = 48 mm; RI = 9 mm h−1), 14th of January (RA = 43 mm; RI = 14 mm h−1) and 21st of April (RA = 48 mm; RI = 22 mm h−1). Twenty-five events had a RA of more than 15 mm and a RI of more than 15 mm h−1, which might be considered highly erosive events.
3.2. Soil Inter-Rill Erosion
The average runoff coefficient (R) computed from the 37 erosive rainfall events using the 15 microplots was 25% with values between 0 and 98%. The median R was 19%, and fifty percent of data were between 8 and 37%. The average sediment concentration was 3 g L−1 with a median at 1 g L−1, and 50% of the data were between 0 and 3 g L−1. The most extreme value was 51 g L−1 and occurred on 21 April 2008. The resulting average soil losses from the 37 events was 2.9 g. The first quartile was at 1 g and the third at 17 g, and the maximum value was 1247 g (Figure 3).
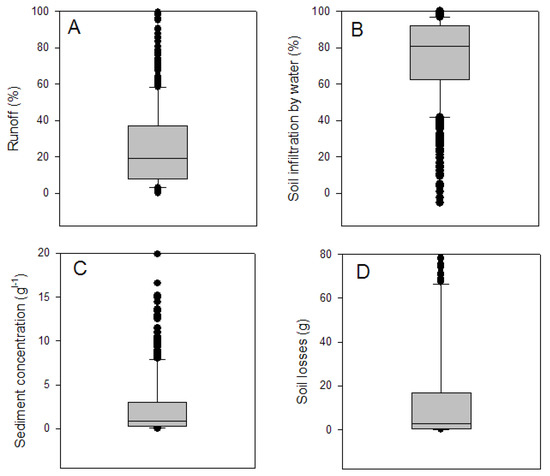
Figure 3.
Mean, first and third quartile of runoff (A), soil infiltration by water (B), sediment concentration (C), soil losses (D) computed for the 37 erosive events.
The average yearly soil loss by sheet erosion was 7.7 ton ha−1 y−1. This was much higher than the country average of 3 ton ha−1 y−1 estimated by Whyte (1995). However, the sheet erosion at our site was much lower than estimations made under similar sloping land conditions in Asia under similar Acrisols, where losses were between 6 and 35 ton ha−1 y−1 [31,32]. At our site, soil losses by sheet erosion ranged between 3.5 ton ha−1 y−1 at shoulders to 13.2 ton ha−1 y−1 at the terrace. The footslope position lost 5.3 ton ha−1 y−1, which was the second lowest erosion rate (Table 1). The shoulder, with 9.9 ton ha−1 y−1, was the second most erosive position. The greater erosion rate by sheet erosion at the middle slope correlated with the highest sediment concentration (5.6 g L−1 versus and average of 4.1 g L−1) and high runoff (30 vs. 23%). On the contrary, lower soil erosion rates correlated with lower runoff and sediment concentration as observed at the shoulder. It was, however, interesting to note that as the erosion rate at the terrace was close to the rangeland average, its runoff was much lower (16.5 vs. 23%) while its sediment concentration was much higher (5.0 vs. 4.1 g L−1). Such trends might be explained by the presence of well structure soils with the predominance of stable clayey aggregates that are easily removable and transportable by water erosion.

Table 1.
Average yearly soil losses from sheet and linear erosion. Runoff, sediment concentration, soil losses for the different slope positions sites (footslope: deep Acrisol at footslope, Middleslope: shallow Acrisols at midslope, Terrace: shallow Acrisols at terrace, ShoulderD: deep Acrisols at shoulder under dolerite, ShoulderS: deep Acrisols at shoulder under sandstones). Data computed from the 37 rainfall events of the 2007–2008 rainy season.
3.3. Soil Linear Erosion
The average gully bank retreat (both laterally and upstream) estimated from the 440 pins installed vertically at the 110 gully bank profiles selected was 0.037 m, i.e., 3.791 cm y−1. The median was at 1.5 cm, and 50% of the values were between 0.5 and 3.0 cm. The differences between the pins installed at 0.15, 0.5, and 1 m deep were not significant. Thirty-six pins showed a retreat of more than 15 cm reaching in two situations about 100 cm, which corresponded to the collapse of entire gully banks. A much higher occurrence of gully bank collapse occurred in the downslope parts. The landscape at the place of deep Acrisols resulting in an average retreat of 6.7 cm, compared to 2.0 cm for the middleslope and 1.9 cm for the upslope.
The total gully bank length was 1076 m, and the average gully bank height was 3.0 m. Considering that an upstream drainage area of these gullies is 23 ha and an average soil bulk density of 1.3 Mg m3, the estimated yearly erosion rate by linear erosion was 4.8 ton ha−1. This is a relatively low rate compared with the existing literature. [33] in their review of the work done worldwide on linear soil erosion reported erosion rates as high as 65 ton ha−1 y−1 such as in the badlands areas of Spain. Studies in Africa reported rates of 32 ton ha−1 y−1 in Niger and 15 ton ha−1 y−1 in the neighboring country of Lesotho [33], which were much higher than this observed in the present study. The erosion rate of 4.8 ton ha−1 y−1 was, however, of the same order as that found under tropical conditions in Kenya (3 ton ha−1 y−1, [34] and much higher than the 1.3 ton ha−1 y−1 lost from the sloping lands of Laos [35]. A possible reason for such a low level of linear erosion is the high stability of soil aggregates (which was previously observed by [15] as compared to the studies investigating for instance low aggregate stability soils, such as those found in the loess of Northern Europe.
4. Conclusions
This study made a direct assessment of soil losses by sheet and linear erosion within a typical sloping rangeland of KwaZulu Natal in South Africa. Over the 2007–2008 rainy season with a rainfall amount of 766 mm, the overall soil erosion was 12.5 ton ha−1 y−1. Linear erosion contributed 7.7 ton ha−1 y−1, corresponding to 61.6% of total soil losses, while sheet erosion averaged 38.4% or 7.7 ton ha−1 y−1 (Figure 4). These results on the predominance of linear erosion confirm previous observations made in tropical areas, where this erosion form is considered dominant in the process of soil degradation and downstream damages, such as dam siltation [36].
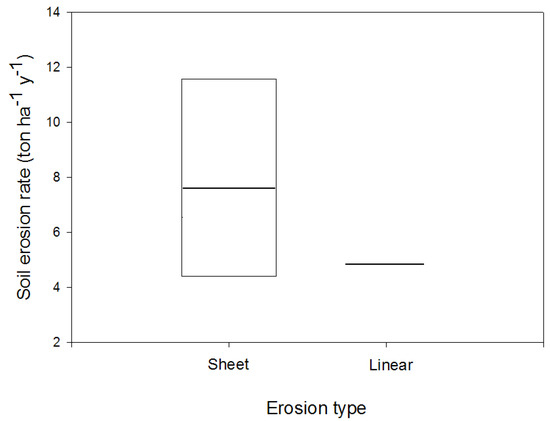
Figure 4.
Mean, first and third quartile of soil erosion rate for the two types of water erosion under study.
The second conclusion is that sheet erosion, which was highly variable within the 23 ha area (from 3.5 to 13.2 ton ha−1 y−1), corresponded to a soil ablation rate of 0.35 to 1.32 mm y−1 that would be 4.5 to 366 times higher than the natural rock weathering and soil formation [37,38]. From a qualitative point of view, the removed soil material is the most fertile, carbon- and nutrient-rich part of the soil with direct consequences on soil ecological functions of food and biomass production, water storage, support of biodiversity and/or climate change.
Overall, gullies represent a surface area of 6411 m2 (i.e., about 2.8% of the whole rangeland surface area). Considering an average gully bank retreat of 3.79 cm as found in this study, the loss of agricultural land increases each year by 28 m2 (i.e., 0.4%). This might not seem at first sight a staggering amount, but extrapolated to the next 10 years and assuming a similar erosion rate, the loss of agricultural land might be as much as 4%. Moreover, while sediments eroded in the slopes by sheet erosion are likely to resettle within the slopes [39,40], the soil material detached from the gully banks is in direct contact with the stream flow and is thus likely to constitute the major part of the exported sediments from the area. Up to 85% of sediment loads to a reservoir in a 0.73 km2 catchment in the tropical regions of southern China have been shown to have a gully bank origin [41]. The proportion of the exported sediments from rangelands originated from sheet and linear erosion needs to be further investigated. More is to be done as well on the temporal variations of sheet and linear erosion and on the quality of the exported sediments and their impact on downstream ecosystems.
Author Contributions
Conceptualization, M.M. and V.C.; methodology, V.C. and M.M.; software, V.C.; validation, V.C.; formal analysis, M.M.; investigation, M.M.; Sibonelo Mabaso and Potshini Community; resources, V.C.; data curation, M.M. and V.C.; writing—original draft preparation, V.C.; writing—review and editing, M.M.; visualization, V.C.; supervision, V.C.; project administration, V.C.; funding acquisition, V.C. All authors have read and agreed to the published version of the manuscript.
Funding
This study was funded by the Water Resource Commission of South Africa (project K5 1904 and K5 2266).
Institutional Review Board Statement
Not applicable.
Informed Consent Statement
Not applicable.
Data Availability Statement
Not applicable.
Acknowledgments
We thank the Water Resource Commission of South Africa for funding the study. We also thank Sibonelo Mabaso for field work and to the Potshini community for sharing experience, their kindness, and the access to their land.
Conflicts of Interest
The authors declare no conflict of interest.
References
- Wischmeier, W.H.; Smith, D.D. Predicting Rainfall Erosion Losses—A Guide to Conservation Planning, USDA Agricultural Handbook, 537; U.S. Government Printing Office: Washington, DC, USA, 1978.
- FAO. The State of Food and Agriculture; Electronic Publishing Policy and Support Branch Communication Division Editor: Rome, Italy, 2008; p. 138. ISBN 978-92-5-105980-7. ISSN 0081-4539. [Google Scholar]
- UNEP. Environmental Data Report 1993–1994; United Nations Environmental Programme: Oxford, UK, 1994. [Google Scholar]
- Badreddine, B.; Mohammed, H.; Boutkhil, M.; Ahmed, A. Assessment of erosion: Use of nuclear techniques and conventionalmethods—Case of the Fergoug watershed, Algeria. Environ. Monit Assess. 2021, 193, 55. [Google Scholar] [CrossRef] [PubMed]
- Fox, D.M.; Bryan, R.B. The relationship of soil loss by sheet erosion to slope gradient. Catena 1999, 38, 211–222. [Google Scholar] [CrossRef]
- Torri, D. Slope, aspect and surface storage. In Soil Erosion, Conservation, and Rehabilitation; Agassi, M., Ed.; Marcel Dekker: New York, NY, USA, 1996; pp. 77–106. [Google Scholar]
- Mutema, M.; Chivenge, P.; Nivet, F.; Rabouille, C.; Thieu, V.; Chaplot, V. Changes in carbon and nutrient fluxes from headwaters to ocean in a mountainous temperate to subtropical basin. Earth Surf. Processes Landf. 2017, 42, 2038–2053. [Google Scholar] [CrossRef]
- Schulze, R.E. Soil loss in the key area of the Drakensberg—A regional application of the Soil Loss Estimation Model for Southern Africa (SLEMSA). In Hydrology and Water Resources of the Drakensberg; Natal and Regional Planning Commission: Pietermaritzburg, South Africa, 1979; pp. 149–167. [Google Scholar]
- Snyman, H.A.; Van Rensburg, W.L.J. Effect of slope and plant cover on run-off, soil loss and water efficiency of natural veld. J. Grassl. South Afr. 1986, 3, 153–158. [Google Scholar] [CrossRef]
- Stern, R. Effects of Soil Properties and Chemical Ameliorants on Seal Formation, Runoff and Erosion. Ph.D. Thesis, University of Pretoria, Pretoria, South Africa, 1990. [Google Scholar]
- McPhee, P.J.; Smithen, A.A.; Venter, C.J.; Hartmann, M.O.; Crosby, C.T. The South African Rain Simulator Program for Assessing Soil Loss and Run-Off. Technical Report 119; Department of Environmental Affairs: Pretoria, South Africa, 1983.
- Henning, J.A.G.; Kellner, K. Degradation of a soil (aridosol) and vegetation in the semi-arid grassland of southern Africa. Bot. Bull. Acad. Sin. 1994, 35, 195–199. [Google Scholar]
- Le Roux, J.J.; NewbyI, T.S.; Sumner, P.D. Monitoring soil erosion in South Africa at a regional scale: Review and recommendations. South Afr. J. Sci. 2007, 103, 329–335. [Google Scholar]
- Le Roux, J.J.; Morgenthal, T.L.; Malherbe, J.; Pretorius, D.J.; Sumner, P.D. Water erosion prediction an national scale for South Africa. Water SA 2008, 34, 305–314. [Google Scholar] [CrossRef] [Green Version]
- Dlamini, P.; Orchard, C.; Jewitt, G.; Lorentz, S.; Titshall, L.; Chaplot, V. Controlling factors of sheet erosion under degraded grasslands in a sloping-land-agricultural catchment of KwaZulu Natal, South Africa. Agric. Water Manag. 2011, 98, 1711–1718. [Google Scholar] [CrossRef]
- Muller-Nedbock, D.; Chivenge, P.; Chaplot, V. Selective organic carbon losses from soils by sheet erosion and main controls. Earth Surf. Processes Landf. 2016, 41, 1399–1408. [Google Scholar] [CrossRef] [Green Version]
- Martin, A.K. Comparison of sedimentation rates in the Natal Valley, south-west Indian Ocean, with modern sediment yields in east coast rivers of Southern Africa. South Afr. J. Sci. 1987, 83, 716–724. [Google Scholar]
- Beckedahl, H.R. Subsurface Soil Erosion Phenomena in Transkei and Southern KwaZulu-Natal, South Africa. Ph.D. Thesis, University of Natal, Pietermaritzburg, South Africa, 1996; p. 224. [Google Scholar]
- Van Breda Weaver, A. The distribution of soil erosion as a function of slope aspect and parent material in Ciskei, South Africa. GeoJournal 1991, 23, 29–34. [Google Scholar] [CrossRef]
- Wintle, A.G.; Botha, G.A.; Li, S.H.; Vogel, J.C. A chronological framework for Watson, H.K., 1996. Short and long-term influence on soil erosion of settlement by peasant farmers in KwaZulu-Natal. South Afr. Geogr. J. 1995, 78, 1–6. [Google Scholar]
- Bernini, A.; Bosino, A.; Botha, G.A.; Maerker, M. Valuation of Gully Erosion Susceptibility Using a Maximum Entropy Model in the Upper Mkhomazi River Basin in South Africa. ISPRS Int. J. Geo-Inf. 2021, 10, 729. [Google Scholar] [CrossRef]
- Meadows, M.E. Soil erosion in the Swartland, Western Cape Province, South Africa: Implications of past and present policy and practice. Environ. Sci. Policy 2003, 6, 17–28. [Google Scholar] [CrossRef]
- Yaalon, D.H. Is gullying associated with highly sodic colluvium? Further comment to the environmental interpretation of Southern African dongas. Palaeogeogr. Palaeoclimatol. Palaeoecol. 1987, 58, 121–123. [Google Scholar] [CrossRef]
- Rienks, S.M.; Botha, G.A.; Hughes, J.C. Some physical and chemical properties of sediments exposed in a gully-donga/in northern KwaZulu-Natal, South Africa and their relationship to the erodibility of the colluvial layers. Catena 2000, 39, 11–31. [Google Scholar] [CrossRef]
- Chaplot, V.; Brown, J.; Dlamini, P.; Eustice, T.; Janeau, J.; Jewitt, G.; Lorentz, S.; Martin, L.; Mchunu, C.N.; Oakes, E.; et al. Rainfall simulation to identify the storm-scale mechanisms of gully bank retreat. Agric. Water Manag. 2022, 98, 1704–1710. [Google Scholar] [CrossRef] [Green Version]
- Chaplot, V. Impact of terrain attributes, parent material and soil types on gully erosion. Geomorphology 2013, 186, 1–11. [Google Scholar] [CrossRef]
- Schulze, R.E. South African Atlas of Agrohydrology and Climatology, TT82/96; Water Research Commission: Pretoria, South Africa, 1997. [Google Scholar]
- King, G.M. An Explanation of the 1:500,000 General Hydrogeological Map; Department of Water Affairs and Forestry: Pretoria, South Africa, 2002.
- ISSS Working Group RB. World Reference Base for Soil Resources. Introduction, 1st ed.; Deckers, J.A., Nachtergaele, F., Eds.; ISSS/ISRIC/FAO; Acco: Leuven, Belgium, 1998. [Google Scholar]
- Haigh, M.J. The use of erosion pins in the study of slope evolution. Br. Geomorphol. Res. Group Tech. Bull. 1977, 18, 31–49. [Google Scholar]
- Janeau, J.L.; Bricquet, J.P.; Planchon, O.; Valentin, C. Soil crusting and infiltration on very steep slopes in northern Thailand. Eur. J. Soil Sci. 2003, 5, 543–553. [Google Scholar] [CrossRef] [Green Version]
- Chaplot, V.; Khampaseuth, X.; Valentin, C.; Le Bisonnais, Y. Sheet erosion in the sloping lands of northern Laos submitted to shifting cultivation. Earth Surf. Processes Landf. 2007, 32, 415–428. [Google Scholar] [CrossRef]
- Poesen, J.; Nachtergaele, J.; Verstraeten, G.; Valentin, C. Gully erosion and environmental change: Importance and research needs. Catena 2003, 50, 91–133. [Google Scholar] [CrossRef]
- Oostwoud Wijdenes, D.J.; Bryan, R.B. Gully-head erosion processes on a semi-arid valley floor in Kenya: A case study into temporal variation and sediment budgeting. Earth Surf. Processes Landf. 2001, 26, 911–933. [Google Scholar] [CrossRef]
- Chaplot, V.; Coadou le Brozec, E.; Silvera, N.; Valentin, C. Spatial and temporal assessment of linear erosion in catchments under sloping lands of Northern Laos. Catena 2005, 63, 167–184. [Google Scholar] [CrossRef]
- IGBP (International Geosphere–Biosphere Programme). Land-Use and Land Cover Change; Science Research Plan: Stockholm, Sweden, 1995; p. 123. [Google Scholar]
- Heimsath, A.M.; Dietrich, W.E.; Nishiizumi, K.; Finkel, R.C. The soil production function and landscape equilibrium. Nature 1997, 388, 358–388. [Google Scholar] [CrossRef]
- Dethier, D.P. Weathering rates and the chemical flux from catchments in the Pacific Northwest, U.S.A. In Rates of Chemical Weathering and Rocks and Minerals; Colman, S.M., Dethier, D.P., Eds.; Academic Press: Orlando, FL, USA, 1986; pp. 503–530. [Google Scholar]
- Chaplot, V.; Rumpel, C.; Valentin, C. Water erosion impact on soil and carbon redistributions within the Mekong basin. Glob. Biogeochem. Cycles 2005, 19, GB4004. [Google Scholar] [CrossRef]
- Polyakov, V.O.; Lal, R. Soil organic matter and CO2 emission as affected by water erosion on field runoff plots. Geoderma 2008, 143, 216–222. [Google Scholar] [CrossRef]
- DiCenzo, P.D.; Luk, S.H. Gully erosion and sediment transport in a small subtropical catchment, South China. Catena 1997, 29, 161–176. [Google Scholar] [CrossRef]
Publisher’s Note: MDPI stays neutral with regard to jurisdictional claims in published maps and institutional affiliations. |
© 2022 by the authors. Licensee MDPI, Basel, Switzerland. This article is an open access article distributed under the terms and conditions of the Creative Commons Attribution (CC BY) license (https://creativecommons.org/licenses/by/4.0/).