Abstract
Urban flooding is a complex natural hazard, driven by the interaction between several parameters related to urban development in a context of climate change, which makes it highly variable in space and time and challenging to predict. In this study, we apply a multivariate analysis method (PCA) and four machine learning algorithms to investigate and map the variability and vulnerability of urban floods in the city of Tangier, northern Morocco. Thirteen parameters that could potentially affect urban flooding were selected and divided into two categories: geo-environmental parameters and socio-economic parameters. PCA processing allowed identifying and classifying six principal components (PCs), totaling 73% of the initial information. The scores of the parameters on the PCs and the spatial distribution of the PCs allow to highlight the interconnection between the topographic properties and urban characteristics (population density and building density) as the main source of variability of flooding, followed by the relationship between the drainage (drainage density and distance to channels) and urban properties. All four machine learning algorithms show excellent performance in predicting urban flood vulnerability (ROC curve > 0.9). The Classifications and Regression Tree and Support Vector Machine models show the best prediction performance (ACC = 91.6%). Urban flood vulnerability maps highlight, on the one hand, low lands with a high drainage density and recent buildings, and on the other, higher, steep-sloping areas with old buildings and a high population density, as areas of high to very-high vulnerability.
1. Introduction
The year of 2021 was marked by a succession of natural disasters, of which urban flooding was a major event in several parts of the world, such as the February floods in North Africa that affected several cities in northern Morocco, the July floods that devastated Western Europe (Germany, France, Switzerland, Belgium, Italy, Netherlands, Romania and United Kingdom) and the flooding caused by Hurricane Ida in New York City in August. These natural disastrous events demonstrate that in the current climate context, in one way or another, all cities are vulnerable to urban flooding, and city dwellers are at high risk, regardless of whether they are in a developed or developing region of the world [1,2,3]. With climate change, these catastrophic events will occur more often in the future, which will have a considerable impact on environments and human life and may result in significant economic damages and losses [4]. The occurrence of urban flooding is also linked to rapid urban development, particularly in developing countries, where uncontrolled growth of urban areas is often accompanied by human encroachment on the active flood channel, changes in drainage networks morphology and low infiltration or storage capacity during heavy rainfall [5,6].
To better understand how floods will evolve in urban areas, we first need to understand the sources of flood variability in response to urban development (demographic, social and economic changes). The variability in flooding in urban areas is largely based on the site, location and social geography properties, such as the location of residential areas, type of structure (single-store building, apartment building, villa area, etc.), location of the land parcel and socio-economic activities [7]. Spatial differences in these characteristics give rise to vulnerabilities to flood threats as well as variations in resilience or the ability to respond and recover from them [8]. Moreover, identifying the sources of spatial variability of urban flooding is crucial for the choice of the optimal flood defense strategy and to provide a more efficient and effective spatial planning policy [9,10]. Yet, the variability in conditions that influence flood vulnerability in different urban areas has not been comprehensively examined.
The production of urban flood-vulnerability maps and subsequently the prediction of flood-prone areas is another aspect of flood risk assessment, as it has become crucial for urban management and planning, especially for reducing flood damage. The effectiveness of urban flood-vulnerability assessment and mapping depends strongly on the methodology adopted for modelling [11]. Several physical models for flood-risk mapping have been widely used to assess and predict flood risk in urban areas and have proven to be successful, such as the Hydrologic Engineering Center—River Analysis System (HEC-RAS) [12] and AutoRoute [13]. However, running most hydrological models requires detailed spatial and temporal data (e.g., precipitation and base flows), which are often not easily available. In addition, these models also require considerable setup and computation time, especially for high-resolution river networks [6,14]. In recent years, machine learning methods, such as support vector machine (SVM) [15,16], decision trees [17], logistic regression [18,19] and linear discriminate analysis (LDA) [20,21], have been widely used for spatial prediction, vulnerability and susceptibility mapping of natural hazards, given their ability to adapt and apply in data-scarce environments, especially in developing countries where data availability remains a major challenge. Moreover, these machine learning methods have demonstrated better performance when compared to classical models, offering a great advantage to the decision-maker in identifying and mapping with great accuracy the areas of high vulnerability and susceptibility. However, the application of machine learning in urban flood hazard mapping is very limited, because it is a complex process and unlike other types of natural hazards, it is influenced by specific factors such as community conditions, the policy of urban authorities, infrastructure quality and settlement conditions. These factors vary based on location, societal culture, human activities and environmental characteristics [6,7,22].
The objective of this work is to apply and combine various mathematical approaches to study the variability and vulnerability of urban flooding in Tangier city, northern Morocco. A large number of parameters are used to characterize the topographical properties, drainage network characteristics, land use and urban properties of the study area. The independent sources of urban flood variability are investigated and mapped using principal component analysis (PCA), which concentrates the information into a reduced number of macro-parameters, namely, the principal components. Urban flood vulnerability mapping was produced by linear discriminant analysis (LDA), logistic regression (LR), classification and regression tree (CART) and support vector machines (SVM). The accuracy and performance of the four models were evaluated and compared using statistical validation indexes. To the best of our knowledge, the problem of urban flood-vulnerability mapping has not been explored in the context of these machine learning methods before.
2. Materials and Methods
2.1. Study Area
Tangier is a city in the northwest of Morocco (between the parallels 35°47′ north and meridian 5°48′ west of Greenwich) (Figure 1), the second largest economical city of the country, and the capital of the Tangier-Tetouan Al Hoceïma region. Located at the entrance of the Mediterranean Sea on the Strait of Gibraltar, the city is 15 km from the Spanish coast. It has a population of 1,065,601 habitants according to the latest census in 2015. The topography shows large areas dominated by hills where the altitude does not exceed 400 m, dissected by small rivers forming slightly deep valleys. Tangier’s climate is Mediterranean, tempered by the oceanic influence, with annual precipitation between 600 and 1000 mm per year. The average annual temperature is 17.5 °C and the average annual evapotranspiration is 450 mm. The city is often subject to weather disturbances: from mid-October to early May, strong winds, violent storms and heavy rainfall. In summer, a hot wind from the Saharan influence, commonly known as “chergui” in Morocco, raises the temperature considerably.
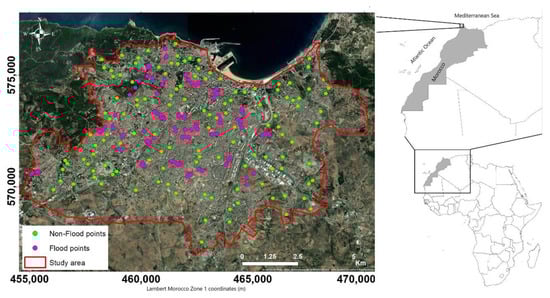
Figure 1.
Location of the study area and distribution of flood and non-flood points.
In recent years, Tangier city has been affected by several floods, which have caused extensive damage to the city and its infrastructure. The most recent and perhaps the most devastating flood the city has experienced was on 8 February 2021, where 28 people have died after torrential rains. Most of the victims were women who were working in an illegal underground textile factory, located in the basement of a house. This incident highlighted the impact of uncontrolled socio-economic and urban development in one of the country’s economic hubs on the increase in areas at high risk of flooding. Flood images from 2018 to 2021 in different parts of the city are presented in Figure 2.
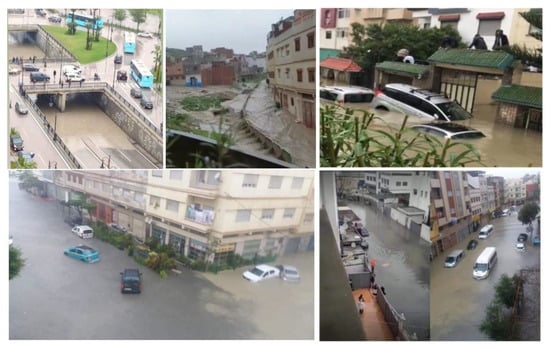
Figure 2.
Flooding in Tangier city (2018–2021).
2.2. Urban Flood Inventory Map
In this study, a flood inventory map between 2018 and 2021 was prepared based on several sources of information (Figure 1), particularly from available documents and reports (historical flood database) obtained from the Tangier City Authority and multiple field surveys. We also used information on flooding events published on social media (Facebook and Tweeter). This latter approach, called “social media crowdsourcing”, is an additional and novel source of data that has proven to be effective and complementary for the rapid assessment of natural hazards and for providing information on user-observed damage levels and their geospatial location [23,24,25,26,27,28,29]. A total of 126 points were identified as flood locations, while 126 non-flooded points were randomly chosen in non-flooded zones. In order to develop the urban flood vulnerability map, flooded and non-flooded areas were assigned a code of 1 and 0, respectively.
2.3. Parameter Selection
Given the great complexity of urban flooding, there are currently no conventional guidelines for selecting the factors that influence urban flooding. However, using remote sensing and GIS techniques as well as information from previous studies and data available in the study area, 9 geo-environmental factors and 4 socio-environmental factors effective to urban flooding were identified.
2.3.1. Geo-Environmental Factors
Elevation: In order to generate high-resolution elevation data over the city of Tangier, we used the Sentinel 1 radar images based on synthetic aperture radar interferometry (InSAR). The accuracy of INSAR-DEMs can be significantly offset from conventional DEMs such as SRTM products. Several studies have found that INSAR-DEMs are suitable for plain and lowland regions such as our study area, but are not recommended for mountainous regions [30,31,32]. This technique uses the phase difference between two complex SAR images taken from slightly different positions of the sensor and which must meet certain conditions (the date of acquisition must be close; it is also preferable to have images in the summer period to ensure obtaining the minimum vegetation cover; and a minimum baseline of 200 m). Once the phases of the two images are combined and co-registered, an interferogram can be generated with a phase strongly correlated to the terrain topography, using a 30-m-resolution SRTEM DEM. Following these procedures, a digital elevation model (DEM) of the study area (Figure 3a) was generated with a resolution of 12.5 m using a pair of Sentinel 1 images taken on 3 August 2021 and 9 August 2021. After verification and validation with the 1:100,000 topographic maps, this DEM was used to produce all the terrain properties maps used in our study.
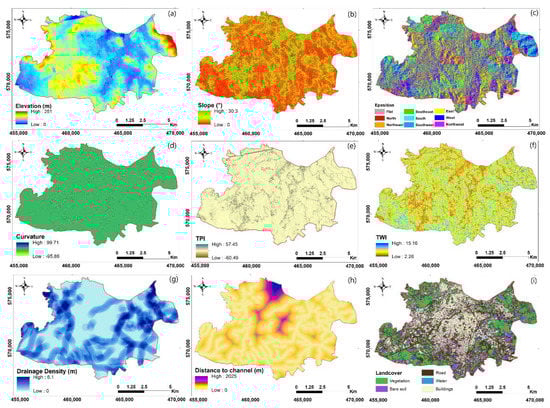
Figure 3.
Map of the geo-environmental factors of the study area: (a) elevation; (b) slope; (c) exposition; (d) curvature; (e) TPI; (f) TWI; (g) drainage density; (h) distance from channel; (i) land cover.
Slope: Flooding is directly related to slope gradient, an important physiographic feature. Slope directly contributes to surface runoff velocity and vertical percolation and thus affects vulnerability to floods. The slope map was determined using GIS tools that calculate for each cell the maximum rate of change in elevation values relative to its neighbors (Figure 3b) [33].
Exposition: This parameter is defined as the direction of maximum slope of the land surface (Figure 3c). It indirectly affects floods because it controls microclimate, sun exposure time, moisture retention, evapotranspiration, weathering, vegetation cover and denudation processes.
Curvature: It is a factor of runoff and can be useful in detecting susceptibility to flooding and its occurrence, because the flow of water depends on the curvature of the land surface. Curvature is divided into three categories: concave surface, convex surface and flat surface (Figure 3d).
Topographic Position Index (TPI): It indicates the upper and lower parts of a landscape, i.e., the difference in elevation in each cell with the average elevation of the surrounding cells (Figure 3e). Positive values indicate places that are higher than their surroundings (ridges), while negative values indicate places that are lower than the surrounding cells (valleys).
Topographic Wetness Index (TWI): This index shows the amount of water accumulation in any pixel size of the watershed area (Figure 3f). In other words, it provides the effect of topography on the spatial distribution and zonation of saturation sources to generate runoff. TWI is also present as the power of the surface runoff, such as flow rate, flow velocity, transport capacity and potential flow.
Drainage Density: It represents the number or frequency of rivers and streams per unit area (Figure 3g). Drainage density indicates the permeability of the soil surface and the rate of infiltration, thus controlling the intensity of the surface runoff, which is directly related to flooding. In this work, the drainage density was calculated from the drainage network of the study area using the line density tool of the GIS software.
Distance to channel: It determines the dominant role of the dense river network in the occurrence of floods. It represents the distance of a flood location from the drainage channels (Figure 3h). The distance to rivers was calculated from the drainage network using the Euclidean Distance tool on the GIS software.
Land cover: It is a factor that greatly influences several types of natural hazards and particularly floods [34,35]. The land cover map of Tangier was obtained from a supervised classification by the Maximum Likelihood method applied on the Sentinel-2B optical satellite image with a resolution of 10 m, covering the study area and acquired on 22 March 2021. The Sentinel 2-B image was pre-processed to quantify significant information from the remote sensing data. Three types of correction were applied: geometric, radiometric and atmospheric. The Maximum Likelihood method is based on the theory of probability, which assumes that, when training data, the statistics of the training for each class in each band are Gaussian distributed. It assigns a pixel to a class if the estimated probability function for the class is maximum [36]. The output land cover map contains five classes: vegetation, buildings, roads, water and bare soil (Figure 3i).
2.3.2. Socio-Environmental Factors
There are various socio-environmental factors that influence vulnerability to flooding in urban areas and their consideration may depend on the data available. In this study, data on four factors related to urbanization in the city of Tangier were obtained from the report of the Tangier-Tetouan-Al Houceima Regional Directorate of the High Commission for Planning of the Kingdom of Morocco: building density, population density, building type and buildings state [37].
Building density: The building density of Tangier city was subdivided into four classes (very low, low, medium and high) (Figure 4a). Population density: The population density of the city of Tangier was subdivided into four classes (low, medium, high and very high) (Figure 4b). Buildings type: Seven types of building areas were identified in the city of Tangier: apartments, industrial zone, natural reserve, house, villas, building zone and projected zone (Figure 4c). Building state: The buildings in the city of Tangier were divided into three classes: recent (building completed for more than six years at least and fifteen years at most), old (building that has been completed for more than fifteen years (>15 years)) and ‘other’, which are buildings whose condition has not been defined (Figure 4d).
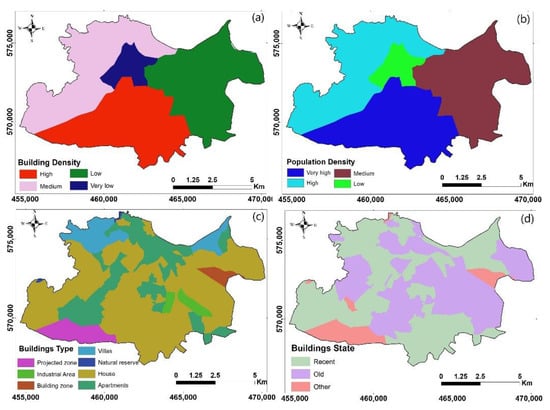
Figure 4.
Map of the socio-environmental factors in the study area: (a) building density; (b) population density; (c) building type; and (d) building state.
2.4. Data Analysis and Modelling
Several mathematical and statistical methods were combined for the analysis and modelling of urban flood variability and vulnerability in the city of Tangier. All of these methods defined below represent the state-of-the-art methods widely used in several fields of research, but their applications for monitoring and managing the risk of urban flooding is to our knowledge still limited.
2.4.1. Principal Components Analysis
Principal component analysis (PCA) was performed by diagonalization of the correlation matrix from the urban flood database (126 flood points × 13 variables), in order to reduce the volume of redundant information; to identify, quantify and rank the different independent sources of variability; and to explore the underlying processes responsible for the variability in urban flooding [38]. The PCA treatment makes it possible to discern the relationships between the different parameters and to rank the independent sources of variability of the information contained in the urban flood database. The procedure includes the variables’ mean cantering, thus sidestepping problems arising from the variable numerical ranges and units used by automatically autoscaling all variables to the mean zero and variance unit.
2.4.2. Flood Vulnerability Prediction
Urban flood prediction was done using the flood and non-flood locations (as the dependent variable) and 13 predictor variables shown as independent variables and input data. We used four machine learning models, namely, linear discriminant analysis (LDA), logistic regression (LR), classification and regression tree (CART), and support vector machine (SVM) for urban flood vulnerability modelling. The dataset was divided into training and validation data (80% for training and 20% for validation). The models used are described as follows:
Linear Discriminant Analysis (LDA)
Linear discriminant analysis is a conventionally and widely used tool to study groups of observations that may have different characteristics [39]. Linear discriminant analysis (LDA) is a linear algebra method frequently used in statistics, dimensionality reduction and machine learning to discriminate multiple sets characterized by multiple parameters in a data set. It is based on the looking for variables in a linear combination, called discriminant functions, to ensure the best distinction between the classes and to reduce the dimensionality between before and after the classification. LDA has shown very good performance for classification and modelling in several hydrological studies [38,40,41,42].
Logistic Regression (LR)
Logistic regression is a statistical model that can describe the relationship between the probability of a binary response variable and a set of corresponding explanatory variables. It is a generalized linear model using a logistic function as a link function [18,43]. In this study the logistic regression model has been used to predict the probability of an urban flood occurring (value = 1) or not (value = 0) based on the optimization of the regression coefficients. This result always varies between 0 and 1. When the predicted value is above a threshold, the event is likely to occur, while when the predicted value is below the same threshold, it is not.
Classification and Regression Tree (CART)
Classification and regression tree is an effective decision tree based method, which has proven to be a powerful technique for handling classification problems. The CART generates a sequence of sub-trees for classification problems by growing a large tree instead of using stopping rules. Therefore, it is able to construct complex trees for solving complicated problems with large dataset [18]. CART has been widely used in many studies of natural hazards such as landslides and subsidence [16,17,18]. However, in this study it will be applied for the first time to the prediction of urban flooding. The application of CART for urban flooding follows a four-step procedure: 1—building the tree; 2—stopping the building of the tree; 3—pruning the tree; and 4—selecting the optimal tree for classifying landslide or no landslide classes [16,44].
Support Vector Machine (SVM)
SVM has proven to be very successful in natural hazard modelling, showing a very good performance in identifying risk areas compared to several other machine learning methods [16,42,45,46,47,48]. The SVM method is based on nonlinear transformations that uses a classification based on the principle of structural risk minimization [46]. Its objective is to find an optimal hyperplane (or a decision boundary) in an N-dimensional space (where N is the number of variables) that distinctly classifies flooding and non-flooding points. This optimal hyperplane should maximize the distance between the data closest to the hyperplane. Thus, the SVM algorithm aims to determine a multi-dimensional hyperplane that maximizes the margin around the separating hyperplane, essentially making it a constrained optimization problem [49]. The support vectors in the SVM are the data points that lie closest to the hyperplane and they represent the selection criteria as the best boundaries for the classification of flooding and non-flooding locations with a larger margin [50].
2.4.3. Repeated Hold-Out Validation
Validation techniques are valuable tools used in predictive modelling and machine learning to assess the consistency of results [51]. Even when prediction, variable selection or model selection are not the focus, validation can help to assess the generalizability and reliability of results. The Hold-Out method is the most widely used technique in the validation of machine learning models [52,53]. It is based on dividing the database into two non-overlapping parts and these two parts are used for training and testing respectively [54]. In this study, we proposed to use the Repeated Hold-Out method, which is an iteration of the Hold-Out method; i.e., it is the repeated execution of the Hold-Out method [55]. We randomly partitioned for 10 times the data into 80% for training and 20% for testing. For each split, the four machine learning methods are trained on the training set and validated on the testing. The average performance for each model is then computed using the arithmetic mean Equation (1):
where represents the average value of a performance metric, which can be the total accuracy of the model or other metric; K is the number of splits (where K = 10); and Pi is the result of the performance metric of each split.
2.4.4. Performance Metrics and Evaluation Criteria
To ensure a proper evaluation of the modelling performance of the four machine learning models, we used four types of classification results provided by the confusion matrix (Table 1), namely, Accuracy (ACC; Equation (2)), Sensitivity (SST; Equation (3)), Specificity (SPF; Equation (4)) and Precision (PRC; Equation (4)) [49]. In general, higher values of the ACC, SST, SPF and PRC show better performance of the models. Evaluation of the models was also done using the Receiver Operating Characteristic (ROC) curve statistic, which is the most popular criterion for evaluating spatial modelling performance [56]. The ROC curve value represents the probability that a test point is accurately differentiated from a random point in the predetermined context of the study area. For a ROC curve of 0.5–0.6, 0.6–0.7, 0.7–0.8, 0.8–0.9 and 0.9–1, the models are classified, respectively, as poor, medium, good, very good and excellent.

Table 1.
Confusion matrix of a binary classification.
3. Results and Discussion
3.1. Source of Urban Flood Variability
Principal components furnish the macro-parameters, i.e., synthetic data that convey strong and significant information and, therefore, are particularly suitable and relevant for time monitoring or digital mapping and spatial analysis, just like original parameters [39]. However, it should be noted that the mapping of the sources of variability does not cover the entire study area, since the limit of the interpolation is given by the coverage of the identified flood points.
The first six principal components accounted for 73% of the information, and PC1 to PC5 have eigenvalues greater than 1 (Table 2), meaning that they concentrate more information than one single variable. Figure 5 shows the correlation values of the parameters with each principal component. The correlation scores of the observations along the principal components were used for the mapping of the main sources of variability in urban floods identified in the study area (Figure 6).
Table 2.
Eigenvalues and percentage of explained variance by the first principal components. Only PC1 to PC6 are taken into account in this study.
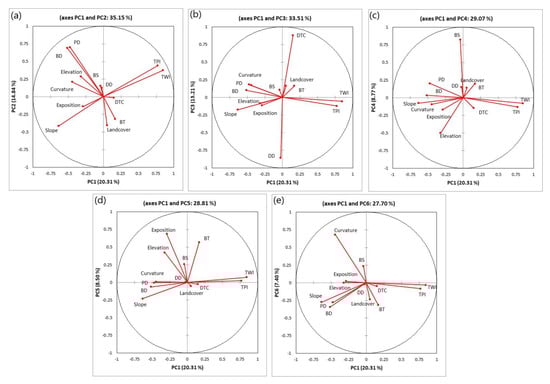
Figure 5.
Distribution of parameters on (a) PC1 and PC2 axes, (b) PC1 and PC3 axes, (c) PC1 and PC4 axes, (d) PC1 and PC5 axes, and (e) PC1 and PC6 axes.
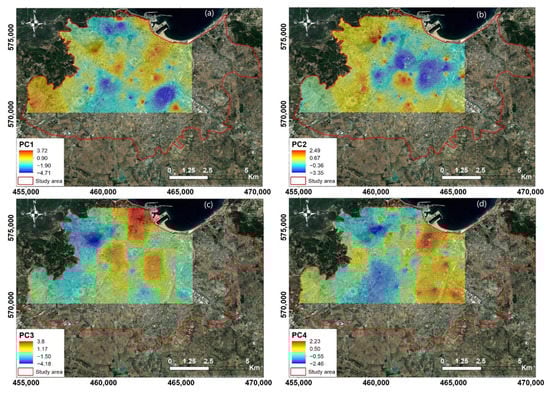
Figure 6.
Distribution of the first six principal components (a) PC1, (b) PC2, (c) PC3, (d) PC4, (e) PC5 and (f) PC6 in the part of the city of Tangier covered by the flooding points.
The first principal component, PC1, stood out clearly from the other axes. It alone accounted for 20.3% of the total variance (Table 2). It shows positive correlations with TPI and TWI and negative correlations with slope, population density and building density (Figure 5a). On the spatial distribution map (Figure 6a), the high and positive values (orange-red color) correspond to high values of TPI and TWI, reflecting areas where flooding occurs in higher areas with high drainage capacity [57,58,59]. The negative values (cyan and blue color) represent areas where flooding is associated with high slopes as well as high population and building densities. PC1 can thus be conceded as an axis representing the influence of terrain properties and population distribution on urban flood variability. The second principal component (PC2: 14.8% of variability) shows very high and positive correlations with population density and building density (Figure 5a). PC2 represents the axis of unique control of urban properties on urban flood variability. Thus, high values of the PC2 spatial distribution map represent areas where flooding is related to high population density and high urban density (Figure 6b).
The third principal component, PC3 (13.2% of the variability), shows positive correlations with distance to the river and negative correlations with drainage density (Figure 5b). It thus reflects the influence of the drainage network properties that cross the city on urban flooding variability. PC3 indicates that the location in areas of short distances to rivers and drainage channels is an important factor that explain a large part of urban flood variability; these areas are represented by the negative values of PC3 (cyan-blue color) (Figure 6c). The fourth principal component, PC4 (8.8% of the variability), shows a high and positive correlation with the building stat parameter and a negative correlation with the altitude (Figure 5d). The distribution of PC4 shows that the positive and high values (orange-red color) represent areas where the occurrence of flooding is associated with lowland areas and newly constructed buildings, while the negative values (cyan-blue color) represent areas where the occurrence of flooding is associated with high elevations and older buildings (Figure 6d).
These situations highlighted by PC3 and PC4 are clear representations of how the increase in the urban population is forcing the existing resources and infrastructures to be more and more solicited, leading people to constantly occupy lowland and flood-prone areas, narrowing the channel and, thus, reducing the channel carrying capacity [1,5,60].
The fifth principal component, PC5 (8.5% of the variability), shows high correlations with the exposition parameter, the building type and elevation (Figure 5d). High PC5 values, located mainly in the south and southwest, represent on the one hand areas with high elevation and high exposition values that reflect slope orientations to the west, south-west and north-west towards the Atlantic Ocean, where the humid maritime influences responsible for the major precipitation in Morocco come from (Figure 6e). On the other hand, it represents high values of building type, representing areas of apartment buildings and houses agglomeration and thus expressing a high population density (Figure 6e). The sixth principal component, PC6 (7.4% of the variability), shows a high and positive correlation with the curvature parameter (Figure 5e). In other words, the concave or convex shape of the surface has an influence on the flood variability. The high and positive values of PC6 indicate areas where flooding occurs on concave upward surfaces with accelerated flow (Figure 6f).
The analysis of the first six principal components and their spatial distribution emphasize the impact of the relationship between topographic properties, population distribution, building density, stat and type, and the drainage network properties on the variability in urban flooding. These findings have been widely observed in developing countries, where human encroachment on the active flood channel, poor flood management strategies and sustainable urban management (Figure 7a), lack of early warning systems and disposal of solid waste in drainage channels are the main causes of urban flooding [1,61]. This analysis demonstrates that a proper design and maintenance of drainage systems (Figure 7b) and an appropriate distribution of urban residents are essential for reducing flood damage and for sustainable urban management.
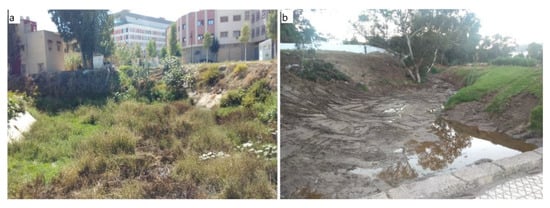
Figure 7.
(a) Drainage channel not maintained or cleaned, (b) and drainage channel maintained and cleaned before the start of the rainy season (September 2021) in the city of Tangier.
3.2. Model Validation for Flood Vulnerability Prediction
Results of urban flood model validation using statistical analysis methods for the training dataset and testing dataset are shown in Table 3 and Table 4, respectively. It is observed that the statistical indexes (Accuracy, Specificity, Sensitivity and Precision) of the CART model for training dataset (92–95%) are higher than those of other urban flood models (SVM, DA and LR) (Table 3). In the testing dataset, CART and SVM shows the highest value of Accuracy (90.61%) (Table 4). However, the CART model shows the highest sensitivity (95.67%), while the SVM model shows the highest specificity and precision values (respectively, 88.01% and 89.34%). The ROC curve statistic indicates that the four models have excellent performance (0.887–0.962). However, the CART model has the highest value (0.962 for the training dataset and 0.945 for the testing dataset), followed by the SVM model (0.912 for the training dataset and 0.930 for the testing dataset), the LR model (0.929 for the training dataset and 0.89 for the testing dataset), and the LDA model (0.91 for the training dataset and 0.887 for the testing dataset). Results shows that the CART model has the best predictive capability for spatial urban flood prediction, followed by the SVM model, the LR model and the DA model, respectively.
Table 3.
Predictive capability of urban flood models using the training dataset.
Table 4.
Predictive capability of urban flood models using the testing dataset.
The four models used in this study have never been applied before in urban flood prediction, and therefore it was not possible to make a comparison with previous studies. However, in other areas of natural hazard assessment (landslide, snow avalanche and rural flooding), applications of CART, SVM, LR and LDA have recently been compared in the literature [16,42,47], and the results showed that all these models present good performances in the prediction of risk vulnerability and susceptibility (AUC > 0.85). Furthermore, these studies point out that no given conventional model presents better results, these depending on the studied phenomenon, the quality of the data and the number of descriptive parameters.
3.3. Urban Flood Vulnerability Mapping
The mathematical basis and structure of modelling methods vary significantly, often leading to different results and predictive performance. For this reason, comparative studies are essential to evaluate the performance of the models under the same conditions and to make an adequate judgment on their capabilities. It is also important to recognize that the application of different predictive models allows policy makers to develop effective plans [16,17,18].
The urban flood-vulnerability maps produced by the four models (Figure 8) illustrate the probability of flooding in the study area. The flood risk maps were classified into four classes: low (0–0.25), medium (0.25–0.5), high (0.5–0.75) and very high (0.75–1). As shown in the figure, all four modelling approaches display the same pattern of flood vulnerability prediction. They also showed that the areas with high and very-high vulnerability of flooding are mainly located in the center, east, southeast and southwest associated with lowland areas, high density of drainage channels and recent buildings (Figure 9a,b). Other high-risk flooding areas are located in the west and northwest associated with areas of high altitude and slope with old buildings and high population density (Figure 9c–e). However, the spatial detail of each model differs. In fact, the CART model showed the highest estimate of areas at very high risk of flooding, which is equal to 19% of the total area of Tangier city, the SVM model estimated 6.4%, while the LR model and DA model both estimated 10.6%. In addition, the CART model delineated the high vulnerability areas more clearly and consistently than the other models, due to its very high sensitivity value (SST = 95%).
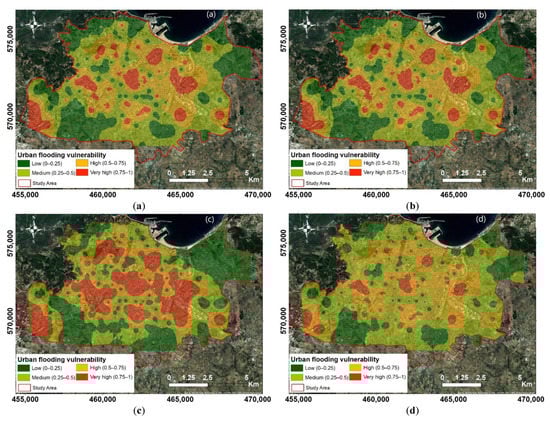
Figure 8.
Urban flooding vulnerability map obtained from (a) linear discriminant analysis (LDA); (b) logistic regression (LR); (c) classification and regression tree (CART); (d) Support vector machine (SVM).
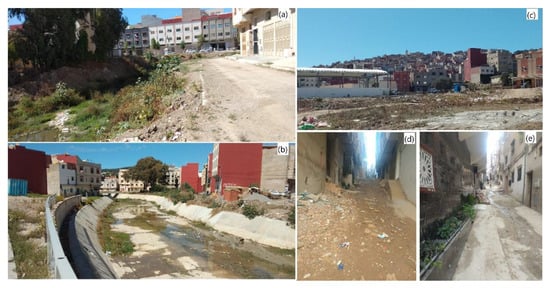
Figure 9.
Example of areas in Tangier city identified by all four models as being at very-high vulnerability of flooding: (a,b) associated with short distance to the channel, high drainage density and recent buildings; (c–e) associated with steep slopes, high density of old buildings and high population density.
The results of flood vulnerability prediction show that proximity to rivers and main drainage channels as well as population and urban density are factors that increase the risk of flooding in Tangier city. Recent studies on vulnerability and flood risk have reached the same conclusions [1,6], and have suggested that restoration of worn urban texture, decentralization of the population in high vulnerability areas, protection of riverbank areas and enactment of supportive laws in areas of high social vulnerability can be preventive actions towards damage reduction.
4. Conclusions
This study applies and combines various mathematical approaches to study the variability and vulnerability of urban flooding in Tangier city, northern Morocco. The treatment through principal component analysis (PCA) made it possible to synthesize the information carried by different parameters into single macro-parameters. In the case treated, the initial 13D hyperspace was reduced to 6D with a loss of the order of 27% of the information, including the statistical noise that is inherent in any database. This treatment also makes it possible to separate these independent sources of variability, and thus the information conveyed by the flooding occurrence in Tangier city; it also becomes easy to draw synthetic maps of their distribution according to the main components. The analysis and interpretation of the information contained in each source of variability highlights the interconnection between the topographical properties and the urban properties (population density and building density) of Tangier city as the major factor controlling the occurrence of urban flooding, followed by a second factor that represents the relationship between drainage properties (drainage density and distance to channels) and urban properties.
The machine learning results indicate that LDA, LR, CART and SVM models have an excellent performance in predicting urban flood vulnerability (ROC curve > 0.9), which confirms that data mining methods can be applied to urban flood forecasting without expensive or complex hydrodynamic modelling. However, our analysis is limited to providing information on levels of vulnerability and does not provide information on either the actual level of risk or the extent of possible flood risk, as it cannot provide or generate such data. The CART and SVM models showed the highest accuracy on the testing dataset (ACC = 91.6%) followed by the LDA model (ACC = 87.76%) and then the LR model (86.33%). However, the CART model showed the highest estimate of areas at very-high vulnerability of flooding (19% of the total area of Tangier city) due to its high sensitivity (SST = 95%). On the four urban flood-vulnerability maps, the high and very-high vulnerability areas are associated with lowland areas, high drainage density, recent buildings, areas of high altitude and slope with old buildings and high population density.
The results of this study should support the spatial decision making of the relevant authorities and decision makers to formulate policies related to urban flood risk reduction through sustainable urban management. The results should also be used for initial studies of the areas likely to be impacted by fluvial flooding and to determine areas where more detailed analyses should be carried out, including hydrodynamic modelling to characterize the flow conditions, mainly its depth and speed.
However, the reduction of the vulnerability of goods and people to flood risk should not be systematically synonymous with the immobilization of territories subject to risk, but should rather consist in controlling the urbanization of the most exposed areas, while allowing the urban and economic development of already urbanized areas or least-exposed areas. The methodology used in this research could also be applied to other urban areas to support the management, control and reduction of damage in flood-prone urban areas.
Author Contributions
Conceptualization, T.B. (Tarik Bouramtane) and I.K.; methodology, S.A., K.B. and V.V.; software, T.B. (Tarik Bouramtane), V.V. and M.A.; validation, M.L., L.B. and I.K.; formal analysis, V.V., N.K. and O.E.B.; investigation, M.A., M.M., T.B. (Tarik Bahaj); resources, T.B. (Tarik Bouramtane), M.A. and K.O.; data curation, T.B. (Tarik Bouramtane), M.A. and K.O.; writing—original draft preparation, T.B. (Tarik Bouramtane); writing—review and editing, T.B. (Tarik Bouramtane), S.A. and L.B.; visualization, S.Y.; supervision, V.V. and I.K.; project administration, I.K.; funding acquisition, S.A. All authors have read and agreed to the published version of the manuscript.
Funding
This research was partially funded by W.M. Keck Foundation through the Undergraduate Education Grant Program.
Institutional Review Board Statement
Not applicable.
Data Availability Statement
Data are available on request.
Acknowledgments
This work was carried out at the Geosciences, Water and Environment Laboratory of the Faculty of Sciences of Mohammed V University in Rabat in collaboration with the UMR EMMAH Hydrogeology Laboratory of the University of Avignon and with the support of the Electrical and Computer Engineering Department of Seattle University.
Conflicts of Interest
The authors declare no conflict of interest.
References
- Parvin, G.A.; Shaw, R.; Surjan, A. 3-Cities, Vulnerability, and Climate Change. In Urban Disasters and Resilience in Asia; Shaw, R., Surjan, A., Parvin, G.A., Eds.; Butterworth-Heinemann: Oxford, UK, 2016; pp. 35–47. ISBN 978-0-12-802169-9. [Google Scholar]
- Eldho, T.I.; Zope, P.E.; Kulkarni, A.T. Chapter 12-Urban Flood Management in Coastal Regions Using Numerical Simulation and Geographic Information System. In Integrating Disaster Science and Management; Samui, P., Kim, D., Ghosh, C., Eds.; Elsevier: Amsterdam, The Netherlands, 2018; pp. 205–219. ISBN 978-0-12-812056-9. [Google Scholar]
- Sarma, J.; Rajkhowa, S. Urban Floods and Mitigation by Applying Ecological and Ecosystem Engineering. In Handbook of Ecological and Ecosystem Engineering; John Wiley & Sons, Ltd.: Hoboken, NJ, USA, 2021; pp. 201–218. ISBN 9781119678595. [Google Scholar]
- Hossain, M.K.; Meng, Q. A fine-scale spatial analytics of the assessment and mapping of buildings and population at different risk levels of urban flood. Land Use Policy 2020, 99, 104829. [Google Scholar] [CrossRef]
- Rahman, A.; Shaw, R.; Surjan, A.; Parvin, G.A. 1-Urban Disasters and Approaches to Resilience. In Urban Disasters and Resilience in Asia; Shaw, R., Surjan, A., Parvin, G.A., Eds.; Butterworth-Heinemann: Oxford, UK, 2016; pp. 1–19. ISBN 978-0-12-802169-9. [Google Scholar]
- Eini, M.; Kaboli, H.S.; Rashidian, M.; Hedayat, H. Hazard and vulnerability in urban flood risk mapping: Machine learning techniques and considering the role of urban districts. Int. J. Disaster Risk Reduct. 2020, 50, 101687. [Google Scholar] [CrossRef]
- Ahmad, S.S.; Simonovic, S.P. Spatial and temporal analysis of urban flood risk assessment. Urban Water J. 2013, 10, 26–49. [Google Scholar] [CrossRef]
- Borden, K.A.; Schmidtlein, M.C.; Emrich, C.T.; Piegorsch, W.W.; Cutter, S.L. Vulnerability of U.S. Cities to Environmental Hazards. J. Homel. Secur. Emerg. Manag. 2007, 4. [Google Scholar] [CrossRef]
- Solín, L’. Spatial variability in the flood vulnerability of urban areas in the headwater basins of Slovakia. J. Flood Risk Manag. 2012, 5, 303–320. [Google Scholar] [CrossRef]
- Löschner, L.; Nordbeck, R. Switzerland’s transition from flood defence to flood-adapted land use–A policy coordination perspective. Land Use Policy 2020, 95, 103873. [Google Scholar] [CrossRef]
- Ayalew, L.; Yamagishi, H. The application of GIS-based logistic regression for landslide susceptibility mapping in the Kakuda-Yahiko Mountains, Central Japan. Geomorphology 2005, 65, 15–31. [Google Scholar] [CrossRef]
- Brunner, G.W.; Piper, S.S.; Jensen, M.R.; Chacon, B. Combined 1D and 2D Hydraulic Modeling within HEC-RAS. In Proceedings of the World Environmental and Water Resources Congress 2015, Austin, TX, USA, 17–21 May 2015; pp. 1432–1443. [Google Scholar]
- Follum, M.L.; Tavakoly, A.A.; Niemann, J.D.; Snow, A.D. AutoRAPID: A Model for Prompt Streamflow Estimation and Flood Inundation Mapping over Regional to Continental Extents. JAWRA J. Am. Water Resour. Assoc. 2017, 53, 280–299. [Google Scholar] [CrossRef]
- Afshari, S.; Tavakoly, A.A.; Rajib, M.A.; Zheng, X.; Follum, M.L.; Omranian, E.; Fekete, B.M. Comparison of new generation low-complexity flood inundation mapping tools with a hydrodynamic model. J. Hydrol. 2018, 556, 539–556. [Google Scholar] [CrossRef]
- Kalantar, B.; Pradhan, B.; Naghibi, S.A.; Motevalli, A.; Mansor, S. Assessment of the effects of training data selection on the landslide susceptibility mapping: A comparison between support vector machine (SVM), logistic regression (LR) and artificial neural networks (ANN). Geomat. Nat. Hazards Risk 2018, 9, 49–69. [Google Scholar] [CrossRef]
- Pham, B.T.; Prakash, I.; Tien Bui, D. Spatial prediction of landslides using a hybrid machine learning approach based on Random Subspace and Classification and Regression Trees. Geomorphology 2018, 303, 256–270. [Google Scholar] [CrossRef]
- Rahmati, O.; Falah, F.; Naghibi, S.A.; Biggs, T.; Soltani, M.; Deo, R.C.; Cerdà, A.; Mohammadi, F.; Tien Bui, D. Land subsidence modelling using tree-based machine learning algorithms. Sci. Total Environ. 2019, 672, 239–252. [Google Scholar] [CrossRef]
- Felicísimo, Á.M.; Cuartero, A.; Remondo, J.; Quirós, E. Mapping landslide susceptibility with logistic regression, multiple adaptive regression splines, classification and regression trees, and maximum entropy methods: A comparative study. Landslides 2013, 10, 175–189. [Google Scholar] [CrossRef]
- Gholamnia, K.; Gudiyangada Nachappa, T.; Ghorbanzadeh, O.; Blaschke, T. Comparisons of Diverse Machine Learning Approaches for Wildfire Susceptibility Mapping. Symmetry 2020, 12, 604. [Google Scholar] [CrossRef] [Green Version]
- Hong, H.; Naghibi, S.A.; Moradi Dashtpagerdi, M.; Pourghasemi, H.R.; Chen, W. A comparative assessment between linear and quadratic discriminant analyses (LDA-QDA) with frequency ratio and weights-of-evidence models for forest fire susceptibility mapping in China. Arab. J. Geosci. 2017, 10, 167. [Google Scholar] [CrossRef]
- Dereli, T.; Eligüzel, N.; Çetinkaya, C. Content analyses of the international federation of red cross and red crescent societies (ifrc) based on machine learning techniques through twitter. Nat. Hazards 2021, 106, 2025–2045. [Google Scholar] [CrossRef]
- Berndtsson, R.; Becker, P.; Persson, A.; Aspegren, H.; Haghighatafshar, S.; Jönsson, K.; Larsson, R.; Mobini, S.; Mottaghi, M.; Nilsson, J.; et al. Drivers of changing urban flood risk: A framework for action. J. Environ. Manag. 2019, 240, 47–56. [Google Scholar] [CrossRef]
- Simon, T.; Goldberg, A.; Adini, B. Socializing in emergencies—A review of the use of social media in emergency situations. Int. J. Inf. Manag. 2015, 35, 609–619. [Google Scholar] [CrossRef] [Green Version]
- Resch, B.; Usländer, F.; Havas, C. Combining machine-learning topic models and spatiotemporal analysis of social media data for disaster footprint and damage assessment. Cartogr. Geogr. Inf. Sci. 2018, 45, 362–376. [Google Scholar] [CrossRef] [Green Version]
- Wu, D.; Cui, Y. Disaster early warning and damage assessment analysis using social media data and geo-location information. Decis. Support Syst. 2018, 111, 48–59. [Google Scholar] [CrossRef]
- Li, L.; Bensi, M.; Cui, Q.; Baecher, G.B.; Huang, Y. Social media crowdsourcing for rapid damage assessment following a sudden-onset natural hazard event. Int. J. Inf. Manag. 2021, 60, 102378. [Google Scholar] [CrossRef]
- Xu, Z.; Zhang, H.; Hu, C.; Liu, Y.; Xuan, J.; Mei, L. Crowdsourcing-based timeline description of urban emergency events using social media. Int. J. Ad Hoc Ubiquitous Comput. 2017, 25, 41–51. [Google Scholar] [CrossRef]
- Ma, J.; Sengupta, M.K.; Yuan, D.; Dasgupta, P.K. Speciation and detection of arsenic in aqueous samples: A review of recent progress in non-atomic spectrometric methods. Anal. Chim. Acta 2014, 831, 1–23. [Google Scholar] [CrossRef]
- Faxi, Y.; Rui, L. Mining Social Media Data for Rapid Damage Assessment during Hurricane Matthew: Feasibility Study. J. Comput. Civ. Eng. 2020, 34, 5020001. [Google Scholar]
- Devaraj, S.; Yarrakula, K. Evaluation of Sentinel 1–derived and open-access digital elevation model products in mountainous areas of Western Ghats, India. Arab. J. Geosci. 2020, 13, 1103. [Google Scholar] [CrossRef]
- Karabörk, H.; Makineci, H.B.; Orhan, O.; Karakus, P. Accuracy Assessment of DEMs Derived from Multiple SAR Data Using the InSAR Technique. Arab. J. Sci. Eng. 2021, 46, 5755–5765. [Google Scholar] [CrossRef]
- Letsios, V.; Faraslis, I.; Stathakis, D. InSAR DSM using Sentinel 1 and spatial data creation. In Proceedings of the 22th AGILE International Conference on Geographic Information Science (AGILE 2019), Limassol, Cyprus, 17–20 June 2019; pp. 1–4. [Google Scholar]
- Burrough, P.; McDonnell, R.A. Principles of Geographical Information Systems, 3rd ed.; Oxford University Press: New York, NY, USA, 1998. [Google Scholar]
- Archer, N.A.L.; Bonell, M.; Coles, N.; MacDonald, A.M.; Auton, C.A.; Stevenson, R. Soil characteristics and landcover relationships on soil hydraulic conductivity at a hillslope scale: A view towards local flood management. J. Hydrol. 2013, 497, 208–222. [Google Scholar] [CrossRef] [Green Version]
- Reinhardt-Imjela, C.; Imjela, R.; Bölscher, J.; Schulte, A. The impact of late medieval deforestation and 20th century forest decline on extreme flood magnitudes in the Ore Mountains (Southeastern Germany). Quat. Int. 2018, 475, 42–53. [Google Scholar] [CrossRef]
- Shivakumar, B.R.; Rajashekararadhya, S. V Investigation on Land Cover Mapping Capability of Maximum Likelihood Classifier: A Case Study on North Canara, India. Procedia Comput. Sci. 2018, 143, 579–586. [Google Scholar] [CrossRef]
- RMHPDRTTA Projections de la population des Provinces et Prefectures de la Region Tanger-Tetouan-al Hoceima 2014–2030; Rabat, Morocco, 2018. Available online: https://www.hcp.ma/region-tanger/attachment/995544/ (accessed on 14 December 2021).
- Bouramtane, T.; Tiouiouine, A.; Kacimi, I.; Valles, V.; Talih, A.; Kassou, N.; Ouardi, J.; Saidi, A.; Morarech, M.; Yameogo, S.; et al. Drainage Network Patterns Determinism: A Comparison in Arid, Semi-Arid and Semi-Humid Area of Morocco Using Multifactorial Approach. Hydrology 2020, 7, 87. [Google Scholar] [CrossRef]
- Bouramtane, T.; Yameogo, S.; Touzani, M.; Tiouiouine, A.; El Janati, M.; Ouardi, J.; Kacimi, I.; Valles, V.; Barbiero, L. Statistical approach of factors controlling drainage network patterns in arid areas. Application to the Eastern Anti Atlas (Morocco). J. Afr. Earth Sci. 2020, 162, 103707. [Google Scholar] [CrossRef]
- Anderson, R.H.; Farrar, D.B.; Thoms, S.R. Application of discriminant analysis with clustered data to determine anthropogenic metals contamination. Sci. Total Environ. 2009, 408, 50–56. [Google Scholar] [CrossRef]
- Wilson, S.R.; Close, M.E.; Abraham, P. Applying linear discriminant analysis to predict groundwater redox conditions conducive to denitrification. J. Hydrol. 2018, 556, 611–624. [Google Scholar] [CrossRef]
- Choubin, B.; Borji, M.; Mosavi, A.; Sajedi-Hosseini, F.; Singh, V.P.; Shamshirband, S. Snow avalanche hazard prediction using machine learning methods. J. Hydrol. 2019, 577, 123929. [Google Scholar] [CrossRef]
- Zhu, Z.; Lin, C.; Zhang, X.; Wang, K.; Xie, J.; Wei, S. Evaluation of geological risk and hydrocarbon favorability using logistic regression model with case study. Mar. Pet. Geol. 2018, 92, 65–77. [Google Scholar] [CrossRef]
- Loh, W.-Y. Classification and regression trees. WIREs Data Min. Knowl. Discov. 2011, 1, 14–23. [Google Scholar] [CrossRef]
- Marjanović, M.; Kovačević, M.; Bajat, B.; Voženílek, V. Landslide susceptibility assessment using SVM machine learning algorithm. Eng. Geol. 2011, 123, 225–234. [Google Scholar] [CrossRef]
- Lee, S.; Lee, M.-J.; Jung, H.-S. Data Mining Approaches for Landslide Susceptibility Mapping in Umyeonsan, Seoul, South Korea. Appl. Sci. 2017, 7, 683. [Google Scholar] [CrossRef] [Green Version]
- Choubin, B.; Moradi, E.; Golshan, M.; Adamowski, J.; Sajedi-Hosseini, F.; Mosavi, A. An ensemble prediction of flood susceptibility using multivariate discriminant analysis, classification and regression trees, and support vector machines. Sci. Total Environ. 2019, 651, 2087–2096. [Google Scholar] [CrossRef]
- Luo, X.; Lin, F.; Zhu, S.; Yu, M.; Zhang, Z.; Meng, L.; Peng, J. Mine landslide susceptibility assessment using IVM, ANN and SVM models considering the contribution of affecting factors. PLoS ONE 2019, 14, e0215134. [Google Scholar] [CrossRef]
- Abraham, S.; Huynh, C.; Vu, H. Classification of Soils into Hydrologic Groups Using Machine Learning. Data 2020, 5, 2. [Google Scholar] [CrossRef] [Green Version]
- Kecman, V. Learning and Soft Computing; MIT Press: Cambridge, MA, USA, 2001. [Google Scholar]
- Shmueli, G. To Explain or to Predict? Stat. Sci. 2010, 25, 289–310. [Google Scholar] [CrossRef]
- Monteiro, J.M.; Rao, A.; Shawe-Taylor, J.; Mourão-Miranda, J. A multiple hold-out framework for Sparse Partial Least Squares. J. Neurosci. Methods 2016, 271, 182–194. [Google Scholar] [CrossRef] [Green Version]
- Pal, K.; Patel, B. V Data Classification with k-fold Cross Validation and Holdout Accuracy Estimation Methods with 5 Different Machine Learning Techniques. In Proceedings of the 2020 Fourth International Conference on Computing Methodologies and Communication (ICCMC), Erode, India, 11–13 March 2020; pp. 83–87. [Google Scholar]
- Yadav, S.; Shukla, S. Analysis of k-Fold Cross-Validation over Hold-Out Validation on Colossal Datasets for Quality Classification. In Proceedings of the 2016 IEEE 6th International Conference on Advanced Computing (IACC), Bhimavaram, India, 27–28 February 2016; pp. 78–83. [Google Scholar]
- Tanner, E.M.; Bornehag, C.-G.; Gennings, C. Repeated holdout validation for weighted quantile sum regression. MethodsX 2019, 6, 2855–2860. [Google Scholar] [CrossRef]
- Marzban, C. The ROC Curve and the Area under It as Performance Measures. Weather Forecast. 2004, 19, 1106–1114. [Google Scholar] [CrossRef]
- De Reu, J.; Bourgeois, J.; Bats, M.; Zwertvaegher, A.; Gelorini, V.; De Smedt, P.; Chu, W.; Antrop, M.; De Maeyer, P.; Finke, P.; et al. Application of the topographic position index to heterogeneous landscapes. Geomorphology 2013, 186, 39–49. [Google Scholar] [CrossRef]
- Pourali, S.H.; Arrowsmith, C.; Chrisman, N.; Matkan, A.A.; Mitchell, D. Topography Wetness Index Application in Flood-Risk-Based Land Use Planning. Appl. Spat. Anal. Policy 2016, 9, 39–54. [Google Scholar] [CrossRef]
- Weiss, A. Topographic Position and Landforms Analysis. Available online: http://www.jennessent.com/downloads/TPI-poster-TNC_18x22.pdf (accessed on 14 December 2021).
- Doswell, C.A. Societal impacts of severe thunderstorms and tornadoes: Lessons learned and implications for Europe. Atmos. Res. 2003, 67–68, 135–152. [Google Scholar] [CrossRef]
- Darabi, H.; Choubin, B.; Rahmati, O.; Torabi Haghighi, A.; Pradhan, B.; Kløve, B. Urban flood risk mapping using the GARP and QUEST models: A comparative study of machine learning techniques. J. Hydrol. 2019, 569, 142–154. [Google Scholar] [CrossRef]
Publisher’s Note: MDPI stays neutral with regard to jurisdictional claims in published maps and institutional affiliations. |
© 2021 by the authors. Licensee MDPI, Basel, Switzerland. This article is an open access article distributed under the terms and conditions of the Creative Commons Attribution (CC BY) license (https://creativecommons.org/licenses/by/4.0/).