Article

Combining Hydrodynamic Modelling and Solar Potential Assessment to Evaluate the Effects of FPV Systems on Mihăilești Reservoir, Romania

by
Gabriela Elena Dumitran
,
Elena Catalina Preda
*,
Liana Ioana Vuta
,
Bogdan Popa
and
Raluca Elena Ispas
Hydraulics, Hydraulic Machinery and Environmental Engineering Department, National University of Science and Technology POLITEHNICA Bucharest, Spl. Independentei, No. 313, 060041 Bucharest, Romania
*
Author to whom correspondence should be addressed.
Hydrology 2025, 12(6), 157; https://doi.org/10.3390/hydrology12060157
Submission received: 30 April 2025 / Revised: 3 June 2025 / Accepted: 16 June 2025 / Published: 19 June 2025
(This article belongs to the Special Issue Hydrodynamics and Water Quality of Rivers and Lakes)

Abstract

Floating photovoltaic (FPV) systems are a new green technology emerging lately, having the indisputable advantage of not covering agricultural land but instead the surface of lakes or reservoirs. Being a new technology, even though the number of studies is significant, reliable results remain limited. This paper presents the possible influence of an FPV farm installed on the surface of a reservoir in Romania in four scenarios of the surface being covered with photovoltaic panels. The changes in the water mass under the FPV panels were determined using mathematical modelling as a tool. For this purpose, a water quality model was implemented for Mihăilești Reservoir, Romania, and the variations in the temperature, the phytoplankton biomass, and the total phosphorus and nitrogen were computed. Also, by installing FPV panels, it was estimated that a volume of water of between 1.75 and 7.43 million m3/year can be saved, and the greenhouse gas emission reduction associated with the proposed solutions will vary between 15,415 and 66,066 tCO2e/year; these results are in agreement with those reported in other scientifical studies. The overall conclusion is that the effect of an FPV farm on the reservoir’s surface is beneficial for the water quality in the reservoir.

1. Introduction

To discover efficient and fast solutions to the climate and energy crisis, humanity must ensure that new energy advancements do not jeopardise Sustainable Development Goals [1]. In this context, a solution can be the placement of floating photovoltaic (FPV) panels on the surfaces of hydropower plant (HPP) reservoirs. The implementation of such a solution could have the following advantages: increasing renewable energy production, controlling the evaporation phenomenon at the surface level of the reservoirs, mitigating the intensity of light radiation in the water mass [2], reducing photosynthesis [3], changing the currents and the kinetic energy of the wind in the water plane [4], changing the biochemical reactions in the water body [5], and the lower transmission costs because the HPP reservoirs already have a grid infrastructure for delivering electricity to consumers [6]. Also, the FPV panels will generate more power than those placed on land, as the cooling effect of the water increases the panels’ efficiencies, and their maintenance will be considerably reduced since the wind and rain aid in cleaning their surface.
The potential for energy generation by floating photovoltaic (FPV) systems is very high. Almeida et al. estimate that by covering approximately 10% of the surface area of artificial reservoirs worldwide with FPVpanels, it would be possible to generate as much electricity as is currently produced by fossil fuel power plants [7,8]. Currently, it is estimated that there are over 600 installed FPV plants worldwide, most of them located in Asia [8]. Among these, most FPV plants are installed on artificial water bodies, with an average reservoir surface coverage rate of 34.2% [9]. However, even under these conditions, with a significant number of such installations, there is limited knowledge about the consequences of FPV systems on freshwater ecosystems [10,11]. Thus, although FPV systems represent a new opportunity for the energy sector, detailed studies on the potential environmental effects of FPV systems are still needed [12].
Nevertheless, it is anticipated that the potential ecological effects of FPV systems on water bodies are primarily determined by the level of FPV panel coverage [8], and the main mechanism of action is the disruption of the radiant energy balance in the installation area, influencing multiple factors [13]. The installation of FPV farms in aquatic ecosystems can have direct and indirect impacts on a variety of environmental characteristics [3,14]. Ray et al. highlighted that FPV systems reduce the intensity of light and wind reaching the lake’s surface, while also observing variations in dissolved oxygen concentrations in the water column [15]. Armstrong et al. and, later, Exley et al. investigated the impact of FPV installations on water temperature and, implicitly, on many different biological processes driven by the water temperature, such as primary production and the carbon cycle [3,16]. Understanding the impact of FPV plants on water temperature is, thus, necessary for properly comprehending the ramifications for the complete aquatic environment [13,17]. Mathematical modelling represents a useful tool for investigating the potential effects of FPV systems on aquatic ecosystems. In this regard, Oliviera, in 2024, reviewed the specialised works that investigate this subject and observed that most of them are based on the use of modelling [9].
The understanding of the technical–economic aspects of FPV systems is quite advanced, which has allowed, in recent years, for a rapid adoption rate of this technology. However, this rapidly expanding renewable energy source is difficult to apply; on the one hand, this is due to the absence of standardised protocols, and on the other hand, it is due to gaps in the knowledge related to the impact of FPV systems on the aquatic environment regarding ecological criteria [18]. There is, therefore, still a lack of understanding of the biochemical effects of FPV systems on water bodies; furthermore, there is a need for comprehensive studies integrating the physical, chemical, and biological aspects of water body dynamics. To address this knowledge gap, we sought to answer the following questions: i: Given the vulnerability of water bodies in Romania to both eutrophication and the effects of climate change, can the installation of FPV systems represent an adaptation solution? ii. Due to the 20% limitation on the FPV panel coverage area in Romania, various coverage scenarios could have both positive and negative effects—particularly in terms of the water quality beneath the FPV panels, GHG emissions, and the volume of water saved when operating in tandem with hydropower plants.
At this moment, in Romania, there is a huge interest in developing FPV systems. Hidroelectrica, the operator of around 6400 MW in hydropower plants, intend to develop, over the next few years, more than 1500 MW in FPV systems. This study investigates the feasibility of establishing an FPV farm on the Mihăilești Artificial Reservoir in Romania, which is used for hydroelectric purposes. The Mihăilești Reservoir is an excellent example of an interior lake without any kinetic energy and/or wave energy, as on the reservoir’s free surface, there are waves only when strong winds arise. Using modelling techniques, this study also aims to identify the potential impacts on the aquatic environment when the water surface is covered with FPV panels at coverage levels of 5%, 10%, 15%, and 20%. Therefore, this study intends to provide a better understanding of the potential consequences for water quantity and quality of various degrees of lake surface coverage with FPV panels. The analysis represents a quantitative assessment of the potential effects of FPV panels on the water quality indicators by creating and calibrating a hydrodynamic and water quality model for the Mihăilești Reservoir. The effect of the FPV panels on the water temperature, nutrients (total nitrogen and phosphorus concentrations), and phytoplankton concentrations in the FPV-panel-covered area was investigated. Based on this analysis, an adequate management strategy for the lake’s water resource could be developed in the future, considering both its trophic strata and the future trends of increasing temperatures due to climate change.

2. Materials and Methods
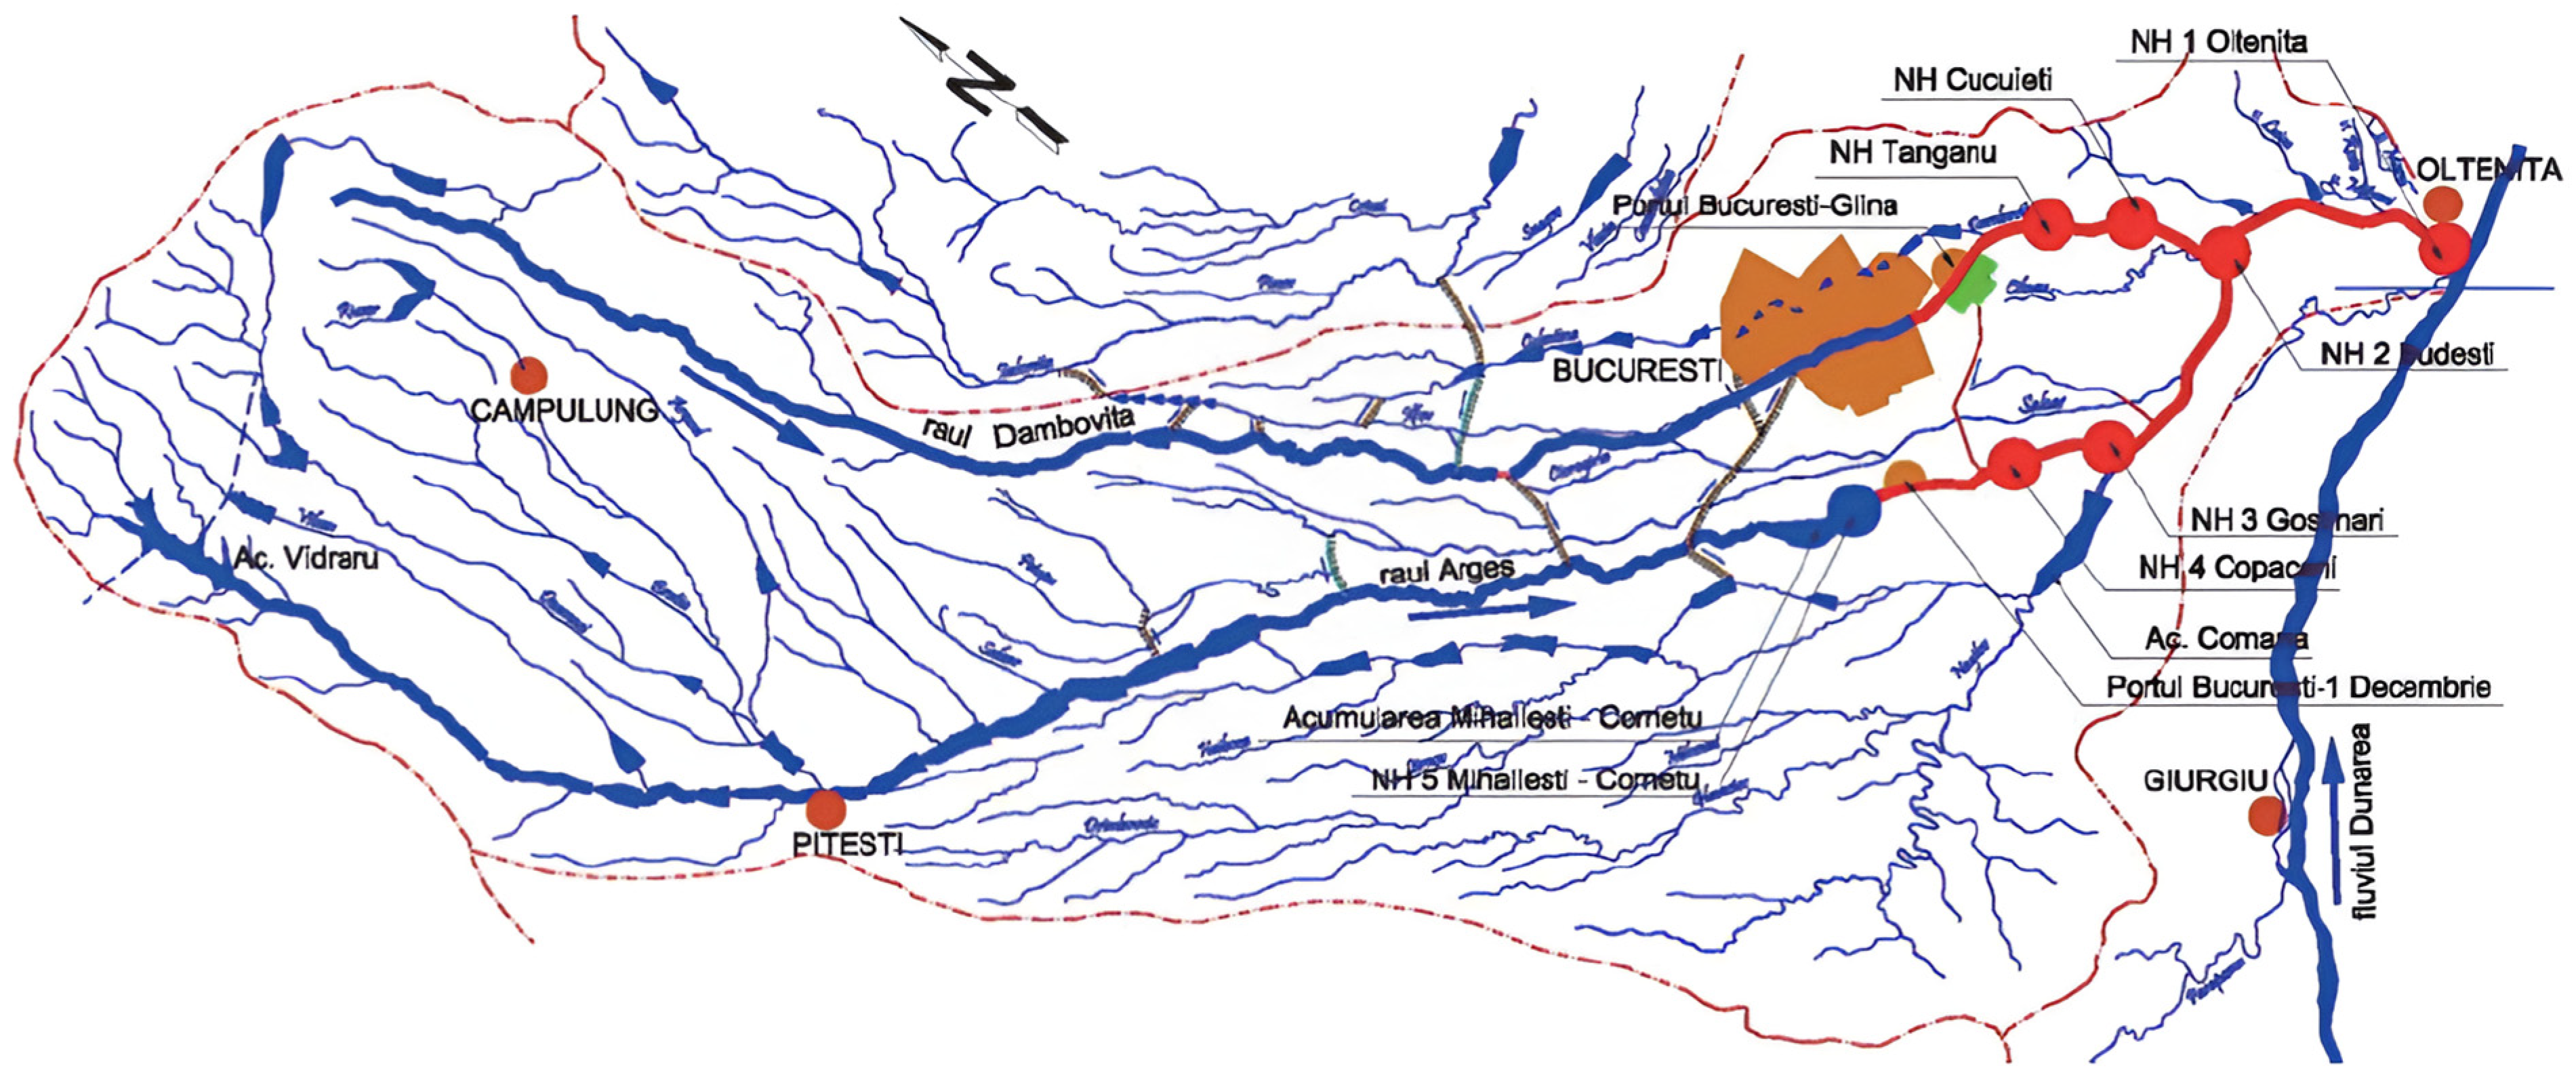
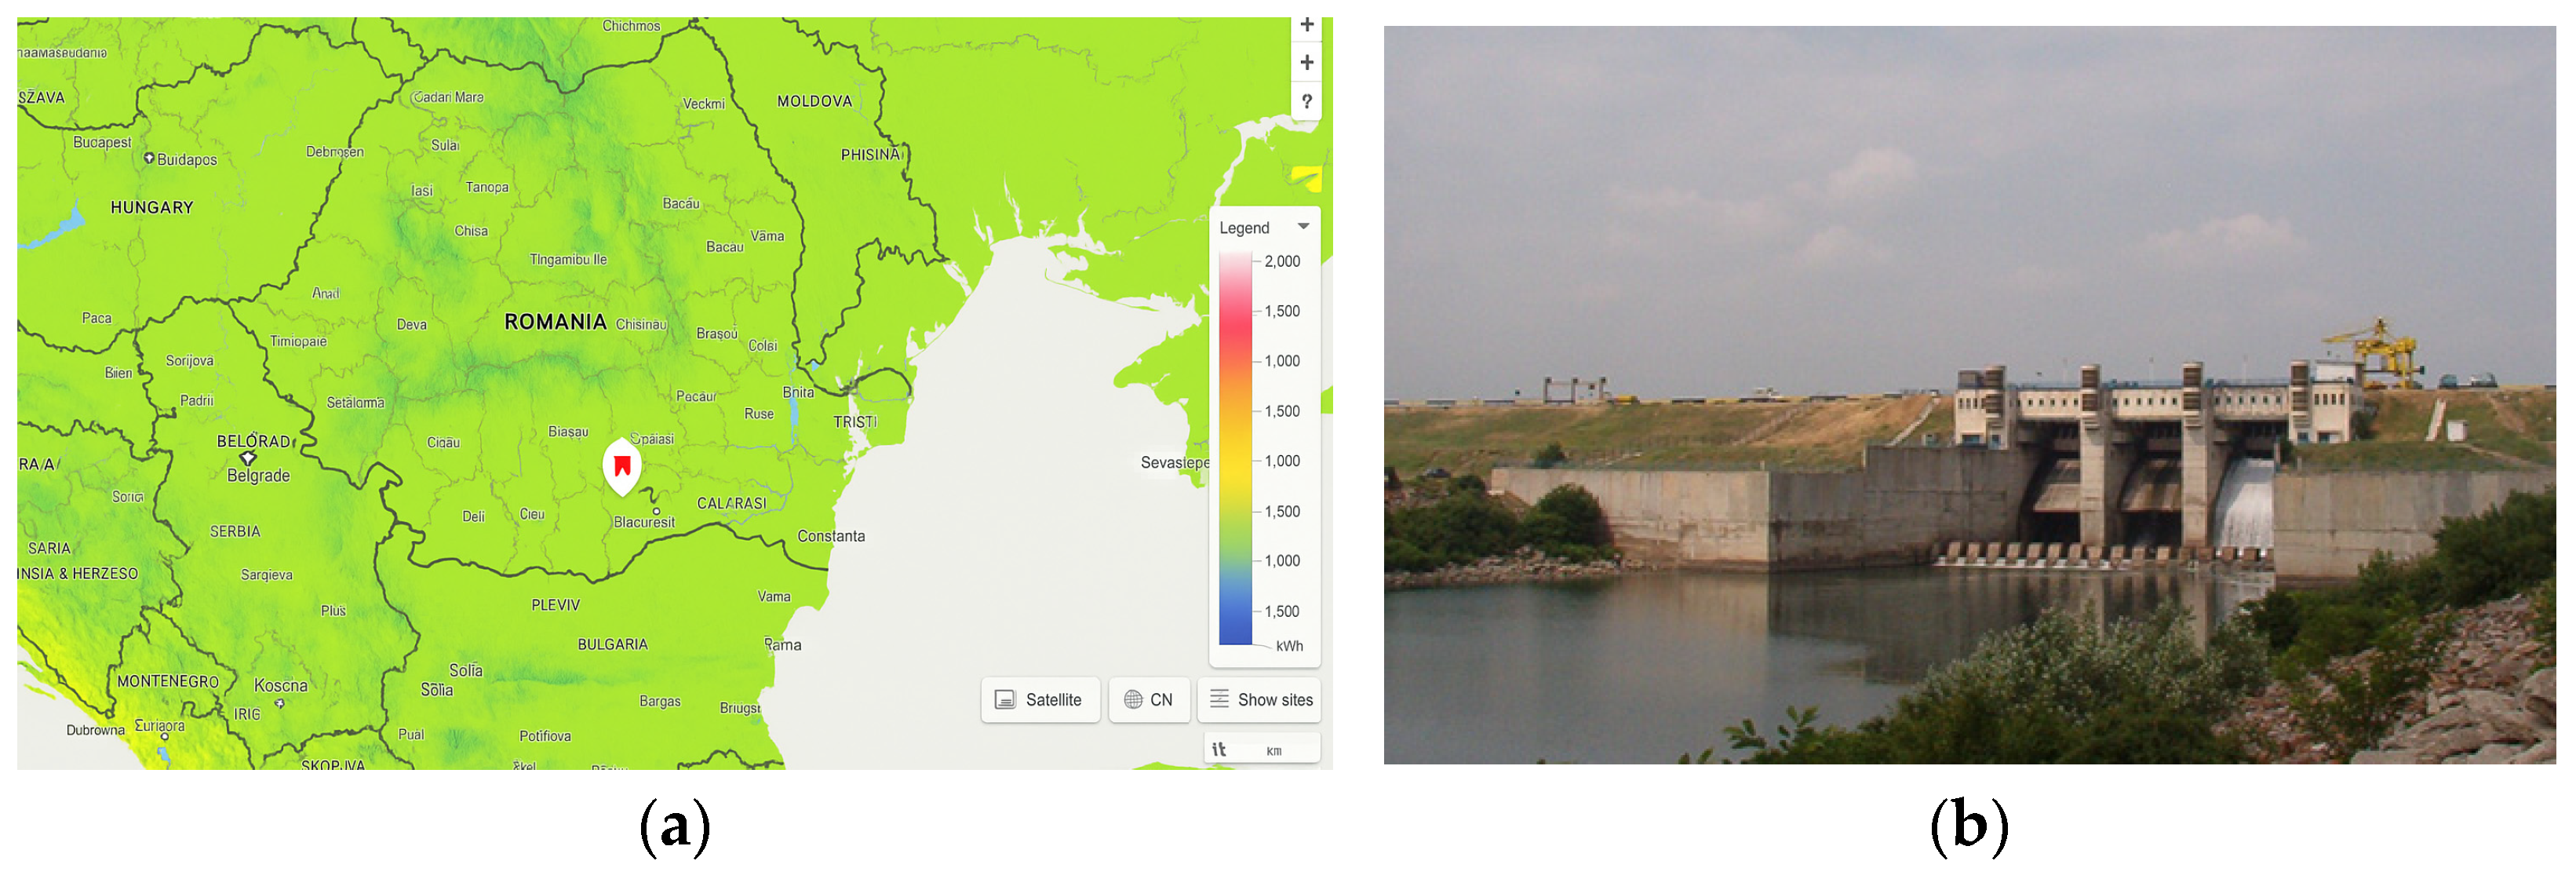
2.1. Study Area

In 1929, the Parliament of Romania adopted a law related to the construction of a canal to transform Bucharest—the capital of Romania—into a port on the Danube River. However, due to the economic recession of the 1930′s, the project was abandoned. Nevertheless, based on this law, before World War II, the engineer Dorin Pavel created a project for the Bucharest–Oltenița Canal. Based on this project, over time, various options were studied for a navigable connection between Bucharest and the Danube River. In 1984, it was decided to adopt a project that proposed the construction of channels exclusively on the Argeș River, even though this solution was the most expensive and the one that technically raised the most difficult problems for both its execution and operation. The plan included four locks and three ports, and the canal was designed to have a length of 73 km, a width of 80 m, a level difference of 53 m, and a minimum water depth of 4.5 m (Figure 1). In 1984, work began on this canal, but it was abandoned after 1989, with the only completed and operational facility being hydrotechnical node No. 5—HPP Mihăilești.
The Mihăilești HPP is located on the lower course of the Argeș River, positioned on the right bank. It is a low-head plant, with a dam creating the Mihăilești Reservoir. Characteristics related to the Mihăilești Reservoir and HPP are presented in Table 1.
The Mihăilești Reservoir has a retention time of 20 days and a complex use, serving for flood mitigation, electricity generation, the water supply for downstream consumers, the irrigation of an area of 10,000 hectares, and ensuring the ecological flow downstream in the Argeș River. Figure 2a presents the distribution of direct normal irradiation over Romania, from Global Solar Atlas, and the Mihăilești Reservoir’s location, while in Figure 2b, the Mihăilești Dam is presented (https://arges-vedea.rowater.ro/wp-content/uploads/2021/02/Lucrari-hidrotehnice-in-exploatare.pdf accessed on 29 April 2025).
The multiannual mean energy for the 2002–2023 period was 23.85 GWh/year, with the highest average monthly energy in June 2021, 4.51 GWh, and the lowest in June 2008, 25 MWh. Figure 3 shows the variation in the mean annual energy production by the Mihăilești HPP and the evaporation from the reservoir for the period 2002–2023. The weather information downloaded from the meteorological site open-meteo.com was used for estimating the evaporation from the water surface with the Penman–Monteith equation [19]. The maximum annual evaporation rate, 1077 mm/y, was observed during 2012, and the minimum was observed in 2005, 893 mm/y (Figure 3). For the daily evaporation rate, the biggest value was 10.2 mm/day, and the smallest was 0.028 mm/day.
The National Administration “Romanian Waters” (NARW) is a public institution that manages issues related to the sustainable management of water resources and their protection against depletion and degradation. For the Mihăilești Reservoir, the integrated assessment of quality elements is monitored by NARW in three planned monitoring sections in the photic zone: at the dam, in the middle of the lake, and at an intermediate point located between the middle of the lake and its tail.
It is specified that for the monitored indicators, NARW calculates the vertical average values in the photic zone of the lake, and in Figure 4, these indicators for the Mihăilești Reservoir are presented: temperature (T), dissolved oxygen (DO), DO at saturation, total nitrogen (TN), total phosphorus (TP), and phytoplankton (A). Regarding these values, NARW classified the water body as having a moderate ecological potential, with phytoplankton being the determining element.
From the perspective of biological elements, the water body is classified as having a moderate potential, while from the perspective of general physicochemical indicators, it is classified as having the maximum potential. Following the monitoring of the reservoir, it was identified that for the last 10 years, especially during the summer periods, the water body has been in a eutrophic state, both chemically and biologically. Thus, it can be observed that the values for the TN concentrations for the years 2018–2020 and 2023, the values for the TP concentrations for the period 2019–2023, as well as the concentrations of phytoplankton in 2013 and over the period 2020–2023 classify the reservoir in the eutrophic category. In Figure 5 and Figure 6, for each of the indicators of interest for the Mihăilești Reservoir, the limits of the transition of the water body from being mesotrophic to being eutrophic are highlighted. In the Mihăilești Reservoir, the phytoplankton concentration varies between 3.25 and 23.5 mg/m3, with the maximum values for the last few years (2022 and 2023) corresponding to hypertrophic stages.
Regarding the TN in the Mihăilești Reservoir, the mean value of the concentration for the 2002–2023 period was 1218.2 mg/m3; the highest average was recorded in 2018 at the middle of the lake station, 1855 mg/m3, and the lowest average was recorded in 2017 at the intermediate point located between the middle of the lake and its tail section, 395 mg/m3.
For the TP concentration, the mean value for the study period was 40.7 mg/m3, with the highest average being recorded in 2020 at the middle of the lake station, 128.5 mg/m3, and the lowest average being recorded in 2006 at the dam station, 3 mg/m3. Over the entire study period, 2013–2023, the total nitrogen and the total phosphorus correlated with the phytoplanktonic biomass value, placing the lake in the mesotrophic category.

2.2. FPV Configuration

The geographical location, topographical features, and climatic characteristics of Romania have established favourable conditions for the use of solar energy throughout extensive regions. Romania exhibits a multiannual average sunshine duration ranging from 1600 to 3200 h per year and global solar radiation of between 700 and 1450 kWh/m2 per year, with significantly elevated values in the plain and plateau regions [20]. In this context, photovoltaic farms appear as a technology with considerable development potential, particularly on low-relief terrains, like those in the southern part of Romania, where the Mihăilești Reservoir is located.
Romania has about 3500 lakes covering an area of about 1.1% of the country’s surface, which means about 2600 km2 [21]. Although the FPV potential in Romania is great, so far, to our knowledge, only two small applications have been realised.
Kakoulaki et al., in 2023, analysed the potential for FPV systems in Europe and estimated that in Romania, for a total area of hydropower reservoirs of 394 km2, considering south-facing modules at a 100 inclination angle, the energy potential is between 4.4 TWh (for a coverage degree of 10%) and 44.1 TWh (for a coverage degree of 100%) [22].
In Romania, the installation of FPV systems on the surfaces of lakes managed by NARW has been permitted since 2024, but only for a maximum coverage rate of 20%. In this context, for the Mihăilești Reservoir’s 960 hectares, four scenarios were analysed, in which the FPV panel coverage rate was (1) 5%; (2) 10%; (3) 15%; and (4) 20% of the total surface area of the lake. For the analysed scenarios, the area occupied by the FPV panels and the total area of the lake are presented in Table 2.
To run the simulations for the power plant’s planning, the Global Solar Atlas software was chosen, which is one of the most popular software programs currently used for solar energy and represents an efficient instrument that allows for the accurate analysis of various configurations of complete PV and FPV systems. Figure 7a illustrates the diagram of the sun’s trajectory for the project location (44°32979′ N, 25°905075′ E), which indicates the sun’s position in the sky at any point of time during the day throughout the year, while Figure 7b presents the specific photovoltaic power output across Romania.

2.3. Water Quality Model

Managing surface water quality is crucial for effective water resource management, and water quality modelling serves as a strong and valuable tool in addressing related management challenges. The mathematical modelling of water bodies is a challenging approach that necessitates an understanding of physical, chemical, and biological processes, which is the reason that most people prefer a more simplistic approach [23]. In the proposed model, it was preferred to separate the physical and biochemical models, and the components were coupled by introducing the output data from the physical model into the biochemical model. The current model describes the annual cycle of temperature, nutrients, and phytoplankton, considering physical processes like light absorption, turbulence, and advection, as well as biochemical processes like nutrient assimilation, dissipative processes (respiration, excretion, and death), and sedimentation.
Temperature has an impact on almost all water quality processes that occur in a water body, and it is often simulated by performing a heat balance on each computational element of the system [24]. The main objective of physical modelling is to follow the seasonal variations in water temperature, and the thermocline depth into reservoirs is determined using the available energy for mixing in the epilimnion, which is given by the kinetic energy of the wind and the thermal energy from the sun. Since our physical model served as a basis for predicting the water quality over a seasonal period, we decided to use a one-dimensional vertical model, which has the advantage of a good reproduction of the mixing processes but also a fast computation time. The model presented here and used for the Mihăilești Reservoir is an advection-diffusive one, which describes vertical transport by simple formulations and requires few input data. The basic equation for expressing the water temperature variation in the reservoir is described in Equation (1) [25]:
T t = 1 S z S K z T z 1 S w T z + z R s ρ C p ,
where T is the temperature (°C), K(z) is the vertical diffusion coefficient (m2/s), w is the vertical velocity (m/s), S is the cross-sectional area (m2), RS is the source term due to surface–atmosphere exchanges (W/m2), ρ is the water density (kg/m3), and Cp is the specific heat (J/kg°C).
In water quality modelling, nitrogenous and phosphorous compounds play important roles as they consume oxygen during oxidation processes. Thus, the most common modelling approaches for biochemical reactions in a water mass are based mostly on mass conservation [7], in which the nutrient concentration is calculated from inputs, and the phytoplankton biomass is assessed in correlation with the limiting nutrients, most often the total phosphorus or the total nitrogen. The biochemical model for the Mihăilești Reservoir is mathematically transposed by the balance equation of A, TP, and TN in the water mass, with a time step of one day and a spatial step of 1 m in depth. The equations describing those interactions are specific to prey–predator relations; thus, the evolution of each food web constituent is conditioned by the presence or absence of other constituents [26].
The phytoplanktonic biomass is described by its growth term, production, and loss—by respiration and mortality terms and by grazing [26]; this can be expressed as shown in Equation (2):
A t = g r o w t h ( T , T P , T N , I ) l o s s ( T ) × A ,
where the growth term is expressed by g r o w t h T ,   T P ,   T N ,   I = g r o w t h m a x × f t e m p × f n u t r i e n t × f l i g h t , and the limiting factors are computed following the standard formulations:
  • The Michaelis–Menten Monod equation for nutrient limitation f n u t r i e n t = min f p , f n , f p = P P + k s p P , f N = N N + k s p N ;
  • The Steele formulation for the limitation due to light intensity f l i g h t = 2 I I o p t I I o p t 2 + 2 × β × I I o p t + 1 ;
  • An exponential relation for temperature f t e m p = T × ϑ T T 20 .
  • I represents the light intensity, I o p t = 2.5 · T , ϑT, and kspP, kspP, and β are explained in Table 3. The loss processes due to respiration are considered as both the endogenous component (re) and as photosynthesis (rf): l o s s ( T ) = r e s p i r a t i o n + m o r t a l i t y + e x c r e t i o n with r e s p i r a t i o n = r e T + r f T , I and r e ( T ) = c o e f r e × e 0.069 · T and r f ( T , I ) = k r × g r o w t h m a x × f t e m p × f l i g h t . The excretion and mortality terms are considered by e x c r e t i o n = c o e f e x r e t × ( 1 f l i g h t ) × g r o w t h T ,   T P ,   T N ,   I and m o r t a l i t y = c o e f m o r t × 1.05 ( T 20 ) .
The total phosphorus and the total nitrogen, TP and TN, are considered [26] by the model using Equations (3) and (4):
T P t = a p a × ( 1 ε ) × c z a ( T , A ) × A a p a × g r o w t h ( T , T P , T N , I ) × A
T N t = a n a × ( 1 ε ) × c z a ( T , A ) × A a n a × g r o w t h ( T , T P , T N , I ) × A
where cza is the predation rate of the algal biomass by zooplankton and is expressed as c z a ( T , A ) = c o e f p r e d A A + 10 1.0866 ( T 20 ) , while apa, ε, apc, kdz, ana, and anc are coefficients, for which the used values are specified in Table 3.
Based on the total data availability, the model was calibrated for the period from 1 January 2013 to 31 December 2022 and validated for the 2023 summer period, meaning 100 days, from 1 of June to 9 of September. To represent the time fluctuations in the analysed indicators, the Julian day was used, with the first day being 1 June 2023 and day 100 being 8 September 2023. The time step was one day, and the model’s performance was evaluated using the correlation coefficient—R.

3. Results and Discussion

Using the Global Solar Atlas software for the Mihăilești location, the annual global horizontal irradiation was calculated to GHI = 1393.3 MWh/m2, the annual direct normal irradiation was calculated to 1304.7 kWh/m2, and the global tilted irradiation was calculated to 1502.5 kWh/m2. In the preliminary design of the FPV system model, the major factors responsible for the maximum output power were the direction and the position of the FPV array. The solar declination angle varied with time and was limited to 23.44°. For the southern zone of Romania, the optimum value for the angle is recommended to be near to 100 [28]. In this respect, the modules should be placed facing the southern direction, with the optimum tilt angle of β = 100 for the PV panels and an azimuth angle equal to 180°. Values representing the monthly energy generation by the FPV systems for the four analysed scenarios, determined using Global Solar Atlas, are presented in Figure 8.
For the preliminary projects of the FPV systems for the Mihăilești Reservoir, the average area required for the designed FPV installations ranged between 48 ha and 192 ha. The smaller area ratio (the ratio of the FPV system to the total water surface area of the reservoir) in each scenario indicates that the system will not have an impact on the ecosystem. The proposed method is highly efficient in generating ecologically friendly renewable power. The evaporation rate in the Mihăilești Reservoir during the period 2002–2023 was determined using the Penman–Monteith equation, and the average annual value is 975.52 mm/year. Currently, the average power density (the installed capacity divided by the FPV panels’ surface area) reported for FPV systems is between 100 and 200 MW/km2 [29], and in our study, this calculated power density was between 145 and 173 MW/km2. Additionally, as it can be seen from the results, an energy density (the annual energy divided reported by FPV panels’ surface area) of between 164.69 and 196.04 GWh/km2 was obtained, with a specific yield of 1130 kWh/kWp (Table 4).
Based on the methodology proposed by Ravichandran in 2022 [30], the volumes of water that can be directly saved by installing FPV have been estimated (Table 5). Thus, the direct saving water volume represents the volume saved through evaporation mitigation, and it can be used for hydropower generation and the HPP will generate additional energy of 158 MWh per year.
Additionally, the term indirect water savings refers to the amount of water consumed by the HPP, which is obtained by converting the electrical energy generated by the FPV system into the volume of water. As observed, the largest volumes of saved water are for scenario No. 4, with 7.43 × 10⁶ m3 per year, which corresponds to the highest coverage degree of the lake’s surface with FPV panels. The FPV covering systems offer benefits, such as power generation and evaporation mitigation. The energy ratio (the energy obtained from the FPV system divided by the energy obtained from the HPP) results show that the FPV systems with smaller coverage areas produce more energy than the HPPs in reservoirs.
Next, the effects of the FPV system on water quality was studied. In this sense, the developed model was calibrated for the period 2013–2022, and the calibration technique necessitated establishing a balance between phytoplankton growth and variations in the available nutrients from the water column. The TP dynamics received special attention because this nutrient was the primary limiting factor for phytoplankton biomass.
The developed model is based on local climatology, and it has been used by the authors also for other aquatic ecosystems in Romania with good results in predicting water quality indicators [31,32,33]. The model calibration for the Mihăilești Reservoir was achieved for the FPV panel surface-coverage variant by fine-tuning the coefficients’ values for the period 2012–2022. Thus, starting from the coefficient values reported in the literature, which are presented in Table 3, and considering the particularities of the temperate continental climate in Romania, multiple simulations were performed to identify the best values of these coefficients so that the difference between the measured and simulated values of the model state variables would be as small as possible. Following the calibration process, the values of the coefficients indicated in Table 3 were obtained. The calibrated model reproduces the spatial and temporal distribution of the concentration of water quality constituents, and the evaluation of the model’s performance is made through the calculation of the correlation coefficient—R squared. Therefore, the best correlation was obtained for the TP, with a 0.993 value, followed by the TN, with 0.9546; phytoplankton, with 0.9262; and temperature, with a 0.9094 value.
The model validation was carried out over a period of approximately three months during the summer of 2023, and the variations of the four indicators of interest (T, TN, TP, and A) were evaluated for different degrees of lake coverage with the FPV panels. Thus, simulations of the behaviour of the Mihăilești Reservoir under the condition of non-coverage with FPV panels were carried out, determining the variations over time of the four quality indicators in the water mass. Then, for the four scenarios of covering considered (5%, 10%, 15%, and 20% of the lake’s surface), simulations were made. Thus, for each percentage of coverage, the conditions of the intensity of solar radiation in the water mass under the photovoltaic park were modified, and the temporal variations of T, TN, TP, and A in the water mass were obtained. The results of these simulations are shown in Figure 9, Figure 10, Figure 11 and Figure 12, where for an easier comparison, the variations of the indicators for scenarios No. 2 and 4 are presented in comparison with the situation when the lake surface is not covered with FPV panels.
As can be seen, the differences obtained for the temperature variation in the water mass of the reservoir for the version not covered by FPV panels (Figure 9) and the variants with 10% and 20% coverage, respectively, are not significant. Thus, depending on the percentage of FPV panel coverage, we notice a slight cooling of the water mass, so that the average temperature of the water in the reservoir decreases in percentage, with values of between 0.62% and 10.27%, with the highest percentages identified for the coverage degree of 20%. Also, a slight deepening of the epilimnion is observed as the area covered with FPV panels increases.
Regarding the differences obtained for the phytoplankton biomass variation in the water mass of the reservoir for the version not covered by FPV panels and for scenarios No. 2 and 4, it can be observed that the concentration of phytoplankton decreases directly proportionally to the degree of coverage (Figure 10). This is explained by a lower availability of light for primary water producers. Thus, we observed that the average values of the biomass in the reservoir for the analysed period decreased from 7.22 mg/m3 in the uncovered version to 3.56 mg/m3 for scenario 4. Percentage wise, these decreases are 2.5% for scenario No. 1, approx. 26% for scenario No. 2, approx. 38.6% for scenario No. 3, and approx. 50.8% for scenario No. 4. We must specify that these decreases in algal biomass are obtained only for the area of the reservoir covered by the photovoltaic panels, where the intensity of solar radiation is attenuated.
Figure 11 and Figure 12 show the variations in nutrient concentrations (TN and TP) in the water mass of the Mihăilești Reservoir for the non-FPV-panel-covered scenario and for scenarios No. 2 and 4. It can be observed that the concentration of nutrients increases when covering a higher percentage of the reservoir surface with FPV panels. This correlates with the decrease in the phytoplankton biomass concentration, and it is explained by the decrease in photosynthesizing activity. Since, in the developed model, the contributions of the two nutrients, TN and TP, to algal development are considered similar—without considering the affinities of the algae in the reservoir for certain forms of nutrients (nitrates, nitrites, ammonia, orthophosphate, etc.)—the concentration variation components are also similar. Thus, we observed that the average values of the TN concentration in the water mass for the analysed period increase from 982.5 mg/m3 in the uncovered version to 1137.51mg/m3 for scenario 4, while for the TP concentration, this growth is from 32.68 mg/m3 in the uncovered version to 37.9 mg/m3 for scenario 4. In percentage terms, these increases range from 1.25% for scenario No. 1 to approx. 16% for scenario No. 4.
Analysing the deviations in the quality indicator values obtained for the four scenarios compared to their values in the hypothesis of the lake not being covered with FPV panels, it can be observed that the values of the lake’s water temperature and the values of the phytoplankton biomass decrease with the increase in the degree of coverage, while the values of the nutrient concentrations increase slightly (Table 6).
For comparison, the vertically averaged values for the quality indicators simulated were used, and it can be observed that on average, the temperature values decrease by percentages ranging from 2 to 10%, while the phytoplankton concentrations decrease considerably, by percentages ranging from 13 to 51% (Figure 13).
For the nutrient concentrations, it can be observed that, on average, their values increase by percentages ranging from 4 to 16%, which was expected, considering the evolution of the algal biomass in the lake and the fact that the biochemical model is one based on the principle of mass conservation. Therefore, the nutrient concentration is indirectly related to algal production. Because of the algal bloom, the nutrient concentration begins to fall, and when the phytoplankton peak is reached, the decomposition and resuspension processes cause the nutrient content to rise (particularly phosphorus). For the developed biochemical model, it was considered that the trophic level of the producers consumes the two types of nutrients equally, in the form of TN and TP, so the results obtained for the variations in the concentrations of TN and TP do not differ much (Figure 13).
On the other hand, the FPV solutions proposed for the Mihăilești Reservoir can provide between 79 to 339 GWh/year of clean energy, with zero GHG emissions. Given the fact that, according to Nowtricity, https://www.nowtricity.com/country/romania (accessed on 6 April 2025), the conversion factor is 195 kgCO2e/MWh for each 1 MWh Romania mix, the GHG emission reduction associated with the proposed solutions will vary between 15,415 and 66,066 tCO2e/year (Table 7).

4. Conclusions

Nowadays, more and more studies and research aim to provide clean energy, showing that humanity is committed to respecting the environment. Also, as new technologies for harnessing green energy are being developed at the highest rates since the beginning of the industrial era, the share of RESs in the energy sector is continuously increasing and is expected to increase even more in the next years. As an EU member, Romania is committed to implementing and developing clean energy projects and to reducing its GHG emissions. At the same time, Romania must ensure that the water quality in rivers and reservoirs is maintained or improved so as to attain a good status, if possible.
The aim of this study was to present a cutting-edge solution that achieves both of the objectives mentioned above: the use of FPV systems on a complex-use reservoir that presents eutrophication phenomena, mostly during warm periods, and the attenuation of these phenomena. The Mihăilești Reservoir was chosen for this study, presenting the advantage of being already connected to the National Power Grid, and four scenarios of the surface being covered by FPV panels were investigated: 5, 10, 15, and 20% of the total water surface. For assessing the gain in clean energy generation, the Solar Atlas tool was used, while for investigating the benefits with regard to water quality indicators, a mathematical model was applied.
The study yielded the following conclusions:
  • The data obtained from the calibrated model are similar to the measured ones, observing that the values of correlations for all the investigated variables are greater than 0.9.
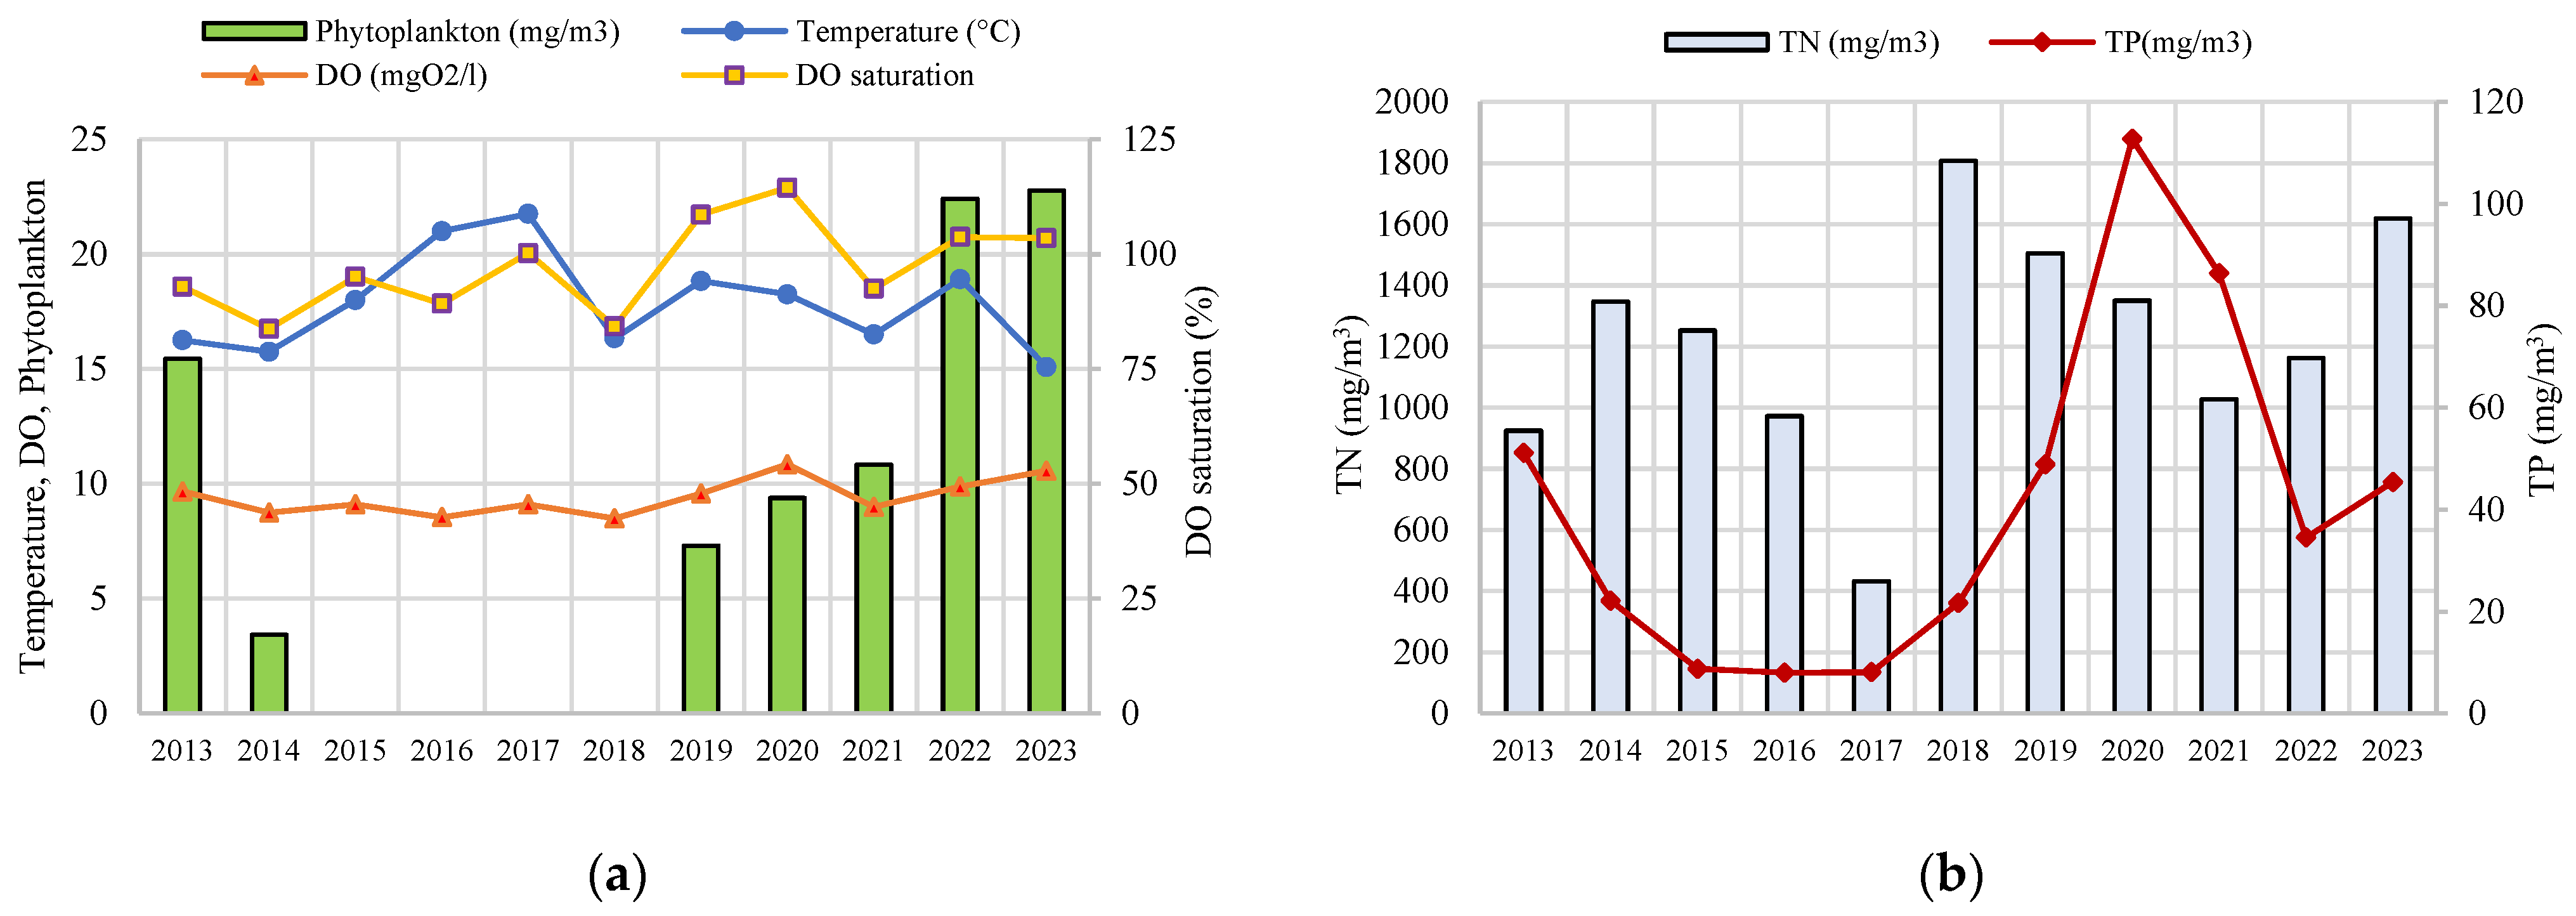
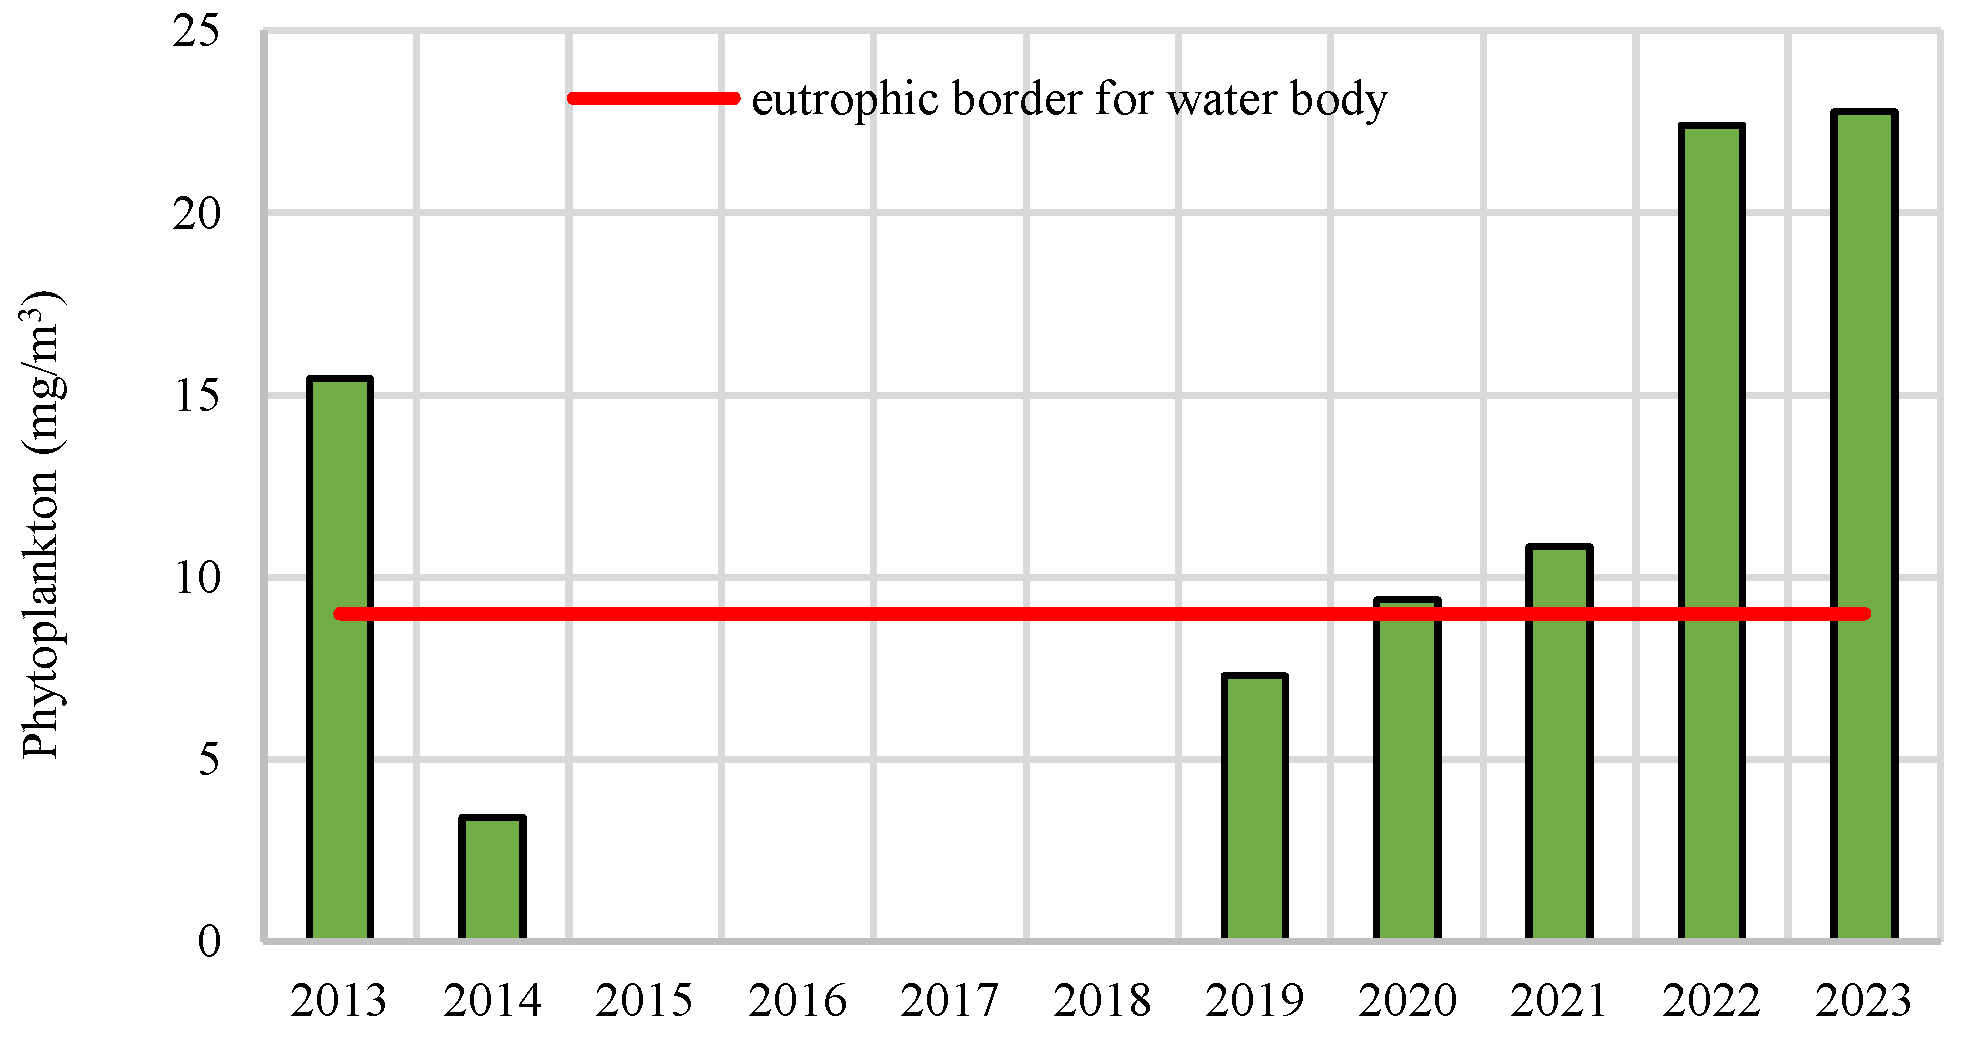
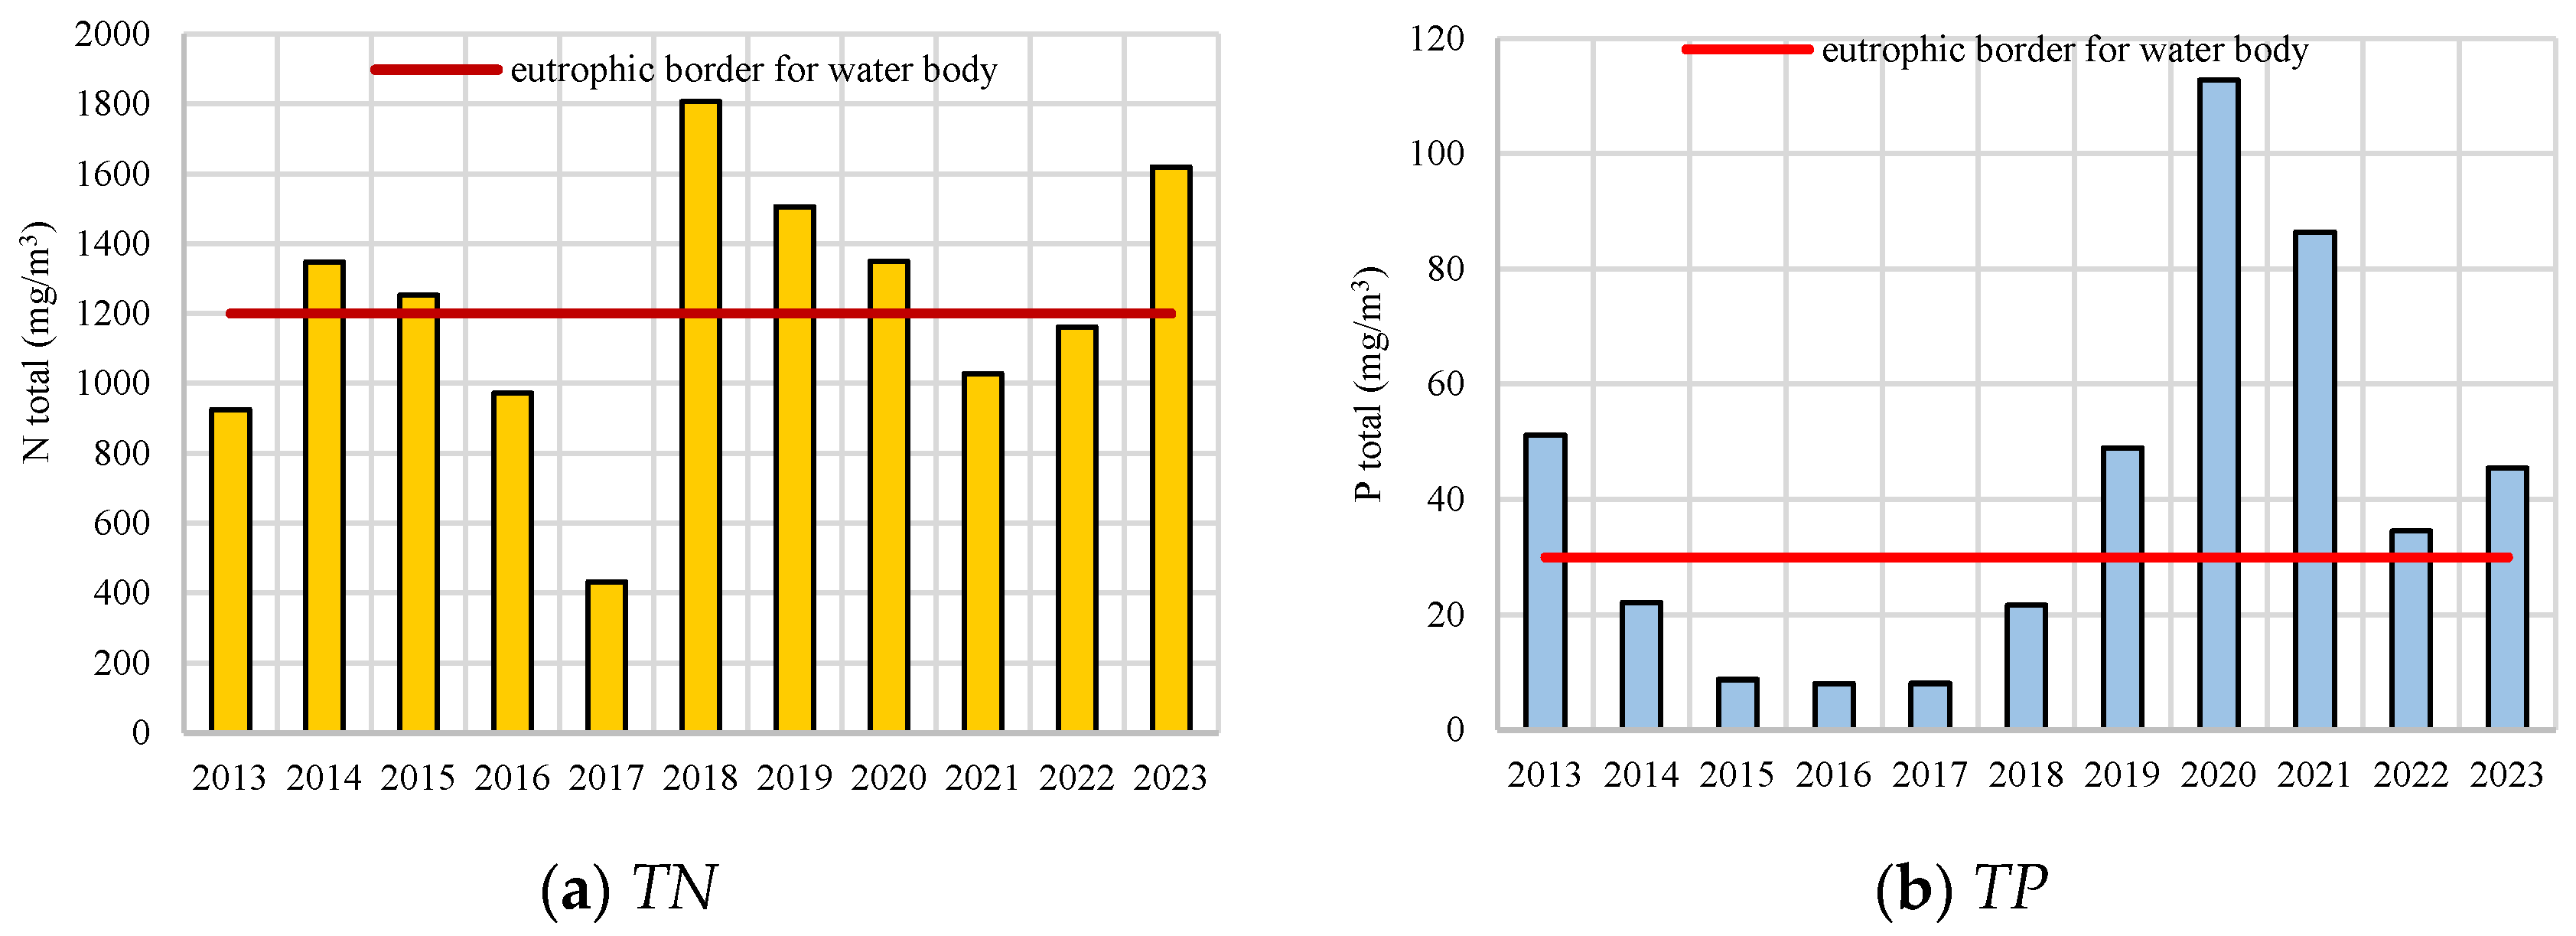
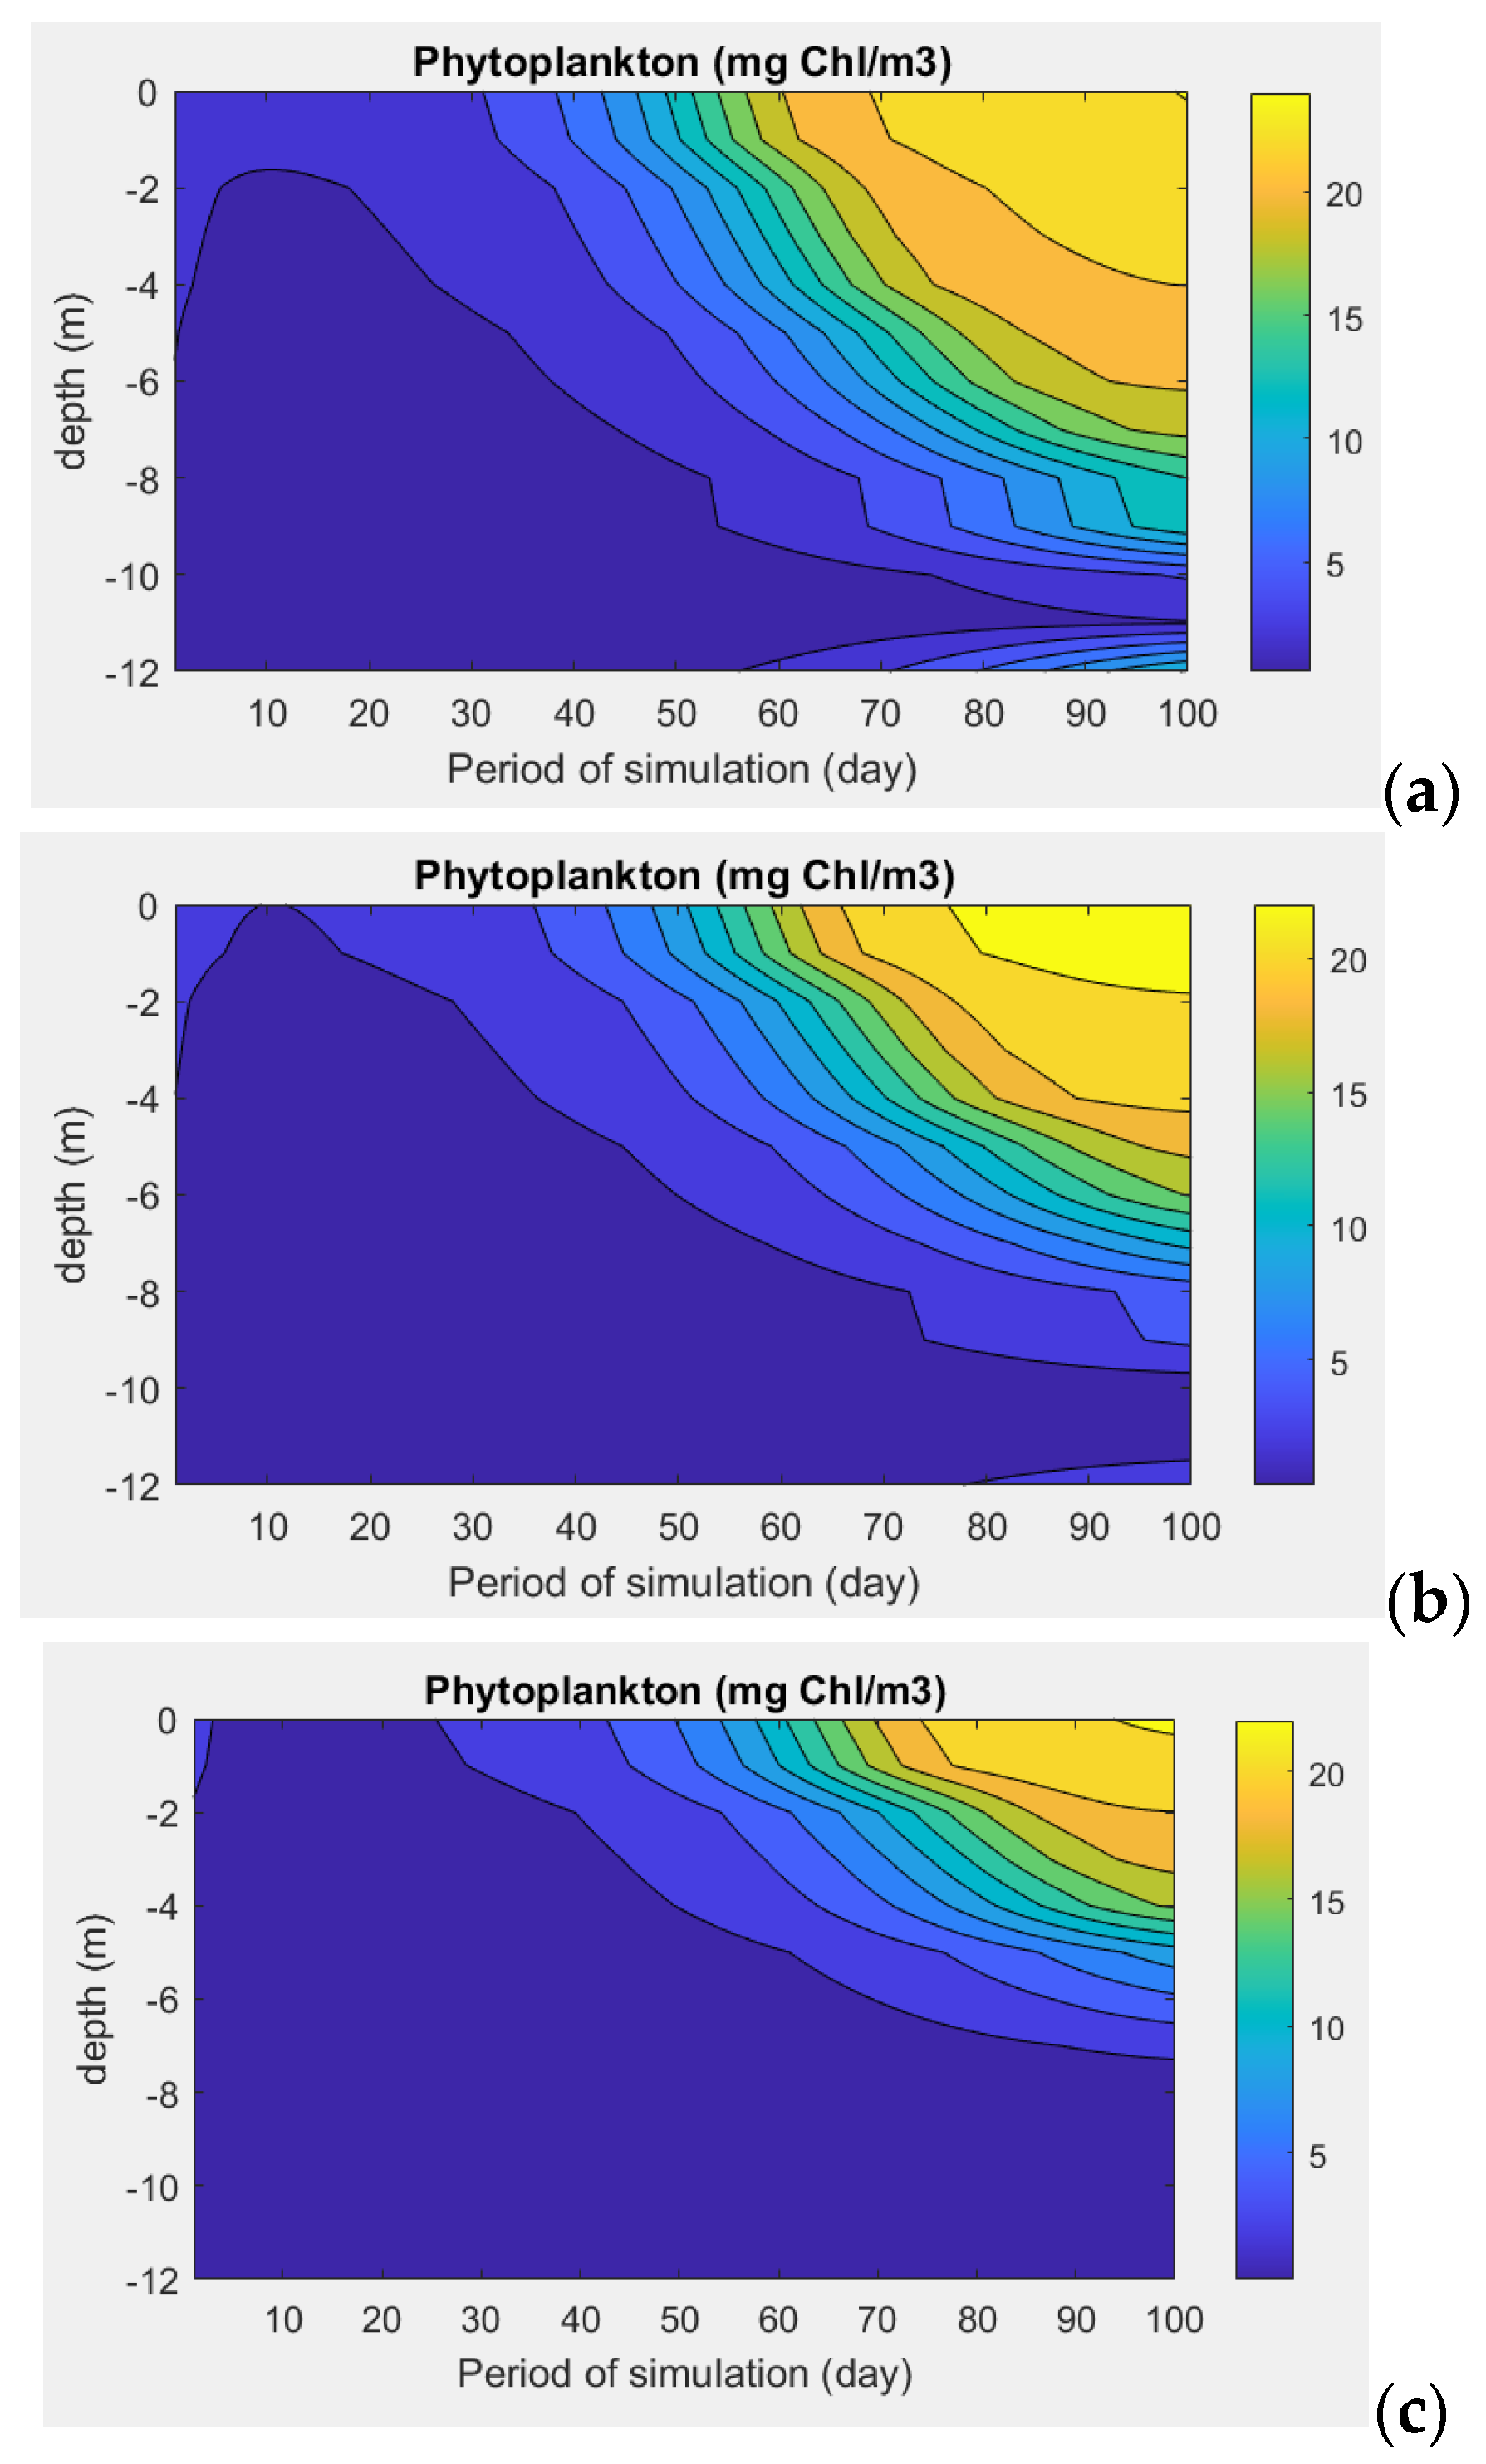
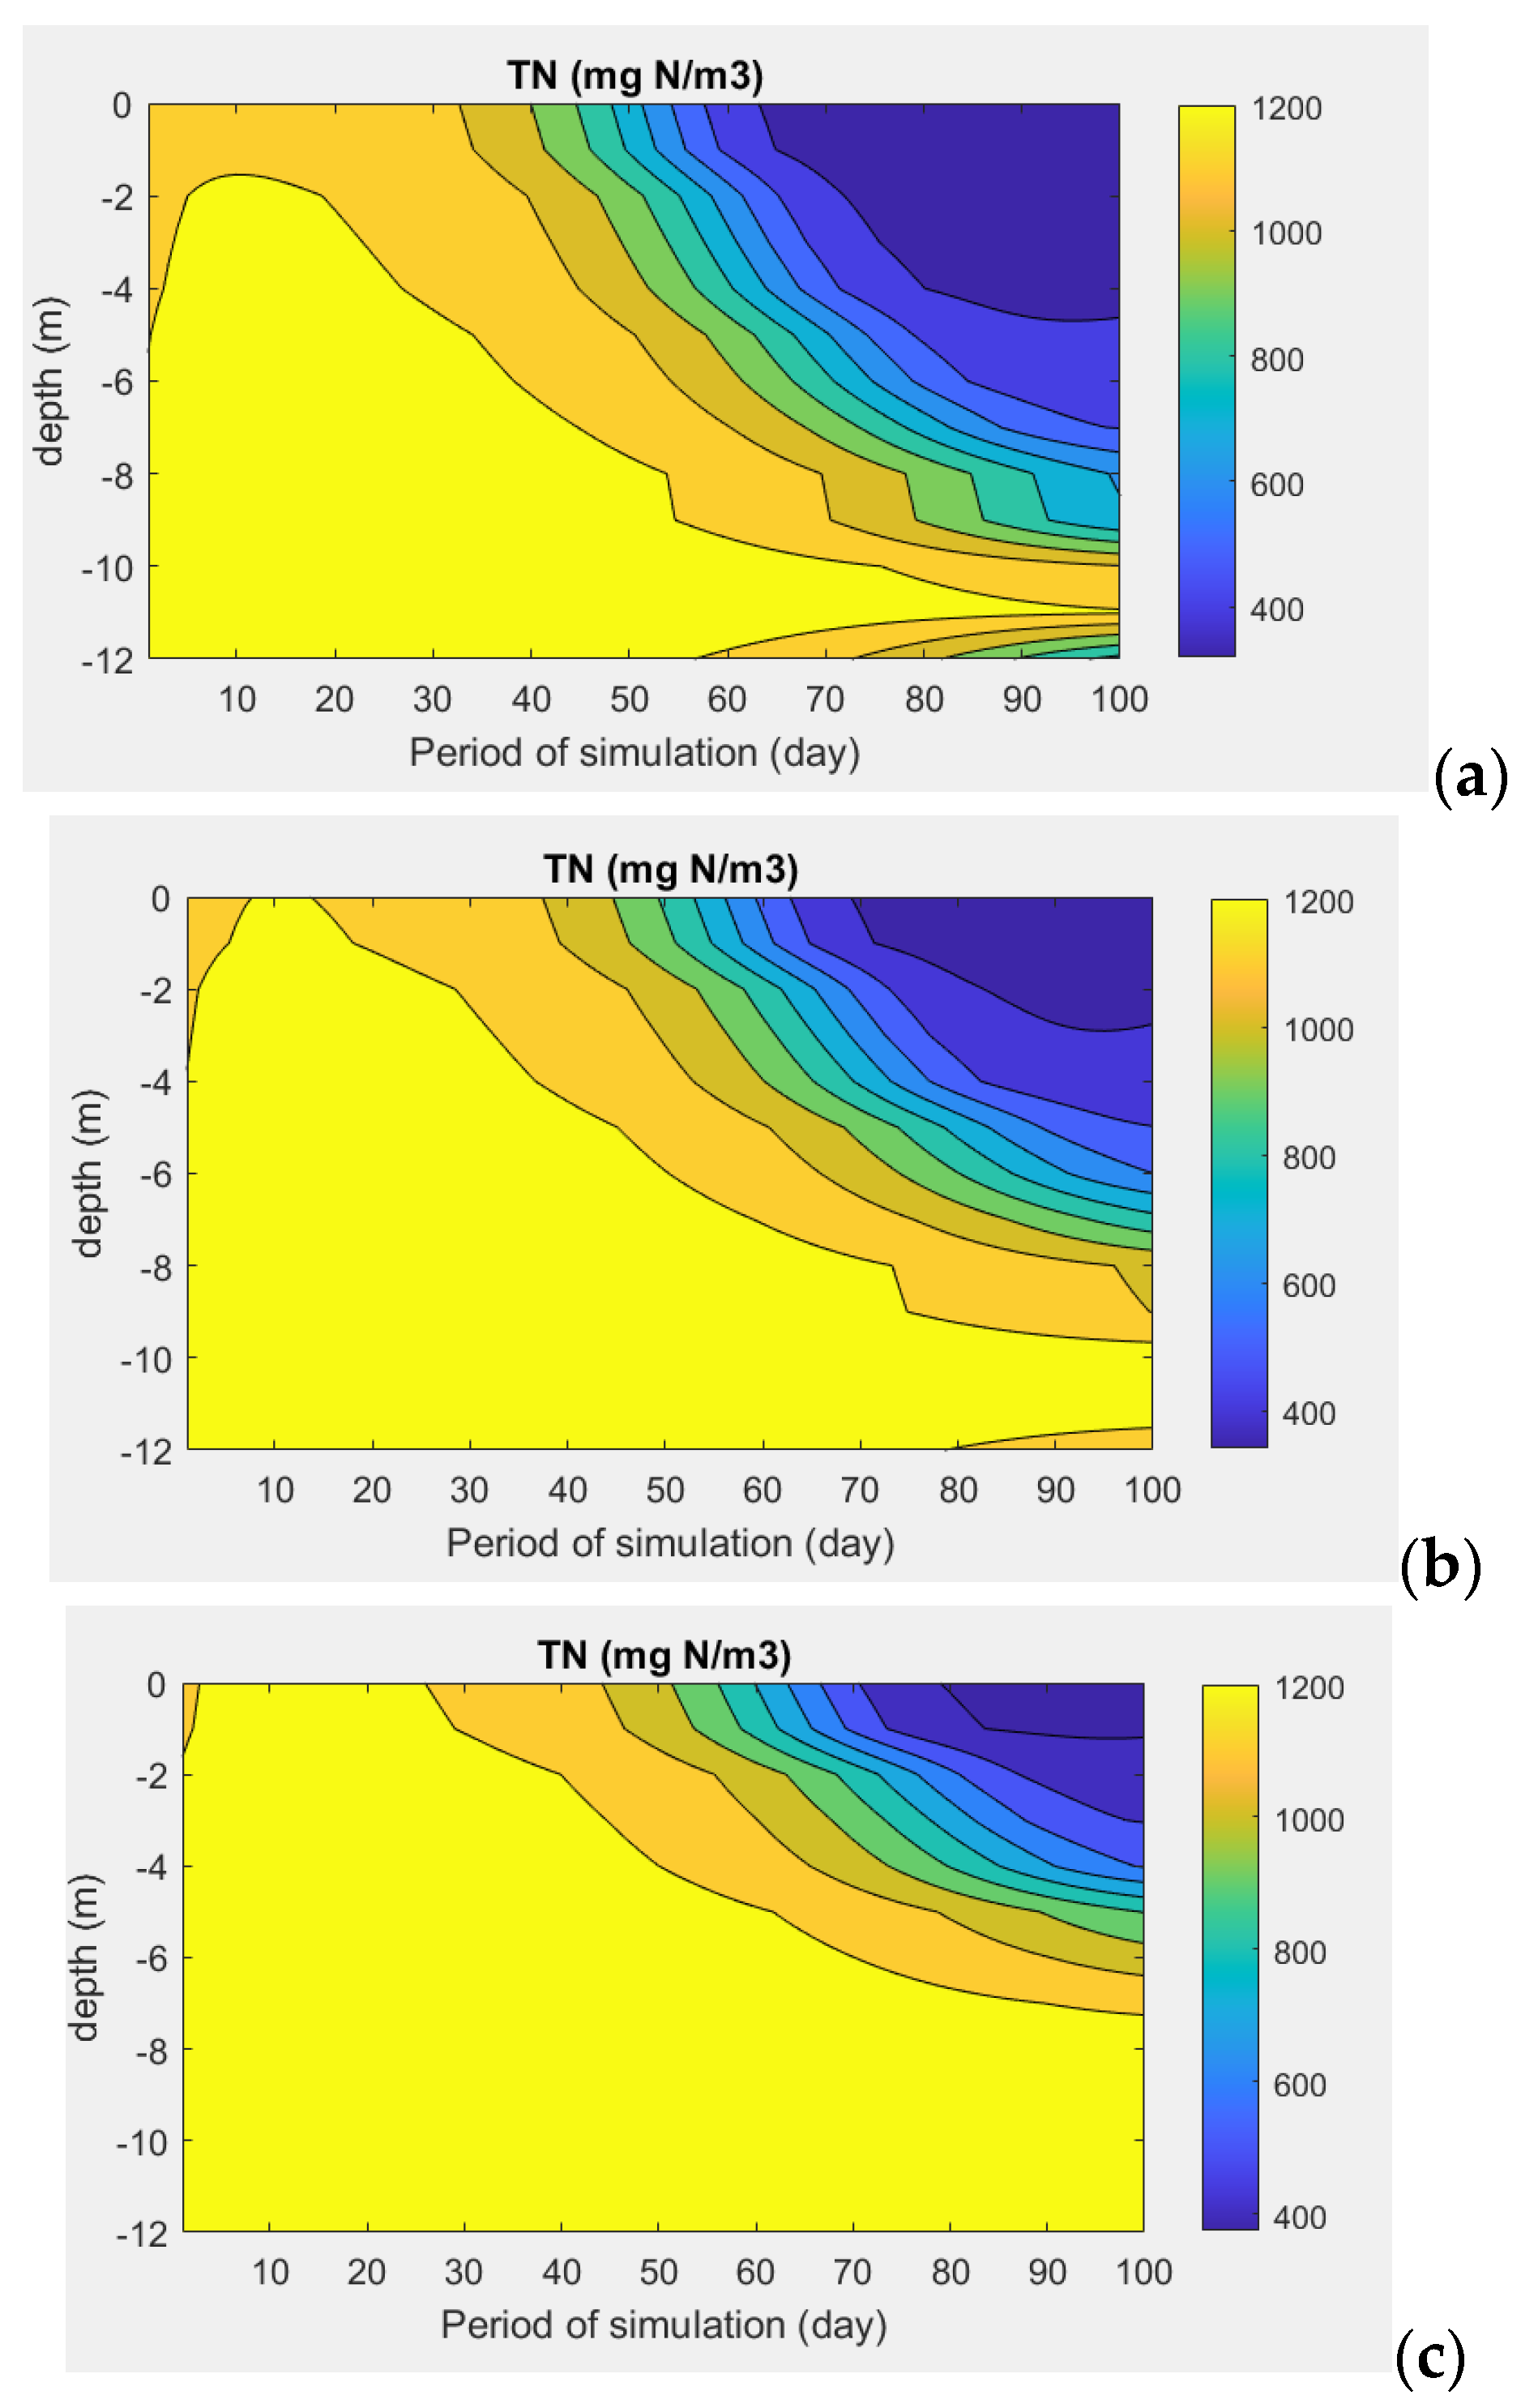
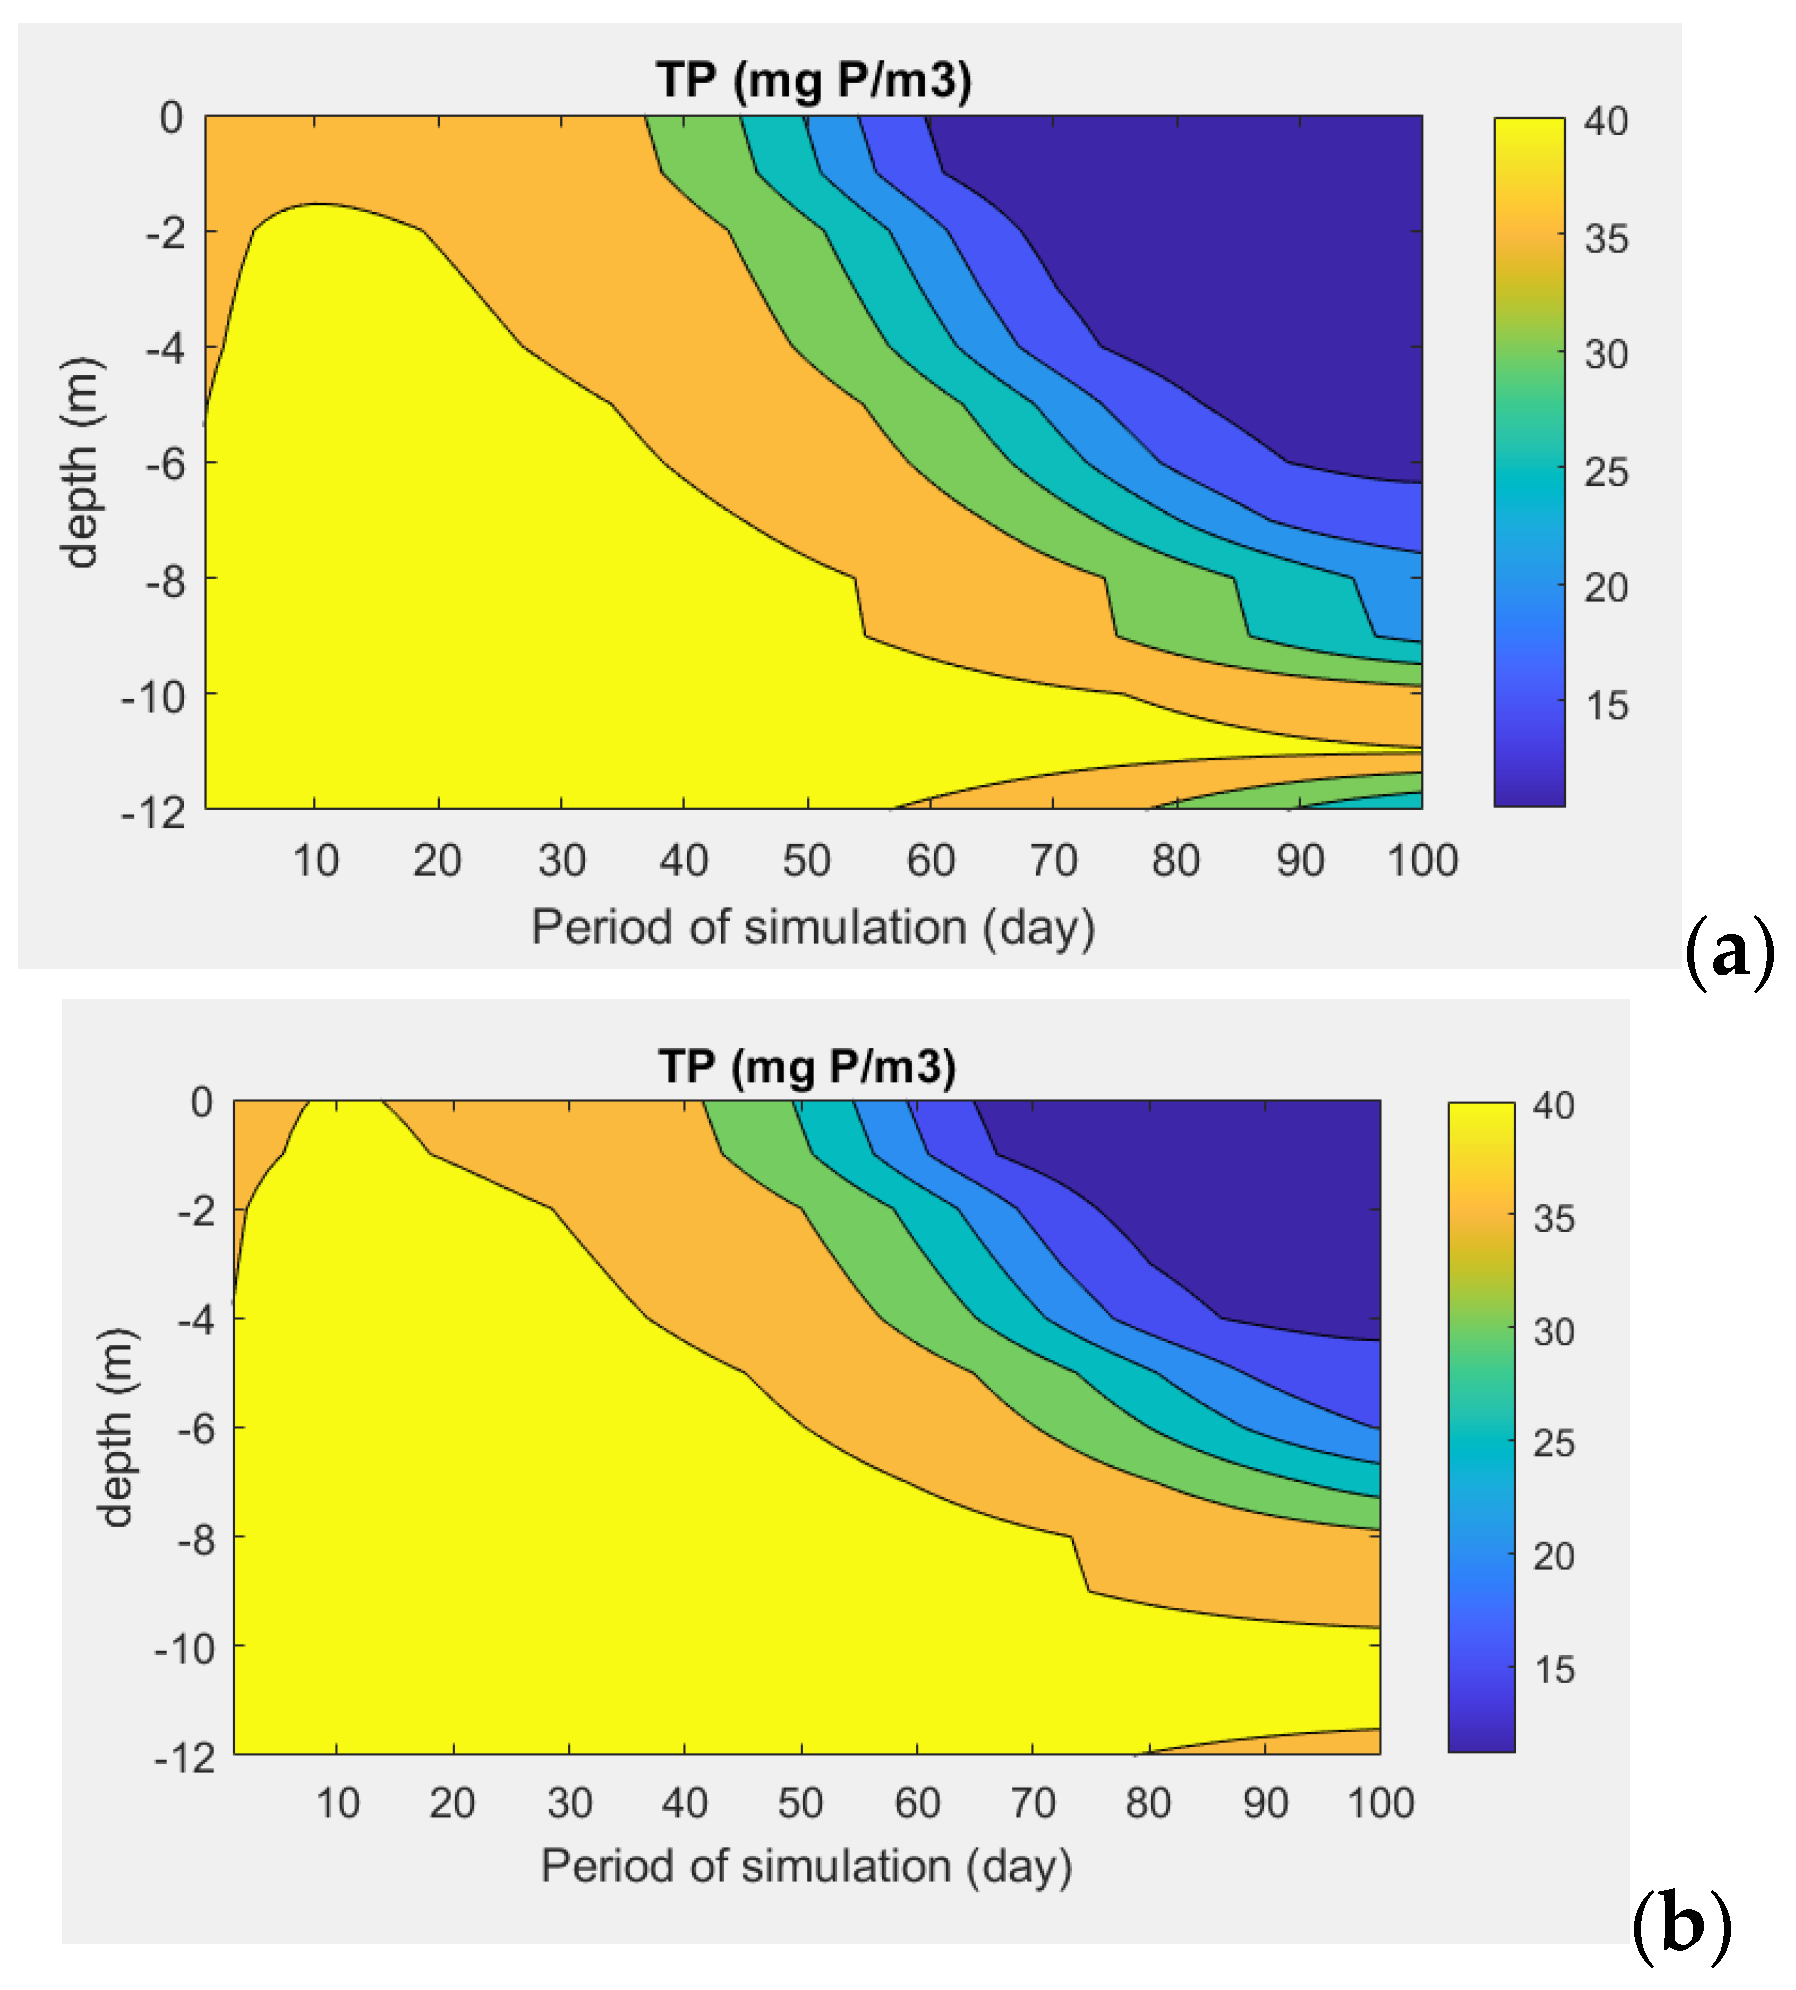
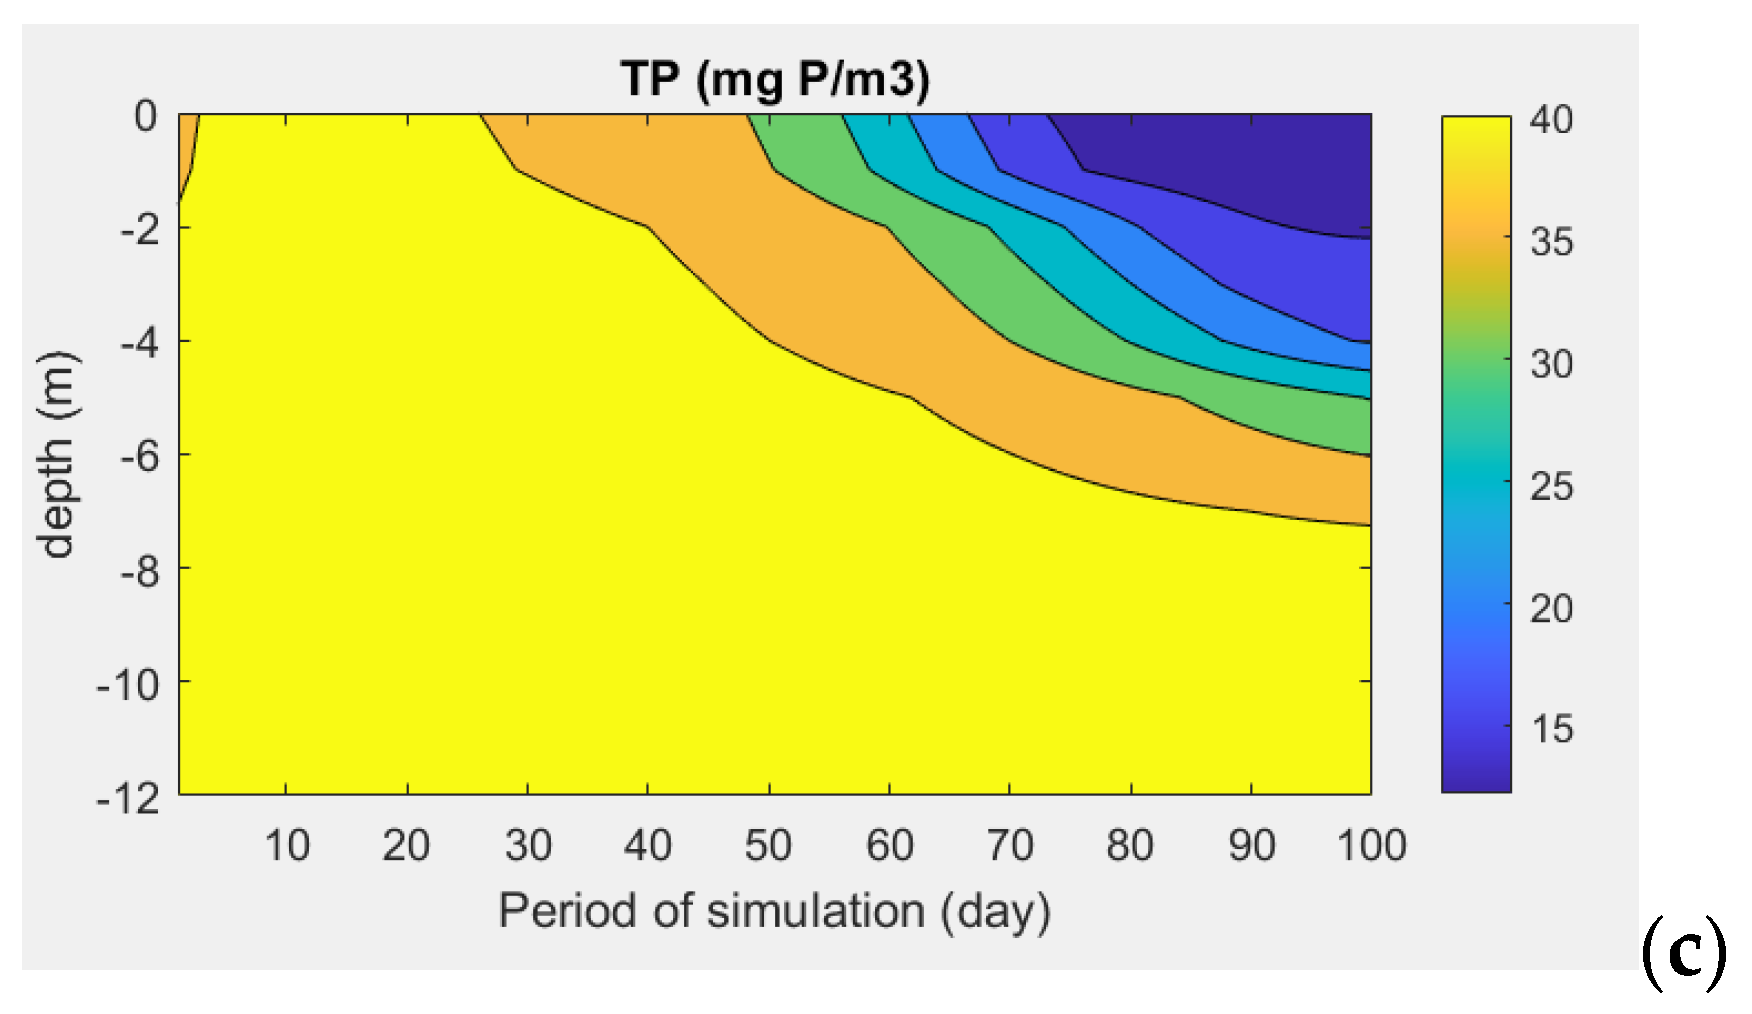
  • Upon analysing the deviations in the quality indicator values across the four scenarios relative to the hypothesis of the lake not being covered by FPV panels, it is obvious that the reservoir water temperature and the phytoplankton biomass values diminish as the coverage degree grows, whereas the nutrient concentration values indicate a slight increase. A drop in the temperature values is predicted (between almost 2% and 10%, depending on the scenario), as well as a diminishment of the concentration of phytoplankton, ranging from 13% up to 50%. In terms of nutrients, an increase in their concentrations is expected, obviously in connection with the decrease in the phytoplankton concentration. Thus, the nitrogen and phosphorus concentrations will increase by between 4% and 15%.
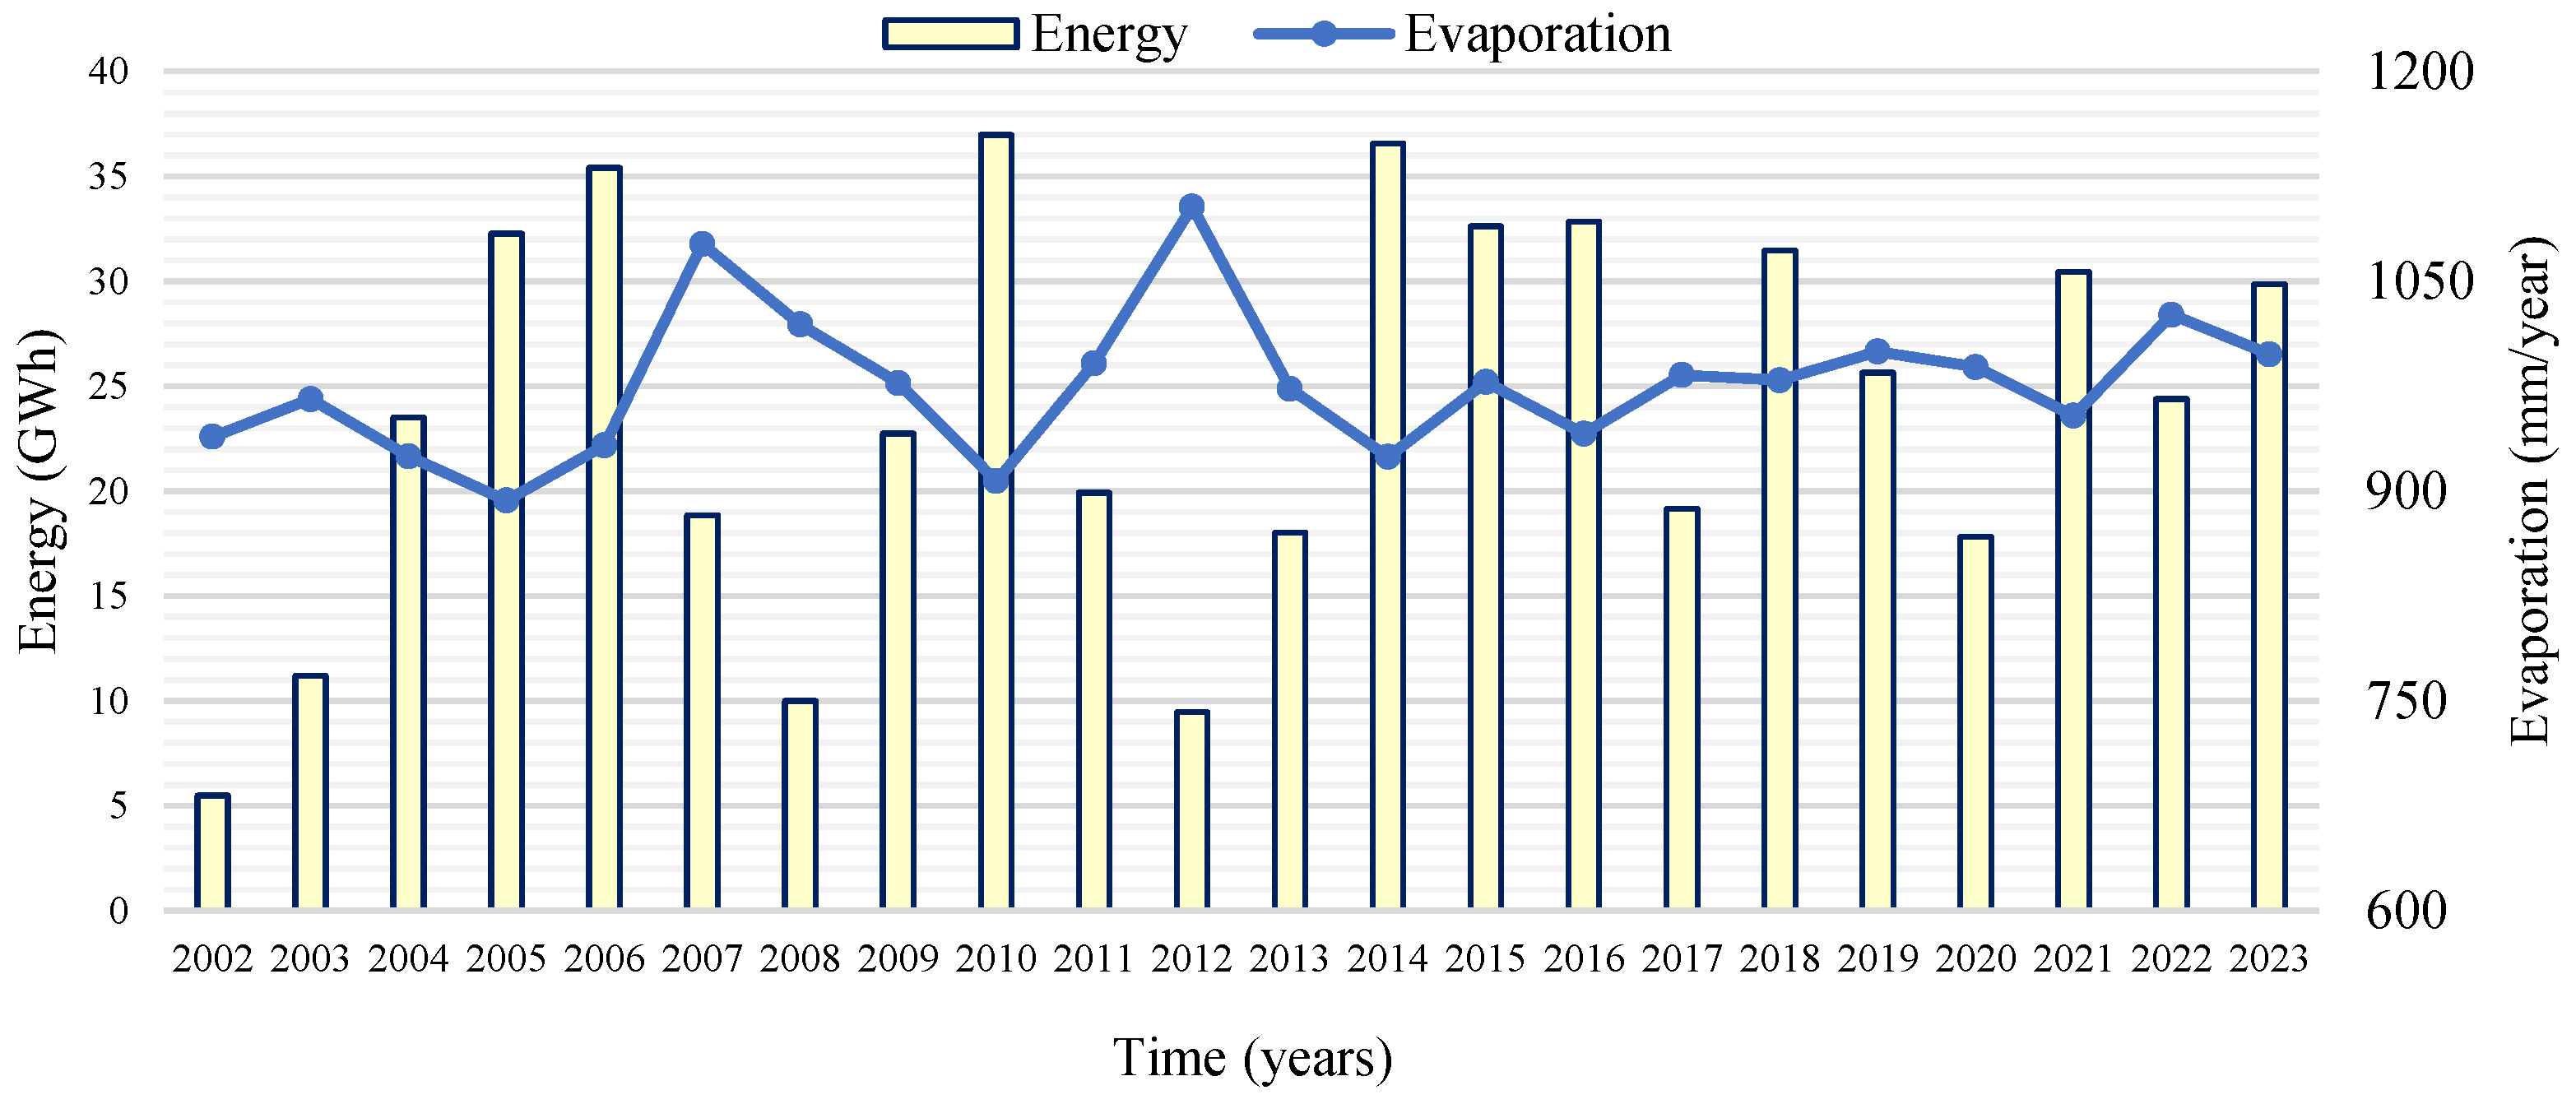
  • The proposed solution would generate between almost 80 and 340 GWh/year.
  • Depending on the analysed scenario, covering the reservoir’s surface with FPV panels will reduce evaporative water losses from the reservoir by 70 to 380 Mm3/year.
  • The placement of FPV panels on the surface of the Mihăilești HPP Reservoir will contribute to GHG reductions of between 15 and 66 tCO2e/year.
This paper summarises the research conducted, promoting the consideration of FPV systems as a clean and sustainable alternative for energy production and for improving the resilience and sustainability of water ecosystems regarding reservoir eutrophication and the pronounced impacts of climate change. Nevertheless, the use of a simple modelling tool and the neglect of factors concerning the algae’s affinity for nutrients, as well as the grazing rate of zooplankton on the algal biomass, may lead to an overestimation of the current results if the primary aim is to preserve the original ecological environment. Future studies should prioritise on-site evaluations of FPV projects to elucidate their environmental effects, with systematic monitoring initiatives for reservoir water quality indicators and the CO2 emissions produced by the water body.

Author Contributions

Conceptualisation, L.I.V. and G.E.D.; methodology, B.P.; software, G.E.D.; validation, G.E.D., L.I.V. and B.P.; formal analysis, L.I.V.; investigation, E.C.P.; resources, R.E.I.; writing—original draft preparation, G.E.D., L.I.V. and B.P.; writing—review and editing, G.E.D., L.I.V. and B.P.; visualisation, G.E.D. and L.I.V. All authors have read and agreed to the published version of the manuscript.

Funding

This work was supported by a grant from the National Program for Research of the National Association of Technical Universities—GNAC ARUT 2023.

Data Availability Statement

The data presented in this study are available on request.

Acknowledgments

The data regarding the FPV systems and maps were obtained from “Global Solar Atlas 2.0”, a free, web-based application that is developed and operated by the company Solargis s.r.o. on behalf of the World Bank Group, utilizing Solargis data, with funding provided by the Energy Sector Management Assistance Program (ESMAP). For additional information, https://globalsolaratlas.info (access on 15 April 2025).

Conflicts of Interest

The authors declare no conflicts of interest.

Abbreviations

The following abbreviations are used in this manuscript:
FPVfloating photovoltaic
GHGgreenhouse gas
HPPhydropower plant
NARWNational Administration “Romanian Waters”
DOdissolved oxygen (mg/L)
TNtotal nitrogen (mg/m3)
TPtotal phosphorus (mg/m3)
Ttemperature (°C)
Aphytoplanktonic biomass (mg/m3)
K(z)vertical diffusion coefficient (m2/s)
wvertical velocity (m/s)
Scross-sectional area (m2)
RSsource term due to surface-atmosphere exchanges (W/m2)
ρwater density (kg/m3)
Cpspecific heat (J/kg°C)
growth(T,TP,TN)growth term for phytoplankton
loss(T)losses term by respiration and mortality for phytoplankton

References

  1. Venturini, P.; Gagliardi, G.G.; Agati, G.; Cedola, L.; Migliarese Caputi, M.V.; Borello, D. Integration of Floating Photovoltaic Panels with an Italian Hydroelectric Power Plant. Energies 2024, 17, 851. [Google Scholar] [CrossRef]
  2. Haasa, J.; Kalinghi, J.; A. de la Fuente, S.U.; Gerbersdorf, W.; Po-Jung Chen, N. Floating photovoltaic plants: Ecological impacts versus hydropower operation flexibility. Energy Convers. Manag. 2020, 206, 112414. [Google Scholar] [CrossRef]
  3. Exley, G.; Armstrong, A.; Page, T.; Jones, I.D. Floating photovoltaics could mitigate climate change impacts on water body temperature and stratification. Solar Energy 2021, 219, 24–33. [Google Scholar] [CrossRef]
  4. Ramanan, C.J.; Lim, K.H.; Kurnia, J.C.; Roy, S.; Bora, B.J.; Medhi, B.J. Towards sustainable power generation: Recent advancements in floating photovoltaic technologies. Renew. Sustain. Energy Rev. 2024, 194, 114322. [Google Scholar]
  5. Ilgen, K.; Schindler, D.; Wieland, S.; Jens Lange, J. The impact of foating photovoltaic power plants on lake water temperature and stratification. Sci. Rep. 2023, 13, 7932. [Google Scholar] [CrossRef]
  6. Da Silva, G.D.P.; Branco, D.A.C. Is floating photovoltaic better than conventional photovoltaic? Assessing environmental impacts. Impact Assess. Proj. Apprais. 2018, 36, 390–400. [Google Scholar] [CrossRef]
  7. Almeida, R.M.; Schmitt, R.; Grodsky, S.M.; Flecker, A.S.; Gomes, C.P.; Zhao, L.; Liu, H.; Barros, N.; Kelman, R.; McIntyre, P.B. Floating solar power could help fight climate change—Let’s get it right. Nature 2022, 606, 246–249. [Google Scholar] [CrossRef] [PubMed]
  8. Almeida,  R.M.; Chowdhury, A.U.H. Offsetting the greenhouse gas footprint of hydropower with floating solar photovoltaics. Nat. Sustain. 2024, 7, 1102–1106. [Google Scholar] [CrossRef]
  9. Nobre, R.; Rocha, S.M.; Healing, S.; Ji, Q.; Boulêtreau, S.; Armstrong, A.; Cucherousset, J. A global study of freshwater coverage by floating photovoltaics. Solar Energy 2024, 267, 112244. [Google Scholar] [CrossRef]
  10. Oliveira, P.M.B.; Almeida, R.M.; Cardoso, S.J. Effects of floating photovoltaics on aquatic organisms: A review. Hydrobiologia 2024, 852, 3155–3170. [Google Scholar] [CrossRef]
  11. Rocha, S.M.; Armstrong, A.; Thackeray, S.J.; Hernandez, R.R.; Folkard, A.M. Environmental impacts of floating solar panels on freshwater systems and their techno-ecological synergies. Environ. Res. Infrastruct. Sustain. 2024, 4, 042002. [Google Scholar] [CrossRef]
  12. Nobre, R.L.G.; Vagnon, C.; Boulêtreau, S.; Colas, F.; Azeman, F.; Tudesque, L.; Parthuisot, N.; Millet, P.; Cucherousset, J. Floating photovoltaics strongly reduce water temperature: A whole-lake experiment. J. Environ. Manag. 2025, 375, 124230. [Google Scholar] [CrossRef] [PubMed]
  13. Li, P.; Gao, X.; Li, Z.; Zhou, X. Physical analysis of the environmental impacts of fishery complementary photovoltaic power plant. Environ. Sci. Pollut. Res. 2022, 29, 46108–46117. [Google Scholar] [CrossRef] [PubMed]
  14. Nobre, R.; Boulêtreau, S.; Colas, F.; Azeman, F.; Tudesque, L.; Parthuisot, N.; Favriou, P.; Cucherousset, J. Potential ecological impacts of floating photovoltaics on lake biodiversity and ecosystem functioning. Renew. Sustain. Energy Rev. 2023, 188, 113852. [Google Scholar] [CrossRef]
  15. Ray, N.E.; Holgerson, M.A.; Grodsky, S.M. Immediate effect of floating solar energy deployment on greenhouse gas dynamics in ponds. Environ. Sci. Technol. 2024, 58, 22104–22113. [Google Scholar] [CrossRef]
  16. Armstrong, A.; Page, T.; Thackeray, S.J.; Hernandez, R.R.; Jones, I.D. Integrating environmental understanding into freshwater floatovoltaic deployment using an effects hierarchy and decision trees. Environ. Res. Lett. 2020, 15, 114055. [Google Scholar] [CrossRef]
  17. Wang, T.W.; Chang, P.H.; Hung, Y.S.; Lin, T.S.; Yang, S.D.; Yeh, S.L.; Tung, C.H.; Kuo, S.R.; Lai, H.T.; Chen, C.C. Effects of floating photovoltaic systems on water quality of aquaculture ponds. Aquacult. Res. 2022, 53, 1304–1315. [Google Scholar] [CrossRef]
  18. Forester, E.; Levin, M.O.; Thorne, J.H.; Armstrong, A.; Pasquale, G.; Di Blasi, M.L.V.; Scott, T.A.; Hernandez, R.R. Siting considerations for floating solar photovoltaic energy: A systematic review. Renew. Sustain. Energy Rev. 2025, 211, 115360. [Google Scholar] [CrossRef]
  19. Mekonnen, M.M.; Hoekstra, A.Y. The water footprint of electricity from hydropower. Hydrol. Earth Syst. Sci. 2012, 16, 179–187. [Google Scholar] [CrossRef]
  20. Vrînceanu, A.; Dumitrașcu, M.; Kucsicsa, G. Site suitability for photovoltaic farms and current investment in Romania. Renew. Energy 2022, 187, 320–330. [Google Scholar] [CrossRef]
  21. Mâciu, M.; Nicolescu, N.C.; Șuteu, V. Small Encyclopedic Dictionary; Scientific and Encyclopedic Press: Bucharest, Romania, 1986. (In Romanian) [Google Scholar]
  22. Kakoulaki, G.; Sanchez, R.G.; Amillo, A.G.; Szabo, S.; De Felice, M.; Farinosi, F.; De Felice, L.; Bisselink, B.; Seliger, R.; Kougias, I.; et al. Benefits of Pairing Floating Solar Photovoltaics with Hydropower Reservoirs in Europe. Renew. Sustain. Energy Rev. 2023, 171, 112989. [Google Scholar] [CrossRef]
  23. Yönet, N.; Gurbuz, B.; Gokce, A. An alternative numerical approach for an improved ecological model of interconnected lakes with a fixed pollutant. Comp. Appl. Math. 2023, 42, 56. [Google Scholar] [CrossRef]
  24. Khaliq, I.; Ramampiandra, E.C.; Vorburger, C.; Narwani, A.; Schuwirth, N. The effect of water temperature changes on biological water quality assessment. Ecol. Ecol. Indic. 2024, 159, 111652. [Google Scholar] [CrossRef]
  25. Bonnet, M.P.; Poulin, M.; Devaux, J. Numerical modeling of thermal stratification in a lake reservoir. Methodology and case study, Aquat. Sci. 2000, 62, 105–124. [Google Scholar] [CrossRef]
  26. Popa, R. Water Quality Modelling for River Systems; H*G*A* Publishing: Bucharest, Romania, 1998; p. 495. (In Romanian) [Google Scholar]
  27. Kim, T.; Sheng, Y.P. Estimation of Water Quality Model Parameters. KSCE J. Civ. Eng. 2010, 14, 421–437. [Google Scholar] [CrossRef]
  28. Manolache, A.I.; Andrei, G.; Rusu, L. An Evaluation of the Efficiency of the Floating Solar Panels in the Western Black Sea and the Razim-Sinoe Lagunar System. J. Mar. Sci. Eng. 2023, 11, 203. [Google Scholar] [CrossRef]
  29. Rodríguez-Gallegos, C.D.; Gandhi, O.; Sun, H.; Paton, C.; Zhang, J.; Ali, J.M.Y.; Alvarez-Alvarado, M.S.; Zhang, W.; Rodríguez-Gallegos, C.A.; Chua, L.H.C.; et al. Global floating PV status and potential. Prog. Energy 2025, 7, 015001. [Google Scholar] [CrossRef]
  30. Ravichandran, N.; Ravichandran, N.; Panneerselvam, B. Floating photovoltaic system for Indian artificial reservoirs—An effective approach to reduce evaporation and carbon emission. Int. J. Environ. Sci. Technol. 2022, 19, 7951–7968. [Google Scholar] [CrossRef]
  31. Dumitran, G.E.; Vuta, L.I. Study on Lake Izvorul Muntelui rehabilitation. Simul. Model. Pract. Theory 2011, 19, 1235–1242. [Google Scholar] [CrossRef]
  32. Dumitran, G.E.; Vuta, L.I.; Damian, R. Eutrophication modelling of Golesti reservoir in Romania. Environ. Eng. Manag. J. 2012, 11, 1821–1829. [Google Scholar] [CrossRef]
  33. Dumitran, G.E.; Vuta, L.I.; Panaitescu, V.A. The eutrophication model and its application to Roşu Lake- Romania, in Advances Environmental and Geological Science and Engineering. In Proceedings of the 3rd International Conference on Environmental and Geological Science and Engineering, Constanta, Romania, 3–5 September 2010; pp. 73–80. [Google Scholar]
Figure 1. The Argeș catchment and the plans for the development of the lower course of the Argeș River, with a navigable connection between Bucharest and the Danube River (the red colour indicates the unrealised objectives).
Hydrology 12 00157 g001
Figure 2. (a) A map of Romania showing the direct normal irradiation and the Mihăilești Reservoir’s location and shape; (b) Mihăilești Dam.
Hydrology 12 00157 g002
Figure 3. The annual evaporation and energy production for the Mihăilești HPP.
Hydrology 12 00157 g003
Figure 4. The variation in the measured indicators for the Mihăilești Reservoir, as reported by NARW: (a) temperature, DO, and phytoplankton; (b) nutrients (TN and TP).
Hydrology 12 00157 g004
Figure 5. The trophic classification of the Mihăilești Reservoir based on the phytoplankton concentration.
Hydrology 12 00157 g005
Figure 6. The trophic classification of the Mihăilești Reservoir based on the nutrient concentrations: (a) TN; (b) TP.
Hydrology 12 00157 g006
Figure 7. (a) The solar path for the FPV system Mihăilești; (b) a map of Romania showing the specific photovoltaic power output.
Hydrology 12 00157 g007
Figure 8. The total FPV energy generation for the 4 scenarios for the following coverage rates: 5, 10, 15, and 20%.
Hydrology 12 00157 g008
Figure 9. Temperature variation for the analysed scenarios: (a) without FPV panels; (b) 10% FPV panel coverage rate; (c) 20% FPV panel coverage rate.
Hydrology 12 00157 g009
Figure 10. The variation in the phytoplankton biomass for the analysed scenarios: (a) without FPV panels; (b) 10% FPV panel coverage rate; (c) 20% FPV panel coverage rate.
Hydrology 12 00157 g010
Figure 11. The variation in the total phosphorus for the analysed scenarios: (a) without FPV panels; (b) 10% FPV panel coverage rate; (c) 20% FPV panel coverage rate.
Hydrology 12 00157 g011
Figure 12. The variation in the total nitrogen for the analysed scenarios: (a) without FPV panels; (b) 10% FPV panel coverage rate; (c) 20% FPV panel coverage rate.
Hydrology 12 00157 g012aHydrology 12 00157 g012b
Figure 13. The evolution of the quality indicators for the different FPV panel coverage scenarios: (a) the increase of TN and TP concentrations; (b) the decreasing of temperature and phytoplankton.
Hydrology 12 00157 g013
Table 1. Characteristics of the Mihăilești HPP.
ParameterValue
Longitude44.32979 DD
Latitude25.905075 DD
Normal operating level86.5 MASL
Maximum dam height22 m
Reservoir mean height13 m
Reservoir surface1030 ha
Reservoir length8 km
Length of frontal and lateral dikes13.49 km
Maximum reservoir width3 km
Total reservoir volume99 × 106 m3
Attenuation reservoir volume46.3 × 106 m3
Dam length48 m
Net head18 m
Installed flow in the HPP58 m3/s
Installed capacity of the HPP8 MW
Energy generation of the HPP24 GWh/year
Table 2. Analysed scenarios for the surface covered by the FPV farm on the Mihăilești Reservoir.
ScenarioFPV Coverage Rate (%)FPV Surface (ha)
No. 1548
No. 21096
No. 315144
No. 420192
Table 3. Calibrated constants in the model.
SymbolDescriptionRange [27]Assigned Value
growthmaxMaximum phytoplankton growth rate0.5 to 200.75 day−1
ϑTNon-dimensional temperature multiplier0.02 to 1.060.0682
ksp PHalf saturation constant for phytoplankton P uptake0 to 105 mg∙m−3
ksp NHalf saturation constant for phytoplankton N uptake0 to 12015 mg∙m−3
βLight intensity coefficient10−3 to 10−20.002
coefreRespiration coefficient0 to 0.20.0175
krGrowth rate for algal biomass0 to 0.30.025
coefexretExcretion coefficient0 to 0.250.03
coefmortMortality coefficient0 to 0.20.2
εEfficiency factor0 to 0.80.6
apaPhosphorus/chlorophyll ratio in phytoplankton11 mg P∙mg Chla−1
czaPredation coefficient of algae by zooplankton0.00250.0025
anaNitrogen/chlorophyll ratio in phytoplankton11 mg N∙mg Chla−1
Table 4. The energetic performance of FPV farm for analysed scenarios for Mihăilești Reservoir.
ScenarioInstalled Capacity
(MWp)
Power Density
(MW/km2)
Annual Energy
(GWh/year)
No. 170145.8379.05
No. 2150156.25169.40
No. 3250173.611282.30
No. 4300156.25338.80
Table 5. The water savings and energy ratio corresponding to the FPV farm for the analysed scenarios for the Mihăilești Reservoir.
ScenarioDirect Water
Saving
Increase in Hydro PowerIndirect Water
Saving
Energy Ratio
(106 m3/Year)(MWh)%(106 m3/Year)
No. 10.4214.930.621.333.32
No. 20.8429.861.2522.877.10
No. 31.2644.791.8784.8711.84
No. 41.6959.722.5045.7414.21
Table 6. The modification of water quality in different scenarios of FPV panel coverage.
FPV
Coverage
Rate
0%5%10%15%20%
ValueValue%Value%Value%Value%
T
(°C)
18.1117.720.6217.29−4.5716.8−7.2516.25−10.27
TN
(mg/m3)
982.510221.251061.388.03110011.961137.5115.78
TP
(mg/m3)
32.68341.8835.348.1236.6412.1137.915.96
A
(mg/m3)
7.226.282.505.35−25.954.44−38.593.56−50.79
Table 7. The reduction in GHG emissions for different scenarios of FPV panel coverage.
ScenarioTotal Water Saving
(106 m3/year)
GHG Emission Reduction
Associated with FPV System
(tCO2e/year)
No. 11.7515,415
No. 23.7133,033
No. 36.0455,049
No. 47.4366,066
Disclaimer/Publisher’s Note: The statements, opinions and data contained in all publications are solely those of the individual author(s) and contributor(s) and not of MDPI and/or the editor(s). MDPI and/or the editor(s) disclaim responsibility for any injury to people or property resulting from any ideas, methods, instructions or products referred to in the content.

