1. Introduction
Dams offer great benefits to society, such as water storage for supplying demands, generation of hydropower electricity, flood control, and reservoirs for recreational uses [
1]. However, dams require a high safety level, as the human and economic losses caused by their failure could be catastrophic [
2].
European research programs, such as Horizon 2020, have prioritized flood risk protection and territory management in line with the Flood Directive 2007/60/EC. This directive mandates coordinated efforts among governments and institutions, such as basin authorities and civil protection agencies. Research initiatives focused on understanding flood dynamics, risk assessment, early warning systems, natural and structural defenses, and adaptation strategies, among others. The findings inform policies and actions to mitigate flood risks and protect communities and ecosystems, ensuring compliance with European legislation and fostering resilience against future challenges [
3]. According to the International Commission on Large Dams [
4], overtopping causes about 35% of all embankment dam failures. Therefore, it is crucial to correctly estimate flood design hydrographs in hydrological dam safety analyses. They are usually obtained by hydrometeorological approaches, using observed precipitation data and rainfall-runoff models, as observed streamflow time series are either unavailable or short at most sites [
5]. In addition, despite the greater availability of precipitation data than streamflow data, they are usually recorded at a daily scale, while sub-daily precipitation observations are scarce [
6].
In this context, the use of stochastic rainfall generators (SRGs) appears helpful to generate long sub-daily rainfall time series [
7,
8]. SRGs generally present a simple mathematical formulation and low computational costs. Therefore, large ensembles of long time series can be quickly obtained [
9]. Moreover, an SRG can be easily used for obtaining precipitation time series in changing conditions [
10] that can be representative of future rainfall in a changing climate on hydrological scales, which are finer than the spatial and time scale supplied by Regional Climate Models (RCMs). More specifically, RCM outputs are mainly available on a daily scale and are averaged over large spatial resolutions, so they require additional statistical downscaling or bias correction methods for including them in hydrological analyses [
11,
12]. Only very recent RCM outputs regarded high resolutions (hourly) and small spatial scales [
13,
14]. As dam spillways are usually designed for high return periods (for example, 500–10,000 years in Spain) and observed precipitation data time series are usually in the order of 50 years, SGRs can reduce the uncertainties associated with such large return period estimates.
A variety of approaches for rainfall simulation were introduced in the last twenty years [
15,
16,
17]. A summary is available in [
18], where a performance comparison is provided.
In addition, recent studies indicate that climate change has modified the magnitude and timing of floods in Europe [
19]. The number of floods exceeding certain severity and magnitude thresholds increased in the period 1985–2009 [
20]. Furthermore, climate projections point to an increase in flood magnitude and frequency in some areas [
21]. Therefore, several studies have been carried out recently to assess the expected influence of climate change on floods, although they are usually focused on either monthly or annual time scales [
22]. However, few studies have analyzed the impact of climate change on extreme events, such as floods. Giuntoli et al. (2015) identified future changes in the frequency of high flows on a global scale [
23]. Dankers et al. (2014) found an increasing trend in the 30-year return level of the 5-day mean peak flow at half of the grid points considered at the global scale [
24]. Roudier et al. (2016) found that the 10- and 100-year floods will increase over most of Europe [
25]. In Europe, the frequency of flood magnitudes above the 100-year flood quantiles is expected to double within three decades [
26]. Lehner et al. (2006) also studied the change in 100-year flood recurrence, finding that northern to northeastern Europe are the regions most prone to a rise in flood frequencies [
27].
In Spain, there are more than 1200 large dams. Therefore, Spain is the European Union country with the highest number of dams, as well as the fifth in the world. Consequently, assessing the influence of climate change on hydrological dam safety is a crucial concern in this country. In Spain, there are two sources of climate change projections: (i) the data provided by the Spanish Met Office (AEMET, Agencia Estatal de Meteorología in Spanish) and (ii) the projections provided by the Coordinated Regional Climate Downscaling Experiment (CORDEX) [
28]. Garijo et al. (2018) observed that the CORDEX precipitation projections perform better for studies focused on extreme events than the AEMET projections in Spain, which tend to smooth extremes in time series of precipitation projections [
29]. Therefore, the climate change projections provided by CORDEX will be used in this study, as dam design floods are usually associated with extreme events.
SRGs have been used in recent years to downscale global climate model results [
30,
31] and to increase the temporal resolution of climate change data [
32]. In addition, SRGs have also been used to generate synthetic rainfall time series to assess hydrological dam safety [
33,
34,
35]. However, SRGs cannot supply information on the physical phenomenon in flood events. Therefore, such results are improved by coupling SRGs with rainfall-runoff models, as catchment response in flood events can be calibrated with observations.
This study presents a methodology to assess how climate change could affect hydrological dam safety in the future by using a stochastic rainfall generator, a continuous rainfall-runoff model, and a method to identify the best operation of spillway gates in a dam. Influence of climate change on hydrological dam safety is limited to expected changes in precipitation. Possible changes in land uses, such as changes in urbanization extents, deforestation or reforestation, are not considered in the study.
The methodology is applied to the Eugui Dam in Spain. The structure of the paper is as follows. First, a description of models, a case study and available data used in the study is presented. Then, the results of the maximum reservoir water levels obtained with the previous procedure are commented. Finally, conclusions are presented.
2. Models
Three models are used in this study. First, the STORAGE stochastic rainfall generation model [
36] that is based on the Neymann–Scott Rectangular Pulse Model. This model allows for simulation of long synthetic rainfall time series at several sub-daily scales. Second, the COSMO4SUB model is used for simulating rainfall-runoff processes. It is a continuous model, tailored for small and ungauged basins, that uses a high-resolution digital terrain model (DTM), land use data and precipitation data generated by the STORAGE model as input data. It can generate continuous runoff time series as output data from which annual maximum hydrographs can be extracted. Finally, the Volumetric Evaluation Method (MEV) [
37] is used to simulate the operation of the spillway gates in flood events. The MEV method specifies when the gates should be opened and closed to keep the dam safe and reach the target final reservoir water level.
2.1. STORAGE
The STORAGE (STOchastic RAinfall Generation) model is an SRG model that can generate long and high-resolution rainfall time series based on observations at rain-gauging stations, both in stationary and changing climate contexts. STORAGE is a modified version of the basic Neyman–Scott Rectangular Pulses (NSRP) SRG model that is characterized by two main innovations compared with the NSRP SRG model. First, the parameter estimation is carried out by using a set of data time series (annual maximum rainfall, annual and monthly cumulative rainfall, and annual number of wet days), which are usually longer than observed high-resolution time series that are commonly considered for the calibration of SRGs. A day is considered wet when rainfall is higher than 1 mm. Second, the seasonality is modeled using a series of goniometric functions. This approach makes STORAGE strongly parsimonious with respect to basic versions of NSRP models, in which a user should estimate a specific parametric set for each month or season. For specific details of the STORAGE model, the reader can refer to [
36]. The current version of the STORAGE model has a limitation in simulating synthetic rainfall time series for periods of 500 years.
The STORAGE model has been applied under changing climate conditions by using a set of climate change projections. The STORAGE model parameters are derived from the given 30-year periods in such climate projections, in which stationarity is assumed. Time series for periods of 500 years are simulated, composing any 30-year ensemble.
2.2. COSMO4SUB
COSMO4SUB (Continuous Simulation Model For Small and Ungauged Basin) [
38,
39] is a continuous rainfall-runoff model that is composed of three modules: (i) the rainfall simulation; (ii) the excess rainfall estimation; (iii) the transformation of excess rainfall into runoff.
COSMO4SUB is a simplified rainfall-runoff model that aims at reproducing rainfall-runoff transformation processes in small catchments that are characterized by either small concentration or response times. Slow processes like baseflow, evaporation and snow are not considered in the model. Therefore, the continuous transformation is limited to the surface runoff, which is estimated by applying the curve number method. The antecedent moisture condition is estimated based on the cumulative rainfall in the five days preceding a given rainfall event. COSMO4SUB is based on the instantaneous unit hydrograph (IUH) theory. Consequently, rainfall should be homogeneous within the catchment. Therefore, COSMO4SUB can be applied to small catchments, usually with a contributing area smaller than 200 km2.
The rainfall simulation module uses sub-daily precipitation time series that can be obtained from either observations, if data recorded at gauging stations are available, or from synthetic time series generated by models like STORAGE. In this study, the rainfall time series previously generated by the STORAGE model will be used as input data.
For the excess rainfall estimation module, the continuous version of Curve Number (CN) for Green-Ampt (CN4GA) was adopted. CN4GA is a mixed and automatic approach combining the empirical equation of the NRCS CN method [
40] and the Green-Ampt physically based infiltration equation [
41]. CN4GA parameters are essentially the Curve Number (CN) in the AMC-II condition at the catchment, which considers an average soil moisture content at the beginning of the storm, and the rainfall event separation time (Ts), which basically represents the dry (or almost dry) period that should be waited between two storms so that the initial abstraction becomes effective again. In this study, a Ts value of 24 h is considered. The continuous CN4GA procedure is able to automatically assess the AMC condition for a given event based on the amount of rainfall occurred in the five antecedent days, modifying the CN-II value for an average soil moisture condition into either CN-I (dry soil) or CN-III (wet soil) according to the original formulation of the CN method [
41].
In the third and last step, the excess rainfall concentration and diffusion processes are simulated by applying the WFIUH (Width Function-Based Instantaneous Unit Hydrograph), which is automatically calculated from DTM flow paths and from the time of concentration (tc) estimate, which characterizes the response time in the catchment, allowing determining its flow travel time distribution. In detail, in each hillslope cell, the surface flow velocity is calculated based on slope and land cover employing empirical formulas. Conversely, in the river network cells the surface flow velocity is calibrated ensuring that the projection of the WFIUH center of mass on the temporal axis is equal to the catchment lag time, which is expressed as 60% of tc.
The application of COSMO4SUB allows for simulating long streamflow time series. In this study, we selected the annual maximum peak discharges, reconstructing the relationship between peak discharge and return period.
2.3. Volumetric Evaluation Method
The Volumetric Evaluation Method (VEM) aims to identify the decision on the operation of spillway gates from the data available in real time. The inflow hydrograph, reservoir curve, and existing dam freeboard available at the given time step are considered as input. The method is based on three assumptions: (i) the outflow has to be equal or lower than the inflow, (ii) increasing inflows will increase outflows, and (iii) the higher the reservoir water level, the higher the increase percentage of outflow with respect to inflow.
The application of the model is iterative in each time step and can be used on a general scale without the need for any other type of control. It is valid for any reservoir. The method provides the outflow from the reservoir water level, ensuring the best utilization of the available freeboard from the existing data at every time step. The method starts by calculating the number of time steps that would be needed to fill the reservoir given the current inflow and reservoir storage (Equation (1)).
where
n is the number of time steps to fill the reservoir,
I is the inflow,
O is the outflow,
Sa is the available storage volume to the dam freeboard, and ∆
t is the time step.
The outflow in each time step is then obtained with Equation (2)
where
Ot is the outflow at time step
t,
Ot−1 is the outflow at time step
t − 1, ∆
O is the increase in outflow between time steps
t and
t − 1,
Sa is the available storage volume to the dam freeboard, and ∆
t is the time step.
The method calculates the outflow to be discharged at the next time step depending on the inflow hydrograph and reservoir water level. The method considers if the inflow hydrograph is in its rising limb and the inflow discharge is increasing or in its descending limb and the inflow discharge is decreasing. In addition, the method considers two options for the reservoir water level: (i) the reservoir is filling and the reservoir water level is increasing, and (ii) the reservoir is emptying and the reservoir water level is decreasing. Depending on the situation in which the reservoir is at a given time step, in terms of the inflow hydrograph and water reservoir level changes at the last time step, a condition is applied to Equation (2) to obtain the outflow in such a time step [
37] (Girón et al., 1988).
3. Case Study and Data
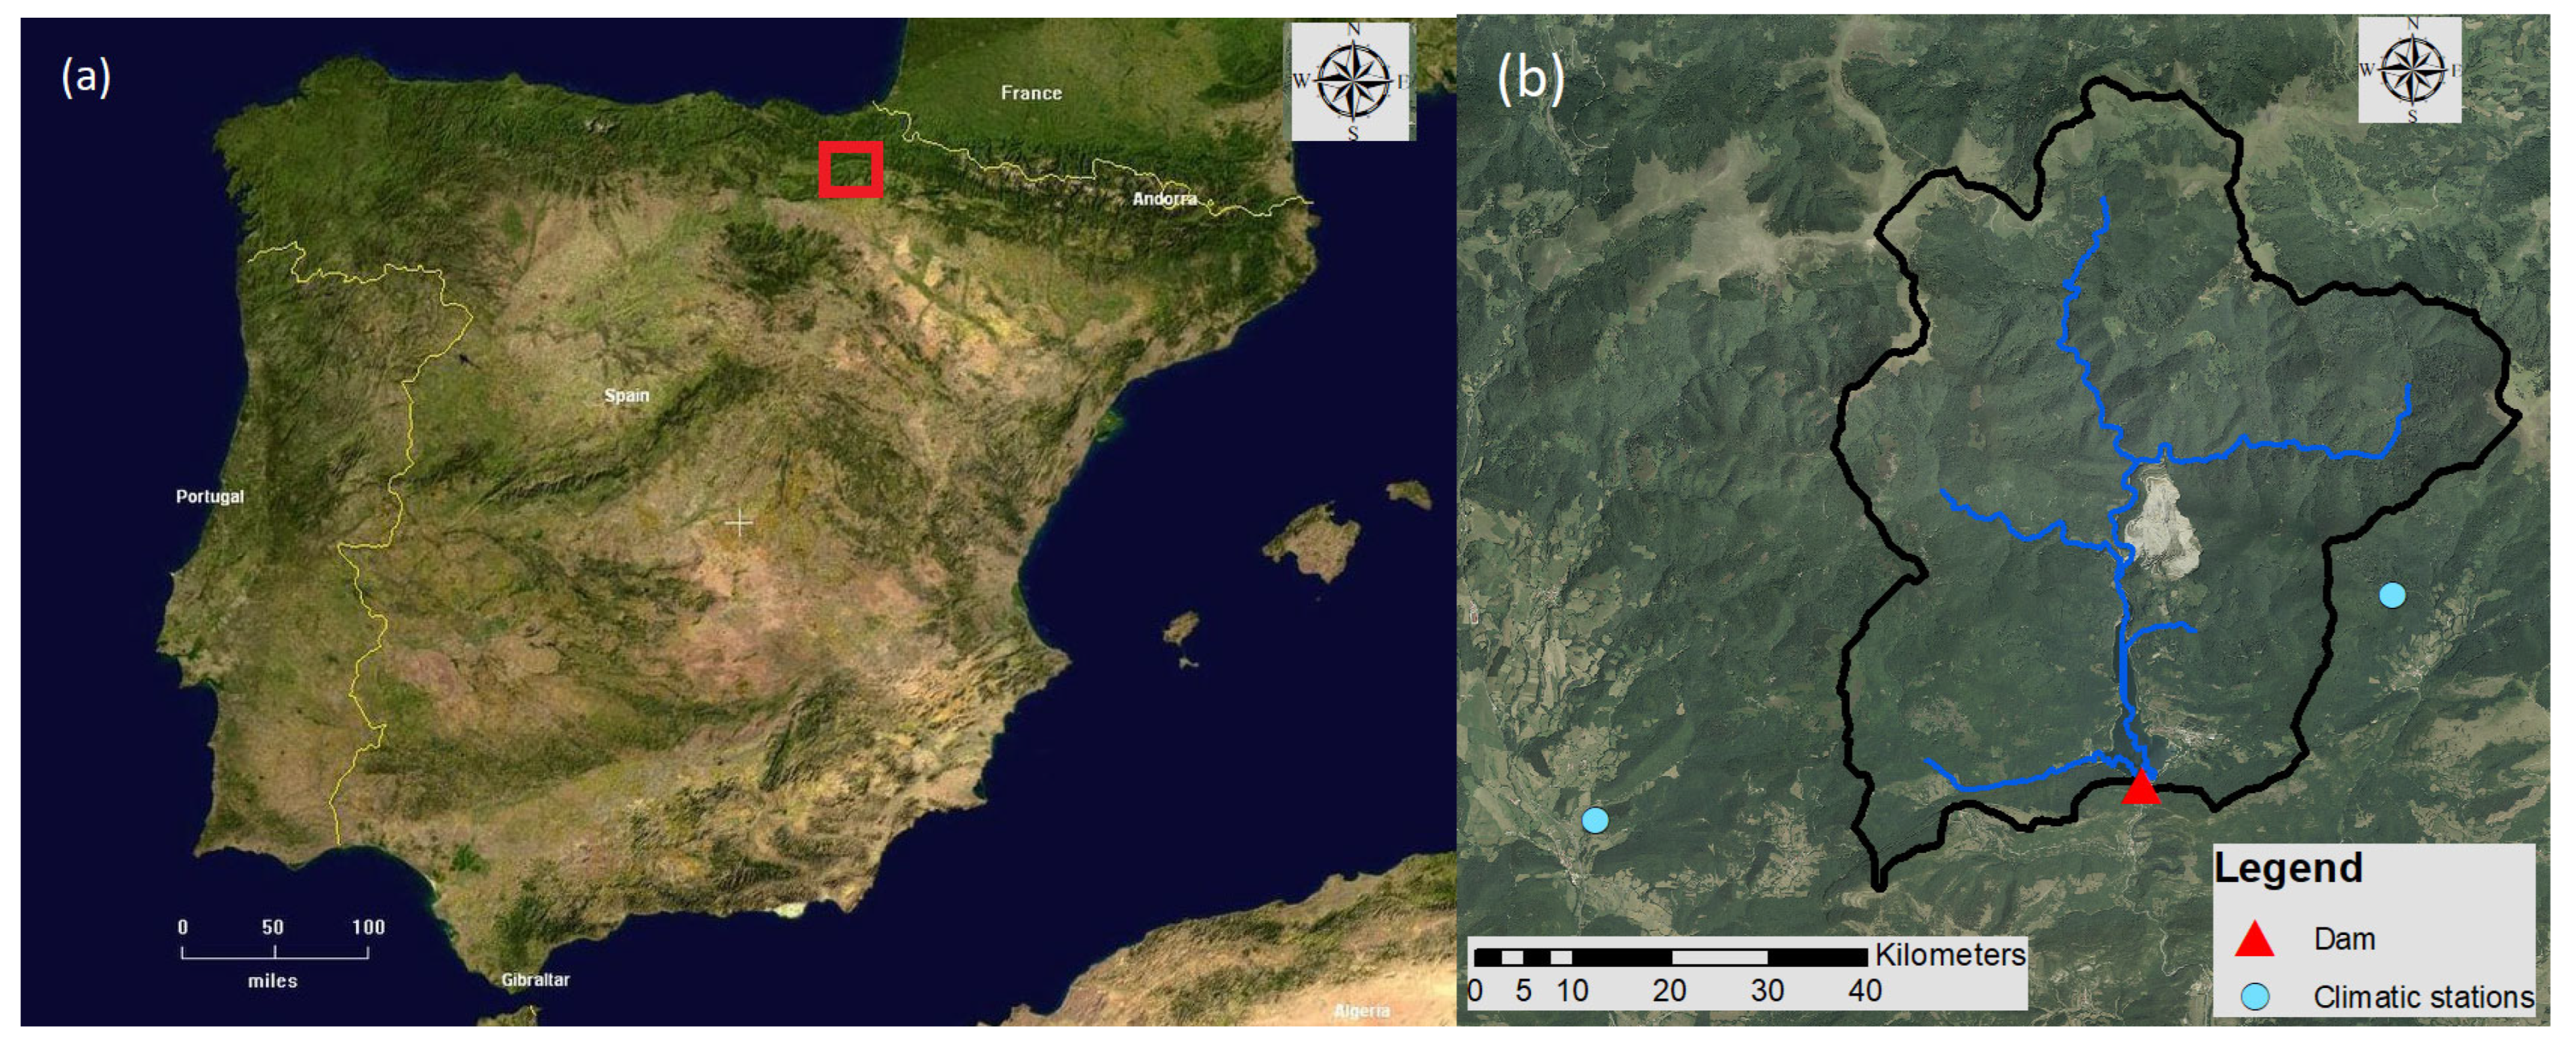
The Eugui Dam has been selected as case study, given it has a small–medium catchment size, its data availability and its importance regarding water supply and flood defense in the downstream city of Pamplona. It is located in the region of Navarre in northern Spain (
Figure 1). The dam is on the Arga River, which belongs to the Ebro River Basin Authority. The draining catchment area of the Eugui Reservoir is 69 km
2. The reservoir at the top of its conservation pool has a volume of 22 hm
3 and an area of 123 ha. It is a concrete dam with a height of 51 m and a crest length of 252 m that was built in 1972. Its foundation elevation is 579 m a.s.l. The dam spillway is operated by gates with a maximum capacity of 270 m
3/s.
The observed streamflow data required for COSMO4SUB model calibration were obtained from a 15-min gauging station located at the dam that provides reservoir water levels and outflow releases from the dam. Therefore, inflow discharges can be obtained by applying mass conservation. In the dam, there is also a rain-gauging station that provides 15-min data that has also been used to perform the calibration of the STORAGE and the COSMO4SUB models. These data were supplied by the Ebro real-time SAIH system. The 2008–2020 period is used for the calibration.
The Spanish National Geographic Institute (IGN, Instituto Geográfico Nacional in Spanish) has provided a high-resolution DTM with a cell size of two meters that has been used as input data for the COSMO4SUB rainfall-runoff model. In addition, land-use data was also used to obtain the initial estimate of CN for the COSMO4SUB. In this study, land-use data have been supplied by the Corine Land Cover (CLC) 2018 [
42] (EEA, 2018). The initial values of CN are estimated based on CLC maps by using the model that implements linked look-up tables, according to the original CN formulation, land cover and CLC.
Climate change projections have been obtained from 12 GCM-RCM modeling chains of the EURO-CORDEX program (
Table 1). The projections are supplied in cells of 0.11°, four of which were used in this study (
Figure 1b). The reference period is 1971–2004 and the future period is 2011–2100. Three subperiods are considered in the future period: 2011–2040, 2041–2070 and 2071–2100. Climate projections used in the study consider two representative concentration pathways (RCP): RCP 4.5 and RCP 8.5.
4. Methodology
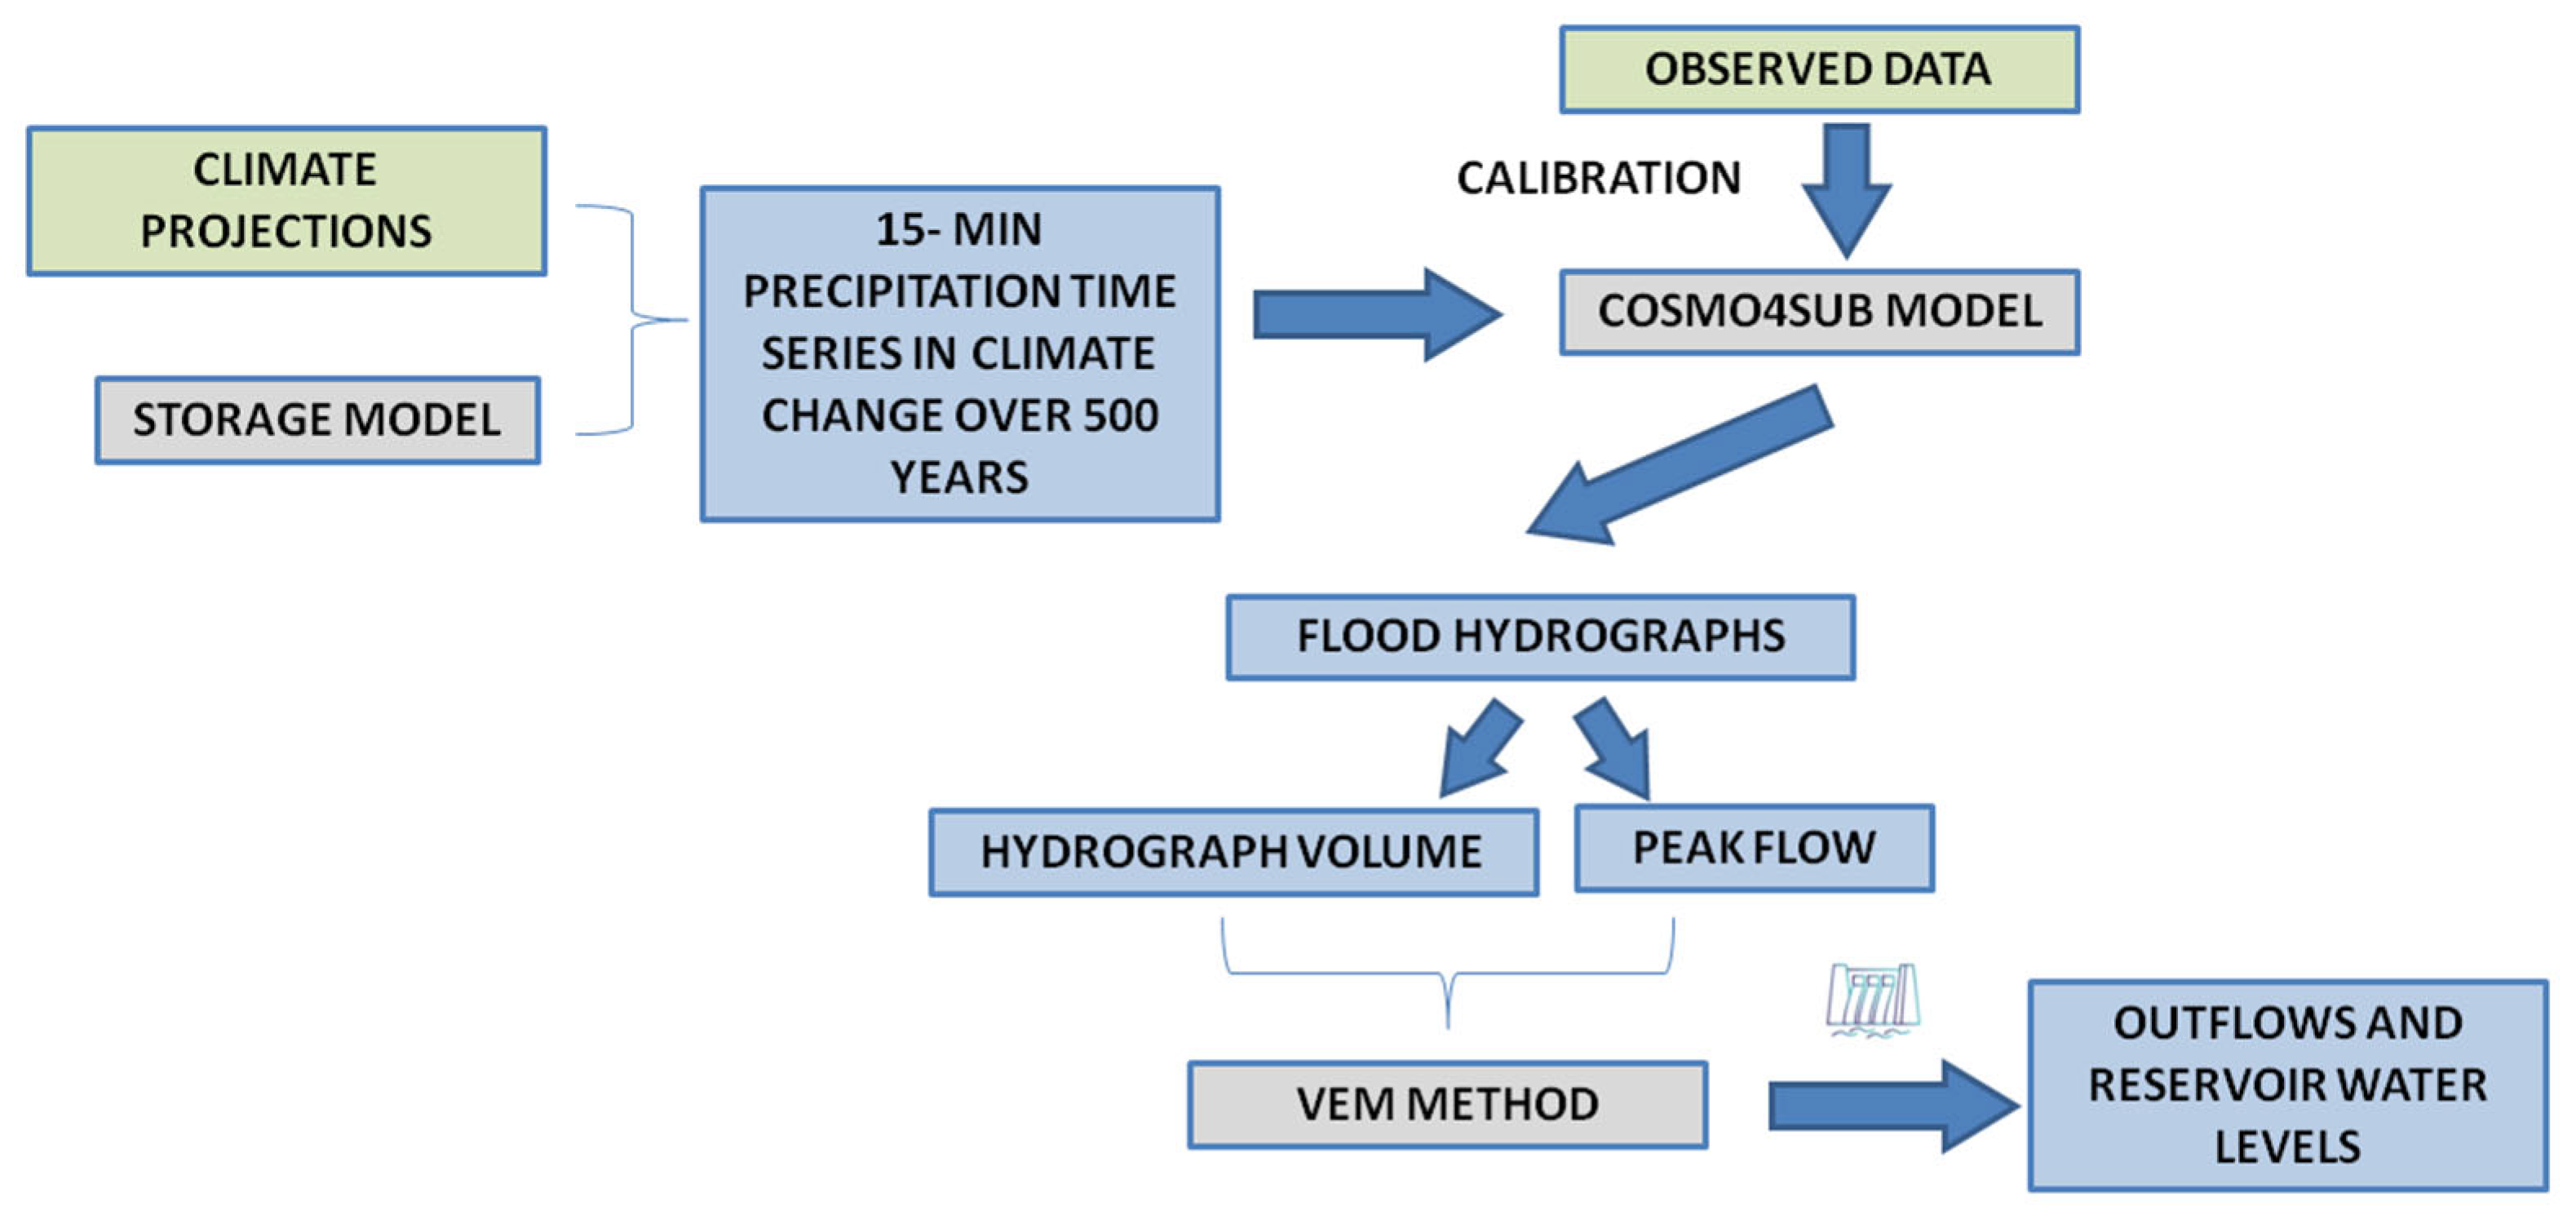
The methodology proposed to estimate the expected changes in hydrological dam safety due to climate change consists of four steps (
Figure 2): (i) stochastic rainfall generation of long time series with the STORAGE model by using climate change projections, (ii) calibration of the COSMO4SUB hydrological model, (iii) generation of flood hydrographs using the calibrated COSMO4SUB model with the rainfall time series generated by STORAGE as input data, and (iv) application of the VEM method to obtain the expected maximum water reservoir levels in flood events considering the effect of climate change.
4.1. Rainfall Generation with the STORAGE Model
Synthetic rainfall time series for a period of 500 years have been generated with a 15-min time step for each of the three subperiods considered in the future period (2011–2040, 2041–2070 and 2071–2100), based on climate change projections by using the STORAGE model. Rainfall is considered to be uniformly distributed in space throughout the catchment, as this is one of the hypotheses of the IUH method that is used in the COSMO4SUB model. In addition, the IUH method can be used in catchments with a contributing area smaller than 150–200 km2, such as the case of the Eugui Dam.
The STORAGE model is useful when high-resolution observed data is not available for model calibration, such as sub-daily time series of precipitation and streamflow. In these, cases, statistics like mean annual and seasonal precipitation and parameters of intensity-duration-frequency (IDF) curves related to given return periods can be used as input data of the STORAGE model. In this study, climate change projections have a daily scale and the sub-daily parameters of the STORAGE model cannot be calibrated. Therefore, sub-daily parameters have not been considered. Only the parameters with a temporal scale equal or greater than daily have been introduced: mean annual precipitation (MAP) (
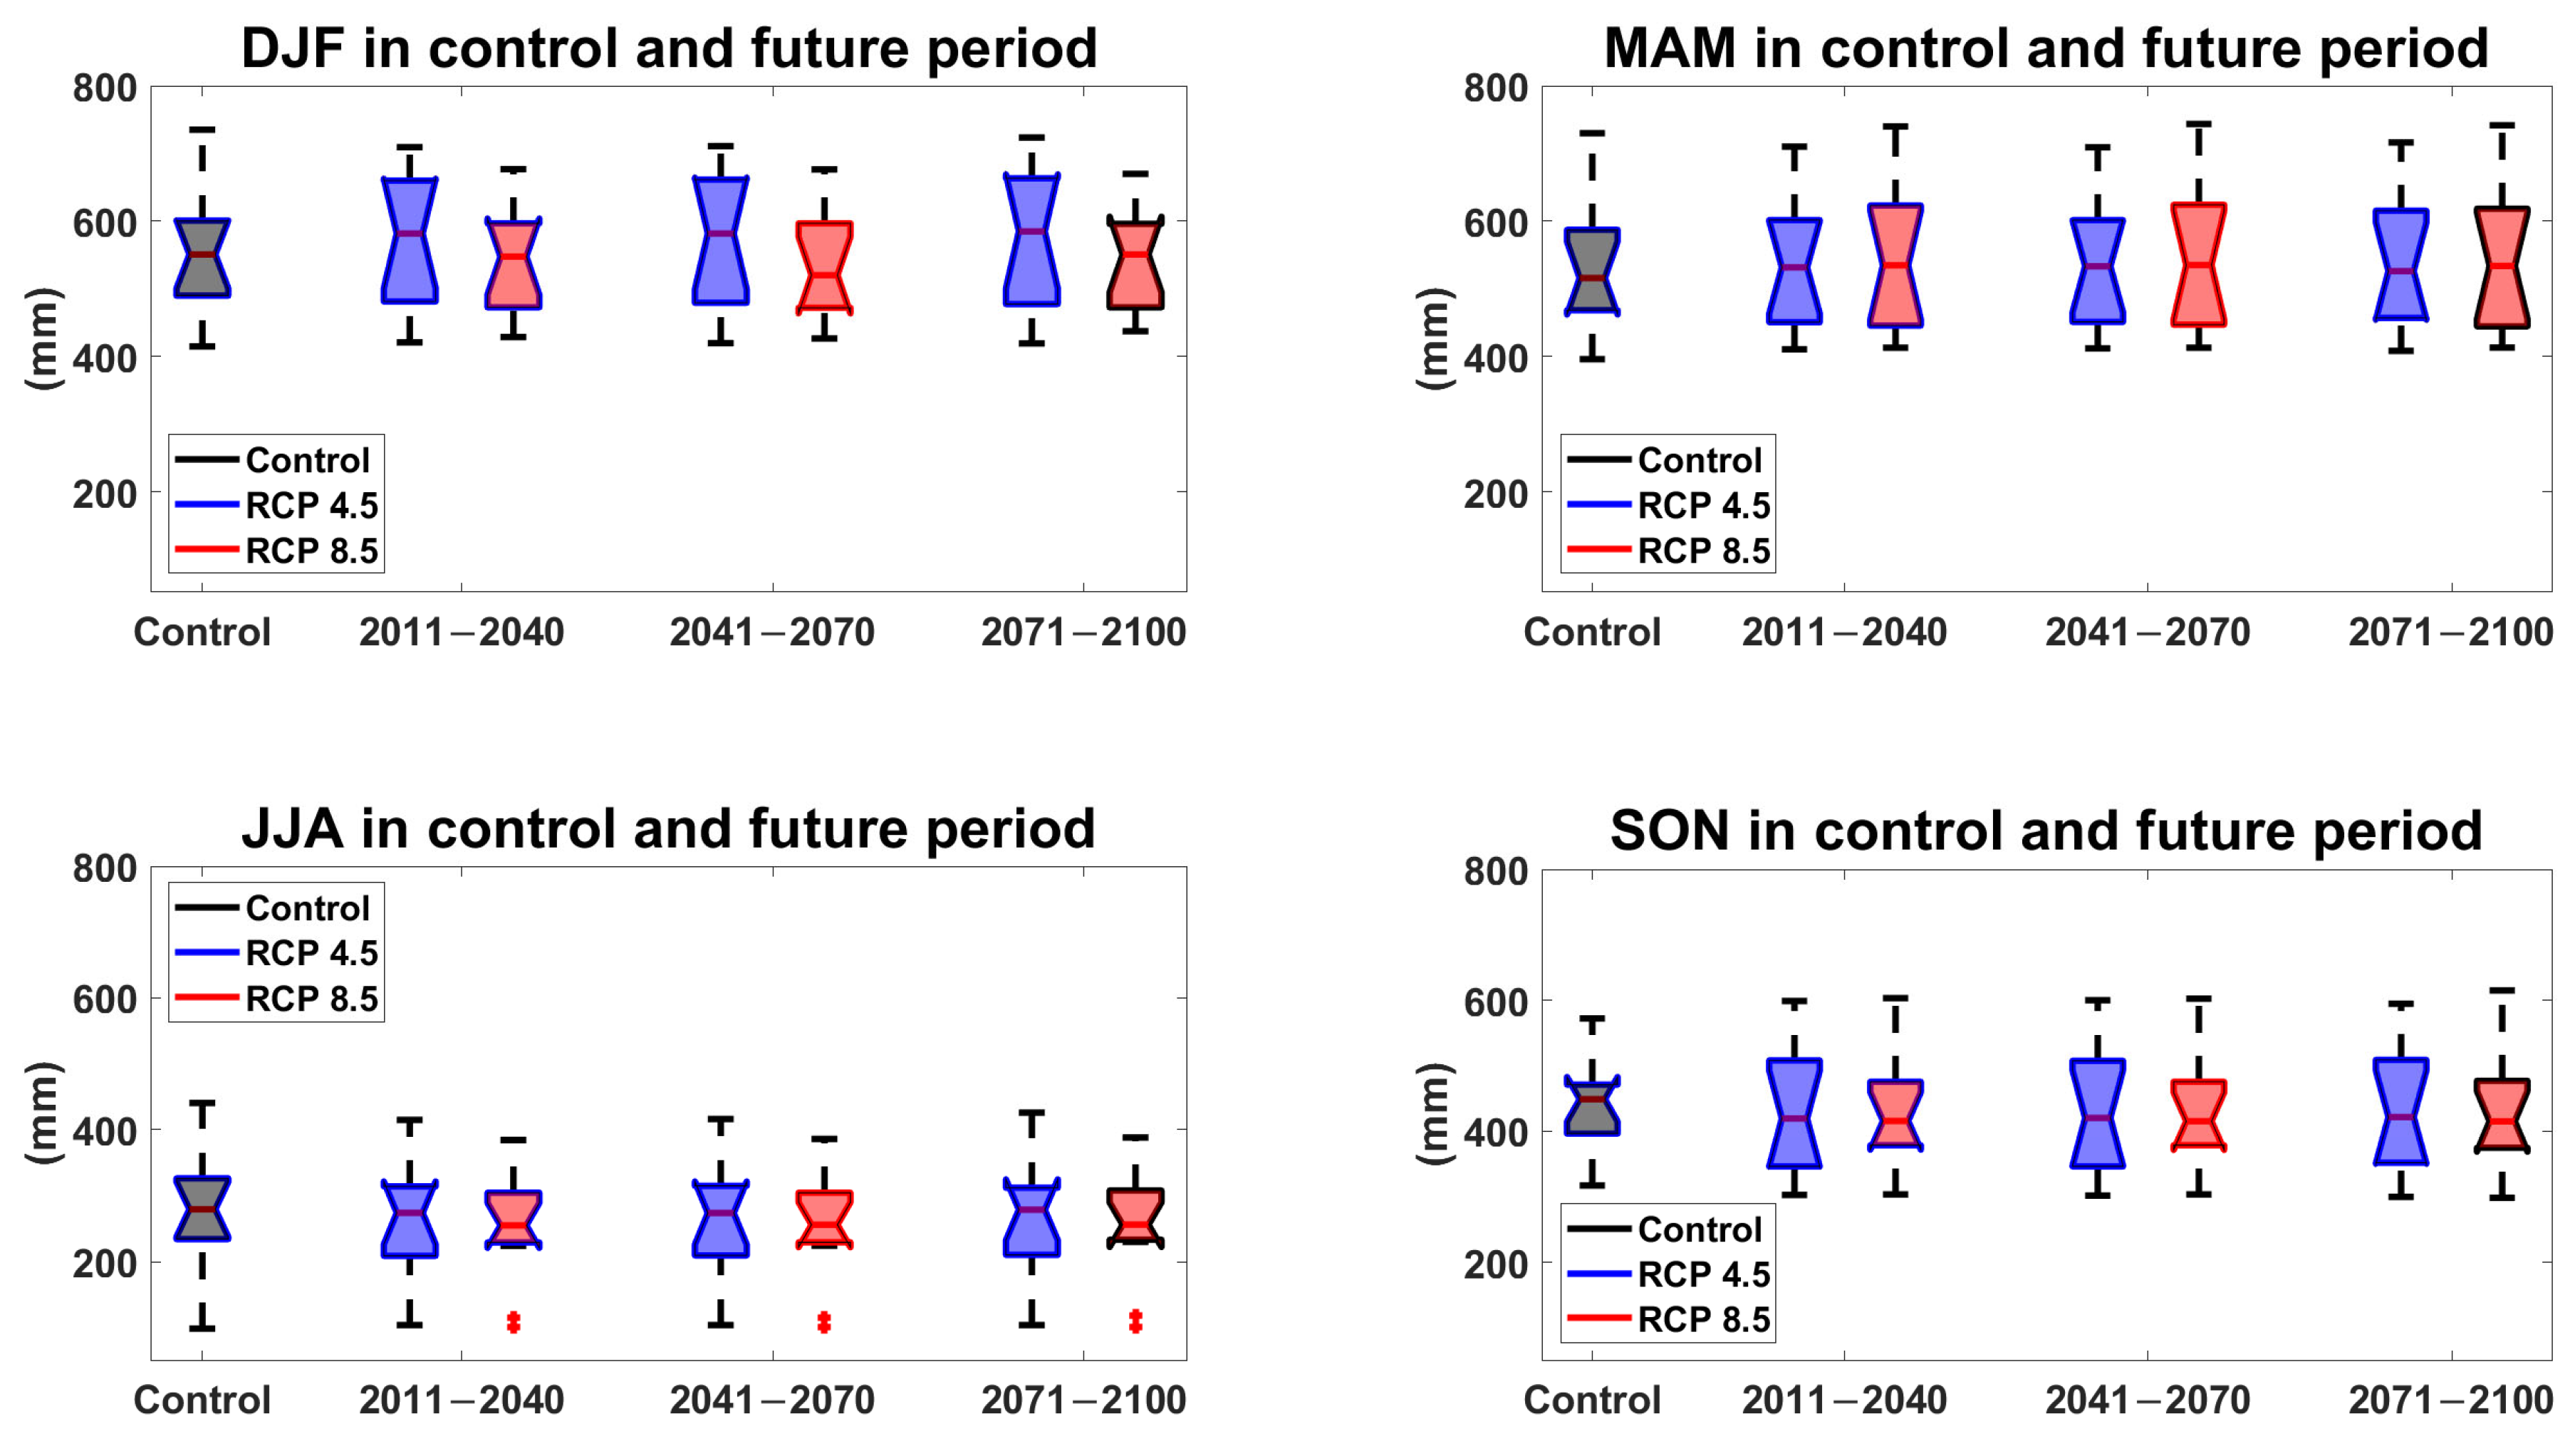
Figure 3), the mean seasonal precipitation associated with December–January–February (DJF), March–April–May (MAM), June–July–August (JJA) and September–October–November (SON) seasons (
Figure 4), and the mean annual number of wet days (MANWD) per year (
Figure 3). Stochastic rainfall time series have been generated for the 12 climate modeling chains (
Table 1) in both the reference and future periods. In the three subperiods in the future period, the two emission scenarios (RCP 4.5 and RCP 8.5) are considered.
Regarding the sensitivity of key model parameters in the STORAGE model, MANWD influences all the parameters related to waiting times, as these increase when the MANWD value increases. In addition, the observed mean annual and seasonal precipitation (MAP, DIF, MAM, JJA and SON) and the IDF parameters influence intensity and duration of the rectangular bursts, as they increase when all such summary statistics increase.
In
Figure 3, it can be seen that less MAP is expected in the future, as well as a smaller number of wet days. Therefore, drier years are expected in the future. This is especially evident in the last future period and particularly for the RCP 8.5.
On the other hand, there is no clear pattern of change for the seasonal precipitation in the four seasons considered, as it remains similar in the three future periods. For the RCP 4.5 emission scenario, higher rainfall is expected in all three future periods in DJF (
Figure 4). Similar values in the future are expected in MAM and JJA, indicating no changes in seasonal precipitation. Finally, lower values are expected in SON. In the RCP 8.5 emission scenario, the lowest seasonal precipitation in DJF is expected in the period 2041–2070. However, seasonal precipitation in the future periods remains similar in the other three seasons. In MAM, the seasonal precipitation is expected to be slightly higher in the future. In the summer period (JJA), lower values are expected for the 12 climate modeling chains. Finally, in SON slightly lower seasonal precipitation is expected in the future.
The 15-min rainfall time series for periods of 500 years obtained from the STORAGE model have been used as input data in the COSMO4SUB model in order to obtain flood hydrographs. Six time series of 500 years have been generated for each of the twelve climate modeling chains (
Table 1), corresponding to the three subperiods considered in the future period and the two emission scenarios considered (RCP 4.5 and RCP 8.5) in each subperiod. Therefore, a total of 72 time series were simulated.
Stationarity has been assumed in the 500-year synthetic series that have been generated from the rainfall indicators (
Figure 3,
Figure 4 and
Figure 5) in each 30-year period for each combination of climatic modeling chain, period in the future and RCP. Therefore, stationarity has been assumed in the time series of 30 years generated by the climate model chains in each subperiod considered in the future period. Usually, such short periods generated by climate model chains are not enough when assessing expected changes in high-return period events, as both flood and precipitation quantile estimates for such high return periods show a high uncertainty given the short time series used. Consequently, SRGs are used in this study to extend the short time series generated by climate modeling chains in order to reduce uncertainty when assessing expected changes for high return periods.
However, a more rigorous approach would consider specific time-varying functions of STORAGE parameters based on changes identified in the precipitation climate projections in each period to generate a large ensemble of a 500-year series. However, the approach used in the study does not consider time-varying functions in each period, as the uncertainties due to the definition of the mathematical expression of such time-varying functions for parameters and their extrapolation after 2100 in the 500-year periods would make the rigorous approach hard to apply. In addition, the high uncertainties associated with such an approach would make it difficult to identify the expected changes in hydrological dam safety expected in the future.
4.2. Calibration and Runoff Generation with COSMO4SUB Model
The COSMO4SUB model is used to simulate runoff time series at the catchment outlet by using the 15-min rainfall time series generated by the STORAGE model as input data. Therefore, 15-min streamflow time series of 500 years for each climate modeling chain, 30-year period and emission scenario are obtained. Such streamflow time series are considered as inflow to the Eugui Reservoir.
The CN and tc values can be considered optimal when derived from observed data. However, their estimation in ungauged catchments rely on geomorphological and land-use information, introducing significant uncertainty. Previous studies have explored a wide range of CN values between 30 and 75 and tc values to assess model sensitivity and evaluate their impact on hydrograph variability and parameter influence. Such combinations would encompass all possible hydrographs the model can generate for a given catchment. While the CN range reflects land covers from brush to gravel surfaces, tc shifts the timing of the WFIUH-1par peak, yielding diverse hydrological responses. The resulting hydrographs display substantial variability, confirming the model flexibility with few input parameters. As expected, increasing tc reduces peak discharge, though this effect is diminished for CN values smaller than 50, indicating a stronger control by infiltration processes. Flood hydrograph volume shows minimal sensitivity to tc. In addition, for CN values greater than 65, hydrograph volume variability also decreases, highlighting that CN plays a dominant role. Hydrograph flood duration increases with tc, especially for CN values greater than 50, likely due to reduced infiltration and prolonged runoff generation.
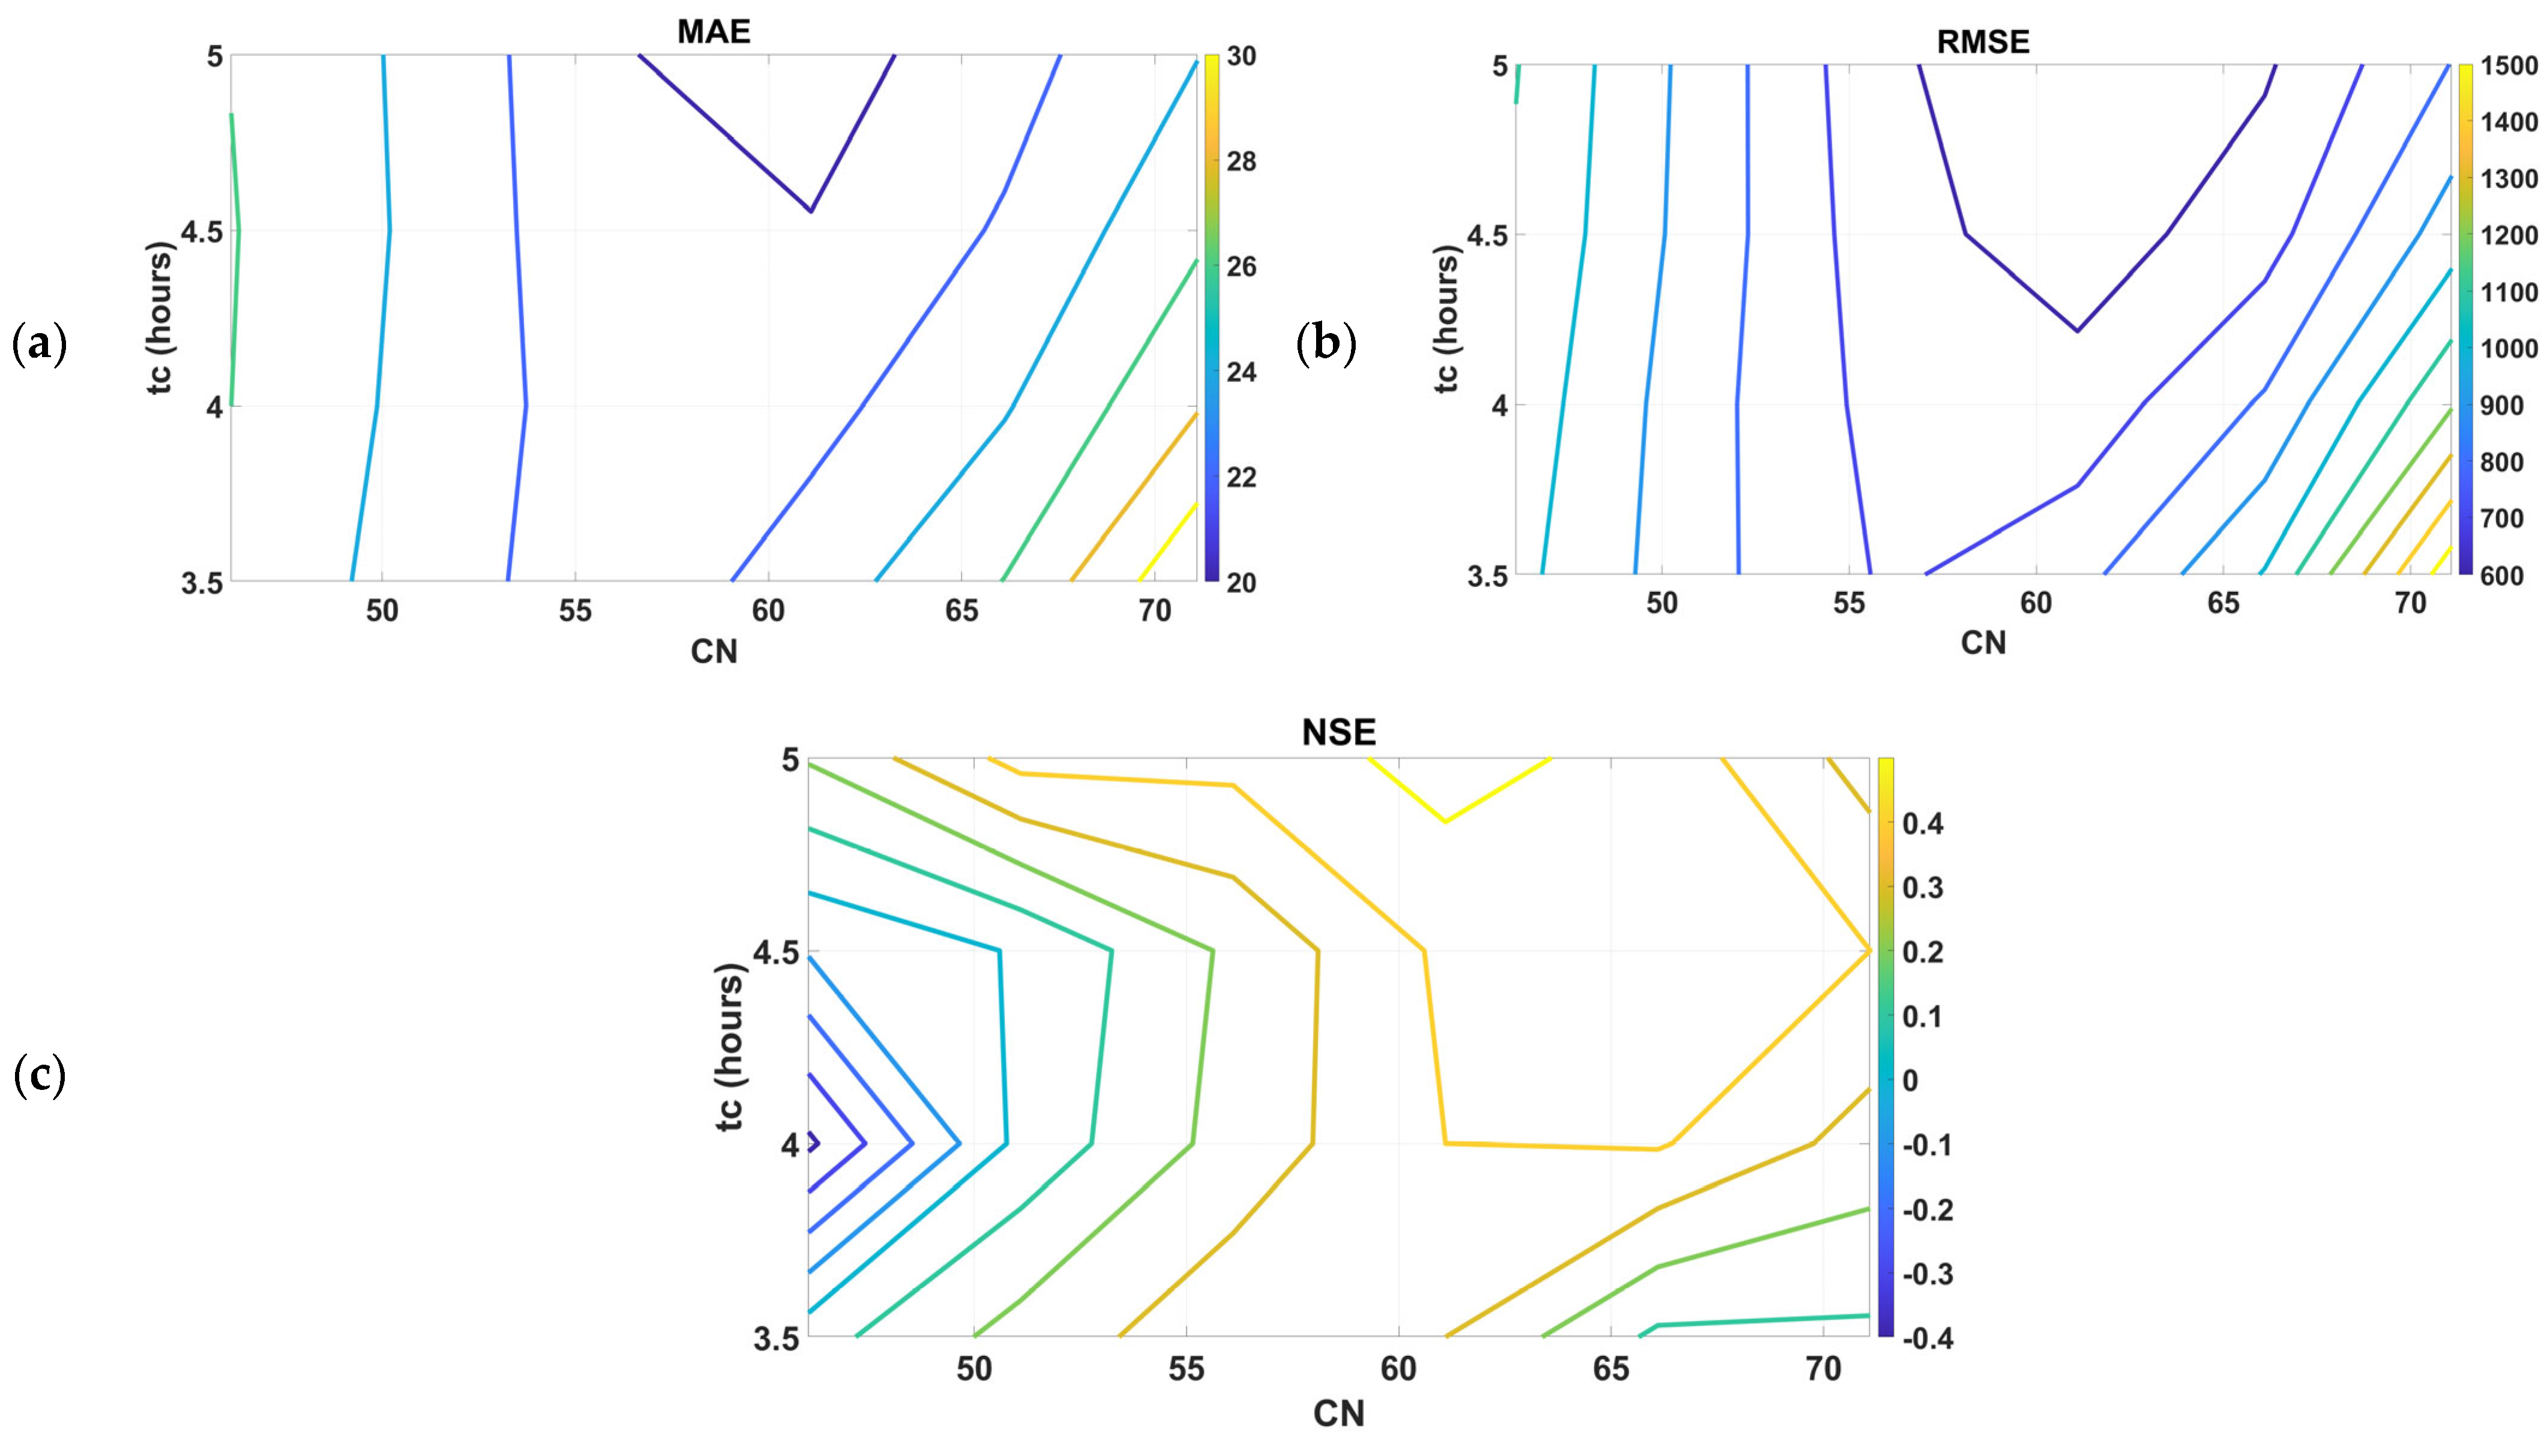
First, the model parameter values are calibrated with observations. The parameters that have been considered in the COSMO4SUB model calibration are the curve number (CN) and tc. tc values between four and six hours and CN values between 45 and 75 were explored. The period 2008–2020 was used for the model calibration. The model calibration concentrated on high return period results, as the study is focused on hydrological dam safety and such return periods are needed. A multi-objective function was not required as the three model parameters supplied the same results when the variables were varied. CLC maps were used to obtain the initial values of the CN parameter.
Several simulations have been performed with a set of combinations of values for these two model parameters. The mean absolute error (MAE), root mean square error (RMSE) and the Nash–Sutcliffe efficiency coefficient (NSE) have been calculated for each combination of parameter values (Equations (3)–(5)).
where
is the streamflow prediction at time step
i,
is the observed streamflow value at time step
i,
is the mean of observed streamflow values in the period considered, and
N is the sample size.
The hydrographs that generate the annual maximum peak flows for each model, scenario and period are extracted from such streamflow series. These hydrographs are the input data in the MEV model to obtain the outflow hydrographs and maximum reservoir water levels, considering an optimal gate operation strategy. In this study, both the initial and final reservoir water levels are the top level of the conservation pool.
Finally, return periods are assigned to the peak outflows and maximum reservoir water levels by using the Gringorten formula (Equation (6)), analyzing the changes between the future and baseline periods.
where
n is the number of observations,
i is the
i-th observation in increasing order, and
Pi is the estimate of the cumulative frequency of the
i-th term [
43].
Both STORAGE and COSMO4SUB have already been validated using observed datasets across diverse hydrological and meteorological conditions, demonstrating consistent and reliable performance. Both models incorporate physically meaningful parameters and boundary conditions, which inherently constrain their behavior and reduce the risk of overfitting unlike purely data-driven models that benefit more significantly from statistical resampling methods.
5. Results
This section presents the results obtained by applying the methodology proposed. First, the results of the COSMO4SUB model calibration are presented, and the synthetic runoff time series generated at the Eugui Resevoir are analyzed. Second, expected changes in peak outflow and maximum reservoir water levels in Eugui Dam are assessed.
5.1. Generation of Runoff Time Series
First, the calibrated values of the COSMO4SUB model parameters are obtained, using the functions described in the previous section. The three objective functions have been calculated to quantify the errors between simulations and observations. The curve number and time of concentration value combinations with the lowest errors were selected. A CN value of 65 and a t
c value of five hours have been considered (
Figure 5).
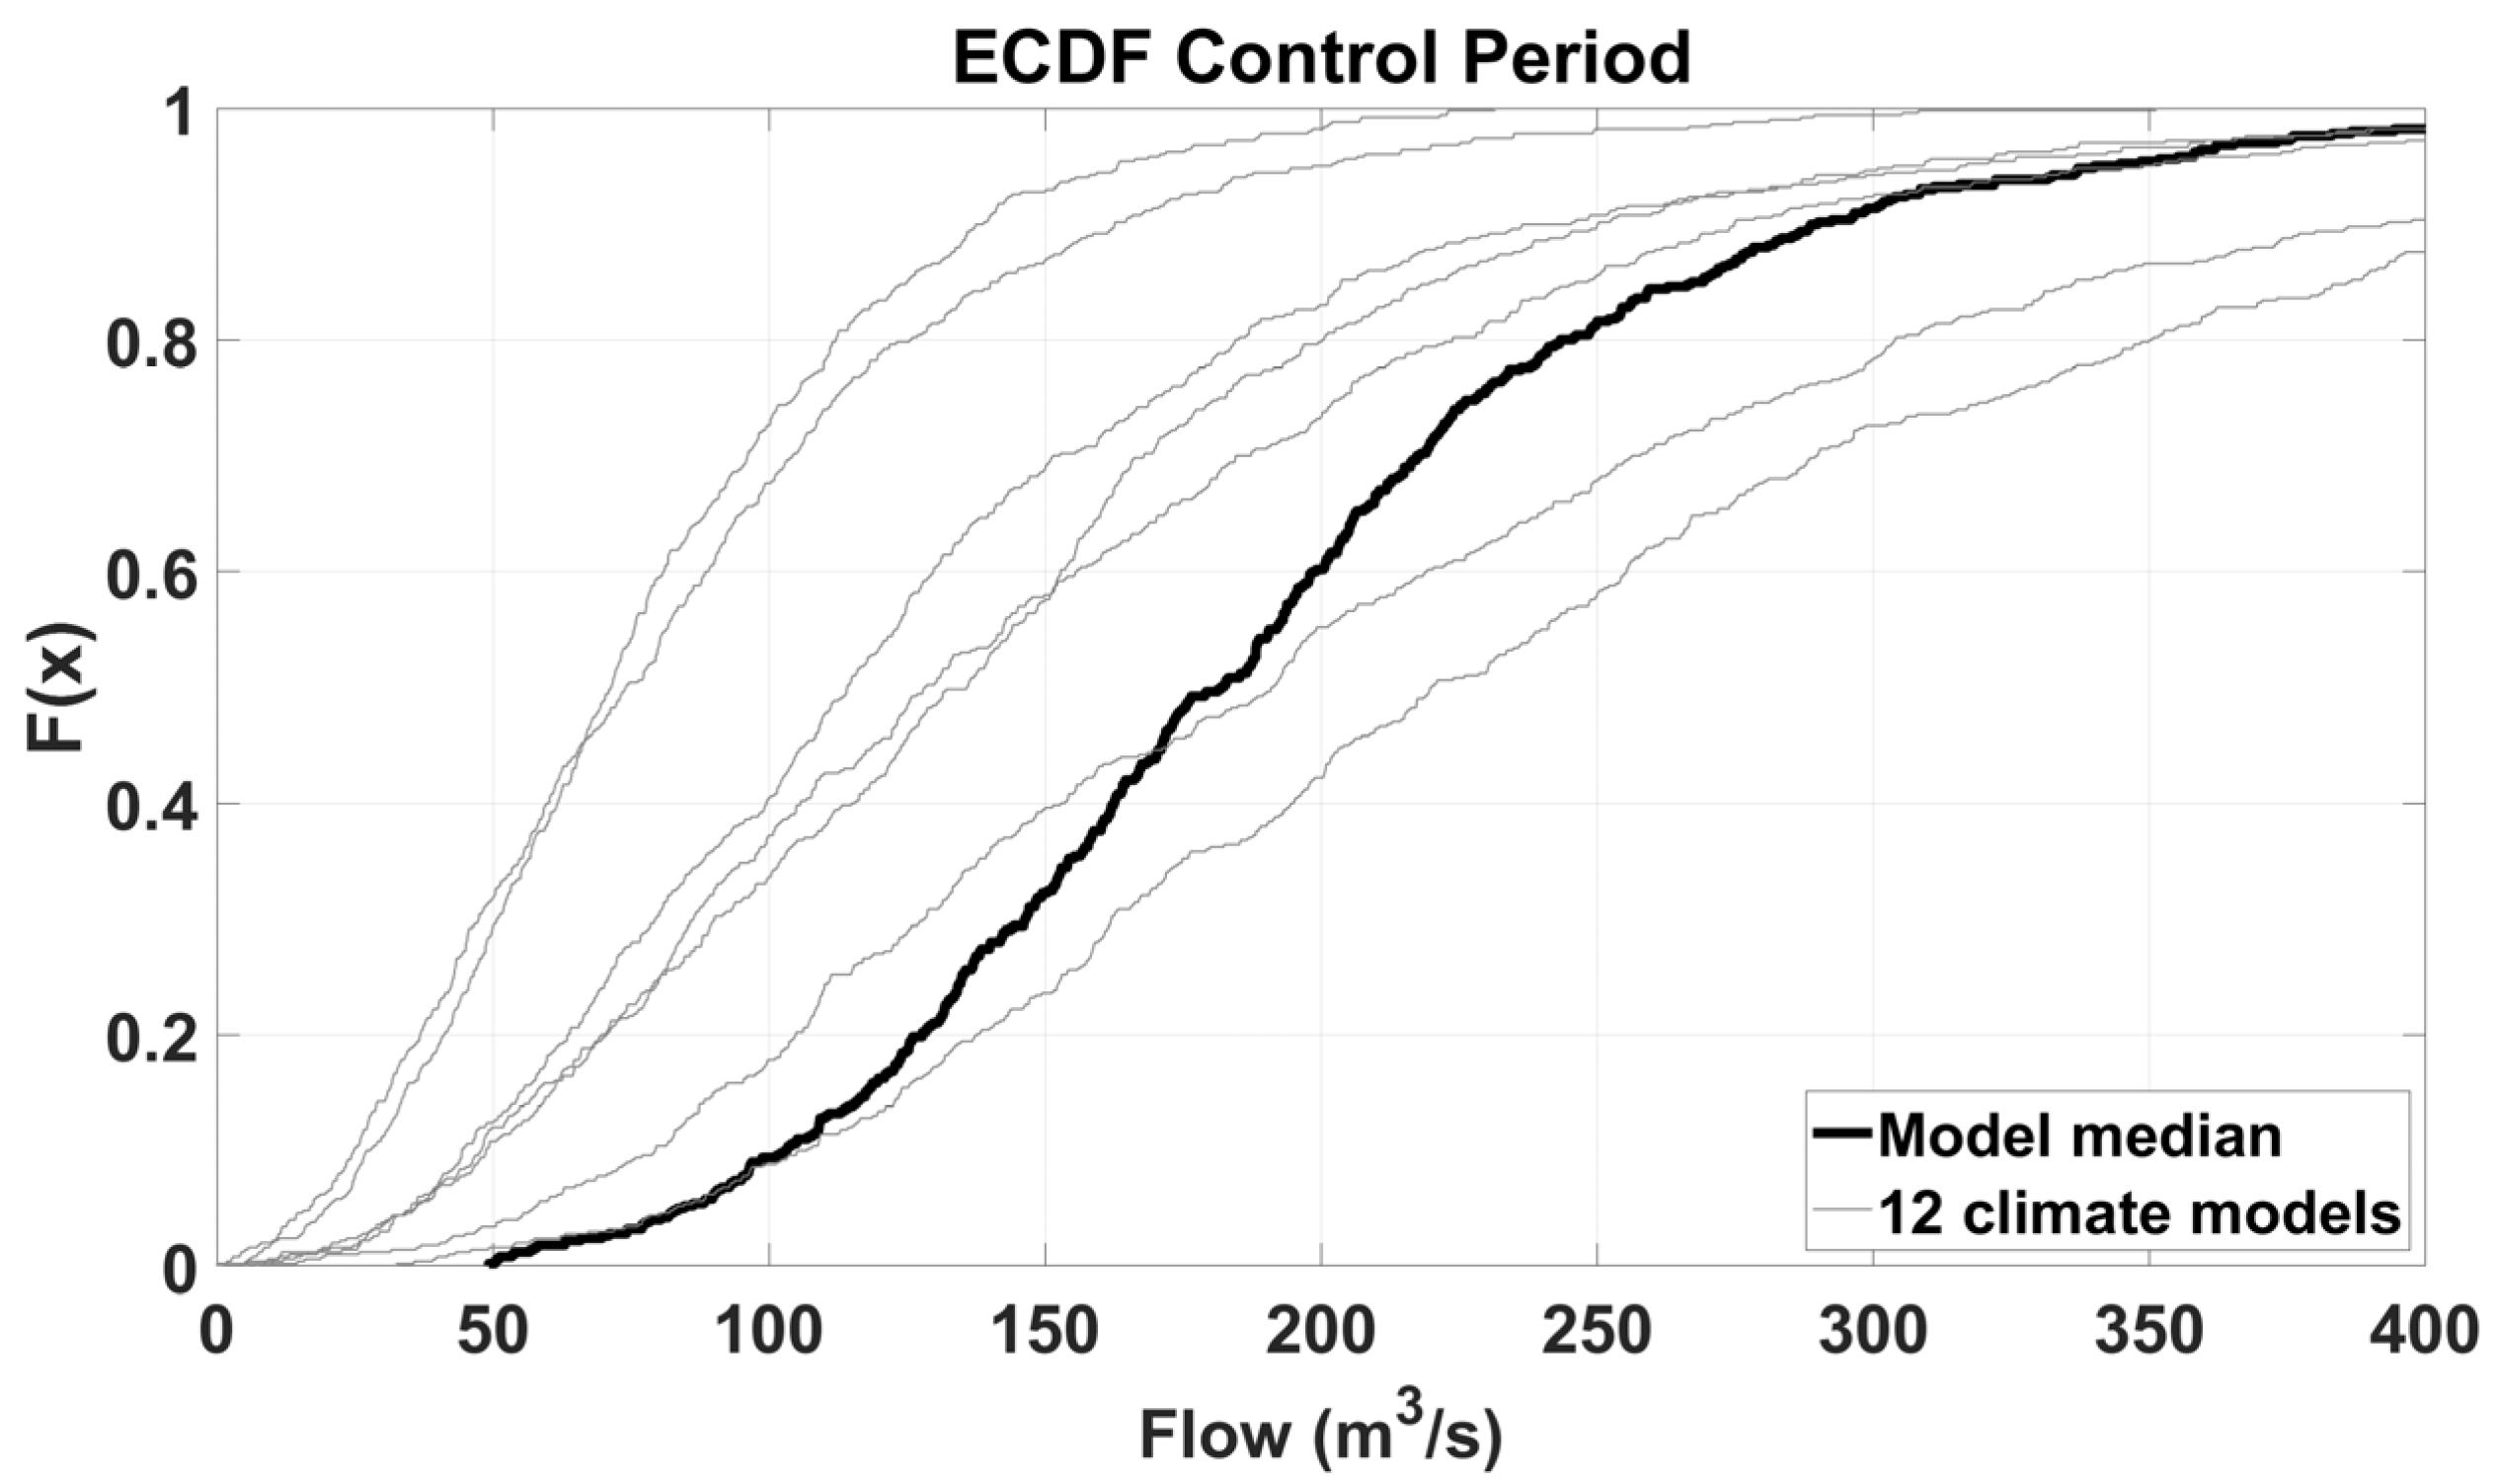
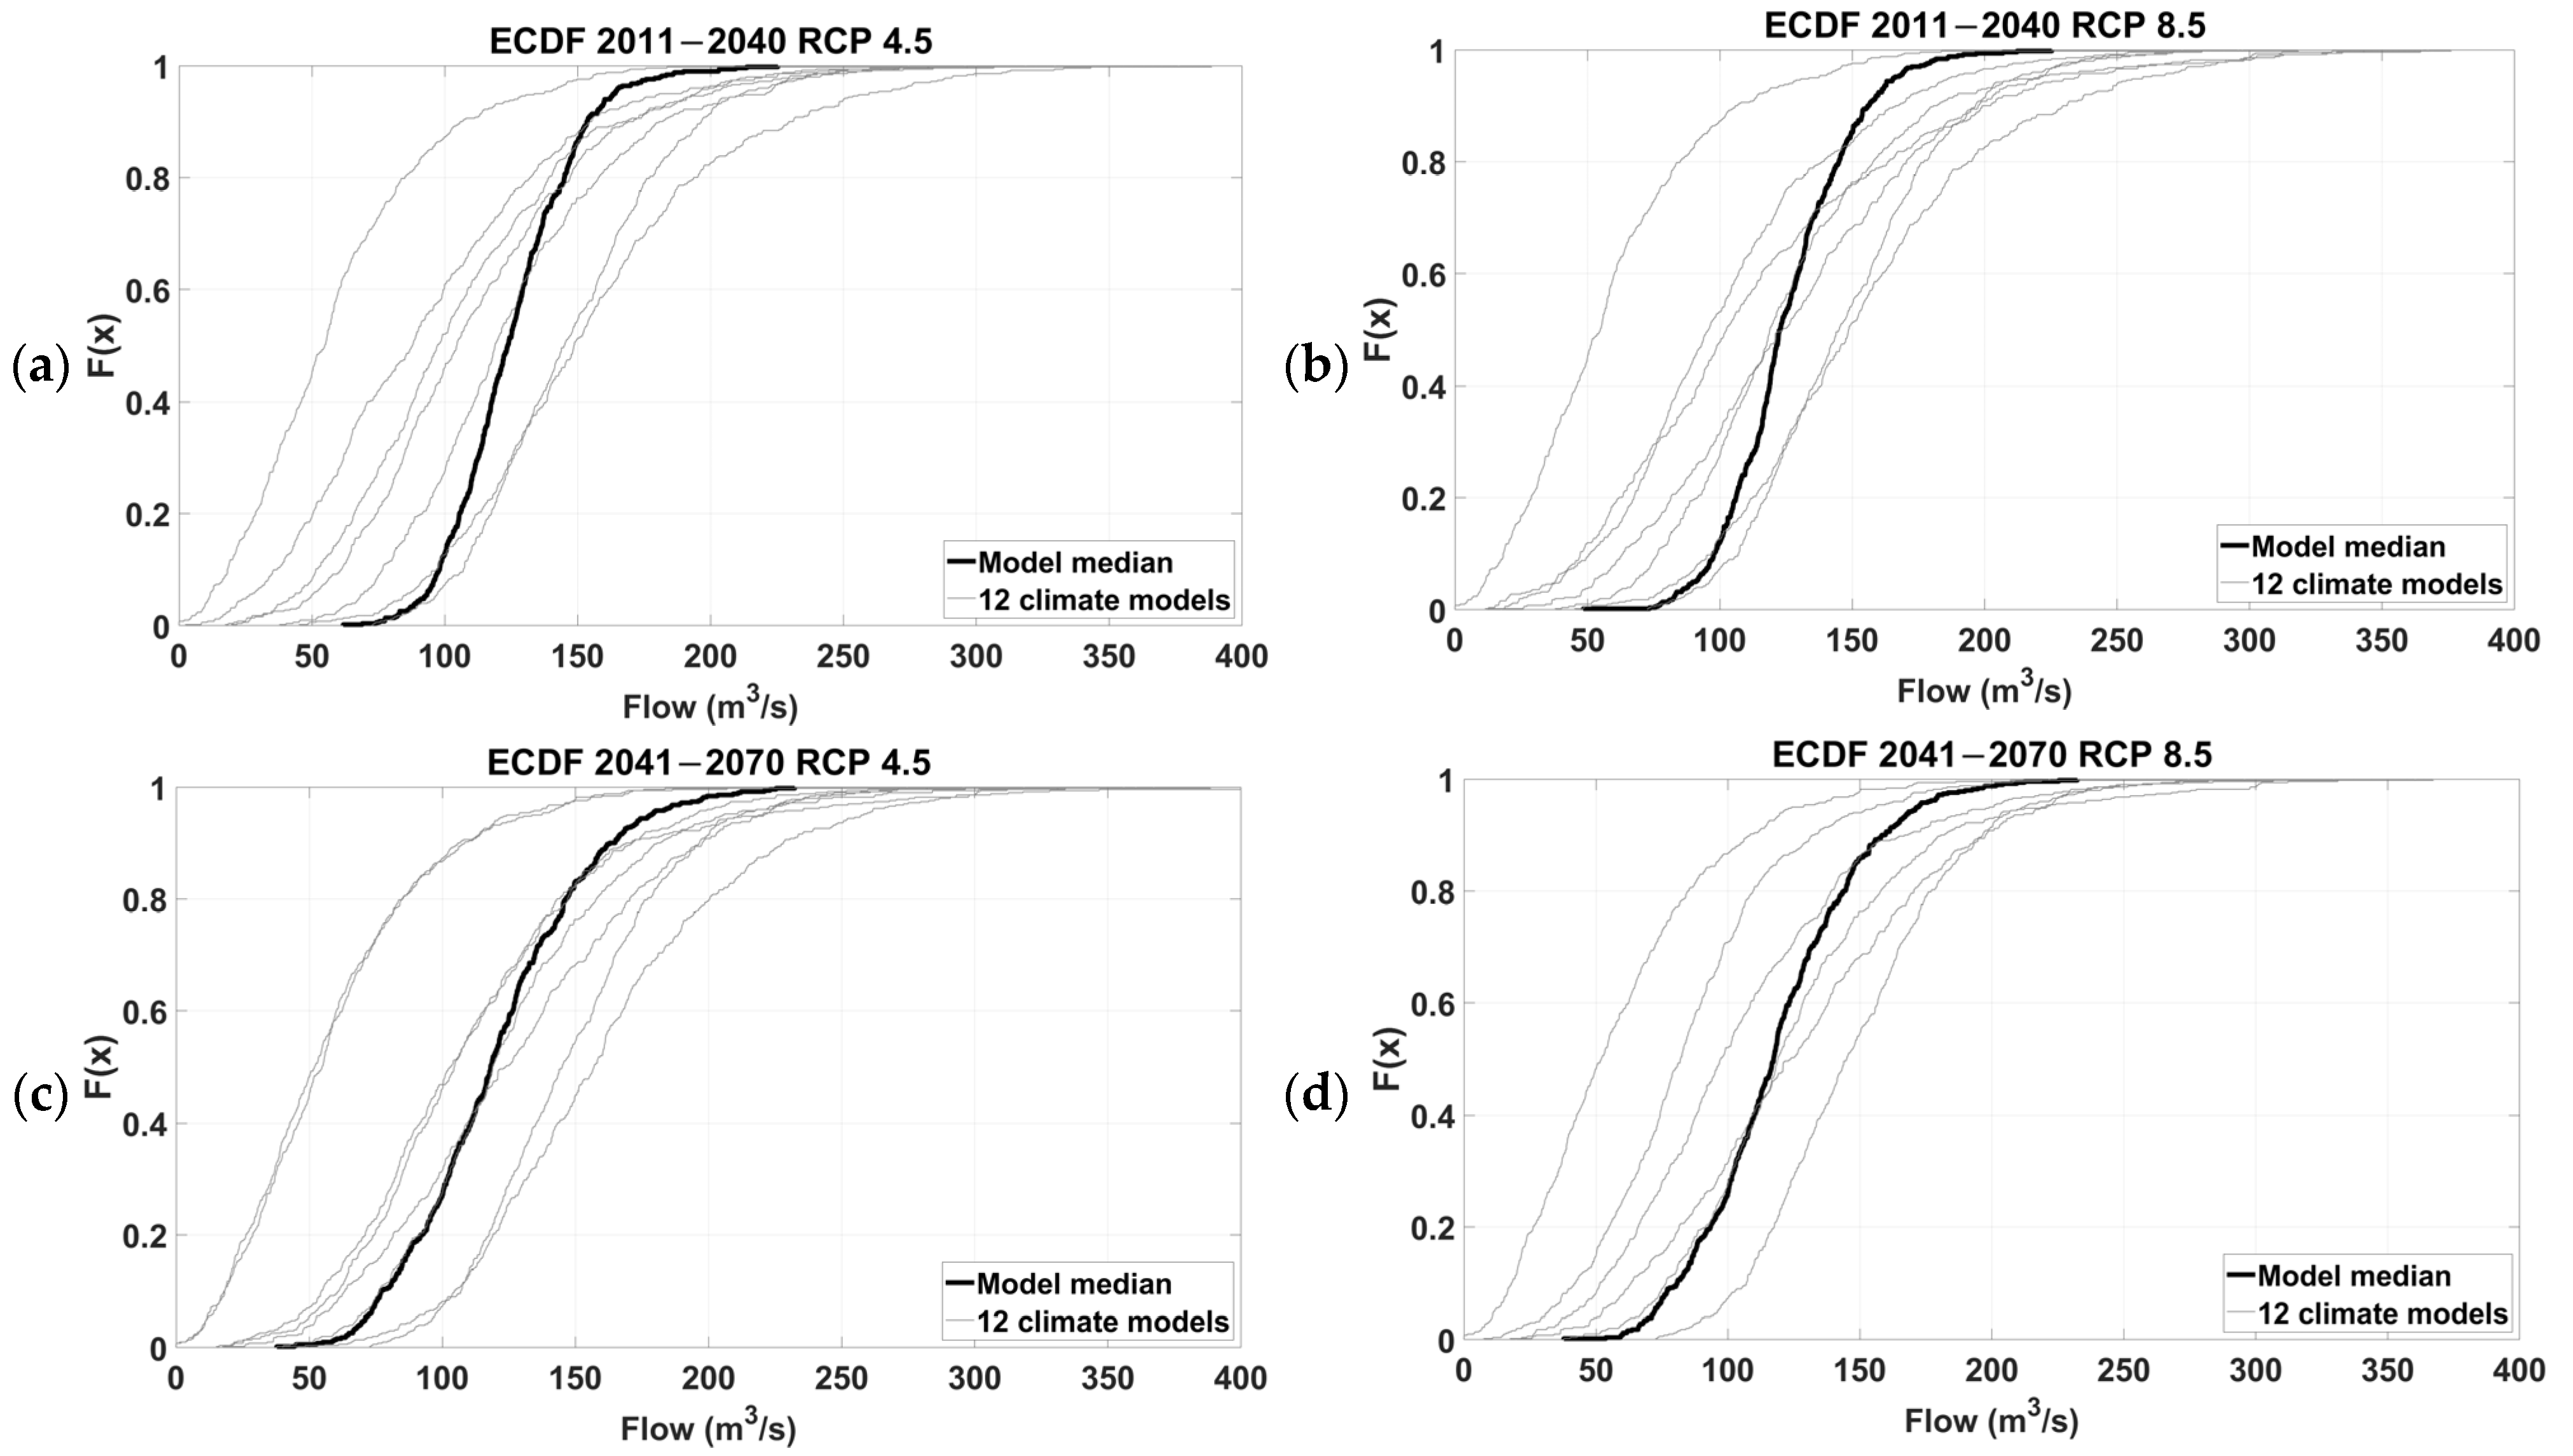
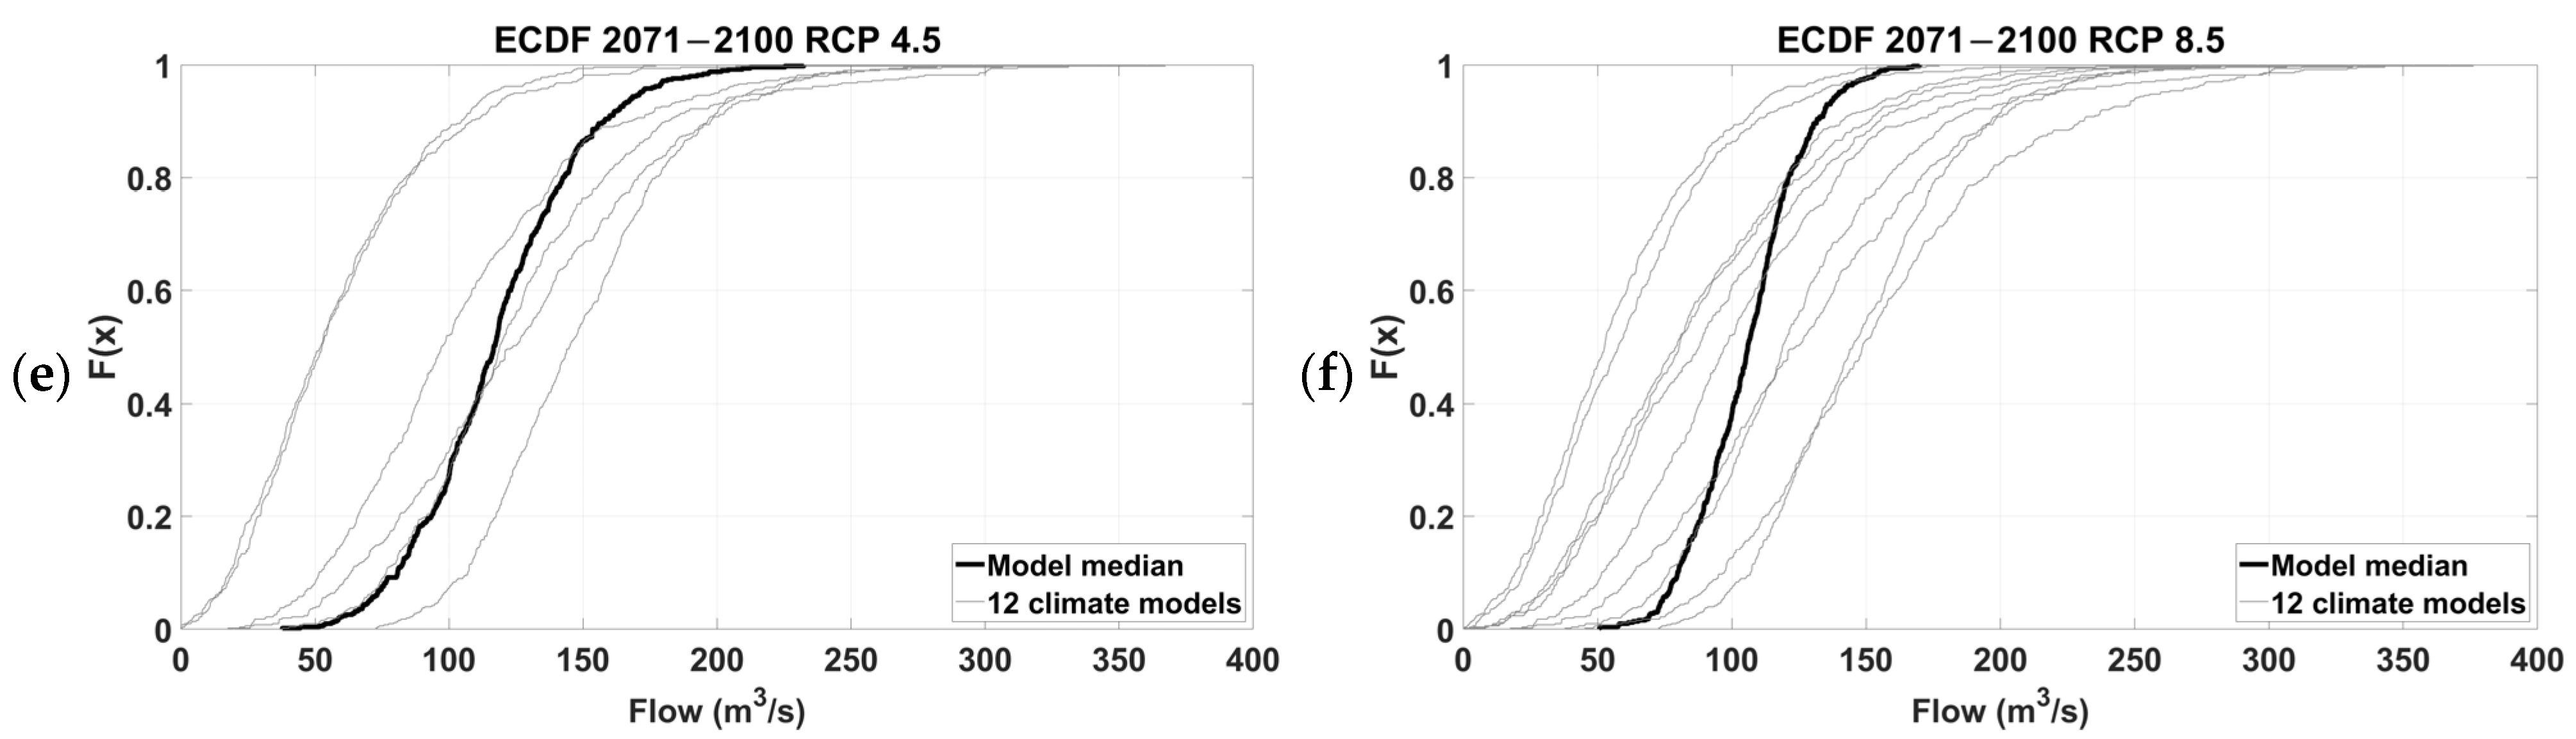
With the calibrated parameter values of the COSMO4SUB model and the synthetic rainfall time series of 500 years generated by the STORAGE stochastic model, streamflow time series of 500 years at the Eugui Reservoir are generated for each climate modeling chain, scenario and period with the COSMO4SUB model (
Figure 6 and
Figure 7).
Figure 6 and
Figure 7 present the results by using empirical cumulative distribution functions (ECDF) to visualize the cumulative distribution of the flow series for the baseline period and the two emission scenarios in the future, considering the three selected periods. The graph shows the ECDFs for the 12 climate modeling chains considered in the study using thinner grey lines. The median values of the 12 climate modeling chains are presented with a wider black line. The baseline period presents the highest and most spread cumulative flow distribution, as it shows a more horizontal shape. However, in both emission scenarios in the future, the curves are more vertical, i.e., the flow discharges are spread over a smaller range, between 50 and 200 m
3/s.
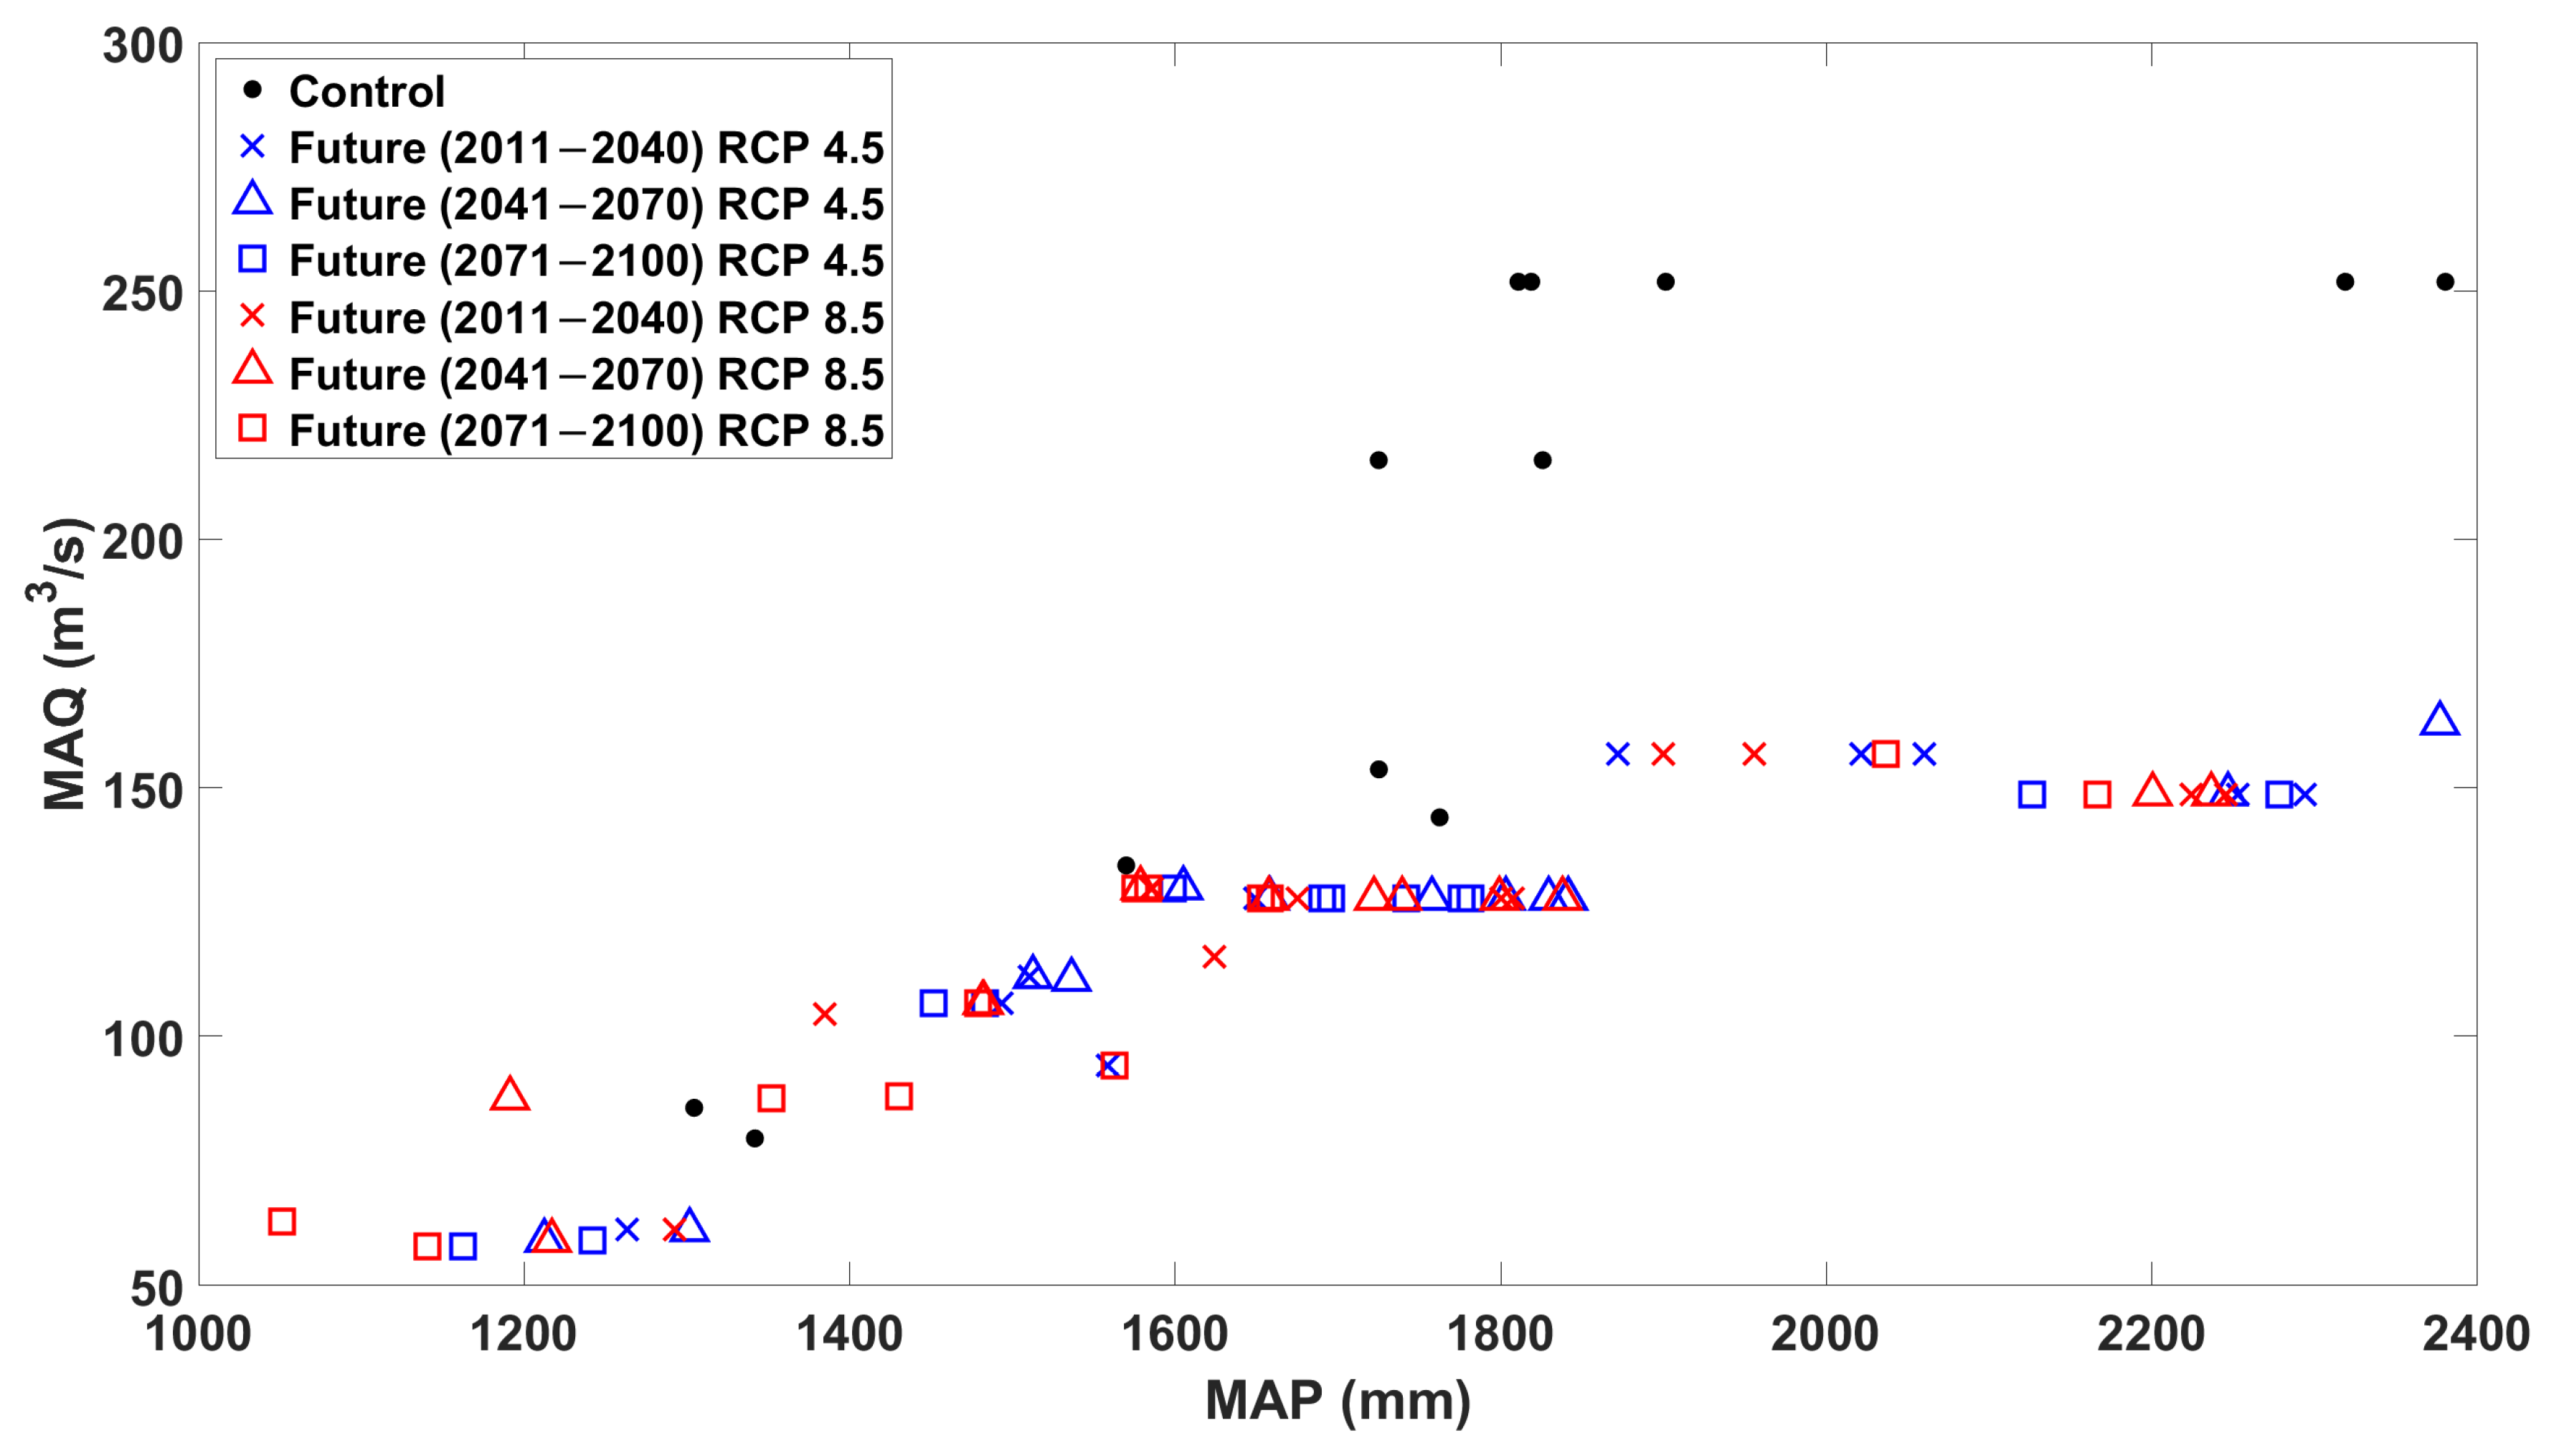
It has been observed that the median values of annual maximum peak flows in the future periods will be lower than in the baseline period (
Figure 8). No flow trends are observed with respect to time periods or emission scenarios. It seems that the average streamflow and precipitation depend exclusively on the selected model.
5.2. Expected Changes in Peak Outflow and Maximum Reservoir Water Level Curves
The annual maximum flood hydrographs for the 500-year periods in each case are considered as inflow to the Eugui Dam. The VEM is applied to obtain the outflow hydrographs and reservoir storage volumes and water levels.
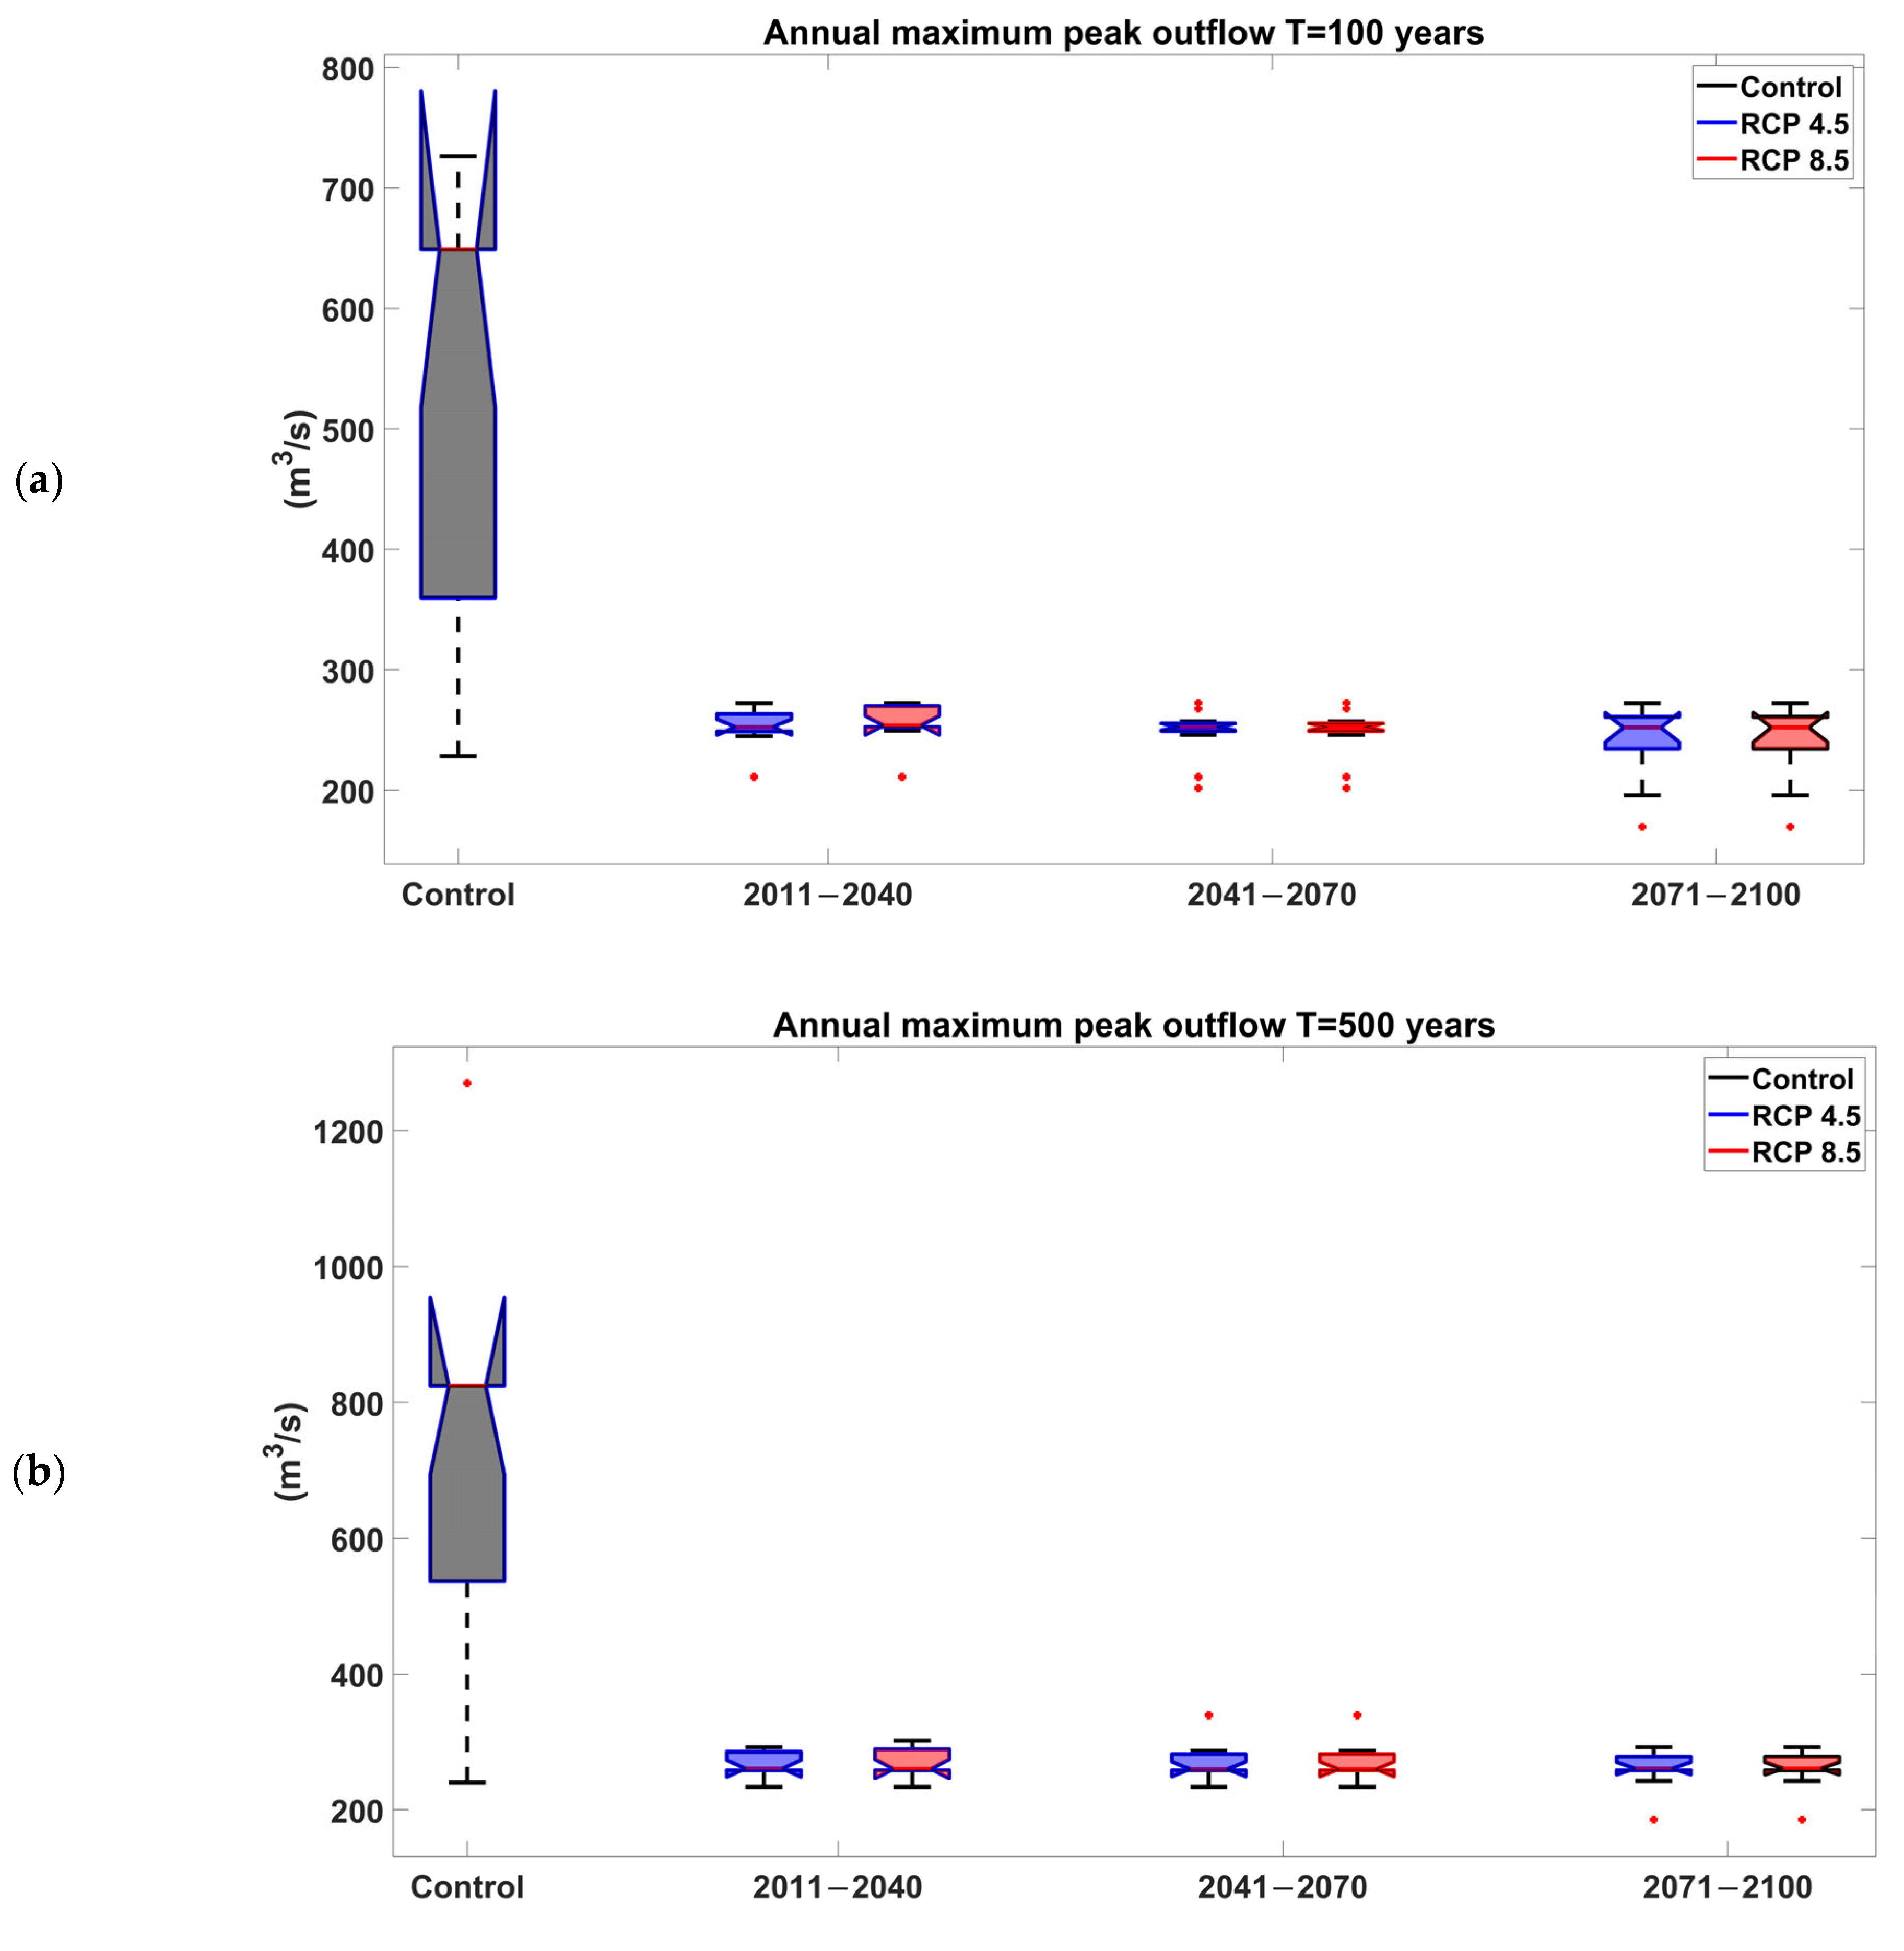
The reservoir has been assumed to be completely full at the beginning of each flood event to consider the most pessimistic situation. The median peak outflow frequency curve is expected to be lower in both future emission scenarios and in the three future periods considered. In the first future period (2011–2040), annual maximum peak outflows are expected to be lower than in the baseline period considered as the present situation (
Figure 9). Annual maximum peak outflows will be similar in the two emission scenarios (
Figure S1). The largest differences were found for the higher return periods. High return periods up to 1000 years have been considered in the study, as they are usually used in spillway design. The lowest annual maximum peak outflows are found for the emission scenario RCP 4.5. The 33rd and 67th percentiles present greater differences in the RCP 4.5 emission scenario, while in the RCP 8.5, they are closer to the median.
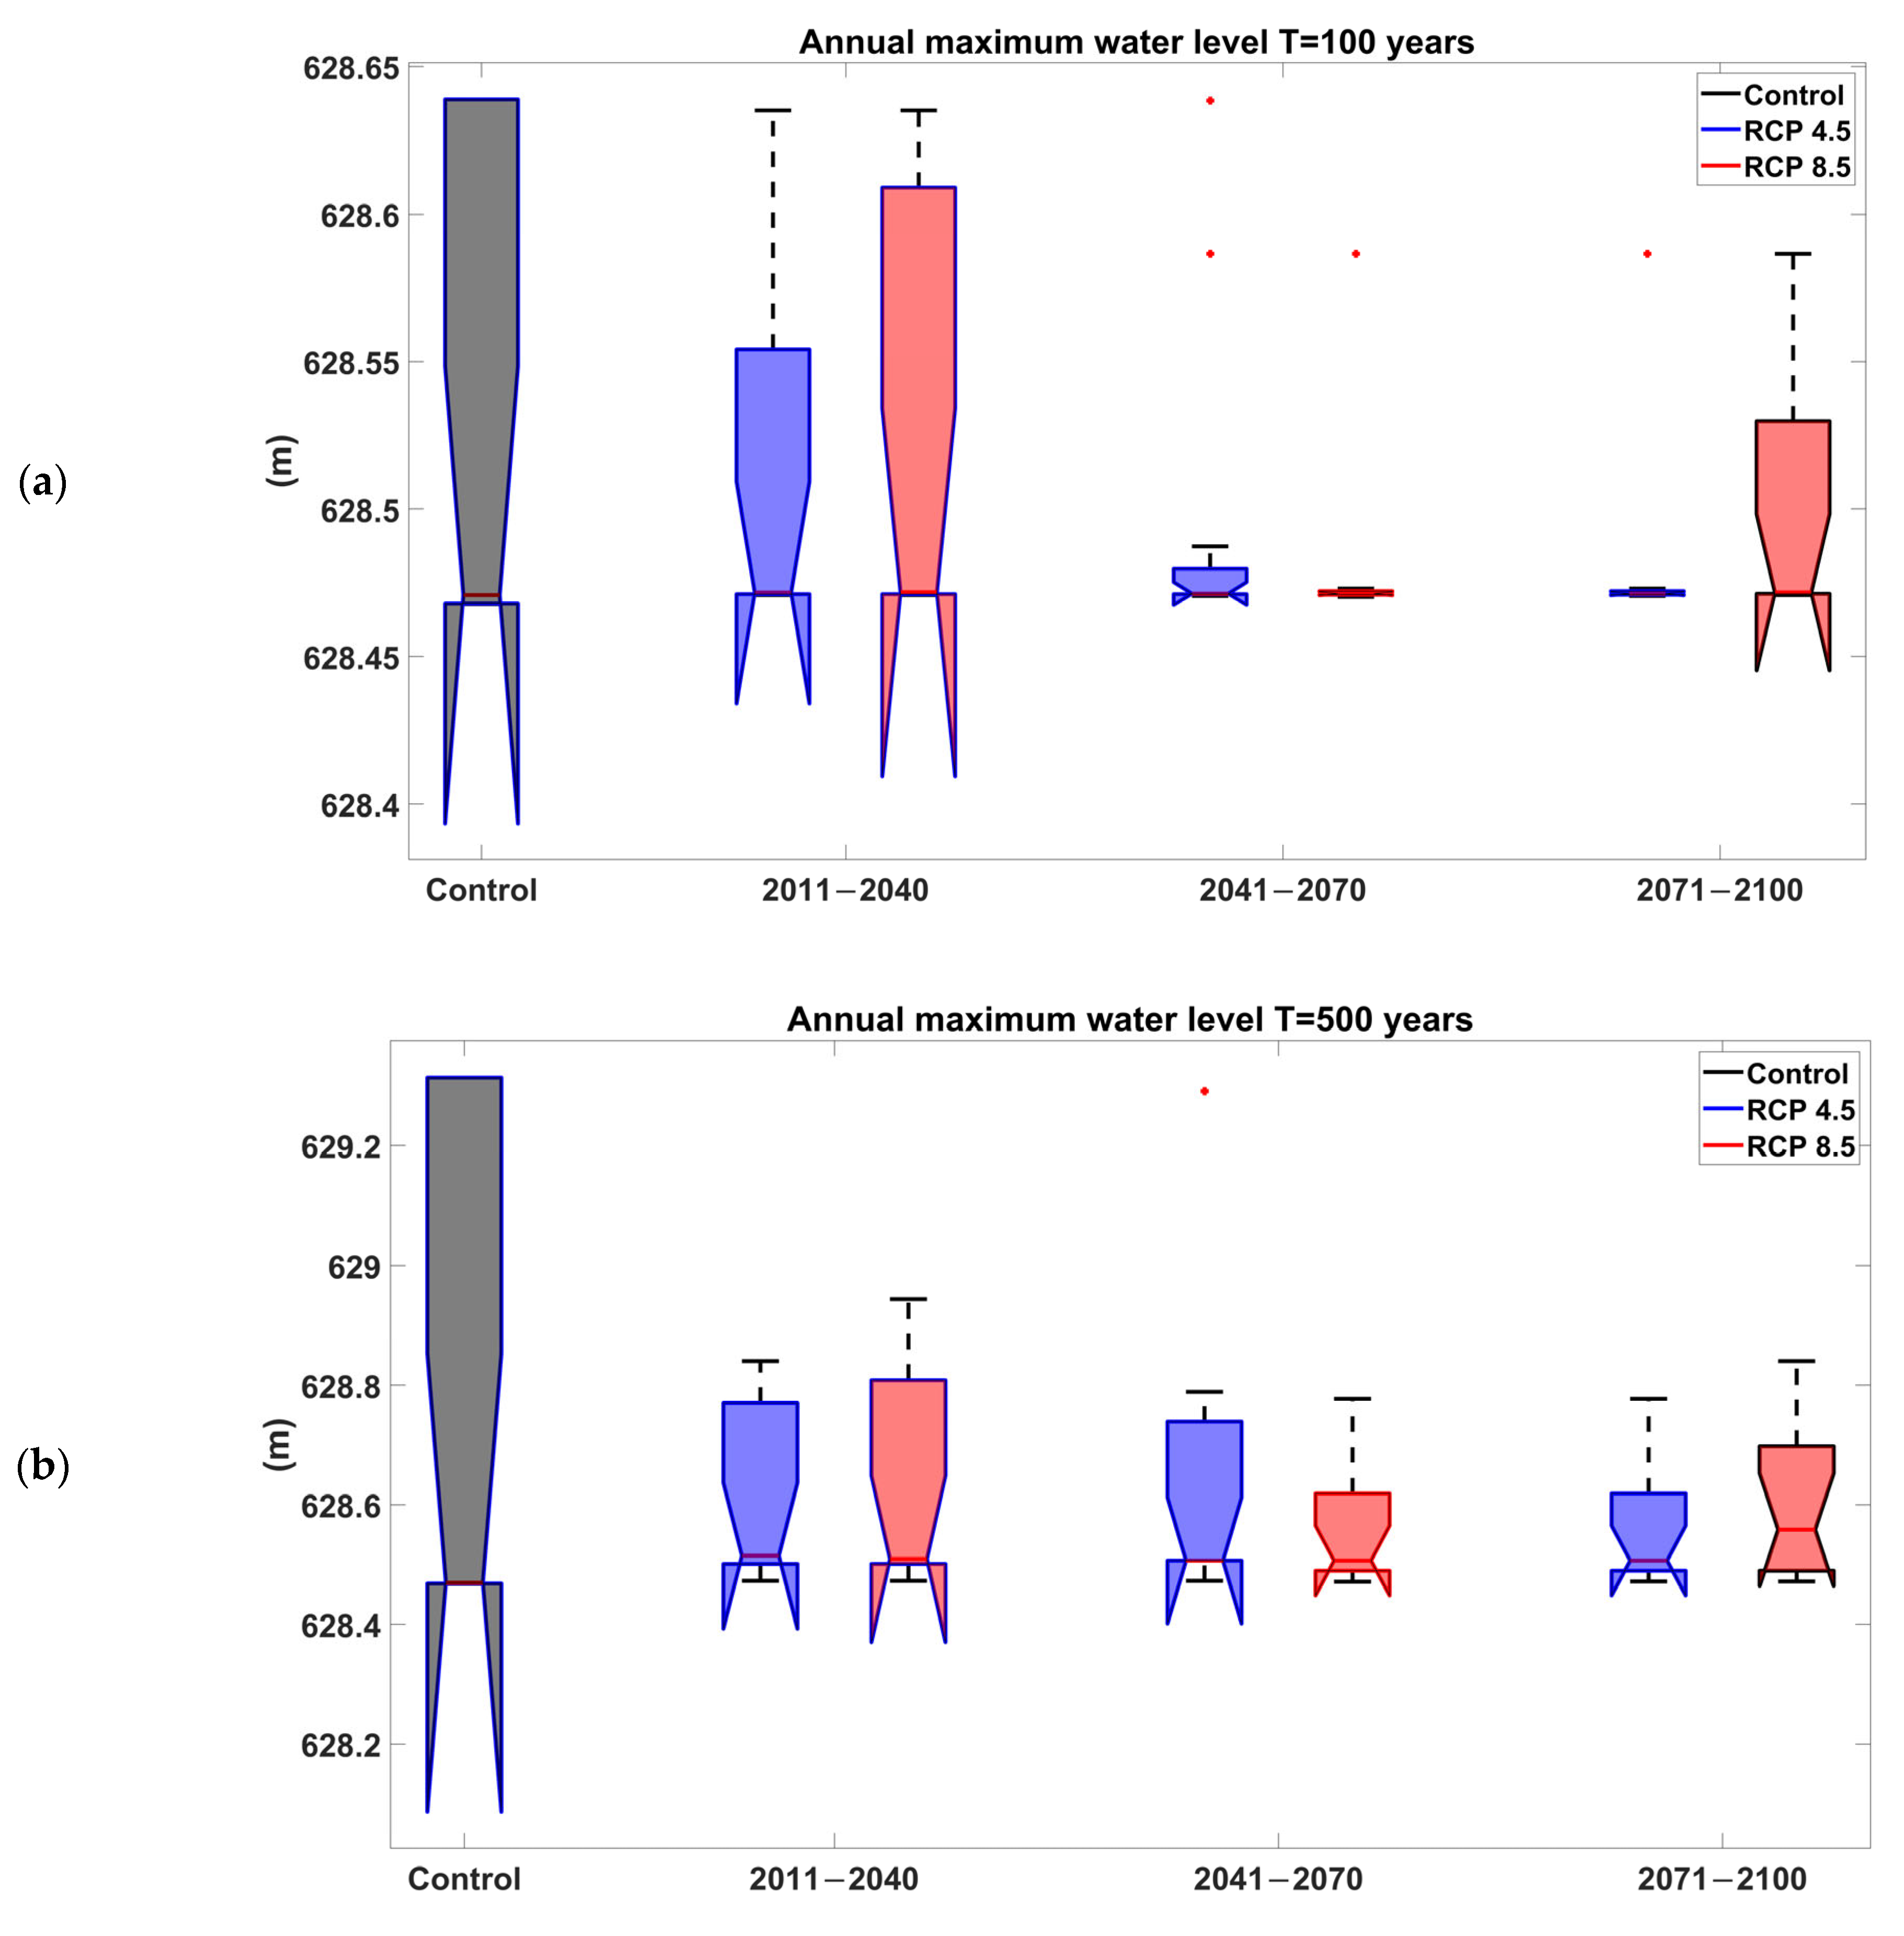
For annual maximum reservoir water levels, a constant value is obtained in the case of the median of the 12 climate modeling chains (
Figure 10), as the spillway is operated by gates and the VEM method tries to open gates gradually to keep the initial water level, which is fixed as the top of the conservation pool for as long as possible, while the inflow discharge can be discharged, opening the gates partially and maintaining the initial water level (
Figure S2). Therefore, the reservoir water level is not increased, while the inflows are lower than the maximum outflow discharge that can be spilled under the partially opened gates with a reservoir water level equal to the top of the conservation pool. However, for given climate modeling chains, an increase in the maximum reservoir water levels can be observed for return periods greater than 25 years.
Similar results are obtained in the intermediate future period (2041–2070). Annual maximum peak outflows will be smaller than in the current conditions. The median frequency curves are similar to the previous case. However, a greater dispersion of results in this period is observed. In addition, the results are reversed according to the emission scenario (
Figure S3), as in this case, the lowest annual maximum peak outflows are expected in the RCP 8.5 scenario. Nevertheless, the annual maximum peak outflows are small enough and they do not exceed the maximum outflow discharge that can be spilled by gates with a water level equal to the top of the conservation pool. Therefore, the initial reservoir water level is maintained.
In terms of annual maximum reservoir water levels, the median frequency curves are also similar. However, analyzing the results for each climate modeling chain, it can be observed that some models present significant increases in annual maximum reservoir water levels in the RCP 4.5 emission scenario compared with the RCP 8.5 scenario. In the RCP 4.5 scenario, the maximum reservoir water levels will increase for return periods of at least 25 years, whereas in the RCP 8.5 scenario, such increases will occur from the 50-year return period (
Figure S4).
Finally, the last future period (2071–2100) presents similar results to the previous periods for the RCP 4.5 emission scenario. However, significantly lower annual maximum peak outflows are expected in the RCP 4.5 emission scenario (
Figure S5). In addition, in the RCP 4.5 emission scenario, the 33rd and 67th percentiles are close to the median, while in the RCP 8.5 scenario, a higher dispersion is observed, as can be seen in the 33rd and 67th percentiles.
The reservoir levels in this period are similar to the previous cases. The median remains constant in both emission scenarios. A small variation is observed in the climate modeling chains, in the RCP 4.5 emission scenario, variations in the reservoir level can be observed for return periods of at least 50 years, while in the RCP 8.5 emission scenario, the reservoir level increases for some models from the 25-year return period.
Small changes in reservoir levels are observed regardless of climate variability, as the reservoir level fixed to the top of the conservation pool can be maintained while the outflow discharge is equal or smaller than the maximum spillway capacity. Spillway gate operation consists of opening the gates gradually to release an outflow discharge equal to the inflow discharge. Therefore, the initial reservoir level is maintained until the inflow discharge exceeds the maximum spillway capacity. Consequently, reservoir level increases are observed only when the inflow discharge is higher than the spillway capacity.
The results show a significant decrease in reservoir outflows due to climate change. This is in line with the results of other research for northern Spain.
6. Conclusions
A methodology to assess the influence of climate change on hydrological dam safety is presented, based on a stochastic rainfall generator, a continuous rainfall-runoff model and a method to identify the best operation of spillway gates in flood events. The methodology has been applied to the Eugui Dam in Spain. Climate projections of 12 climate modeling chains in three subperiods in the future and two emission scenarios supplied by the EURO-CORDEX program have been used.
In the Eugui Dam, future annual maximum peak outflows are expected to be equal to or lower than those of the current conditions in the reference period. Though rainfall in this catchment is expected to be similar to the current conditions, the number of wet days per year will be smaller in the future. In addition, the rainfall is expected to be more intense in the future. However, the soil moisture content is expected to be drier at the beginning of flood events in the future. Therefore, initial soil moisture condition is expected to be drier, and rainfall infiltration will be higher, absorbing a higher part of the initial precipitation in storms than in the current conditions. Consequently, runoff amounts are expected to be smaller in the future.
No significant variations in the annual maximum peak outflow frequency curves are observed in terms of the emission scenario, considering the median values of the 12 climate modeling chains. However, analyzing the climate modeling chains separately, a larger variation is observed depending on the period and emission scenario considered.
In the future scenarios, the median frequency curves of annual maximum reservoir water levels in the 12 climate modeling chains remain constant for all return periods in all the scenarios analyzed. As the dam spillway is operated by gates and the inflows are smaller than the maximum outflow discharge that the spillway gates can release with the reservoir water level at the top of the conservation pool, the maximum reservoir levels will not increase in most cases in a given flood event. Nevertheless, in all the cases, the maximum reservoir water levels reached in the future scenarios will be smaller than the water levels in the control scenario, considered as the current scenario. However, the dam crest level will be exceeded in some scenarios, as the conservation pool has been assumed to be full at the beginning of the flood events. Therefore, this methodology could point to the need to establish higher freeboards in the seasons when floods are expected to have a higher frequency. By modifying the freeboard, the effect of climate change can be dealt with in the areas or conditions where it is necessary. This stability is due, to a large extent, to the dam’s regulation capacity and efficient management by means of floodgates, which allows floods to be regulated and hydrological security levels to be maintained. In agreement with other studies, which have shown that the inclusion of dams in global climate impact models can substantially reduce population exposure to floods [
44].
Despite simulating a large amount of data (time series of 500 years with a time step of 15 min), computation times were acceptable, in the order of minutes. This computation speed has allowed simulations to be carried out using the projections of 12 climate modeling chains, three time periods in the future and two emission scenarios (72 simulations) in a short period of time. In addition, the sub-daily scale of rainfall and runoff time series made it possible to extract flood hydrographs that could be considered as input into the reservoir model.
The methodology proposed will allow a revision of the hydrological dam safety in dams with gated spillways, considering climate change and assessing its influence on hydrological dam safety.


 ,
, 


