Article

Impact of Different Building Roof Types on Hydrological Processes at the Urban Community Scale

1
Zhejiang Provincial Key Laboratory of Wetland Intelligent Monitoring and Ecological Restoration, Hangzhou Normal University, Hangzhou 311121, China
2
Institute of Remote Sensing and Earth Sciences, Hangzhou Normal University, Hangzhou 311121, China
3
Zhejiang Academy of Emergency Management Science, Hangzhou 310061, China
4
Zhejiang Urban and Rural Planning and Design Research Institute, Hangzhou 310007, China
5
Faculty of Geo-Information Science and Earth Observation (ITC), University of Twente, 7500 AE Enschede, The Netherlands
*
Author to whom correspondence should be addressed.
Hydrology 2025, 12(6), 154; https://doi.org/10.3390/hydrology12060154
Submission received: 12 May 2025 / Revised: 11 June 2025 / Accepted: 16 June 2025 / Published: 18 June 2025
(This article belongs to the Special Issue Advances in Urban Hydrology and Stormwater Management)

Abstract

As urbanization accelerates and urban hydrological cycles evolve, roof typology emerges as a pivotal role in water retention capacity and drainage efficiency. To systematically evaluate the influence of various roof types on urban hydrological processes, this study designed four distinct catchment scenarios: Thiessen Polygon Scenarios (TS), Roof Type Consideration Scenarios (RS), Full Flat-Roof Scenarios (FS), and Full Pitched-Roof Scenarios (PS). This study employed the Urban Flood Intelligent Model (UFIM) to simulate urban flooding scenarios, utilizing precipitation data from 21 August 2024 combined with four distinct return periods (1a, 5a, 10a, and 20a) as hydrological inputs. The results show that roof types significantly affected hydrological processes in urban communities. Flat roofs accumulate water and drain slowly, making it easy to form larger areas of accumulated water during peak rainfall periods, thereby increasing the risk of urban flooding. Pitched roofs drain quickly but experience a brief rise in water level during peak hours due to rapid drainage. Based on these insights, priority should be given to the use of sloped roof design in areas prone to accumulated water to accelerate drainage. In areas requiring runoff mitigation, the strategic integration of flat roofs with green roofs enhances rainwater retention capacity, thereby optimizing urban hydrological regulation and bolstering flood resilience.

1. Introduction

Urban areas are the most densely built-up areas of the surface area, and urban hydrological processes are profoundly influenced by buildings [1,2,3]. With the accelerated urbanization process, cities are expanding, resulting in a large amount of land being added to man-made surfaces [4]. This large-scale land hardening has led to the disruption of the original natural hydrological cycle and a rapid increase in stormwater runoff, placing unprecedented pressure on the city’s drainage system [5,6]. Urban flooding caused by precipitation overloading of urban drainage systems has become an increasingly serious environmental and social problem, especially in the context of frequent extreme weather events [7,8,9].
To effectively deal with the problem of urban flooding, researchers have digitally simulated urban hydrological processes using physical models, which has enabled a more refined and in-depth study of these processes [10,11]. Among them, the Storm Water Management Model (SWMM) developed by the US Environmental Protection Agency has been the most widely used model in urban hydrological studies [12,13]. The SWMM can simulate in detail the rainfall–runoff process and the state of the drainage network in urban areas [14]. With the development of technology, the simulation of urban hydrological processes has been extended from one to two dimensions. By providing a more accurate depiction of spatial distribution and dynamics, 2D hydrologic models allow researchers to better understand and predict the water flows in complex urban environments. Such models not only account for flow in the horizontal direction, but also capture details such as accumulated water in streets, fluid behavior around buildings, and interactions between surface and subsurface drainage systems [15,16,17].
As the first surface in contact with precipitation processes in urban hydrological processes, urban roofs play an important role in the study of urban hydrological processes [18,19]. Roofs are impervious surfaces and are one of the major sources of stormwater runoff. Precipitation and roof characteristics (e.g., flat roof vs. pitched roof) [20,21] can affect runoff formation, velocity, and flow [22]. Flat roofs usually have a large water storage capacity, which may result in initial rainfall being temporarily stored on the roof surface before it flows into the drainage system. In contrast, pitched roofs [23] allow rainwater to drain away more quickly because of their sloping design [24]. Therefore, rational consideration of roof types and their hydrological structures is essential for accurately modeling urban hydrological processes [25]. Many scholars have investigated the impact of roofs on urban precipitation processes. Ercolani et al. investigated the mitigation of stormwater runoff in urban watersheds with high flood risk by green roofs with different coverage. They found that green roofs effectively reduced the flow peaks and total volume in the drainage network, especially when dealing with frequent but less intense rainfall [26]. Piyumi et al. found that green roofs, as low-impact development facilities, are effective in managing surface runoff, especially during average and moderate rainfall events, and can help reduce the occurrence of flooding. However, these facilities alone are not sufficient under extreme rainfall events [27]. Versini et al. found that at the building scale, green roofs significantly reduce peak flow and runoff in urban areas. For events with rainfall accumulations greater than 1 mm, the volumetric runoff coefficient for a 3 cm substrate depth averaged 0.17, whereas for a 15 cm substrate depth, it averaged 0.11 [28]. The above studies show great concerns about building roofs. However, most of the studies are limited to green roofs and have not yet fully considered the unique impacts of urban roofs, which limits the accuracy and usefulness of the modeling results [29,30,31]. Therefore, it is necessary to thoroughly study the impact of urban roofs on urban hydrological processes to promote theoretical and technological progress in urban hydrology.
This study constructs a high-precision urban hydrological model using UFIM by incorporating the drainage structures of different roof types. Four scenarios (TS, RS, FS, PS) were designed to evaluate the improvement in model simulation accuracy when roof types are considered, as well as to analyze the influence of different roof types on urban hydrological processes. The study aims to provide a scientific basis for enhancing urban planning and construction practices, particularly in improving drainage system efficiency and developing effective flood control measures.

2. Materials and Methods

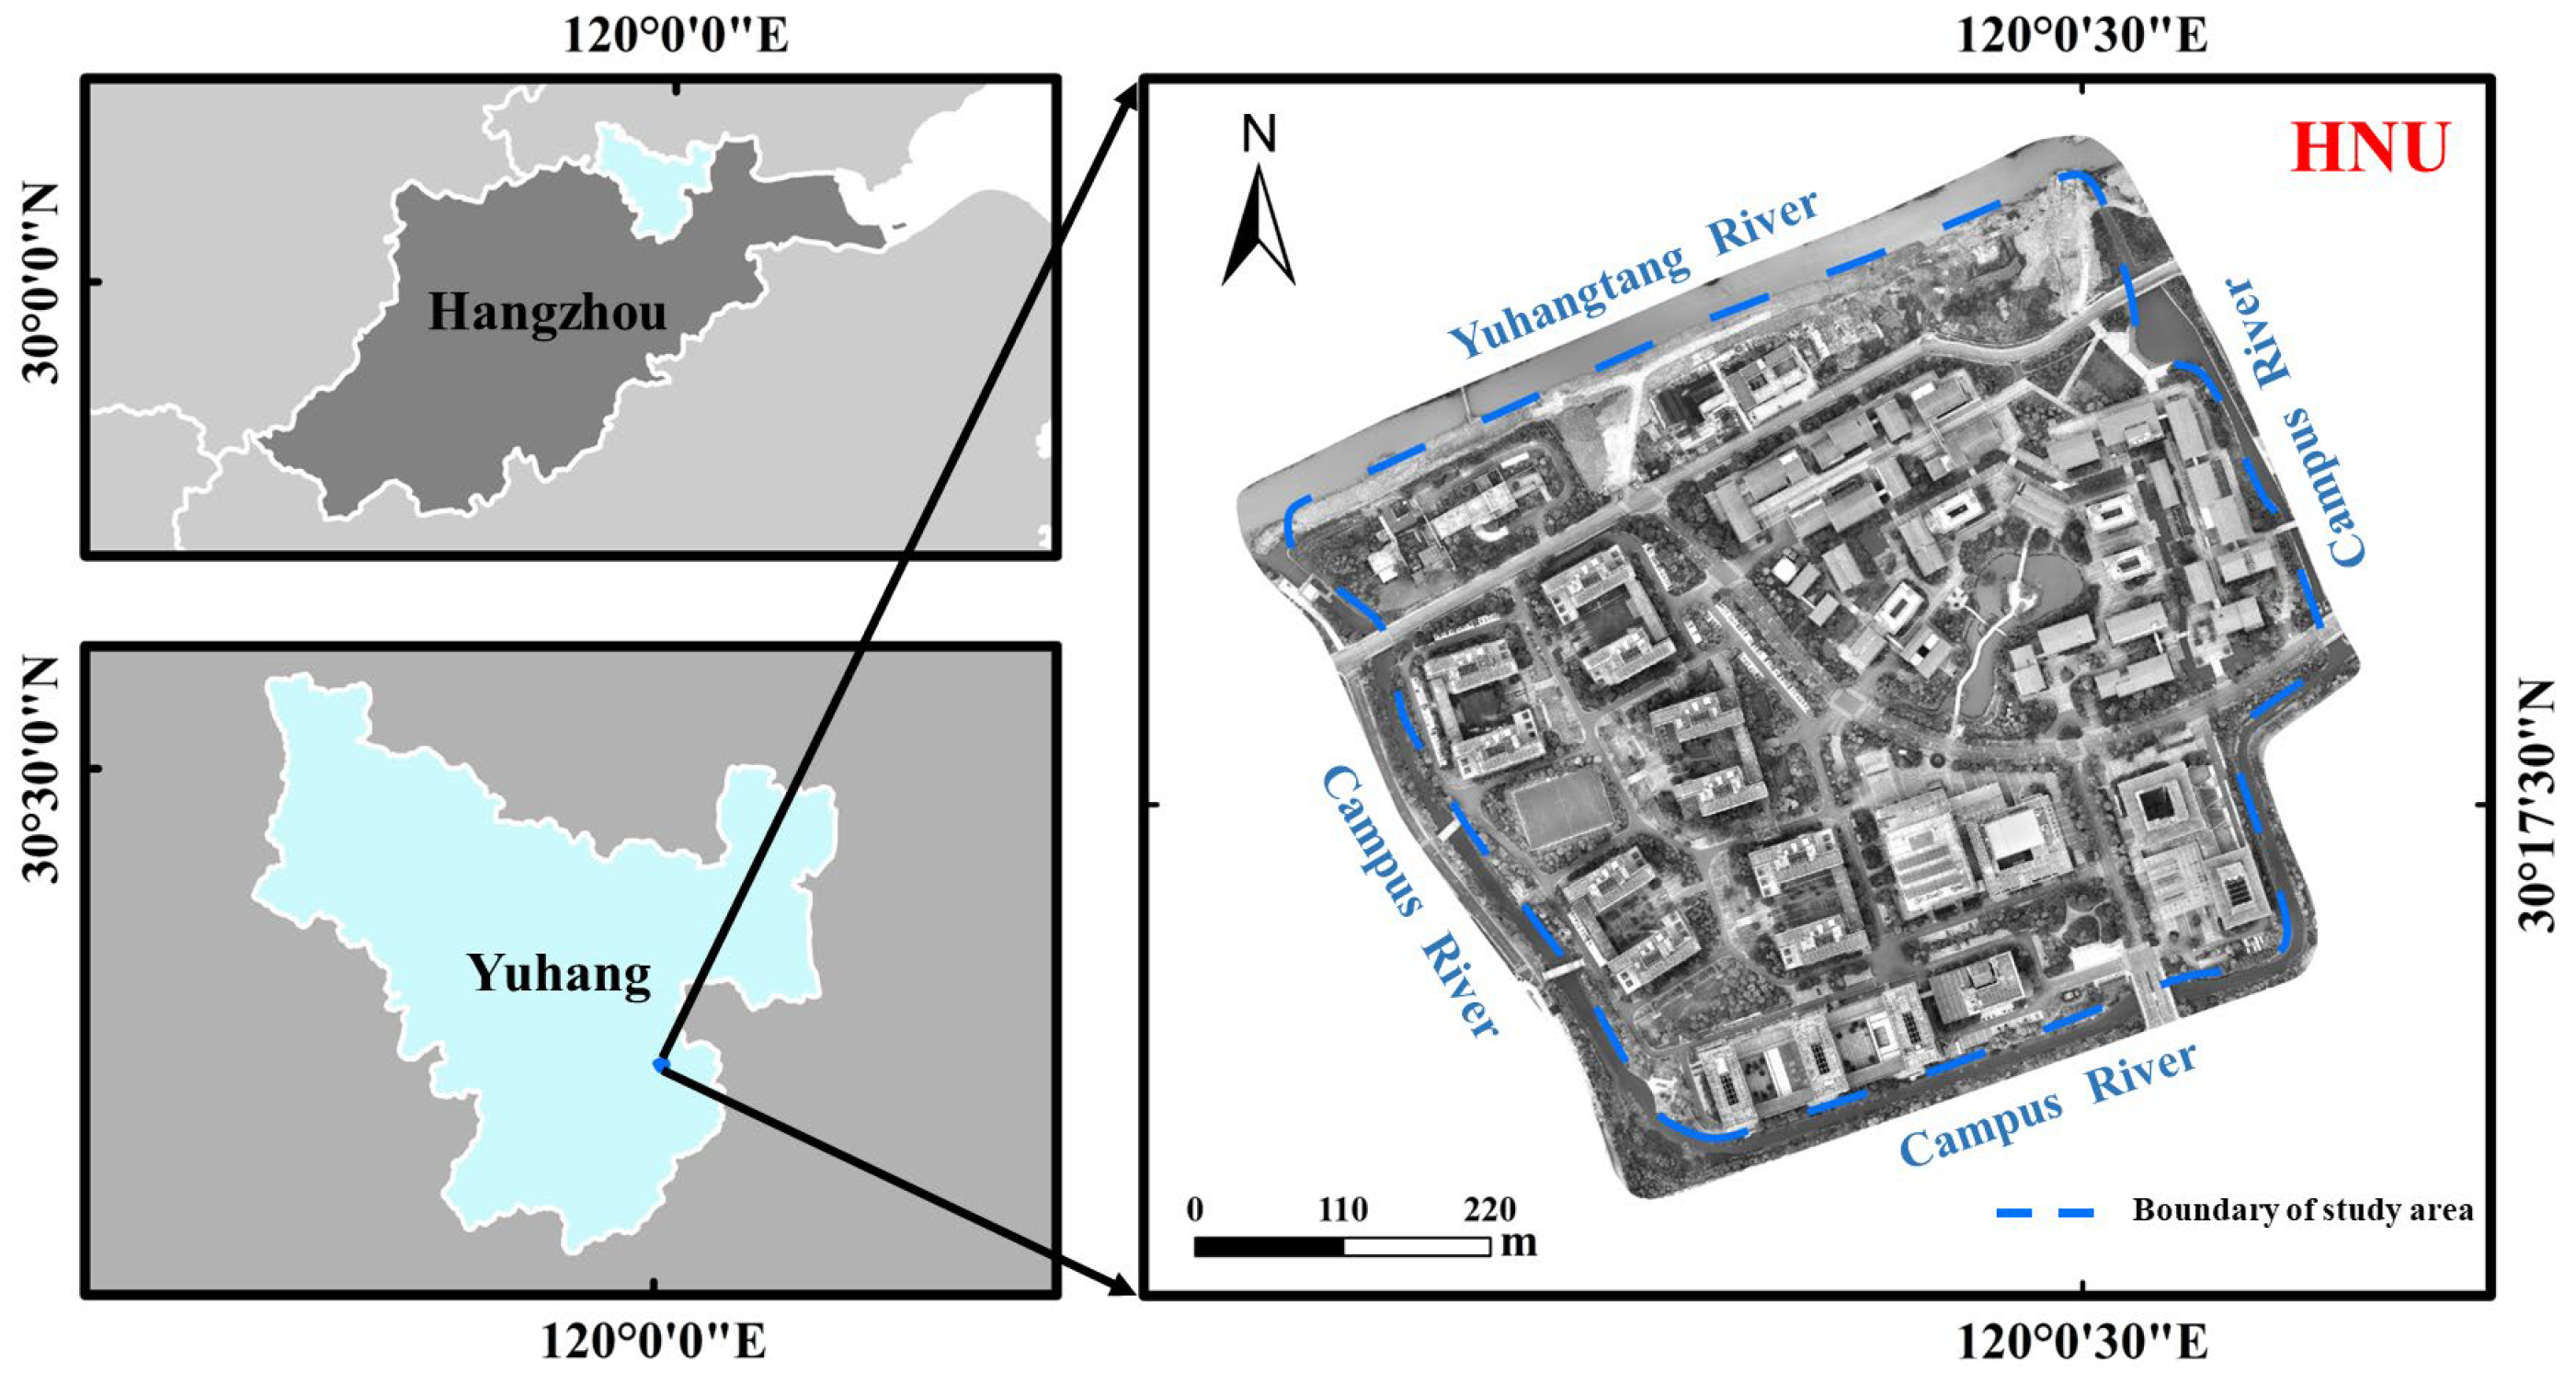
2.1. Overview of the Study Area

Hangzhou Normal University (HNU, 119°59′ E–120°0′ E, 30°17′ N–30°17′ N) is located in the central area of Yuhang District, Hangzhou (Figure 1). The average annual precipitation over the region is approximately 1500 mm [32]. The study area is on the south side of the Yuhangtang River, with a well-developed surrounding water system. The complex is surrounded by the Yuhangtang River and the campus river, forming a separate catchment unit. The total area of the study site is 0.41 km2, of which 22.63% is the built-up area. The area has a well-developed drainage system, but it is at high risk of urban waterlogging due to the numerous impervious surfaces in the area.

2.2. Data Sources and Processing

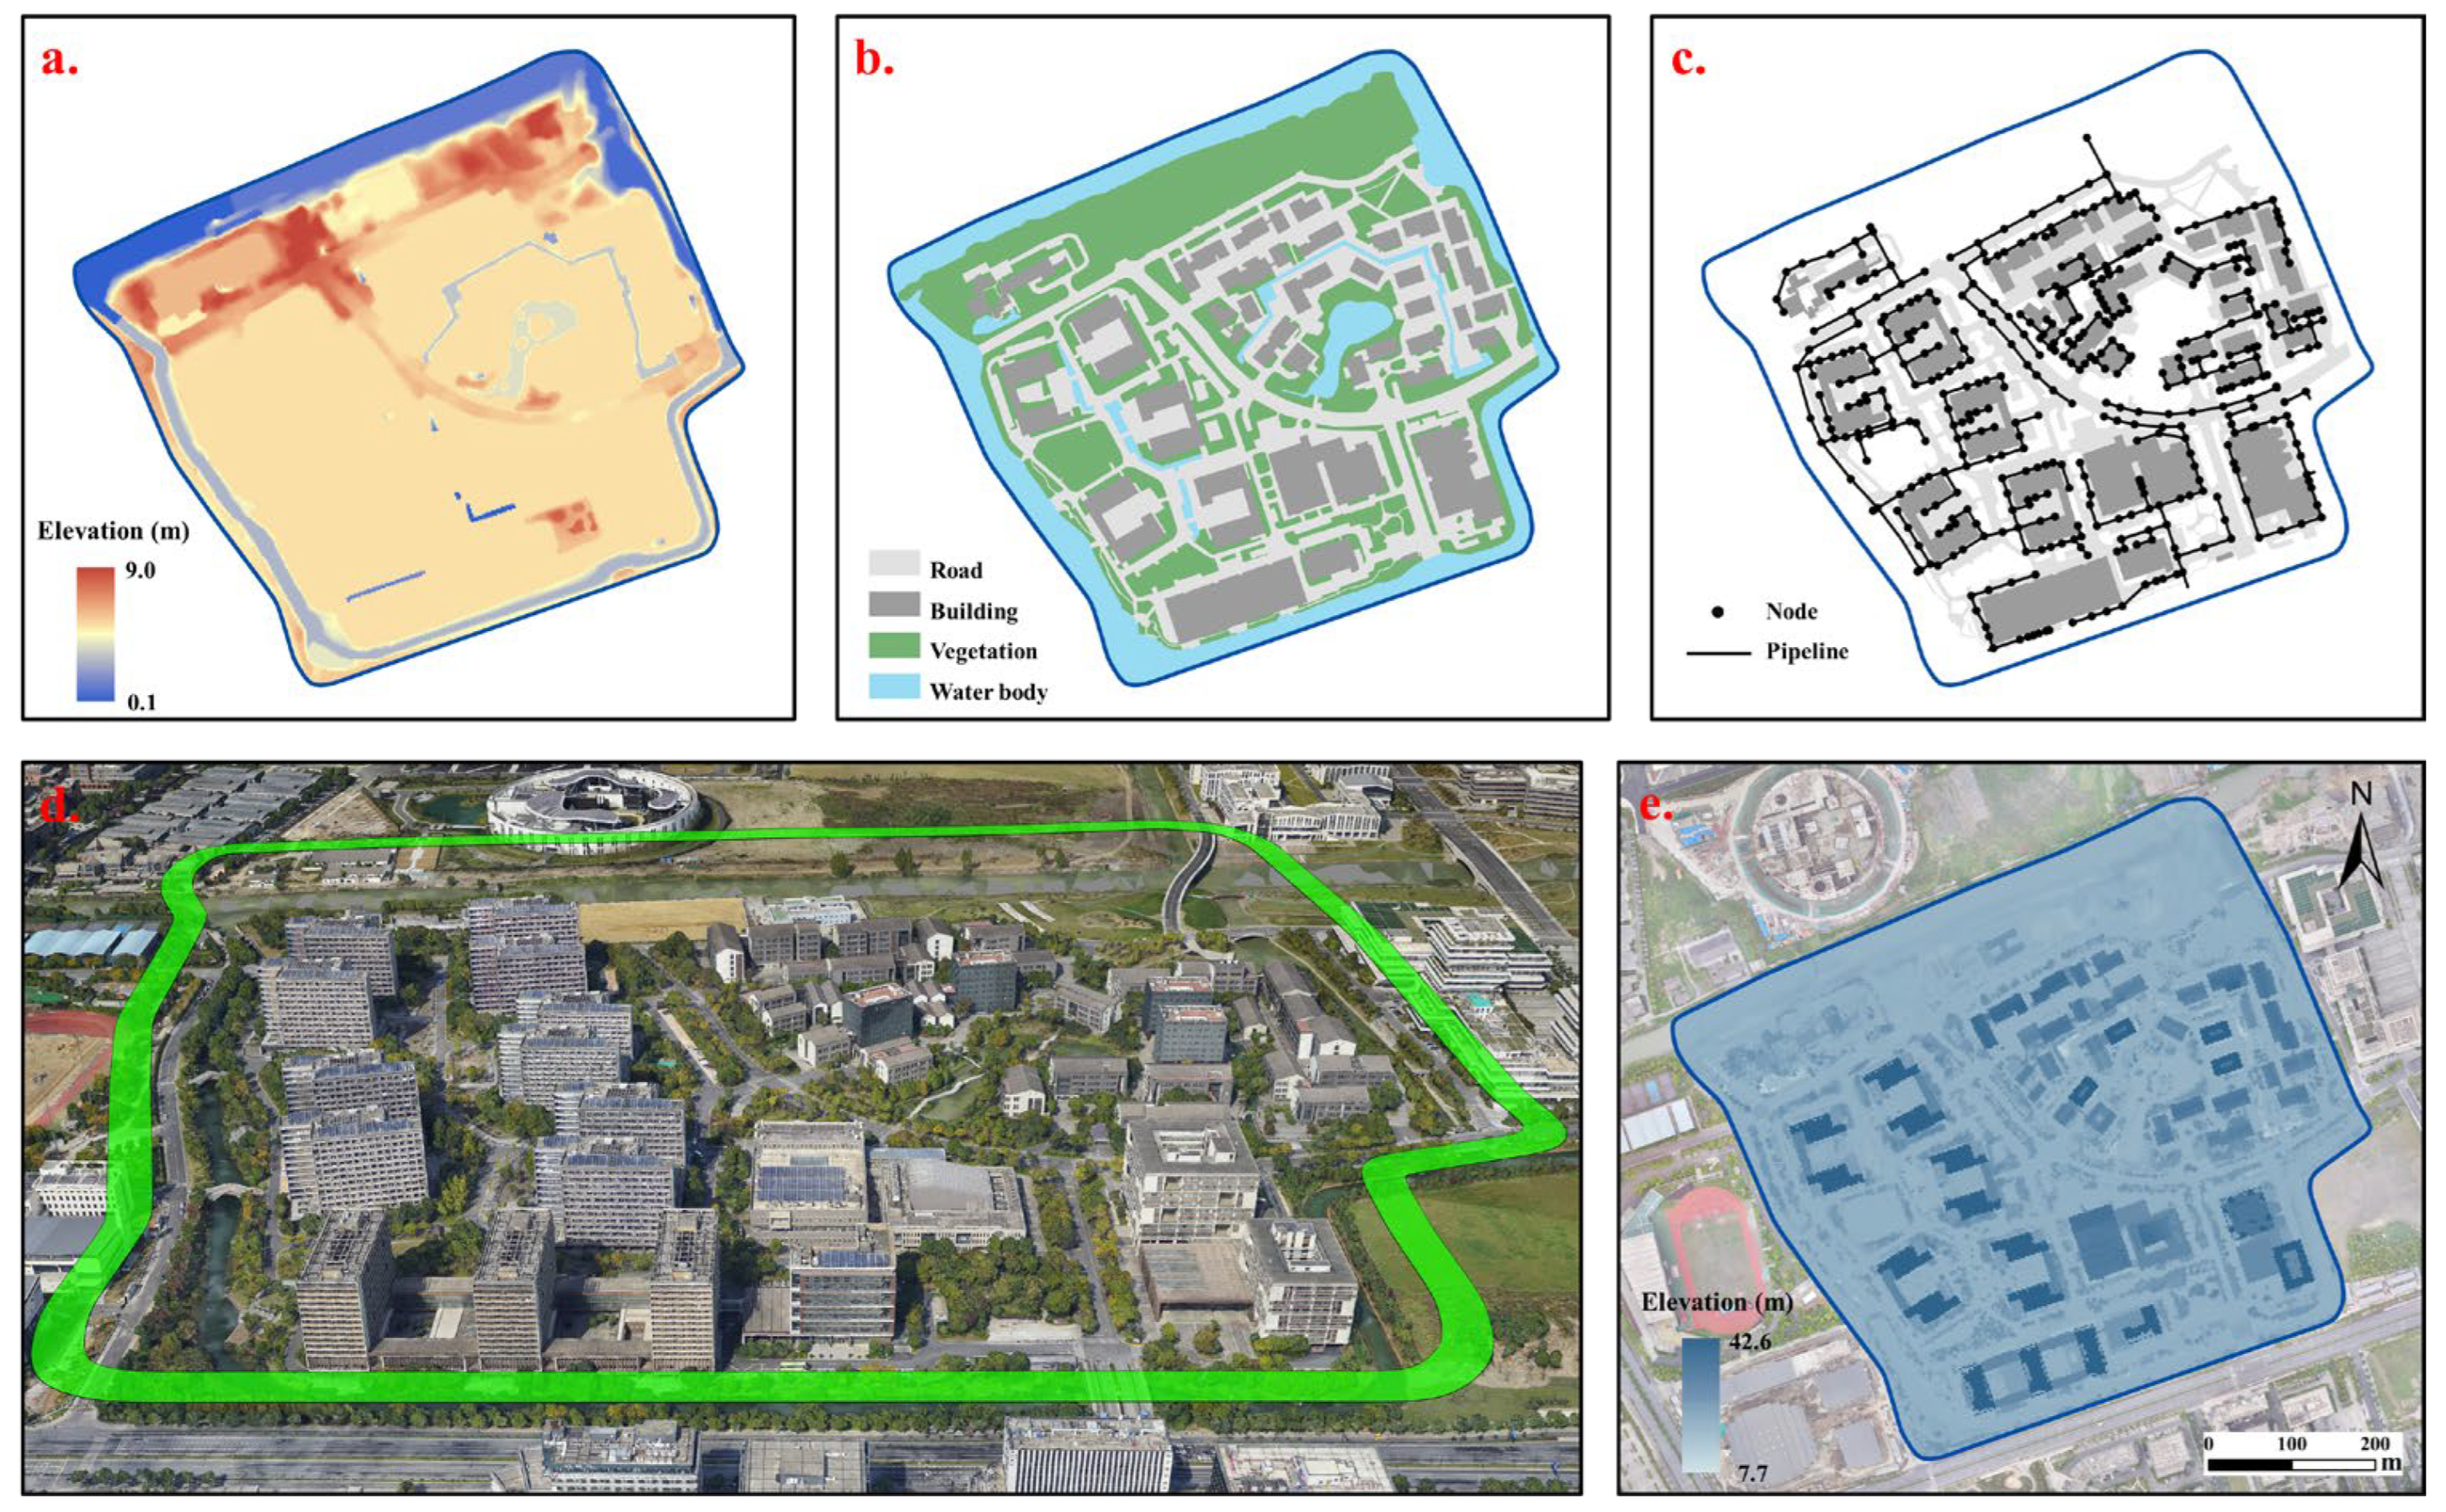
2.2.1. Basic Geographic Data

a. Digital elevation data
Digital elevation data were acquired using Unmanned Aerial Vehicle Light Detection and Ranging (UAV-LIDAR) and presented in point cloud format. First, the point cloud data were checked by the processing software [33]. After selecting the point cloud data in LAS format through preprocessing, the point cloud processing software completed the incoming trajectory, noise reduction, and low-point processing. The invalid point clouds were eliminated, and noise reduction was performed. Next, the point cloud classification threshold was set to conduct the classification, and the ground points were obtained [34]. Finally, the ground points were interpolated to obtain the Digital Elevation Model (DEM) with 1 m resolution (Figure 2a).
b. Land use data
Land use data were obtained by digitizing high-precision remote sensing images. The remote sensing images were sourced from UAV orthophotos with a resolution of 0.2 m. According to the actual situation, the study area was divided into roads, buildings, vegetation, and water bodies (Figure 2b).
c. Drainage network data
Drainage network data were derived from the municipal government. These data were vectorized based on the region’s pipeline design drawings and related planning information. In the vectorization process, the focus is on constructing the topology of the drainage network. The drainage node is interconnected with the pipe to select the drainage outlet. Upon completion of the buildup, 12 pipelines and 33 nodes were located in the study area (Figure 2c).

2.2.2. Digital Surface Modeling

The Digital Surface Model was built with oblique photography. It is an aerial photography technique that captures detailed information about features by photographing the ground from multiple angles (usually front, back, left, right, and vertical perspectives) [35]. This multiview data capture can be used to generate 3D models, including those with textural features of the feature elevations and the Digital Surface Model (DSM) [36]. The 3D modeling process based on oblique photography includes the following key steps: flight plan development and execution, image acquisition and preprocessing, feature point matching and outer orientation element solving, dense point cloud generation and texture mapping, noise removal, and DSM construction [37], with a spatial resolution of 1 m (Figure 2d,e).

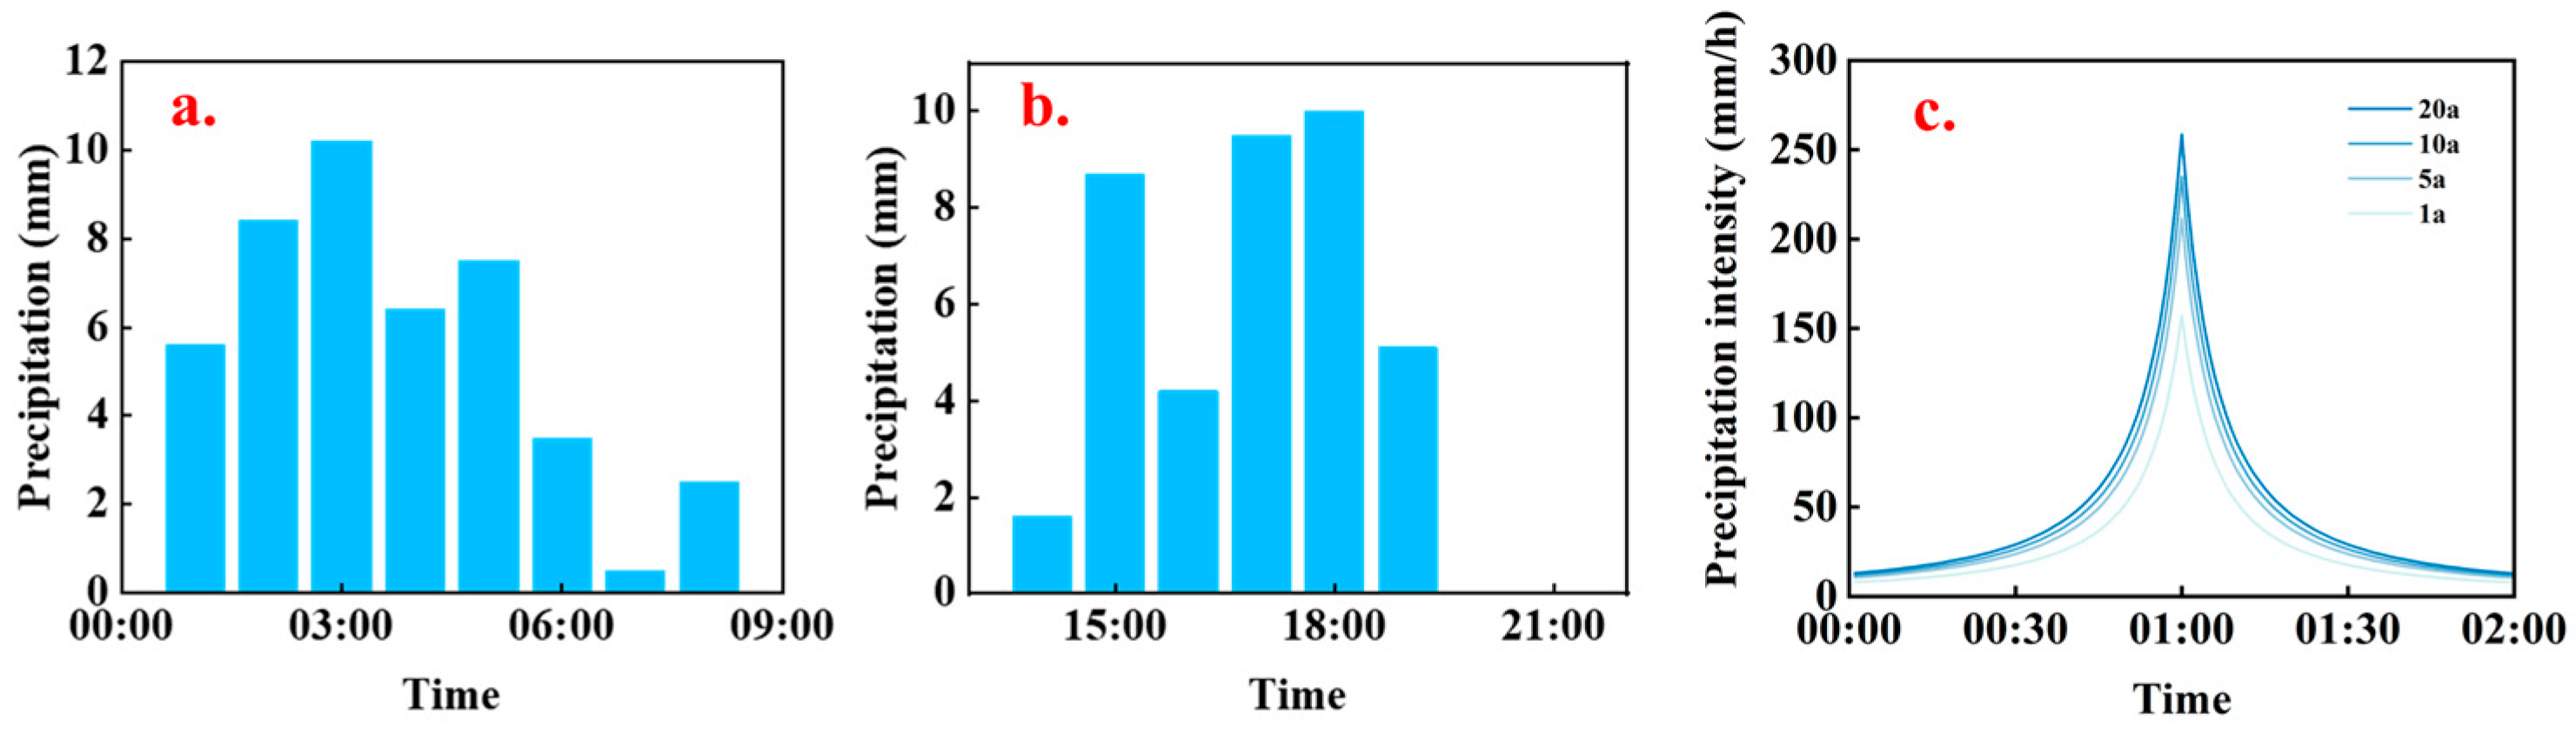
2.2.3. Precipitation Data

a. Actual precipitation
The actual precipitation data for this study were selected from the precipitation events on 21 August 2024, and 27 August 2024. The event on August 21 recorded a total precipitation of 45 mm and a duration of 8 h, while the event on August 27 recorded a total precipitation of 39 mm and a duration of 6 h (Figure 3a,b). Both precipitation events exhibited the typical characteristics of flooding in the study area: short duration and high intensity.
b. Design precipitation
The precipitation data used in this study were obtained from the storm design standards of the local municipalities. The standard is based on the climatic characteristics of the region, in which the study area is located to develop the storm intensity formula as follows [38]:
q = A + A · C · l g P t + b n
i a = A 1 C t a r + b t a r + b c + 1
i b = A 1 C t b 1 r + b t b 1 r + b c + 1
where q is the design storm intensity (L/(s·hm2)); t is the precipitation duration (min); P is the design return period (year); i a is the rainfall intensity before the rain peak (mm/min); i b is the rainfall intensity after the rain peak (mm/min); t a is the duration of rainfall before the rain peak (min); t b is the duration of rainfall after the rain peak (min); r is the rain peak coefficient; and A , C , b , and n are region-specific parameters that were derived based on long-term rainfall observations from local weather stations in the study area. These parameters reflect the regional rainfall patterns and were adopted in accordance with the Standards for rainfall intensity computation (DB33/T 1191–2020) [39]. In this study, the values of these parameters were taken as 7039.735, 0.497, 22.764, and 0.890, respectively.
According to the study requirements, six precipitation return periods of 1a, 5a, 10a, and 20a were selected as the input data of precipitation (Figure 3b).

2.3. Principles of Hydrological Modeling

Principles of One- and Two-Dimensional Hydrological Modeling

This study uses the Urban Flood Intelligent Model (UFIM) developed by Hangzhou Normal University for hydrodynamic simulation [40]. UFIM is a community-scale urban flood model that integrates high-resolution topographic data with dynamic real-time 1D–2D coupling and backflow effect modeling, enabling accurate simulation of water accumulation processes under different rainfall intensities and community types. The model consists of three main modules: the 1D pipe network model, the 2D surface inundation model, and the 1D–2D coupling module that considers the real-time dynamics of backflow effects.
a. One-dimensional pipe network model
The 1D pipe network model simulates the hydraulics within the drainage system using the Saint-Venant equations to describe the motion of incompressible flow in the pipe network. Flow velocity is estimated using Manning’s equation, and numerical methods are applied to solve the governing equations.
b. Two-dimensional surface inundation model
The 2D surface inundation model simulates the spatiotemporal dynamics of surface water using the shallow water equations. It incorporates both mass conservation (to describe water balance) and momentum conservation equations. With open and wall boundary conditions applied, and friction coefficients considered, this model enables high-precision prediction of flood inundation processes.
c. One-dimensional and 2D coupling considering the real-time dynamics of backflow effects
Based on the interaction mechanisms between the pipe network system and surface water, UFIM uses 1D–2D coupling to simulate backflow effects, thereby achieving a detailed representation of urban flooding processes.
The real-time variation in dynamic water levels in the drainage system is calculated using the water depth update formula. The water depth update formula for backflow water volume is as follows:
h p t + Δ t = h p t + Δ t · Q i n t Q o u t t Q o p ( t ) A p t
where h p t + Δ t and h p t are the water level heights in the pipe network within the time step t + Δ t , t , m; Δ t is the time interval, s; Q i n t is the flow flowing into the pipe network system within the time step t , m3; Q o u t t is the flow discharged through the pipe network outlet within the time step t , m3; Q o p t is the overflow of the pipe network within the time step t , m3; A p t is the effective cross-sectional area of the pipe network at the step t , m2.
The change in water volume caused by backflow effects is computed using the backflow volume calculation formula. The backflow volume calculation formula is as follows:
T i t + Δ t = t t + Δ t V t V m d t
where T i t + Δ t is the amount of backflow water, m3; V t is the actual volume flow rate, m3/s; V m is the minimum volume flow rate, m3/s; Δ t is the time interval, s.

2.4. Roof Structural Identification and Characterization

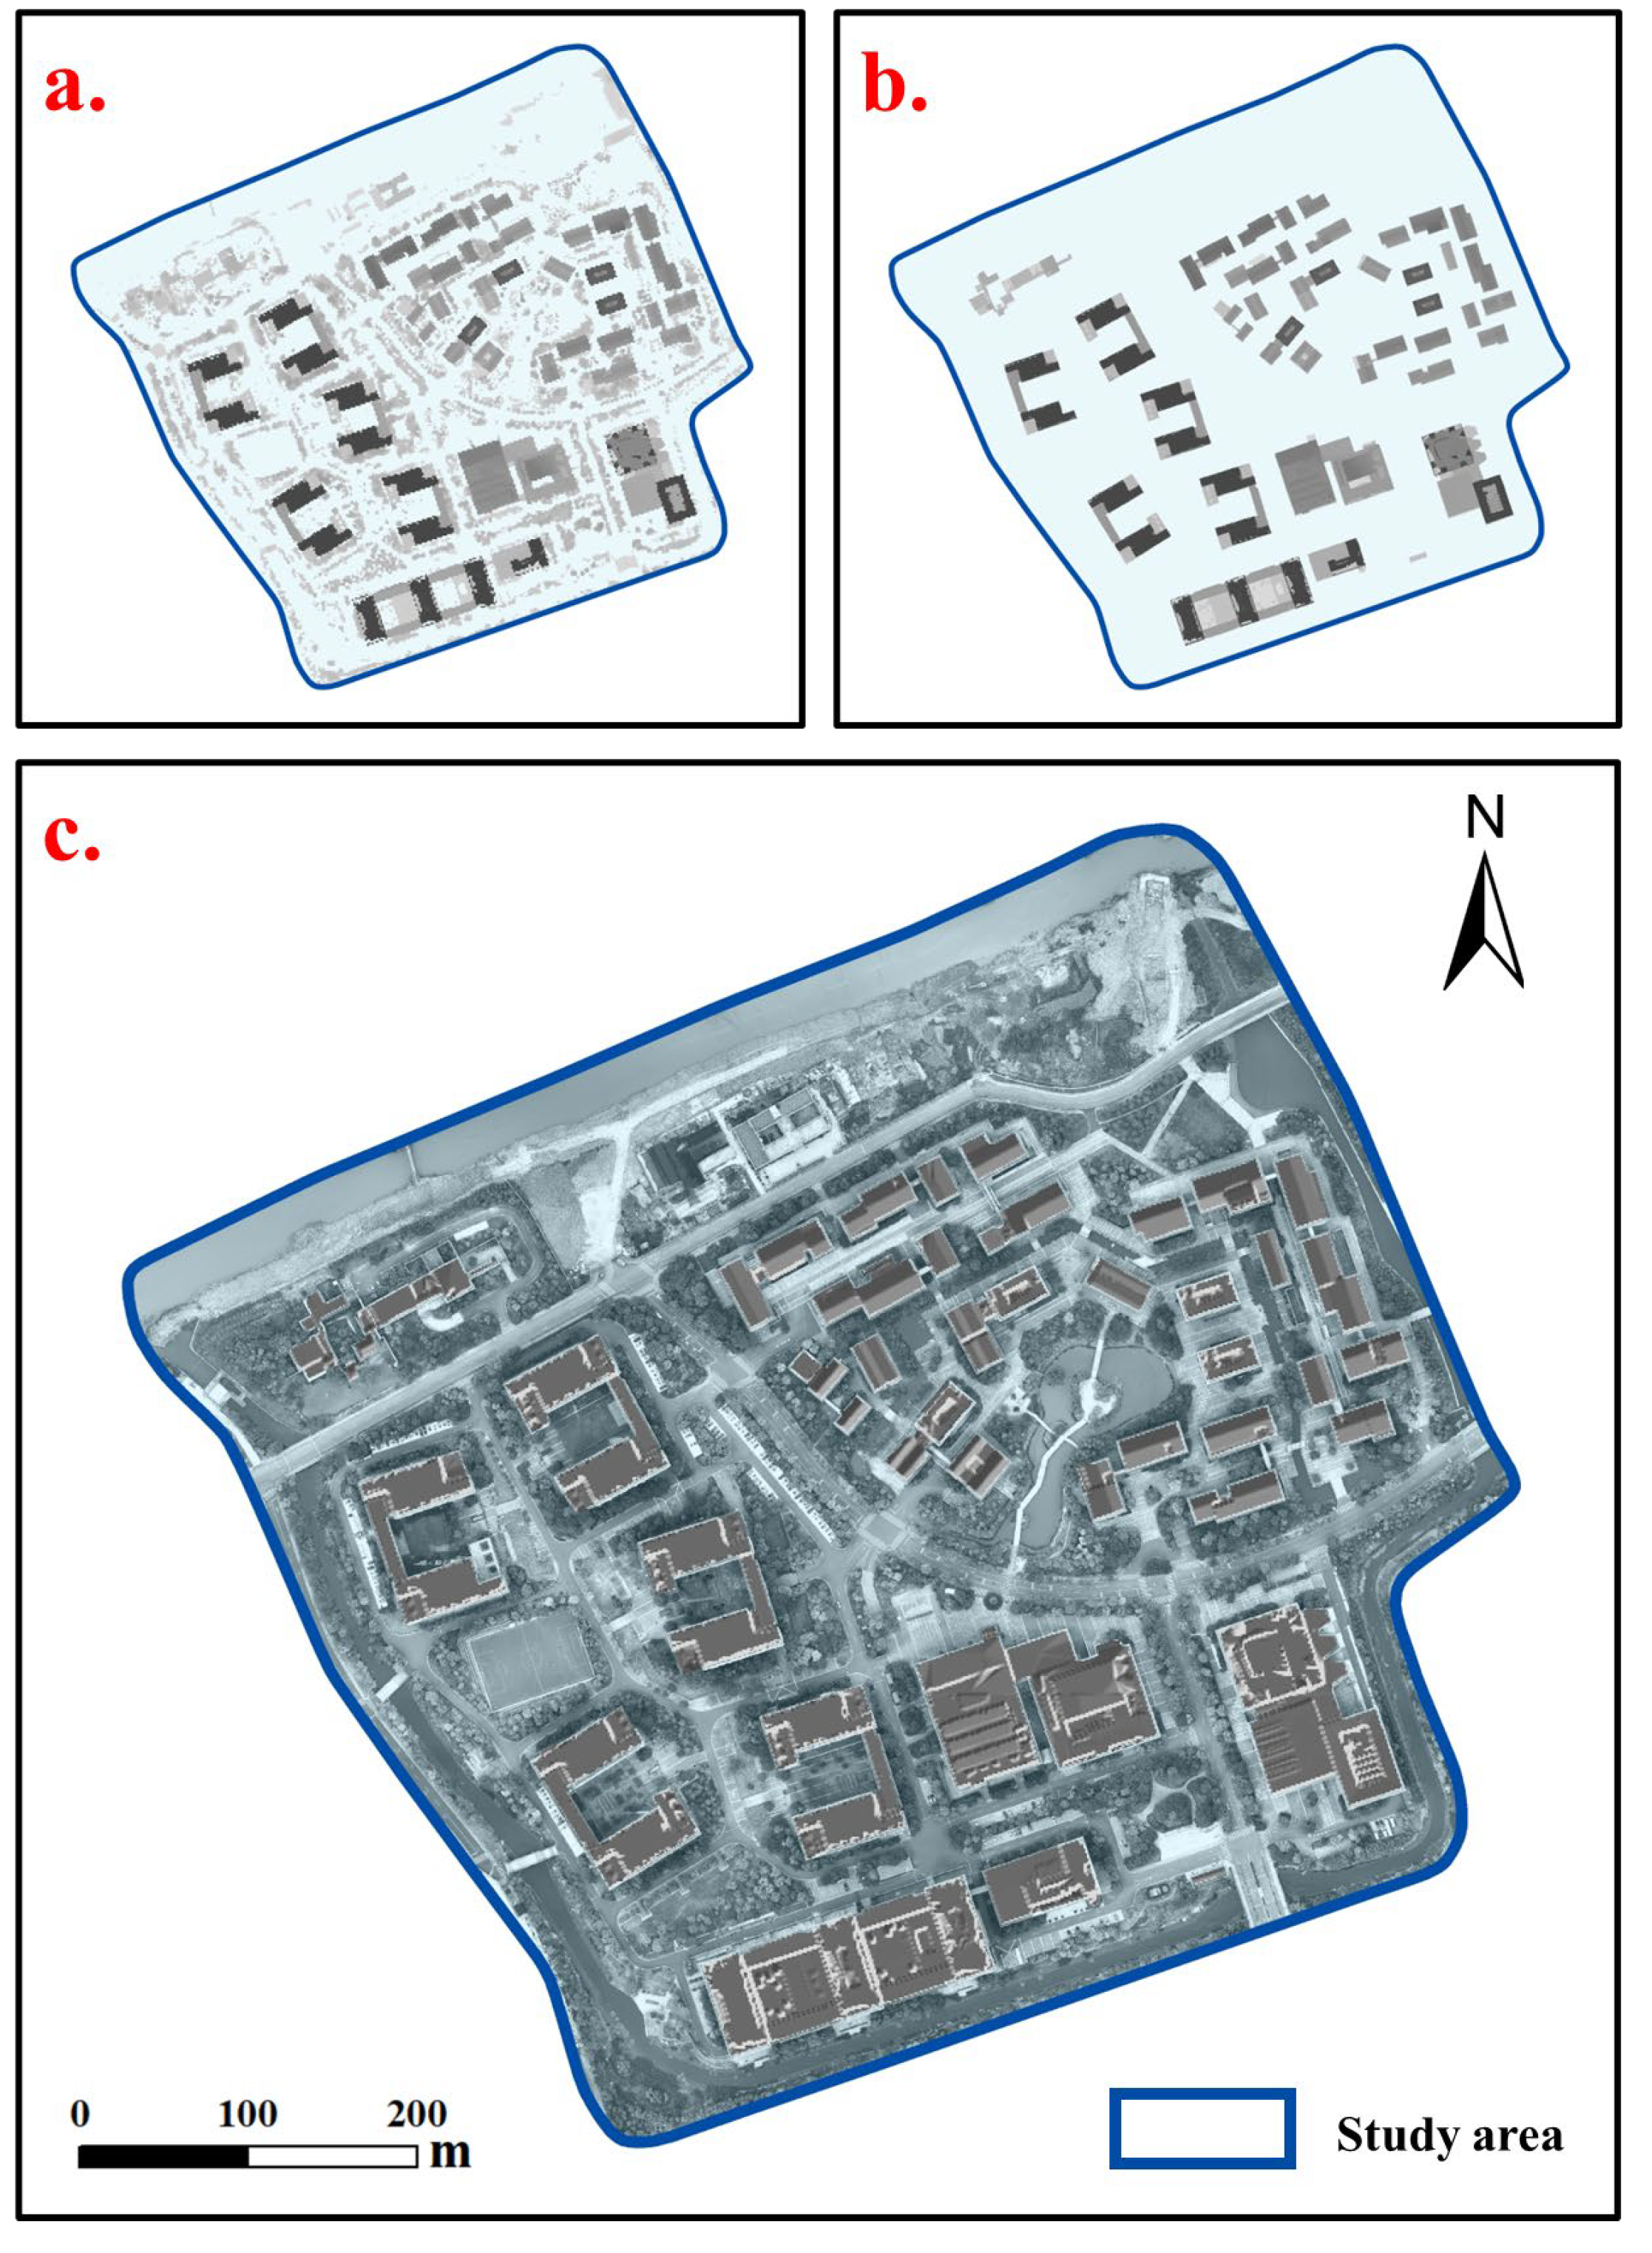
2.4.1. Building Roof Extraction

Accurate identification and analysis of roof structures are critical steps in the design and management of urban drainage systems. Roofs are not only an important part of buildings but also a major source of stormwater runoff [41]. Using oblique photography data and the DSM, we extracted roof elements, categorized roof types, and obtained geometric and physical characteristics. The process involved loading DSM data and processing it with the progressive morphological filter (PMF) algorithm [42], setting the initial structure element size to 3 × 3 pixels (3 m × 3 m), and setting the number of iterations to 10 [43]. The PMF algorithm resized structural elements to remove points above the surrounding area until a steady state was achieved, retaining ground points to form the DEM and separating nonground points (Figure 4a). Oblique photography and mask data were then imported to select non-surface features containing buildings based on mask data. Non-surface features in the oblique photography model were classified through expert interpretation using domain-specific criteria: buildings identified by standardized geometric patterns and repetitive architectural elements (e.g., window arrays) [44]; vegetations distinguished through clustered spatial distributions with phenological color variations [45]; water bodies characterized by specular reflectance properties exhibiting wave interference patterns and topographic shading effects, typically presenting lower luminance values; and other features delineated based on signature morphological attributes. Boundaries between features were identified based on textural variations and visual characteristics, especially where transitions were not obvious [46]. ArcGIS 10.2 software labeled different feature types in the images, creating high-accuracy vector layers. Finally, based on the high-precision vector layer of buildings generated in this step, building data containing roof information were extracted (Figure 4b,c).

2.4.2. Roof Type Classification

In the study area, roof types are mainly flat and pitched roofs, classified by extracting roof slope information from the previously obtained building DSM. The process involved importing the DSM for roof type categorization, calculating the slope of each pixel to generate a raster layer of building slopes, and median-filtering this layer to reduce noise from other features [47]. Based on field surveys, 24 known roof types—12 flat and 12 pitched—were selected as training samples, evenly distributed across the study area. Using slope as the characterization factor, a support vector machine model was trained with these samples [48], optimizing parameters and classifying the entire area. Finally, the classification results were corrected using the oblique photography model and converted into vector files.

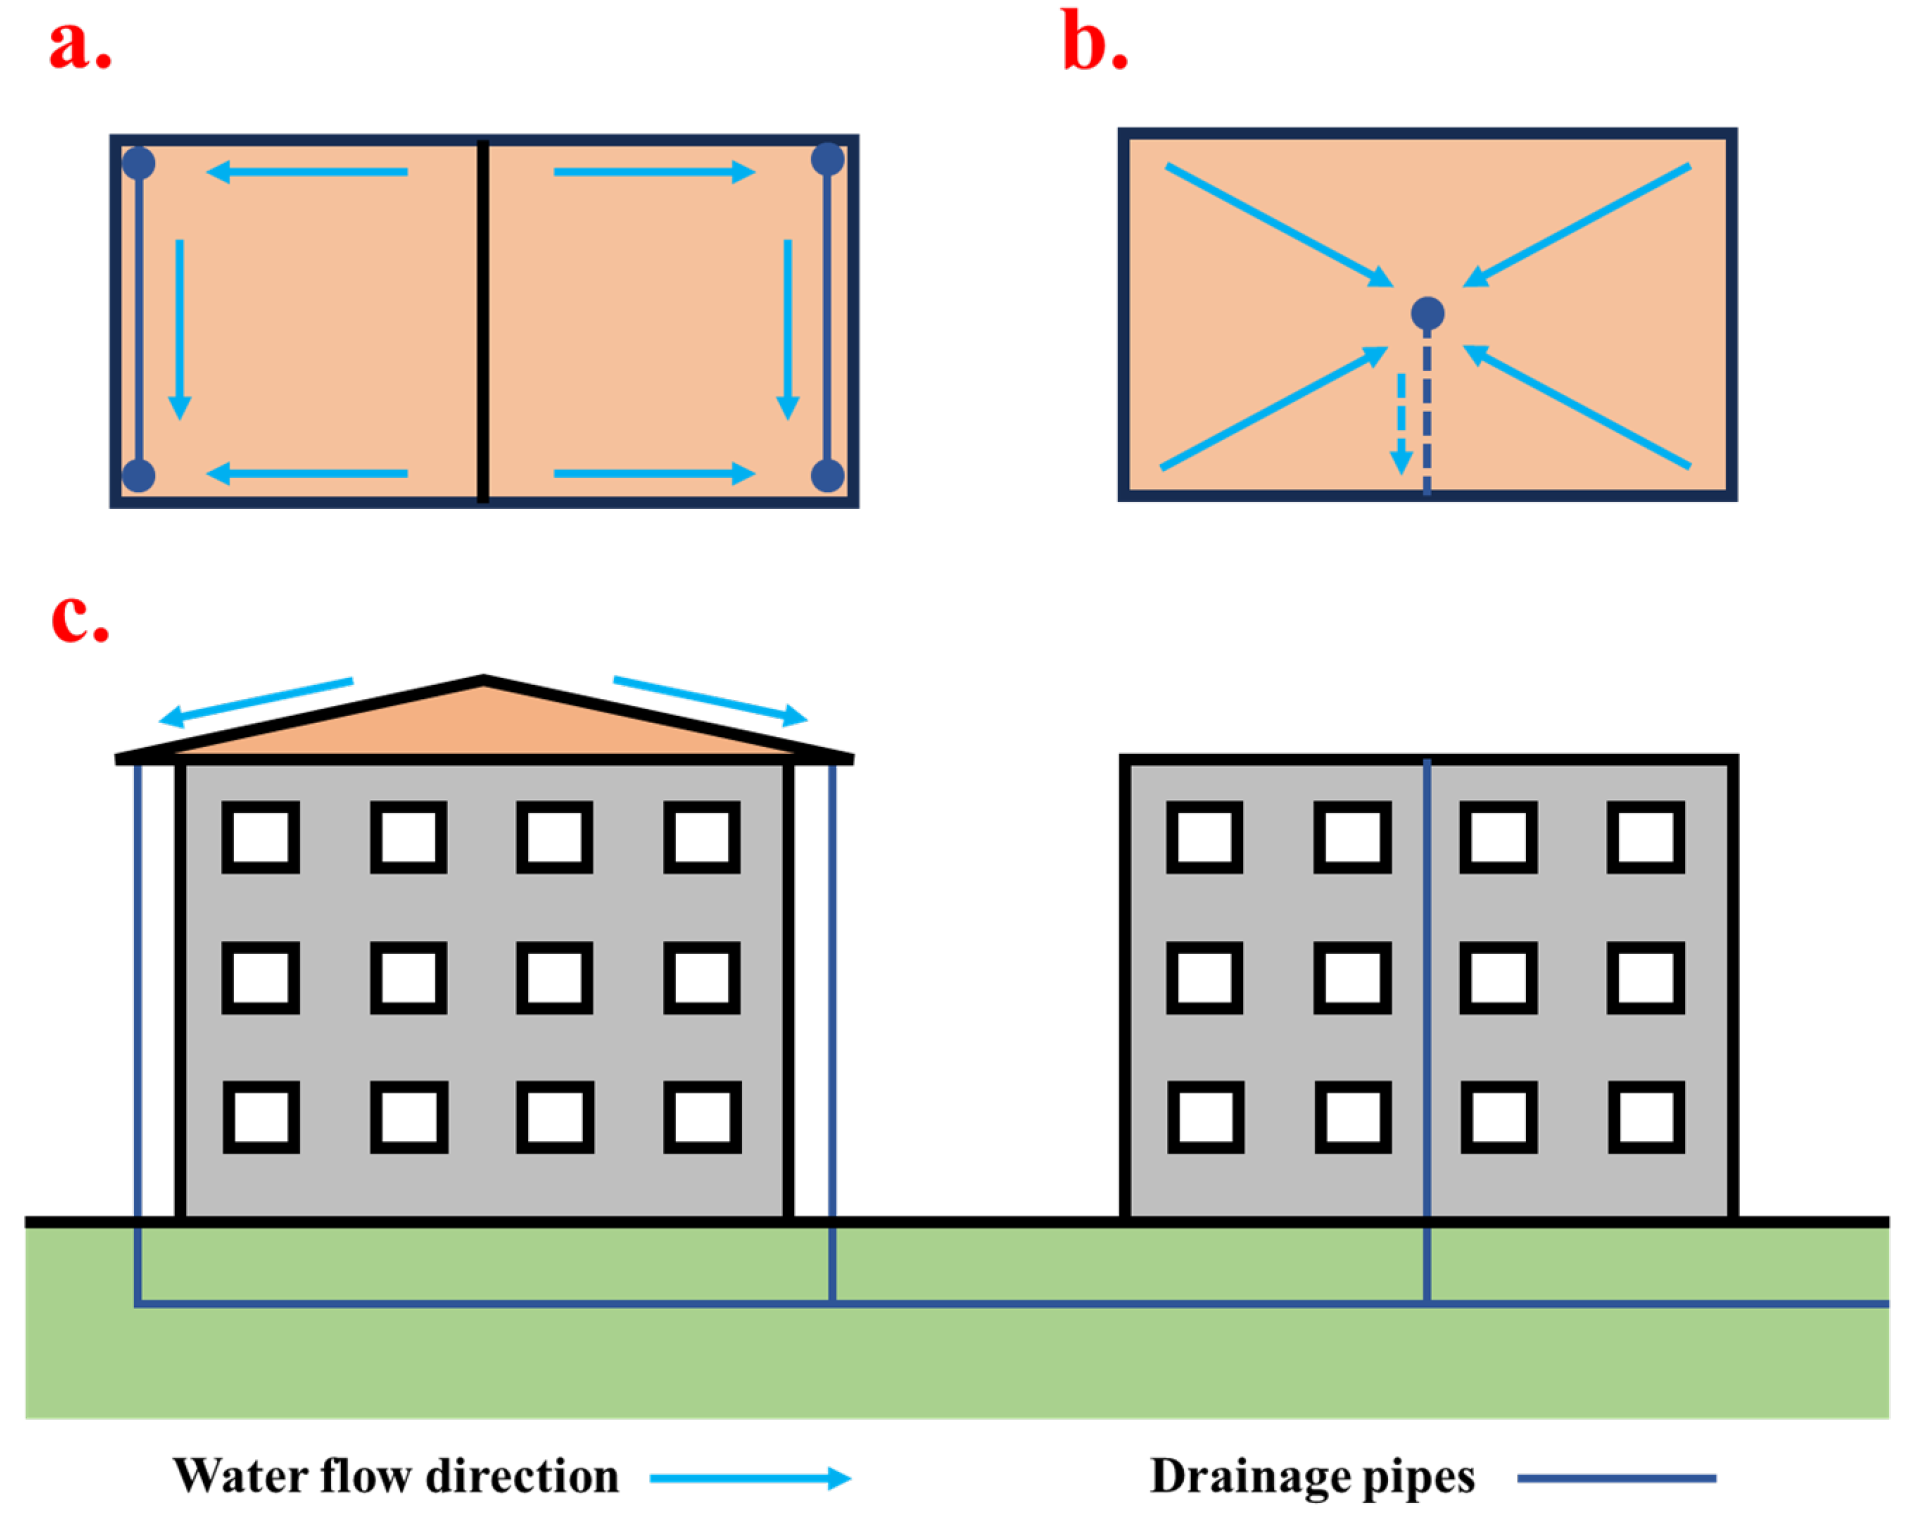
2.5. Establishment of Roof Drainage System Structures

In this study, the roof drainage system structure was mainly focused on the drainage node settings, pipe properties, and drainage system layout in the roof.
a. Drainage node setting
Flat roofs generally have lower slopes and slower water pooling. They rely on gravity to pool water flow. In addition, small changes in water flow rate were observed throughout the region. Considering the hydrodynamic characteristics of flat roofs, a drainage node was placed at the geometric center of the roof.
Pitched roofs generally have larger slopes with higher water collection rates. Unlike flat roofs, pitched roofs generally have downspouts at their edges. Water flows into the downspouts by gravity [49] and is then discharged into the main drainage system. Considering the hydrodynamic characteristics of pitched roofs, a drainage node was placed at the roof edge.
b. Pipe properties
Pipe sizes were determined based on the study pipe design criteria and the actual hydrology of the study area. Considering the maximum expected rainfall intensity and runoff volume at the limit of the catchment area, the diameter of the pipe in the flat roof was set to 150 mm. For pitched roofs, downpipe simulation is also required. The diameter of the downpipe is generally smaller; thus, it was set to 100 mm. The pipe roughness parameter was set to 0.013 based on the pipe material used in the study area [50]. The pipe slopes reflect the actual condition of the roof and its interrelationship with the main drainage network. Thus, it is necessary to ensure that the upstream height is higher than the downstream height, so the pipe slope is determined by calculating the actual roof slope and assigning it to the pipe according to the roof’s orientation.
c. Drainage system layout
The drainage system layout refers to the distribution of the drainage nodes and pipes on the roof and their relationships to each other. Flat-roof drainage systems typically employ centralized configurations where strategically positioned roof drains, functioning both as hydraulic sinks and vertical conveyance conduits, are installed at roof geometric centroids. These structural elements form critical interfaces with municipal stormwater networks through engineered connections to primary drainage infrastructure (Figure 5a). The layout of a pitched-roof drainage system should primarily consider the structural model of the downspouts. According to the drainage node setting, the drainage nodes are generally at the edge of the roof [51]. Generally, one side of the roof has two drainage nodes, and according to the elevation of the drainage node, the construction goes from a high to a low downspout. The drainage node at a lower elevation is set as a rainwater well for vertical water conveyance, and the pitched-roof drainage system is connected to the main drainage pipe network (Figure 5b).

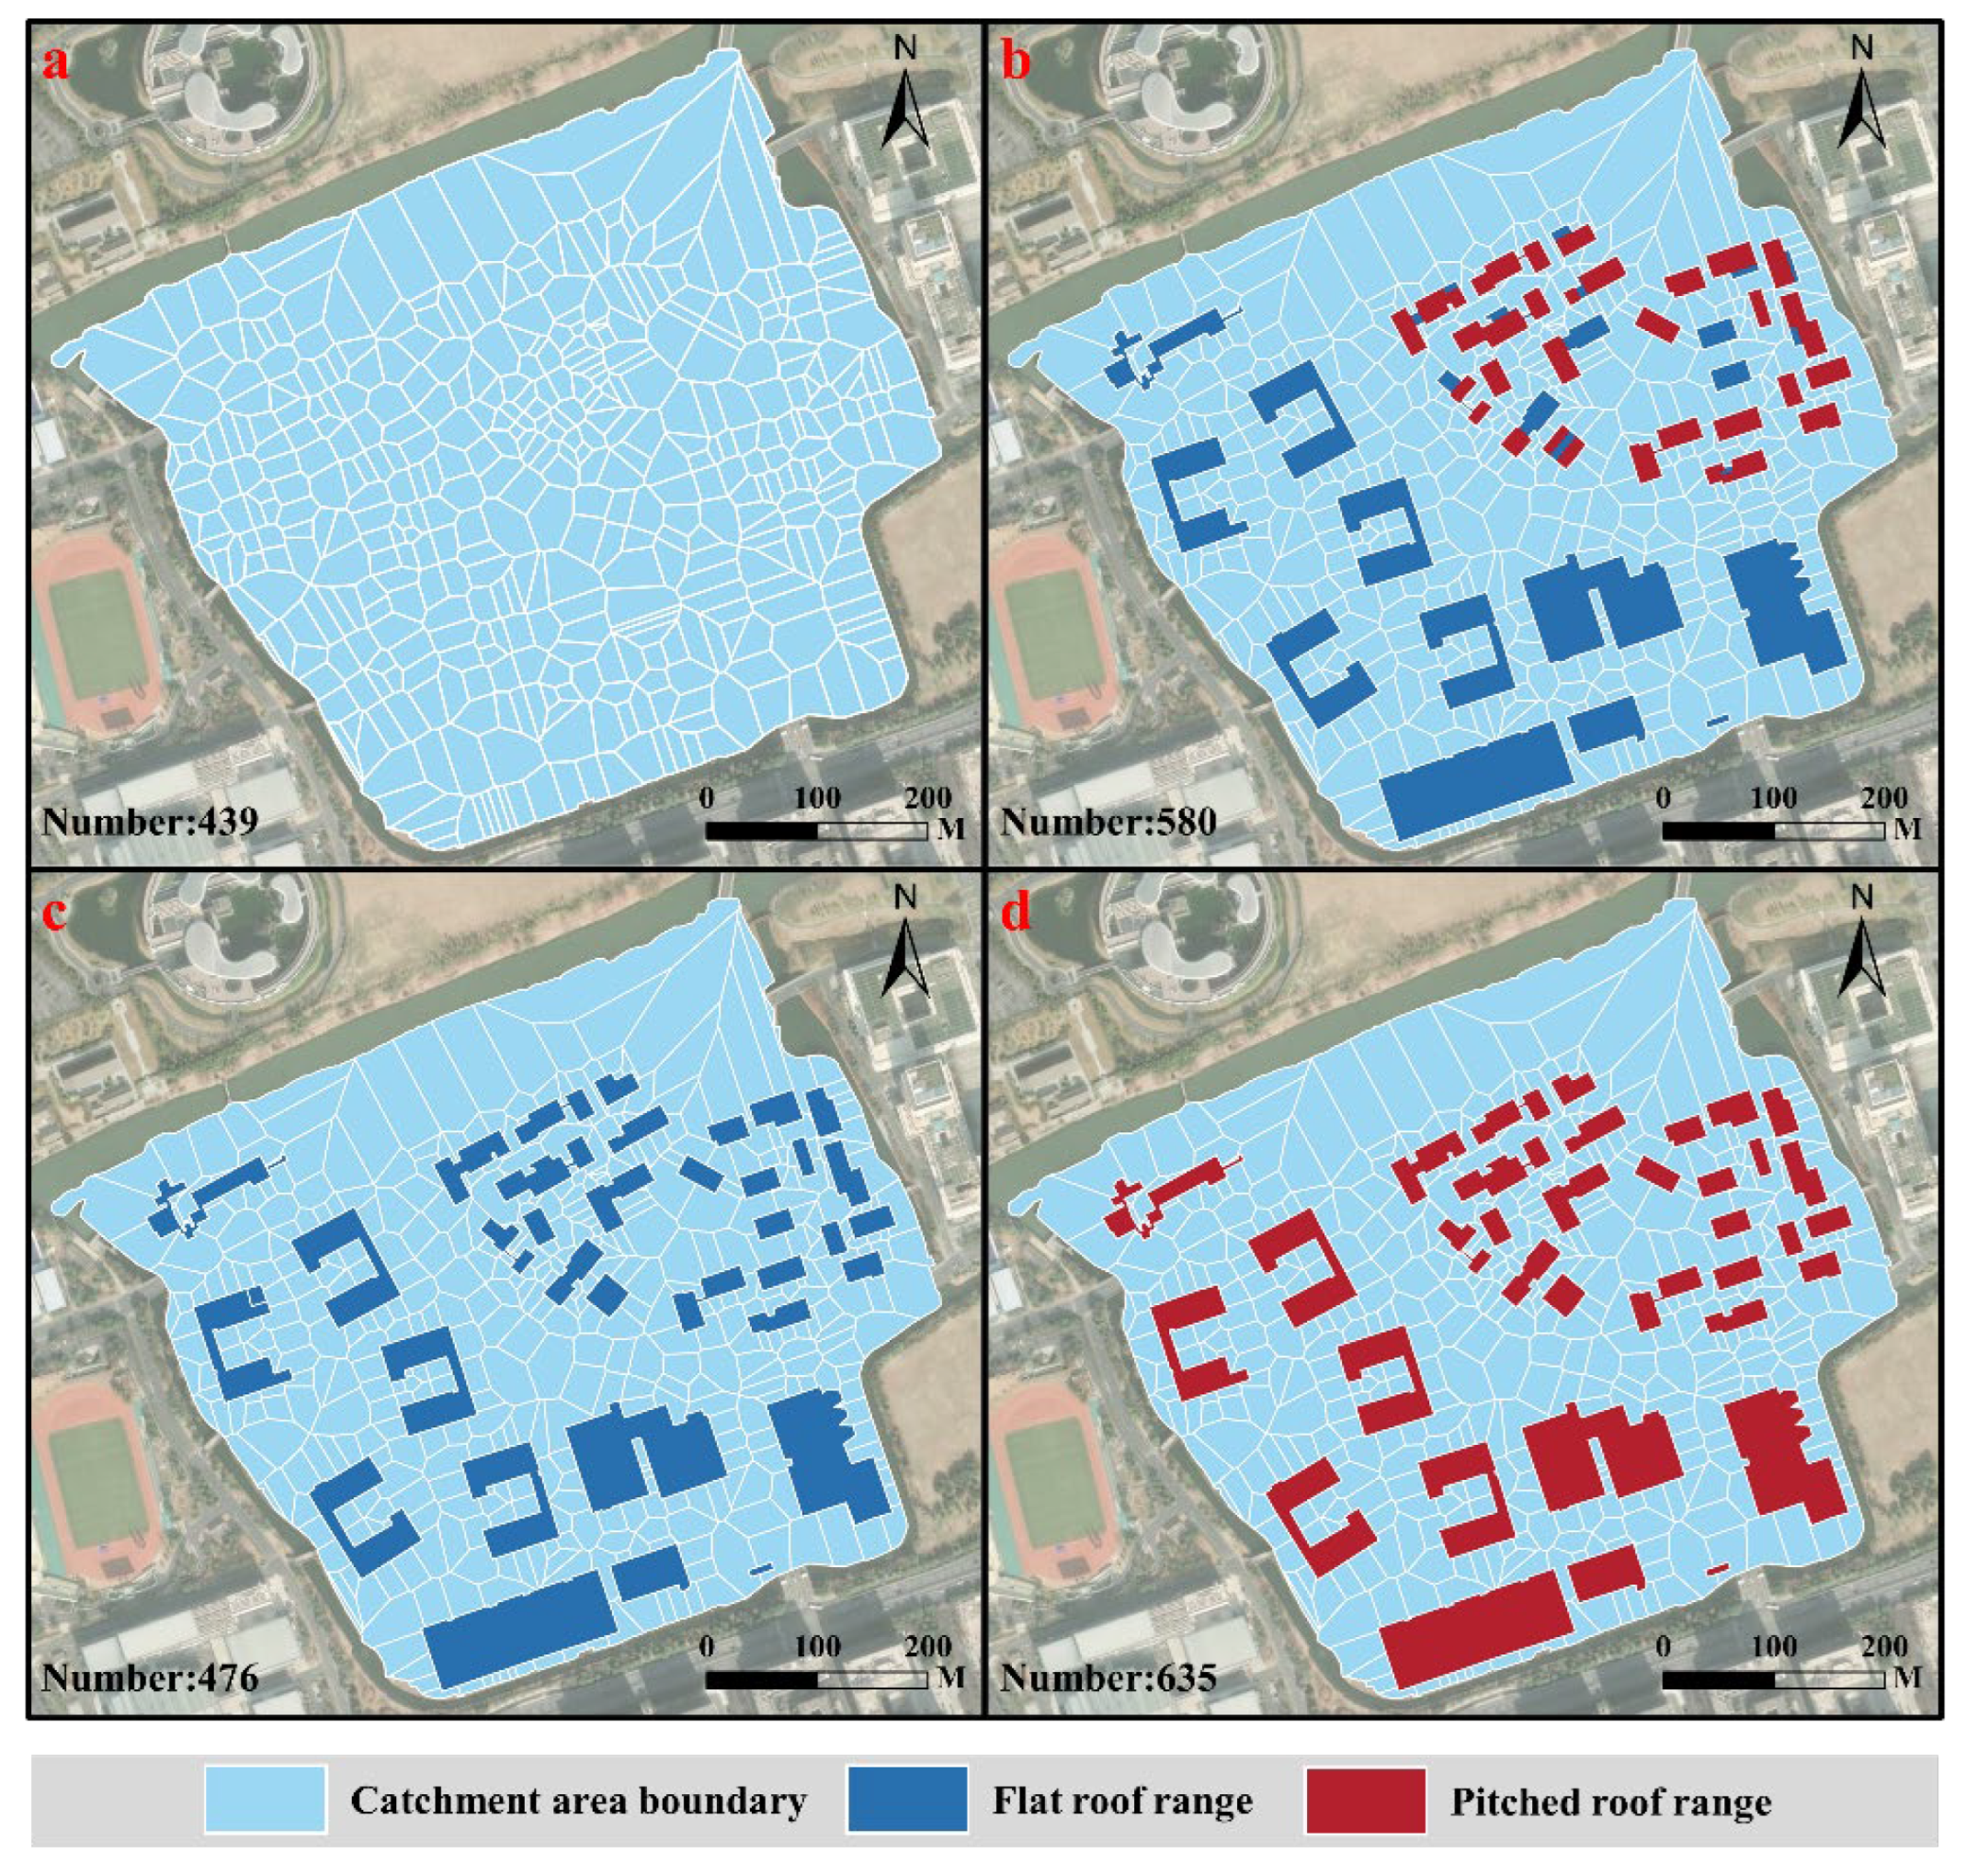
2.6. Catchment Area Delineation

Catchment area delineation is crucial for urban hydrological modeling, enabling more accurate drainage system modeling and runoff volume calculations by dividing an urban area into sub-basins [52]. In this study, roofs were categorized into flat and pitched types to refine catchment areas and improve model accuracy. For flat roofs, the entire roof was treated as a single catchment area, unless elevation differences or multiple drainage points required subdivision into smaller zones based on elevation and drainage paths. Pitched roofs were divided using ridge lines as boundaries, with each section forming a separate catchment area bounded by the ridge line and roof edge [53]. After delineating the catchment area, GIS software was used to calculate the related parameters and assign them to the catchment area. The catchment area width was obtained as follows [54]:
W = K S
where W is the catchment area width, K is the runoff coefficient, and S is the catchment area (m2).
The proportion of the impervious area was 100%. The slope was taken as the average slope in the catchment area, and Manning’s roughness coefficient N-Imperv was taken as 0.012 [55]. Finally, drainage nodes were matched and labeled to their respective catchment areas, completing the delineation process.

2.7. Modeling and Validation

In this study, an improved DEM was used to accurately reflect urban topographic features, including human influence. Catchment areas were rationalized by drawing and adjusting Thiessen Polygon Scenarios (TS), Roof Type Consideration Scenarios (RS), Full Flat-Roof Scenarios (FS), and Full Pitched-Roof Scenarios (PS) polygons based on the revised DEM and drainage facility locations, ensuring a realistic representation of water flow paths. High-quality precipitation data, including single-point rainfall station data and regional precipitation data, were input to ensure that the temporal and spatial resolutions met modeling requirements. Parameters were categorized into deterministic and uncertain types, with measured sensor data collected for validation and optimization to improve model simulation accuracy. Hydrological parameters determined according to boundary conditions were input into the model for calibration. The simulation time and step were set, and after configuring these settings, the model was run to obtain output results. In this study, precipitation scenes from 21 August 2024, were used as the validation data. Two indicators, Nash–Sutcliffe efficiency coefficient (NSE) and Root Mean Square Error (RMSE), were obtained by comparing the model simulation data of each scene, with the measured accumulated water data collected by the sensor. The definitions and calculation formulas of the above indicators are as follows [56,57]:
N S E = 1 i = 1 n Q s i m , i Q o b s , i 2 i = 1 n Q o b s , i Q ¯ o b s , i 2
R M S E = 1 n i = 1 n Q s i m , i Q ¯ o b s , i 2
where Q s i m , i is the simulated value at the i th time point, Q o b s , i is the observed value at the i time point, Q ¯ o b s , i is the average of all observations i , and n is the total number of time points.

3. Result

3.1. Results of Catchment Area Delineation

In this study, four scenarios were designed to analyze the impact of different roof types on hydrological processes within an urban community: Thiessen polygon catchment area scenarios(Figure 6a), real catchment area scenarios considering roof type (Figure 6b), catchment area scenarios in full flat-roof building environments (Figure 6c), and catchment area scenarios in full pitched-roof building environments (Figure 6d). These scenarios were modeled using GIS software based on actual hydrological conditions. The TS had 439 catchment areas, the smallest number among the four, with each polygon corresponding to a pipe point as a drainage node and an average area of 0.078 hm2. The RS increased to 580 catchment areas due to the categorization of flat and sloped roofs as separate catchment areas, showing more detailed spatial distribution patterns and an average area of 0.059 hm2. The FS had 476 catchment areas, concentrated in regions with predominantly flat-roofed buildings and an average area of 0.054 hm2. The PS, with 635 catchment areas, exhibited the most fragmented spatial distribution, as conventional roofs were divided into two separate catchment areas due to their sloped nature, resulting in an average area of 0.072 hm2. The significant difference between FS and PS highlights the importance of categorizing all roofs correctly. In the PS, roofs were categorized as sloped, not only increasing the total number of catchment areas but also affecting hydrological processes, leading to higher fragmentation and more complex runoff paths. These findings provide valuable insights into the influence of varying roof types on urban hydrology, supporting informed urban planning and infrastructure design decisions for improved drainage system efficiency and flood control measures.

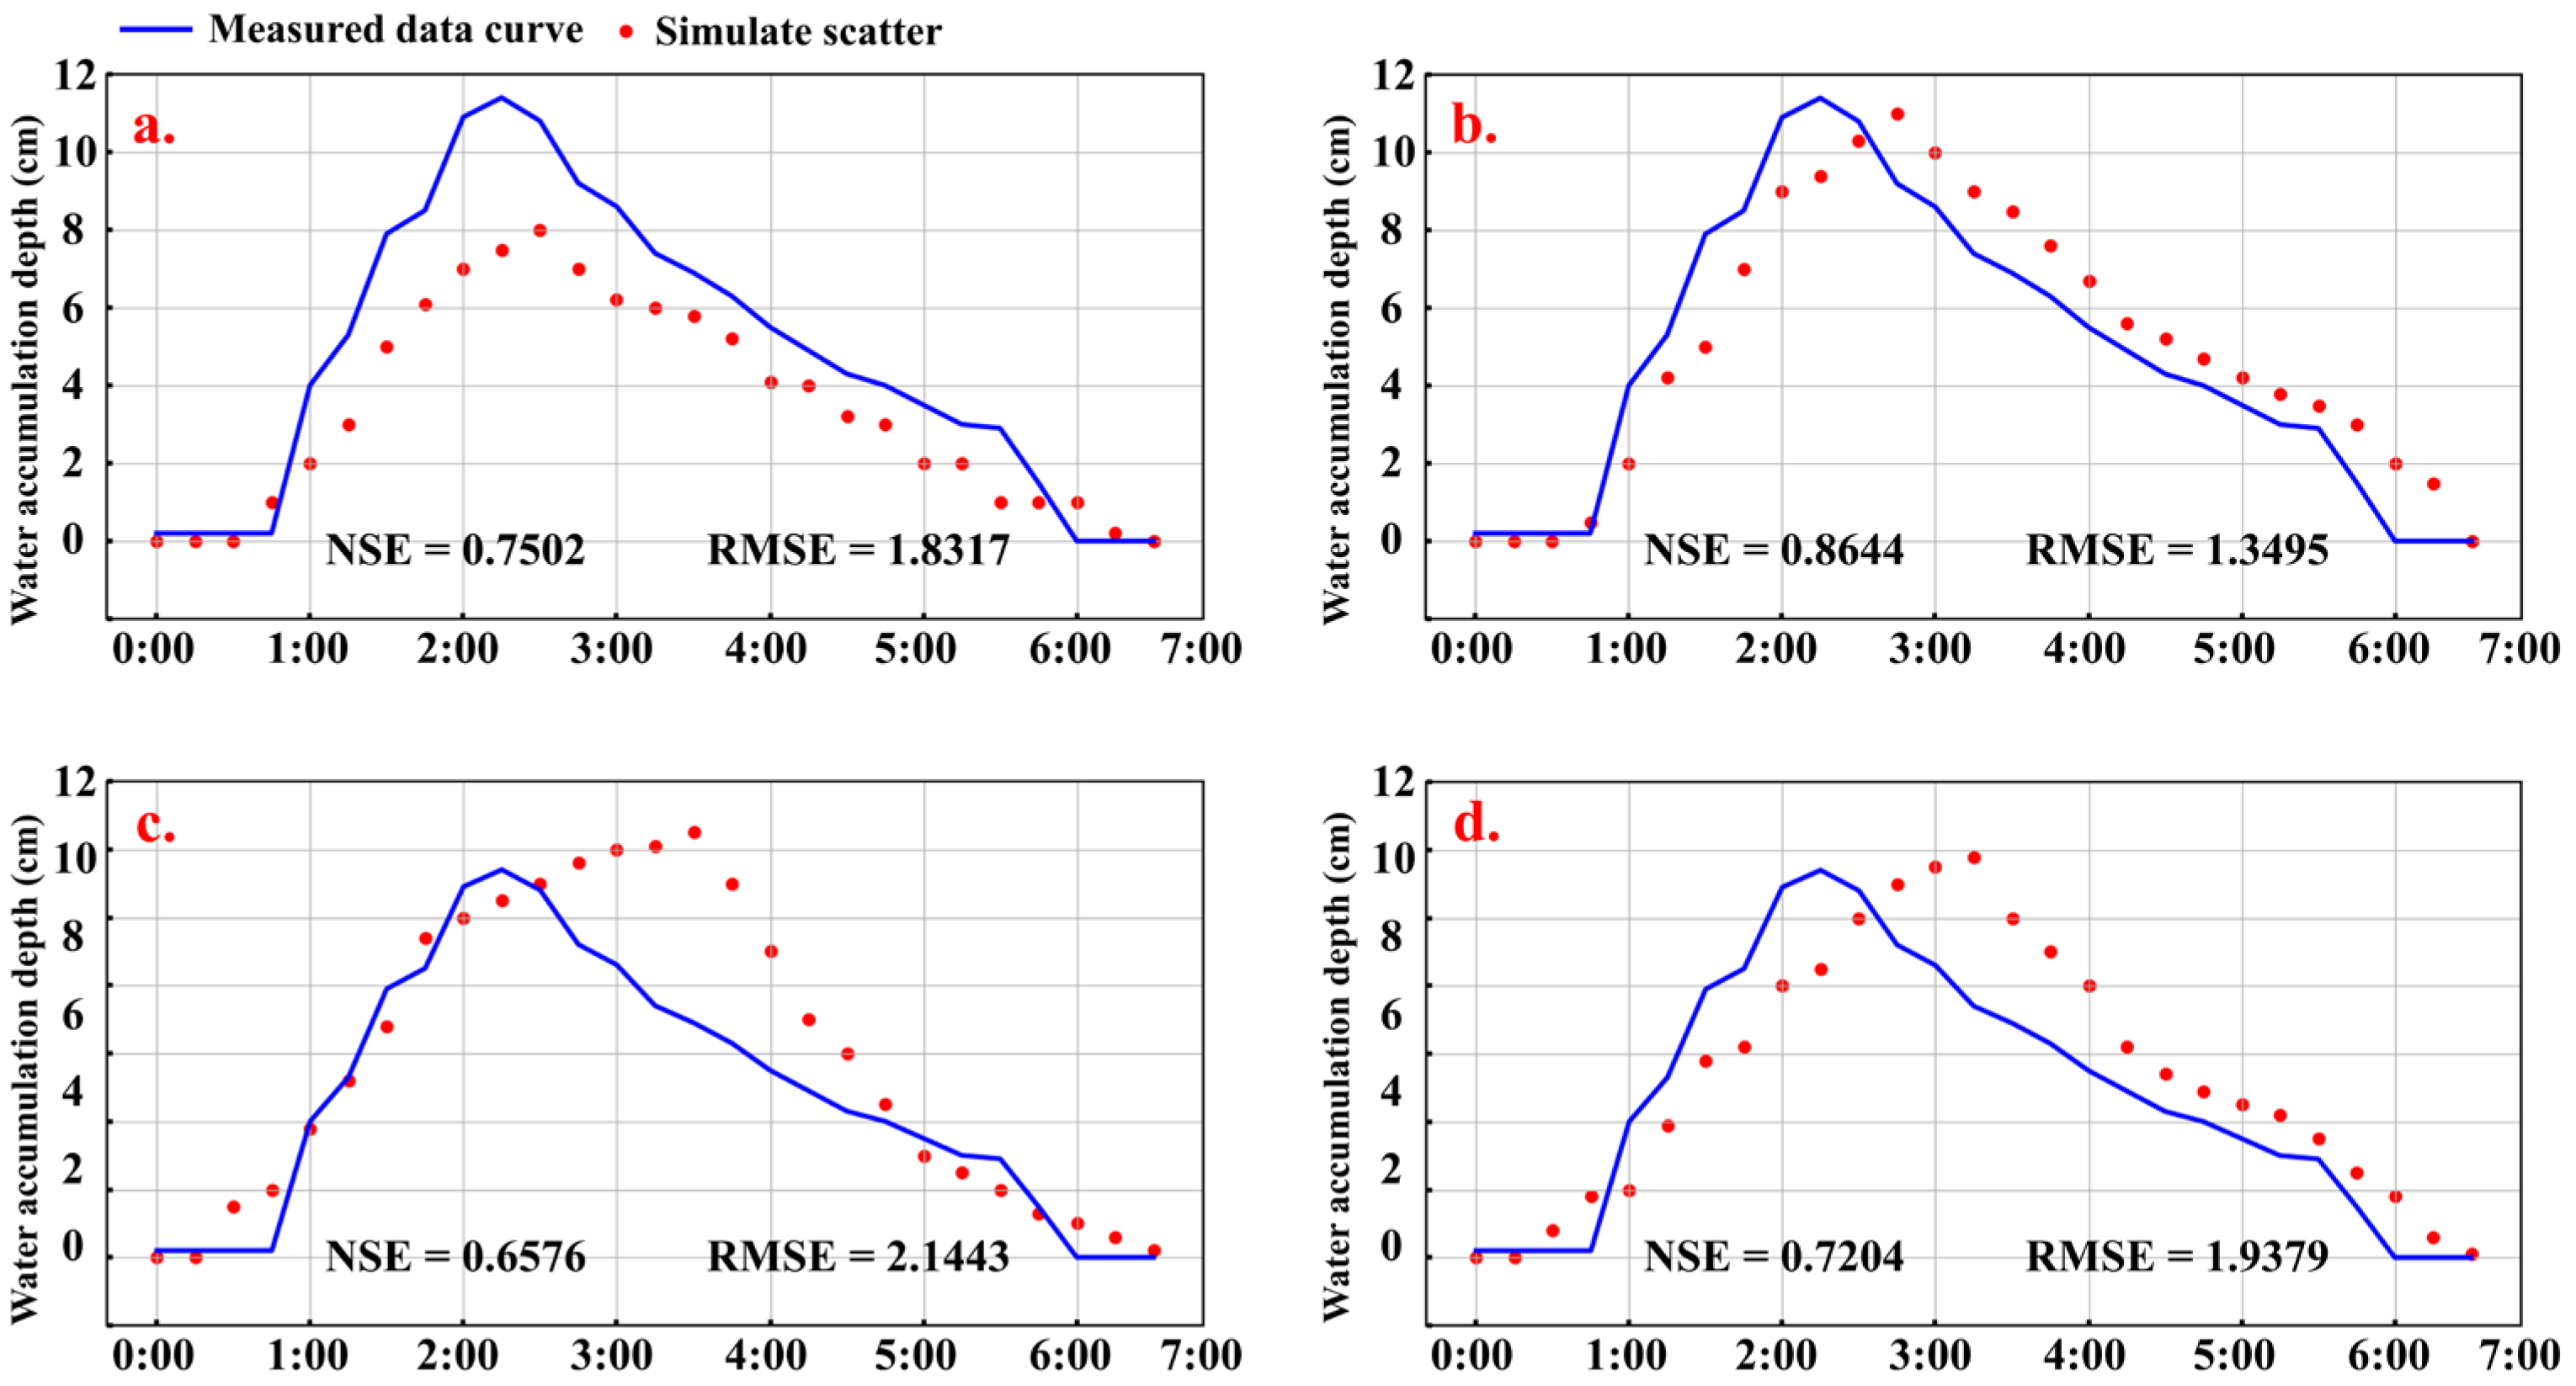
3.2. Evaluation of Simulation Accuracy

The simulation results were compared with real accumulated water curves obtained from sensor data to evaluate the accuracy of the four scenarios (TS, RS, FS, and PS) (Figure 7).
Overall, the TS showed a gradual increase in accumulated water depth, closely following the initial stages but slightly underestimating the peak values. The RS accurately captured both the rapid rise and fall phases of the accumulated water depth, reflecting the timing and magnitude of peak values more precisely than other scenarios. This scenario also demonstrated a faster response to rainfall events, aligning well with the actual hydrological processes influenced by roof types. The FS exhibited a rapid initial rate of water accumulation, leading to overestimated peak values that were reached after a delay. Lastly, the PS showed trends generally consistent with the actual values but slightly exceeded the peak value, with an earlier arrival time compared to the FS. However, it still lagged behind the actual situation. Upon evaluation using NSE and RMSE metrics, the RS achieved the highest accuracy, with an NSE of 0.86 and an RMSE of 1.3 cm, indicating the best performance among the four scenarios. The TS followed closely, with NSE and RMSE values of 0.75 and 1.83 cm, respectively, showing good overall agreement but slight underestimation at peak times. The FS performed the least accurately, recording the lowest NSE (0.65) and highest RMSE (2.14 cm), highlighting significant discrepancies in peak estimation and timing. The PS had intermediate accuracy, with values between those of TS and FS, achieving an NSE of 0.7204 and an RMSE of 1.9379.
This study compares the observed waterlogging locations, and their quantities derived from two rainfall events on 21 August 2024, and 27 August 2024, with the results simulated by the four scenarios in UFIM. The accuracy assessment results are presented in Table 1. As shown in the table, the RS values for both rainfall events are relatively high, reaching 84.6% and 83.3%, respectively, indicating good detection of actual flooded areas. In contrast, the TS values are the lowest, at 69.23% and 66.7%, respectively, suggesting a lower overall agreement between the simulated and observed flooding patterns.

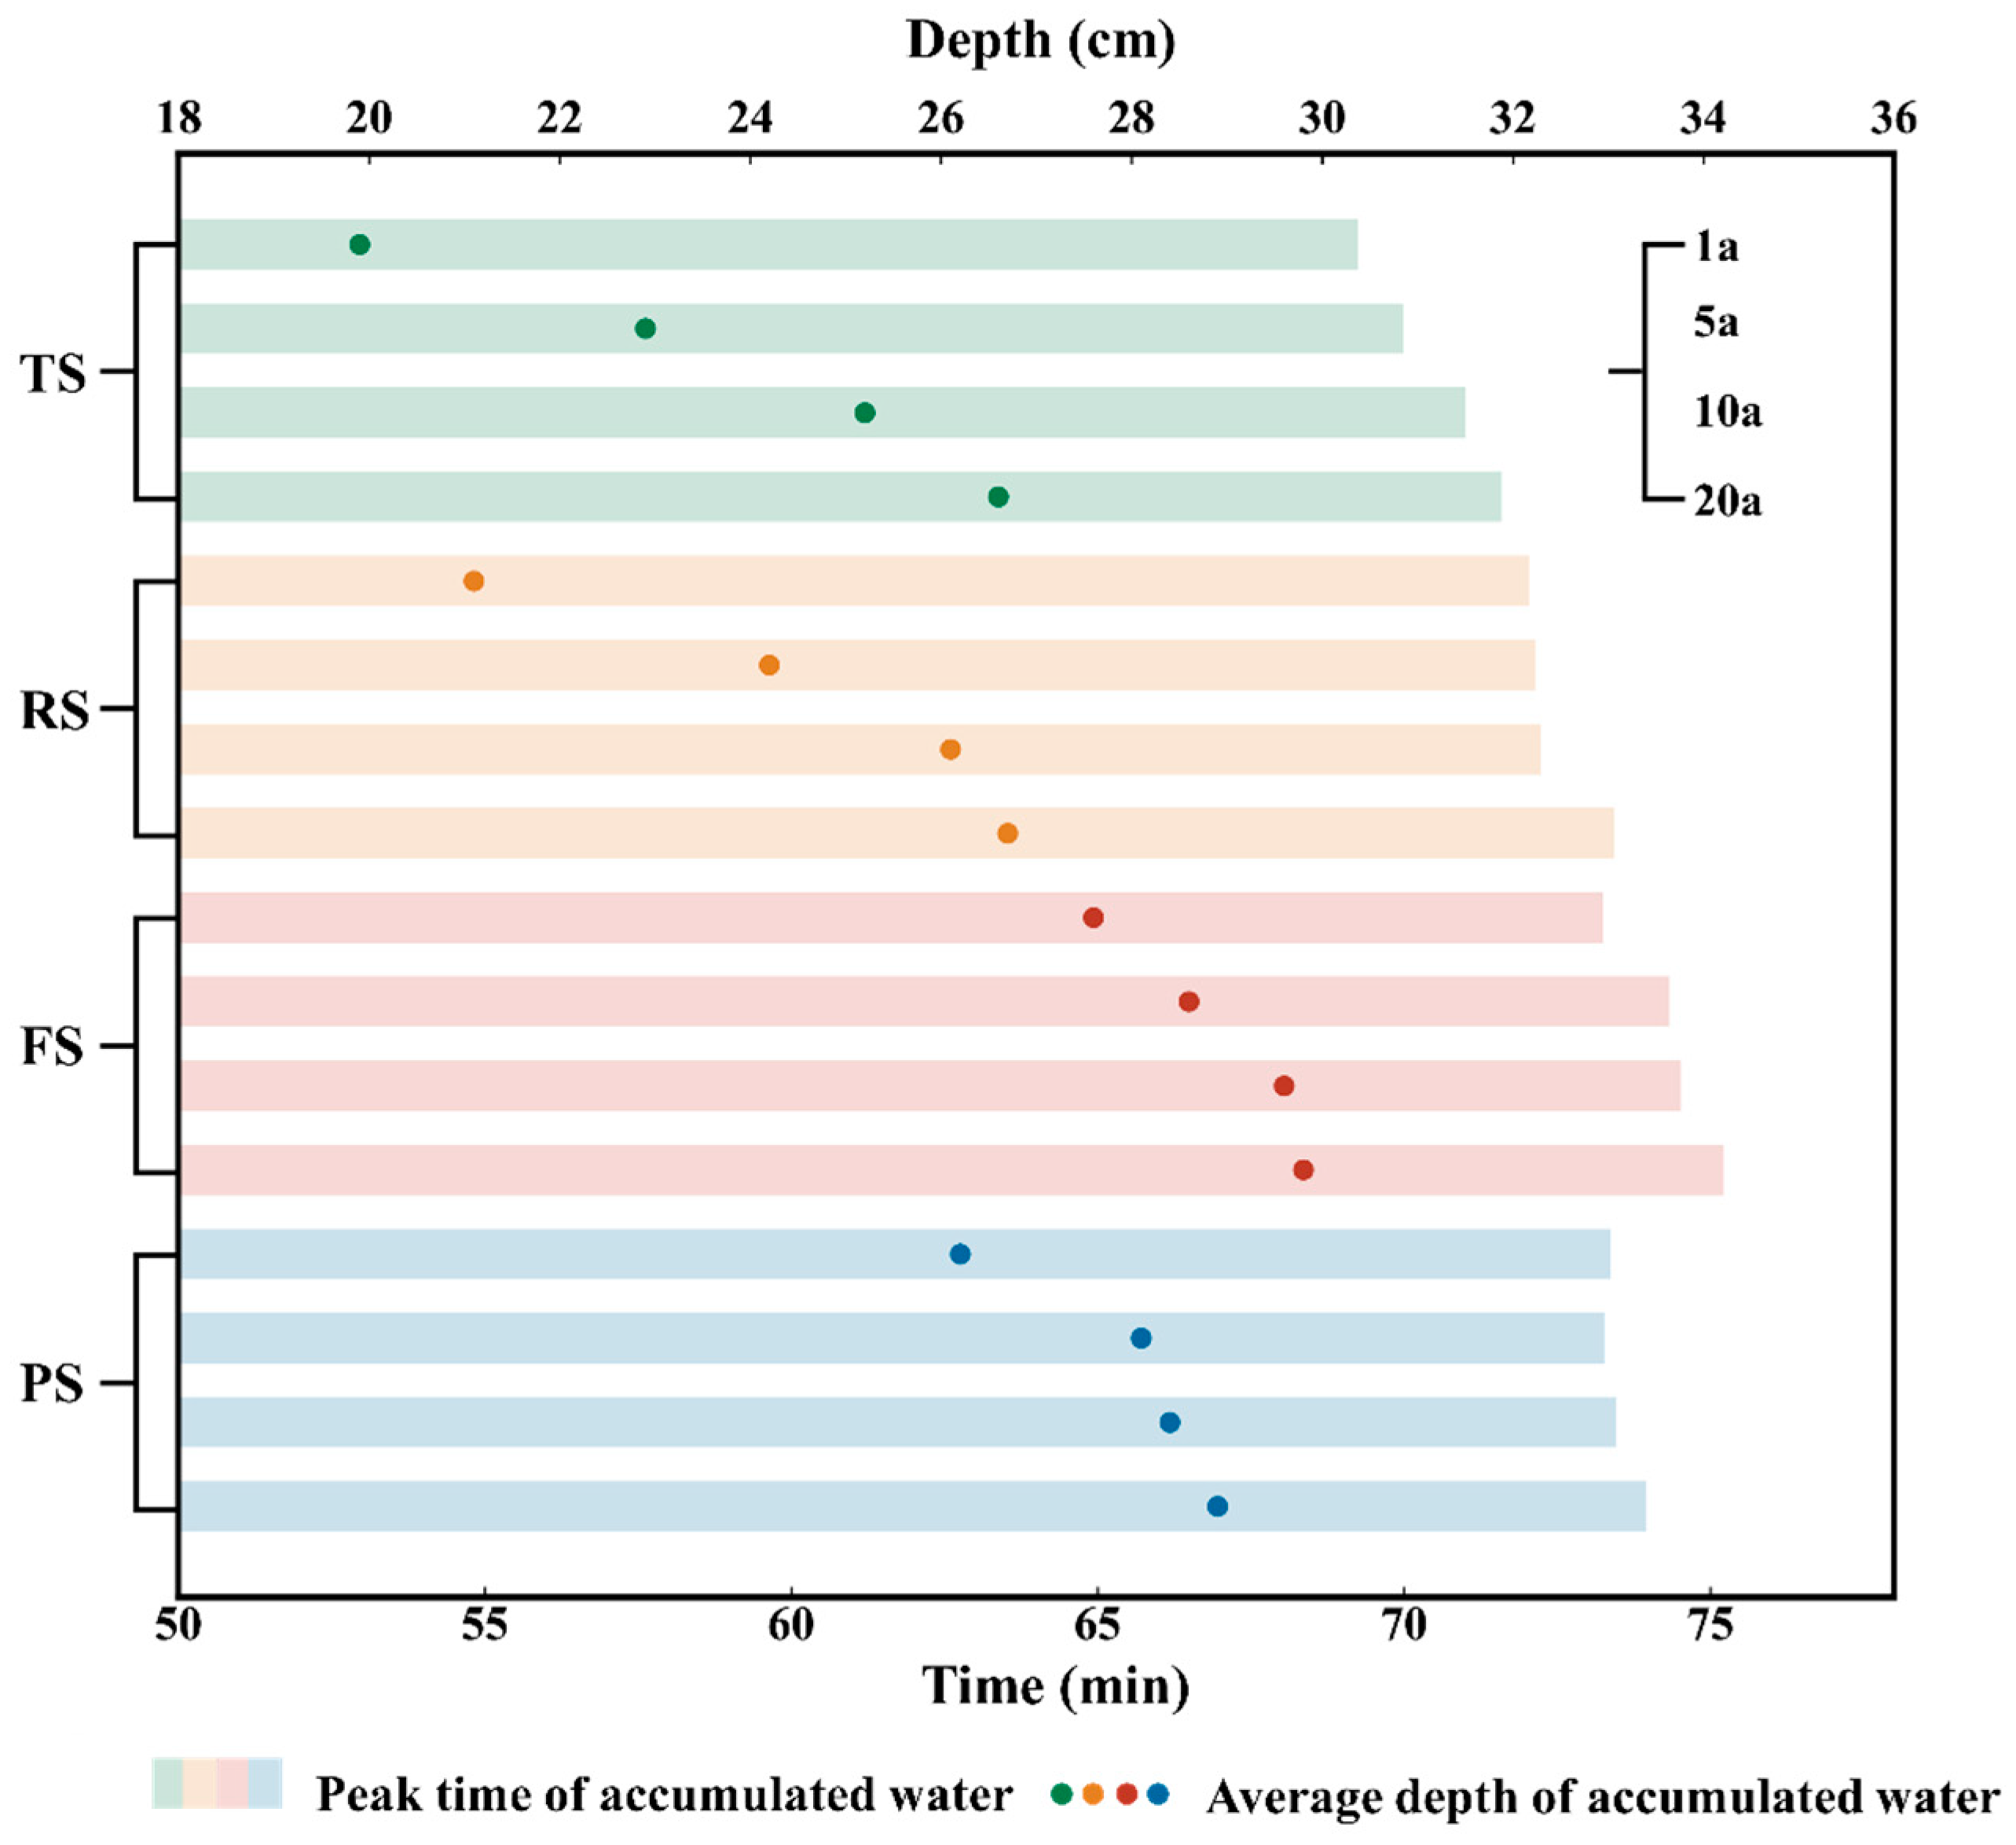
3.3. Peak and Duration of Water Accumulation

Figure 8 shows the peak time of the accumulated water and the average depth of accumulated water for four different scenarios (TS, RS, FS, and PS) with different return periods (1a, 5a, 10a, and 20a).
The TS had peak accumulated water arrival times between 1 min 13 s and 1 min 28 s, with the average depth of accumulated water ranging from 26.2 to 28.9 cm. The RS had peak accumulated water arrival times between 1 min 15 s and 1 min 31 s, with the maximum accumulated water depth averaging between 27.6 and 29.8 cm. The FS had peak accumulated water arrival times between 1 min 2 s and 1 min 26 s, with the average depth of accumulated water ranging from 21.1 to 26.7 cm. The peak accumulated water in the PS occurred between 9 min 59 s and 11 min 36 s, and the average depth of accumulated water ranged from 19.9 to 26.6 cm. The RS had the highest average depth of the maximum accumulated water at 29.8 cm, and the PS had the longest time to reach the peak accumulated water at 11 min and 36 s.
Figure 9 shows the areas of different accumulated water depth classes in each scenario (TS, RS, FS, and PS) for different return periods (1a, 5a, 10a, and 20a). Accumulated water areas for the TS and RS were closer under different return period conditions. Under the 1a return period, the areas with 0–1 and 1–3 cm accumulated water depths were 11.11/11.51 and 12.51/12.77 hm2, respectively. By the 5a return period, the areas of accumulated water in these two depth classes increased to 13.03/13.49 and 13.83/13.75 hm2, respectively. The data for the 10a return period further showed that the 0–1 and 1–3 cm accumulated water depths amounted to 15.13/15.61 and 14.94/14.74 hm2, respectively. Under the 20a return period, the accumulated water area reached 19.13/19.54 and 15.73/15.80 hm2 for the above two depth classes, respectively. In the FS, a significant increase in the area of accumulated water was observed for all depth classes. During the 1a return period, the area with 0–1 cm accumulated water depth amounted to 16.84 hm2, and 2.46 hm2 of the area had accumulated water depths greater than 10 cm. By the 20a return period, the area with 0–1 cm accumulated water depth had even expanded to 24.93 hm2, and the area with more than 10 cm accumulated water depth had increased to 4.68 hm2. In general, the area of accumulated water in the PS was located between the TS and FS for all return period conditions.

4. Discussion

4.1. Impact of Roofs on Catchment Area Delineation

The study was conducted by designing four catchment area scenarios (TS, RS, FS, and PS) under different conditions. The TS resulted in the lowest number of catchment areas because the types of building roofs were not considered. The RS considered actual roof conditions; thus, the number of catchment areas was increased to 580. This increase is mainly due to the significant difference in drainage characteristics between flat- and pitched-roof buildings, resulting in a more detailed delineation of catchment areas for pitched roofs. The FS assumed that all buildings are flat-roofed, primarily because flat-roofed buildings typically have larger areas of accumulated water, resulting in fewer catchment areas. The PS assumed that all buildings have pitched roofs, which resulted in the highest number of catchment areas. The higher number of catchment areas in the PS can be attributed to the fact that water on pitched roofs typically flows along the ridges and edges. Roof refinement can have a major impact on catchment area delineation in terms of the number and morphology of the catchment areas. Catchment areas constructed based on flat roofs tend to be larger in size and smaller in number, whereas those constructed based on pitched roofs are smaller in size and number and often have symmetrical structures.

4.2. Impact of Roof Catchment Area Delineation on Hydrological Processes in Urban Communities

The RS, which incorporated detailed delineation of roof types, demonstrated superior performance with NSE and RMSE values of 0.86 and 1.3 cm, respectively. This scenario’s ability to accurately reflect the drainage characteristics of both flat and pitched roofs highlights its potential for enhancing urban flood management strategies. By capturing the dynamics of actual hydrological processes, especially during peak hours, the RS provided a robust framework for understanding the impact of varied roof configurations on urban water accumulation. Conversely, the TS, characterized by a coarse modeling approach that did not account for roof type, underestimated the drainage rate, as evidenced by lower NSE (0.65) and higher RMSE (2.14 cm). This discrepancy underscores the importance of incorporating specific building features into hydrological models to improve predictive accuracy and mitigate potential underestimations of flood risks. The FS, assuming all buildings have flat roofs, resulted in rapid initial water accumulation due to slower drainage characteristics. This assumption led to an overestimation of peak water levels with hysteresis, highlighting the need for careful consideration of roof design in areas prone to rapid water accumulation. Such insights can inform urban planners about the potential risks associated with homogeneous flat roof structures and the benefits of diversified designs. Flat roofs tend to accumulate more water and require slower drainage because of the large areas of accumulated water and less defined drainage paths, increasing the risk of urban flooding during peak rainfall periods. The PS, assuming all buildings have sloped roofs, exhibited efficient early-stage drainage but experienced slight delays at peak times. Although this scenario performed well initially, the observed lag suggests that while fast drainage pathways are beneficial, they may not fully address peak rainfall events without additional infrastructure support. Sloped roofs facilitate quicker water discharge and reduce the area of accumulated water in the early stages of rainfall; however, they may experience short-lived rises in water levels during peak hours due to fast drainage.
In general, these findings underscore the significant effect of different roof types on urban hydrological processes. Flat roofs, characterized by larger accumulated water areas and less defined drainage paths, pose a greater risk of urban flooding during heavy rainfall. In contrast, sloped roofs facilitate quicker water discharge but might experience short-lived increases in water levels during peak hours. Therefore, integrating mixed roof types within urban planning can enhance overall drainage efficiency and resilience against flooding.

4.3. Shortcomings and Future Prospects

Despite the results of this study, there are still some shortcomings. First, the number of data sources is fewer and requires a higher degree of precision, which makes it difficult to obtain such data sources. Second, this study is mainly based on roof structures and does not consider other types of roofs (e.g., green roofs). The drainage system was constructed in a more idealized manner. Future research should focus on multisource data fusion to improve the diversity of data sources. Other types of roofs, such as green and metal ones, should also be considered to refine the input parameters of the model. Finally, the drainage system structure will be further refined to improve the accuracy of the model.

5. Conclusions

In this study, four catchment area scenarios (TS, RS, FS, and PS) were developed and simulated using the UFIM to explore the impact of different roof types on urban hydrological processes. In addition, they were modeled and analyzed using GIS software based on actual hydrological conditions. The main conclusions are the following:
1. The roof type significantly affects the delineation of catchment areas. The RS, which considered actual roof types, enabled a more detailed and accurate estimation of the number and shape of catchment areas. The catchment area of a flat-roof configuration usually has a larger area of accumulated water and slower drainage, whereas the catchment area of a pitched roof has a smaller area of accumulated water and a well-defined drainage path.
2. The RS, which considered actual roof types, had the closest simulated values to the actual values. In contrast, the FS, which assumed that all buildings have flat roofs, overestimated the amount of accumulated water, making it the least accurate of the four scenarios. This suggests that in practical applications, modeling should be based on real roof conditions to obtain more accurate hydrological simulation results.
3. To mitigate the impact of roof drainage on urban hydrology, rational planning should strategically prioritize sloped roof designs in areas prone to water accumulation to accelerate drainage. In regions where runoff needs to be controlled, flat roofs combined with green roofs should be used to increase rainwater retention capacity. Additionally, incorporate green roofs to absorb rainwater and reduce runoff, and install rainwater harvesting systems for non-potable uses. Consider hybrid roof designs that combine slight slopes with flat areas to enhance drainage efficiency. Implement smart drainage systems that adjust based on real-time weather data to optimize flow rates and prevent overloading during peak rainfall events. These integrated strategies can create a resilient urban environment, enhance flood resilience and protect public safety, thereby improving urban hydrological management and flood prevention.
This study addresses the current data sources and the problems associated with delineating roof catchment areas. In future work, the fusion of data from multiple sources and other types of roofs should be included to conduct a more comprehensive study.

Author Contributions

Conceptualization, C.C.; methodology, C.C.; software, Y.L.; validation, C.C.; formal analysis, C.C.; investigation, Y.S.; resources, P.Z., Y.W. and Y.Z.; data curation, Y.W. and Y.Z.; writing—original draft preparation, C.C.; writing—review and editing, H.H. and T.H.; visualization, Y.S.; supervision, T.H.; project administration, T.H.; funding acquisition, T.H. All authors have read and agreed to the published version of the manuscript.

Funding

This work was supported by the “Pioneer” and “Leading Goose” R&D Program of Zhejiang (2025C02230) and the National Natural Science Foundation of China (42471102).

Data Availability Statement

Data will be made available on request.

Acknowledgments

The authors appreciate the editors and anonymous reviewers for their valuable comments and suggestions.

Conflicts of Interest

The authors declare no conflicts of interest.

References

  1. Oudin, L.; Salavati, B.; Furusho-Percot, C.; Ribstein, P.; Saadi, M. Hydrological impacts of urbanization at the catchment scale. J. Hydrol. 2018, 559, 774–786. [Google Scholar] [CrossRef]
  2. Wang, H.; Huang, L.; Hu, J.; Yang, H.; Guo, W. Effect of urbanization on the river network structure in Zhengzhou City, China. Int. J. Environ. Res. Public Health 2022, 19, 2464. [Google Scholar] [CrossRef] [PubMed]
  3. Lhomme, J.; Bouvier, C.; Perrin, J.-L. Applying a GIS-based geomorphological routing model in urban catchments. J. Hydrol. 2004, 299, 203–216. [Google Scholar] [CrossRef]
  4. Gao, Y.; Zhao, J.; Yu, K. Effects of block morphology on the surface thermal environment and the corresponding planning strategy using the geographically weighted regression model. Build. Environ. 2022, 216, 109037. [Google Scholar] [CrossRef]
  5. Misra, A.K. Impact of urbanization on the hydrology of Ganga Basin (India). Water Resour. Manag. 2011, 25, 705–719. [Google Scholar] [CrossRef]
  6. Warner, K.; Zommers, Z.; Wreford, A.; Hurlbert, M.; Viner, D.; Scantlan, J.; Halsey, K.; Halsey, K.; Tamang, C. Characteristics of transformational adaptation in climate-land-society interactions. Sustainability 2019, 11, 356. [Google Scholar] [CrossRef]
  7. Zhou, Q.; Leng, G.; Su, J.; Ren, Y. Comparison of urbanization and climate change impacts on urban flood volumes: Importance of urban planning and drainage adaptation. Sci. Total Environ. 2019, 658, 24–33. [Google Scholar] [CrossRef]
  8. Cea, L.; Costabile, P. Flood risk in urban areas: Modelling, management and adaptation to climate change. A review. Hydrology 2022, 9, 50. [Google Scholar] [CrossRef]
  9. Hassan, B.T.; Yassine, M.; Amin, D. Comparison of urbanization, climate change, and drainage design impacts on urban flashfloods in an arid region: Case study, New Cairo, Egypt. Water 2022, 14, 2430. [Google Scholar] [CrossRef]
  10. Xia, H.; Liu, Z.; Efremochkina, M.; Liu, X.; Lin, C. Study on city digital twin technologies for sustainable smart city design: A review and bibliometric analysis of geographic information system and building information modeling integration. Sustain. Cities Soc. 2022, 84, 104009. [Google Scholar] [CrossRef]
  11. Fatichi, S.; Vivoni, E.R.; Ogden, F.L.; Ivanov, V.Y.; Mirus, B.; Gochis, D.; Downer, C.W.; Camporese, M.; Davison, J.H.; Ebel, B. An overview of current applications, challenges, and future trends in distributed process-based models in hydrology. J. Hydrol. 2016, 537, 45–60. [Google Scholar] [CrossRef]
  12. Rossman, L.A.; Dickinson, R.E.; Schade, T.; Chan, C.C.; Burgess, E.; Sullivan, D.; Lai, F.-H. SWMM 5-the next generation of EPA’s storm water management model. J. Water Manag. Model. 2004, 16, 339–358. [Google Scholar] [CrossRef]
  13. Yang, J.; Wei, J.; Yuan, M.; Lu, Y.; Chen, F.-F. Constitution analysis of pollution sources in urban rivers of Hangzhou. In Energy, Environment and Green Building Materials; CRC Press: Boca Raton, FL, USA, 2015; pp. 129–133. [Google Scholar]
  14. Arjenaki, M.O.; Sanayei, H.R.Z.; Heidarzadeh, H.; Mahabadi, N.A. Modeling and investigating the effect of the LID methods on collection network of urban runoff using the SWMM model (case study: Shahrekord City). Model. Earth Syst. Environ. 2021, 7, 1–16. [Google Scholar] [CrossRef]
  15. Salvadore, E.; Bronders, J.; Batelaan, O. Hydrological modelling of urbanized catchments: A review and future directions. J. Hydrol. 2015, 529, 62–81. [Google Scholar] [CrossRef]
  16. Vojinovic, Z.; Tutulic, D. On the use of 1D and coupled 1D-2D modelling approaches for assessment of flood damage in urban areas. Urban Water J. 2009, 6, 183–199. [Google Scholar] [CrossRef]
  17. Mignot, E.; Dewals, B. Hydraulic modelling of inland urban flooding: Recent advances. J. Hydrol. 2022, 609, 127763. [Google Scholar] [CrossRef]
  18. Redfern, T.W.; Macdonald, N.; Kjeldsen, T.R.; Miller, J.D.; Reynard, N. Current understanding of hydrological processes on common urban surfaces. Prog. Phys. Geogr. 2016, 40, 699–713. [Google Scholar] [CrossRef]
  19. Yang, J.; Wang, Z.-H.; Chen, F.; Miao, S.; Tewari, M.; Voogt, J.A.; Myint, S. Enhancing hydrologic modelling in the coupled weather research and forecasting–urban modelling system. Bound.-Layer Meteorol. 2015, 155, 87–109. [Google Scholar] [CrossRef]
  20. Guzmán-Sánchez, S.; Jato-Espino, D.; Lombillo, I.; Diaz-Sarachaga, J.M. Assessment of the contributions of different flat roof types to achieving sustainable development. Build. Environ. 2018, 141, 182–192. [Google Scholar] [CrossRef]
  21. Li, C.; Liu, M.; Hu, Y.; Han, R.; Shi, T.; Qu, X.; Wu, Y. Evaluating the hydrologic performance of low impact development scenarios in a micro urban catchment. Int. J. Environ. Res. Public Health 2018, 15, 273. [Google Scholar] [CrossRef]
  22. Davies, H.A. The Water Balance of Urban Impermeable Surfaces: Catchment and Process Studies. Ph.D. Thesis, University of London, London, UK, 1981. [Google Scholar]
  23. Wright, G.; Jack, L.B.; Swaffield, J. Investigation and numerical modelling of roof drainage systems under extreme events. Build. Environ. 2006, 41, 126–135. [Google Scholar] [CrossRef]
  24. Chukwu, C.O. Modelling and Design of Flat Timber Roof and High Pitch Timber Roof, a Comparative Analysis; Final Year Project & Postgraduate Portal; NAU Department of Civil Engineering: Awka, Nigeria, 2023; Volume 2, pp. 1–84. [Google Scholar]
  25. Liu, W.; Engel, B.A.; Feng, Q. Modelling the hydrological responses of green roofs under different substrate designs and rainfall characteristics using a simple water balance model. J. Hydrol. 2021, 602, 126786. [Google Scholar] [CrossRef]
  26. Ercolani, G.; Chiaradia, E.A.; Gandolfi, C.; Castelli, F.; Masseroni, D. Evaluating performances of green roofs for stormwater runoff mitigation in a high flood risk urban catchment. J. Hydrol. 2018, 566, 830–845. [Google Scholar] [CrossRef]
  27. Piyumi, M.; Abenayake, C.; Jayasinghe, A.; Wijegunarathna, E. Urban flood modeling application: Assess the effectiveness of building regulation in coping with urban flooding under precipitation uncertainty. Sustain. Cities Soc. 2021, 75, 103294. [Google Scholar] [CrossRef]
  28. Versini, P.-A.; Ramier, D.; Berthier, E.; De Gouvello, B. Assessment of the hydrological impacts of green roof: From building scale to basin scale. J. Hydrol. 2015, 524, 562–575. [Google Scholar] [CrossRef]
  29. Bianchini, F.; Hewage, K. How “green” are the green roofs? Lifecycle analysis of green roof materials. Build. Environ. 2012, 48, 57–65. [Google Scholar] [CrossRef]
  30. Cascone, S.; Catania, F.; Gagliano, A.; Sciuto, G. A comprehensive study on green roof performance for retrofitting existing buildings. Build. Environ. 2018, 136, 227–239. [Google Scholar] [CrossRef]
  31. Susca, T. Green roofs to reduce building energy use? A review on key structural factors of green roofs and their effects on urban climate. Build. Environ. 2019, 162, 106273. [Google Scholar] [CrossRef]
  32. Li, Y.; Wang, H.; Liu, C.; Sun, J.; Ran, Q.J.S. Optimizing the valuation and implementation path of the gross ecosystem product: A case study of Tonglu County, Hangzhou City. Sustainability 2024, 16, 1408. [Google Scholar] [CrossRef]
  33. Bodoque, J.M.; Aroca-Jiménez, E.; Eguibar, M.Á.; García, J.A. Developing reliable urban flood hazard mapping from LiDAR data. J. Hydrol. 2023, 617, 128975. [Google Scholar] [CrossRef]
  34. Sarıtaş, B.; Kaplan, G. Enhancing ground point extraction in airborne LiDAR point cloud data using the CSF filter algorithm. Adv. LiDAR 2023, 3, 53–61. [Google Scholar]
  35. Xu, W.; Zeng, Y.; Yin, C. 3D city reconstruction: A novel method for semantic segmentation and building monomer construction using oblique photography. Appl. Sci. 2023, 13, 8795. [Google Scholar] [CrossRef]
  36. Gu, L.; Zhang, H.; Wu, X. Surveying and mapping of large-scale 3D digital topographic map based on oblique photography technology. J. Radiat. Res. Appl. Sci. 2024, 17, 100772. [Google Scholar] [CrossRef]
  37. Jakob, M.; Weatherly, H.; Bale, S.; Perkins, A.; MacDonald, B. A multi-faceted debris-flood hazard assessment for Cougar Creek, Alberta, Canada. Hydrology 2017, 4, 7. [Google Scholar] [CrossRef]
  38. Zhang, X.; Qiao, W.; Huang, J.; Li, H.; Wang, X. Impact and analysis of urban water system connectivity project on regional water environment based on Storm Water Management Model (SWMM). J. Clean. Prod. 2023, 423, 138840. [Google Scholar] [CrossRef]
  39. DB33/T 1191–2020; Standard of Rainfall Intensity Computation. Zhejiang Provincial Department of Housing and Urban-Rural Development: Hangzhou, China, 2020.
  40. UFIM Model. Available online: https://www.antmap.net/web/ufim/ (accessed on 20 May 2025).
  41. Bañas, K.; Robles, M.E.; Maniquiz-Redillas, M. Stormwater harvesting from roof catchments: A review of design, efficiency, and sustainability. Water 2023, 15, 1774. [Google Scholar] [CrossRef]
  42. Dai, H.; Hu, X.; Shu, Z.; Qin, N.; Zhang, J. Deep ground filtering of large-scale ALS point clouds via iterative sequential ground prediction. Remote Sens. 2023, 15, 961. [Google Scholar] [CrossRef]
  43. Trhan, O.; Marčiš, M. Building models created from UAV photogrammetry data. Int. Multidiscip. Sci. GeoConference SGEM 2016, 2, 823–830. [Google Scholar]
  44. Hu, A.; Wu, L.; Chen, S.; Xu, Y.; Wang, H.; Xie, Z. Boundary shape-preserving model for building mapping from high-resolution remote sensing images. IEEE Trans. Geosci. Remote Sens. 2023, 61, 1–17. [Google Scholar] [CrossRef]
  45. Zhou, Y.; Batelaan, O.; Guan, H.; Liu, T.; Duan, L.; Wang, Y.; Li, X. Assessing long-term trends in vegetation cover change in the Xilin River Basin: Potential for monitoring grassland degradation and restoration. J. Environ. Manag. 2024, 349, 119579. [Google Scholar] [CrossRef]
  46. Wienhold, K.J.; Li, D.; Li, W.; Fang, Z.N. Flood inundation and depth mapping using unmanned aerial vehicles combined with high-resolution multispectral imagery. Hydrology 2023, 10, 158. [Google Scholar] [CrossRef]
  47. Zhao, L.; Men, Y.; Zhu, Y.; Wang, H.; Men, C. A cascade domain clustering algorithm for multi-view DSM fusion from urban satellite images. IEEE Trans. Geosci. Remote Sens. 2024, 62, 4505321. [Google Scholar]
  48. Kalu, I.; Ndehedehe, C.E.; Okwuashi, O.; Eyoh, A.E.; Ferreira, V.G. Reconstructing terrestrial water storage anomalies using convolution-based support vector machine. J. Hydrol. Reg. Stud. 2023, 46, 101326. [Google Scholar] [CrossRef]
  49. Lv, J.; Hou, J.; Wang, T.; Li, D.; Liu, Y.; Xue, S.; Chen, G.; Guan, B. Impact of modeling methods on urban flood processes at community scale. Urban Clim. 2024, 58, 102209. [Google Scholar] [CrossRef]
  50. Liu, C.; Li, W.; Zhao, C.; Xie, T.; Jian, S.; Wu, Q.; Xu, Y.; Hu, C. BK-SWMM flood simulation framework is being proposed for urban storm flood modeling based on uncertainty parameter crowdsourcing data from a single functional region. J. Environ. Manag. 2023, 344, 118482. [Google Scholar] [CrossRef] [PubMed]
  51. Sharp, T.R. Decision Guide for Roof Slope Selection; Oak Ridge National Lab. (ORNL): Oak Ridge, TN, USA, 1988.
  52. Li, X.; Li, Y.; Zheng, S.; Chen, G.; Zhao, P.; Wang, C. High efficiency integrated urban flood inundation simulation based on the urban hydrologic unit. J. Hydrol. 2024, 630, 130724. [Google Scholar] [CrossRef]
  53. Yu, J.; Wang, J.; Zang, D.; Xie, X. A Feature Line Extraction Method for Building Roof Point Clouds Considering the Grid Center of Gravity Distribution. Remote Sens. 2024, 16, 2969. [Google Scholar] [CrossRef]
  54. Xu, Z.; Ma, C.; Gao, X.; Ma, Y.; Zhou, J. A calibration method for SWMM to mitigate the impact of the structure defect without considering runoff on building walls. Front. Ecol. Evol. 2023, 11, 1212501. [Google Scholar] [CrossRef]
  55. Zamani, M.G.; Saniei, K.; Nematollahi, B.; Zahmatkesh, Z.; Poor, M.M.; Nikoo, M.R. Developing sustainable strategies by LID optimization in response to annual climate change impacts. J. Clean. Prod. 2023, 416, 137931. [Google Scholar] [CrossRef]
  56. Tanim, A.H.; Smith-Lewis, C.; Downey, A.R.; Imran, J.; Goharian, E. Bayes_Opt-SWMM: A Gaussian process-based Bayesian optimization tool for real-time flood modeling with SWMM. Environ. Model. Softw. 2024, 179, 106122. [Google Scholar] [CrossRef]
  57. Li, H.; Wei, Y.; Ishidaira, H.; Commey, N.A.; Yang, D. Integrated urban and riverine flood risk management in the Fujiang River Basin-Mianyang city. J. Hydrol. 2024, 645, 132150. [Google Scholar] [CrossRef]
Figure 1. Geographic location and extent of the study area.
Hydrology 12 00154 g001
Figure 2. Overview of research data ((a) DEM; (b) Land use; (c) Pipe network distribution; (d) Range of models for oblique photography; (e) DSM).
Hydrology 12 00154 g002
Figure 3. Precipitation data ((a) measured precipitation on 21 August 2024; (b) measured precipitation on 27 August 2024; (c) designed precipitation).
Hydrology 12 00154 g003
Figure 4. Building roofing process ((a) Separation of surface results; (b) Building elevation extraction; (c) Building roof extraction results).
Hydrology 12 00154 g004
Figure 5. Overview of roof drainage structures ((a) Drainage structures for pitched roofs; (b) Drainage structures for flat roofs; (c) Construction drainage overview).
Hydrology 12 00154 g005
Figure 6. Delineation of catchment areas ((a) TS; (b) RS; (c) FS; (d) PS).
Hydrology 12 00154 g006
Figure 7. Evaluation of the accuracy of each scenario ((a) TS; (b) RS; (c) FS; (d) PS).
Hydrology 12 00154 g007
Figure 8. Time of arrival of peak accumulated water and average depth of peak accumulated water.
Hydrology 12 00154 g008
Figure 9. Areas of accumulated water depth classes under different scenarios and return periods.
Hydrology 12 00154 g009
Table 1. Accuracy performance of various scenarios under different precipitation events.
TSRSFSPS
21 August 202469.23%84.6%69.23%76.9%
27 August 202466.7%83.3%75%66.7%
Disclaimer/Publisher’s Note: The statements, opinions and data contained in all publications are solely those of the individual author(s) and contributor(s) and not of MDPI and/or the editor(s). MDPI and/or the editor(s) disclaim responsibility for any injury to people or property resulting from any ideas, methods, instructions or products referred to in the content.

