You are currently viewing a new version of our website. To view the old version click .
Hydrology
  • Article
  • Open Access

15 November 2025

Integrated Multi-Scale Hydrogeophysical Characterisation of a Coastal Phreatic Dune Aquifer: The Belvedere–San Marco Case Study (NE Italy)

,
and
Department of Mathematics, Informatics and Geosciences, University of Trieste, 34128 Trieste, Italy
*
Author to whom correspondence should be addressed.
Hydrology2025, 12(11), 304;https://doi.org/10.3390/hydrology12110304 
(registering DOI)
This article belongs to the Special Issue Characterization and Monitoring of Coastal Hydrological Environment for Assessing the Impact of Seawater Intrusion on Coastal Aquifers

Abstract

Low-lying coastal plains are increasingly threatened by saltwater intrusion, yet the extent of the phenomenon and the role of coastal dune systems remain unevenly assessed. In the northern Adriatic Sea (NE Italy), salinisation has been documented, but systematic, spatially resolved studies are lacking. This work investigates the Belvedere–San Marco relict dune system to assess its hydrogeological function and vulnerability to seawater intrusion. An integrated methodology combining borehole and core stratigraphy, in situ water electrical conductivity (EC) measurements, and multi-method geophysical surveys (FDEM, ERT, GPR, active seismics) was tested. Results reveal a consistent stratigraphy of permeable aeolian sands overlying clay-rich units, with groundwater EC values in the dune sector always remaining well below thresholds for brackish or saline conditions. Geophysical imaging reveals that the dunes are low-conductive bodies contrasting sharply with the conductive surrounding lowlands, thus indicating the persistence of a freshwater lens sustained by local recharge within the dunes. The Belvedere–San Marco dunes therefore act as both freshwater reservoirs and natural hydraulic barriers, buffering shallow aquifers against salinisation. This study demonstrated the applicability of integrated geophysical methods to extensively investigate shallow phreatic aquifers lying a few metres below the surface, and establishes a baseline for monitoring future changes under rising sea levels, subsidence, and increased groundwater exploitation.

1. Introduction

Low-lying coastal areas are, by nature, particularly susceptible to groundwater salinisation, a phenomenon of increasing global concern. This process, driven primarily by sea-level rise, land subsidence (both natural and anthropogenic), and overexploitation of freshwater resources [,], promotes the inland intrusion of seawater into coastal aquifers. The consequences are often severe, including degradation of freshwater supplies for drinking and agriculture, and the loss of integrity of coastal ecosystems, even over large areas [,].
In the Friuli Venezia Giulia (FVG, North Eastern Italy) coastal plain, where land subsidence has been documented at rates of up to 5 mm/year [], various sources indicate salinisation at several sites. Evidence includes surface-level indicators such as the presence of salt deposition in topographically depressed areas and halophytic vegetation found along irrigation channels, as well as high salinity levels at the few available phreatic piezometers [,]. In addition, in the FVG region, an area of more than 237 km2 is below the sea level, while an area of about 783 km2 was reclaimed in the last century []. Recent 3D characterization of the onshore–offshore aquifer system in the northern Adriatic Basin further highlights the complexity and vulnerability of coastal groundwater in this region []. While these scattered data strongly suggest that salt water intrusion could be a widespread problem, the lack of spatially continuous data and systematic, region-wide studies limits our ability to fully characterise the extent and dynamics of saltwater intrusion in this vulnerable setting, especially as far as the phreatic aquifer.
This study provides a first step toward addressing this knowledge gap by focusing on the distinctive hydrogeological characteristics of the paleo dunes of Belvedere–San Marco and its surroundings. This is a relict aeolian dunes system located along the margin of the Grado Lagoon and represents a distinct and unique geomorphological unit within the FVG plain []. Dunes hosting freshwater lenses have been documented on the Adriatic coast [,]. In fact, coastal dunes often host freshwater lenses, which can act as a crucial natural barrier against seawater intrusion, even in regions with high salinisation risk [,].
This study aims to establish a baseline for monitoring seawater intrusion (SWI) dynamics in this previously unstudied dune system and can provide some methodological guidelines for coastal studies focused on very shallow (a few metres) phreatic aquifer potentially affected by salt water intrusions.
Through a multidisciplinary approach which includes hydrogeophysical surveys (Electrical Resistivity Tomography—ERT, Frequency Domain Electro-Magnetic—FDEM, Ground Penetrating Radar—GPR, Refraction Seismic—RS), analysis of log stratigraphies, and in situ water EC measurements, this work provides the first quantitative mapping of subsurface geophysical patterns of the paleo dunes system of Belvedere–San Marco and its surroundings. The interpretative framework follows integrated hydrogeochemical concepts [] and aligns with recent coastal geophysical applications [,]. The primary finding is the low overall electrical conductivity within the dune system, which strongly suggests current freshwater dominance. This condition is likely sustained by local precipitation recharge and offers a valuable reference state against which future changes can be evaluated []. This is a critical need given the ongoing threats of rising sea levels, increased groundwater extraction, and climate variability.
A second objective is to explore the hydrogeological controls that govern saltwater movement in this specific setting. This study examines how dune stratigraphy, sediment composition, and the underlying geological framework influence the spatial distribution of electrical conductivity [,,]. Furthermore, by integrating geophysical data with geomorphological and sedimentological observations, this work aims to provide a broader understanding of the factors that either promote or inhibit salinisation in coastal dune environments. This dual focus, on both current hydrological conditions and control mechanisms, positions the outcome of this work as a benchmark for understanding and managing SWI risk in similar coastal settings.

2. Materials and Methods

2.1. Stratigraphic and Hydrochemical Data Collection

To constrain the subsurface geological and sedimentological framework, existing borehole logs have been integrated with newly acquired shallow cores and dedicated in-situ measurements.
Logs from deep wells archived in a stratigraphic database of the University of Trieste were analysed down to 35–40 m b.g.l., supplying a regional context.
To refine the shallow framework, manual cores were collected at selected sites using a hand-operated gouge auger down to the water table or, where not reached, to a maximum depth of 3 m. Cores were logged in the field (lithology, texture, colour, organic matter). In boreholes that intercepted the water table, in situ groundwater electrical conductivity (EC; mS m−1) and temperature (°C) were measured with a calibrated portable multiparameter probe (WTW Cond 3110, Geotech, Denver, CO, USA). Values were recorded after stabilisation. EC was used as a proxy for groundwater salinity and to calibrate the geophysical conductivity models.

2.2. Geophysical Methods

A multi-method geophysical approach was employed to characterise the subsurface hydrostratigraphy and detect potential salinity variations over a wide area, including the paleo coastal dune system and its surroundings.
Electrical Resistivity Tomography—ERT [] surveys were conducted to create 2D cross-sections of the subsurface. Data were acquired using a Syscal Pro resistivity meter (IRIS Instruments, Orléans, France) with standard multi-electrode cables having a maximum electrode spacing equal to 2 m. Transects were strategically placed perpendicular to the dune crests, beginning at the top of the dune, or on the dune flank and extending into the adjacent interdune depression. Depending on the required length, either a 48-electrode or a 72-electrode setup was used, with a roll-along technique employed for longer transects. A mixed Wenner–Schlumberger (WS) array configuration was employed, with a constant electrode spacing of 2 m, resulting in a maximum investigation depth of approximately 15–20 m.
The raw apparent resistivity data were checked and inverted using the RES2DINV software (v. 4.10.20). A standard least-squares (L2-norm) inversion algorithm was employed to generate smooth 2D models of true electrical resistivity (or conductivity). The resulting cross-sections are highly sensitive to variations in both lithology (e.g., sand vs. clay content), porewater saturation, and salinity.
To rapidly characterize near-surface electrical conductivity variations, we performed various surveys using two frequency-domain electromagnetic—FDEM [] instruments, namely CMD-Explorer (GF Instruments, Brno, Czech Republic) and GEM-2 (Geophex, Raleigh, NC, US). CMD-Explorer measurements were collected at fixed coil spacings of 1.48, 2.82, and 4.49 m (i.e., multi-coil), in both vertical and horizontal dipole modes, with a constant operating frequency of 10 kHz. GEM-2 data were acquired at 6 frequencies between 2525 and 42,100 Hz (i.e., multi-frequency) with a fixed 1.66 m coil spacing. Surveys were conducted along carefully selected profiles spanning the dune system, with measurements taken at regular time intervals (typically 0.2–0.5 s) to ensure representative spatial coverage. Data from both instruments were processed and inverted using EMagPy open-source software (v. 1.4.2), generating spatial conductivity 2D cross-sections. These outputs allow for the identification of areas with potential freshwater recharge (low conductivity) and zones dominated by finer sediments or elevated porewater salinity (high conductivity). In addition, we collected two dense grids of data allowing us to obtain multi-depth maps in two selected areas at the base of the highest preserved dunes.
Ground Penetrating Radar—GPR surveys [] were carried out to obtain high-resolution images of the shallow subsurface architecture and to delineate the water table. A Zond-12E GPR system (Radar Systems, Riga, Latvia) equipped with a 500 MHz shielded antenna pair was selected. Profiles were acquired along transects used for the other geophysical methods data collection to facilitate direct data integration and comparison. We set a constant trace space equal to 5 cm to assure high enough spatial sampling.
Radargrams have been processed with Prism2 software (v. 2.71.01) and some in-house developed algorithms providing a detailed visualisation of internal dune structures, such as cross-bedding and paleo soils, and a high-contrast reflector corresponding to the water table []. A standard processing flow was applied, including time-drift removal, DC correction, background correction, frequency filtering, exponential amplitude recovery (gain), topographic (static) correction, and optional hyperbolic summation migration. The EM velocity was estimated by diffraction hyperbola fitting.
Refraction P-waves seismic surveys [] were conducted along a line coinciding with a GPR profile for comparison and cross-validation purposes. We used a Geode (Geometrics, San Jose, CA, U.S.) seismometer connected with 24, 40 Hz vertical geophones spaced 4 m apart. Eight conjugate shots plus one at the midpoint were positioned to cover both the dune crest and adjacent flat areas, ensuring sufficient high spatial coverage and a continuous record of near-surface layering. We used a 5 kg sledgehammer striking over a 10 kg metal plate, setting a vertical staking equal to four. Seismic data has been processed with Seisimager software (Geometrics) using a tomographic approach to invert the automatically picked (and manually checked) travel times. The acquired data was intended to provide additional information on sedimentary layering and depth to the water table, particularly in zones with thicker sandy deposits where GPR signal attenuation may prevent a sufficient penetration depth.
For the survey positioning, we used different GPS devices allowing centimetric to metric accuracy as a function of the GPS system and of the satellite constellation available at the moment of acquisition. In any case, the position accuracy was always sufficient for the data processing (e.g., topographic corrections) and data comparison/integration.

2.3. Study Area

The study was conducted on the Belvedere–San Marco dune system, located south from Aquileia on the north-western margin of the Grado Lagoon, FVG (NE Italy; Figure 1), []. This coastal setting represents a transitional environment between the mainland and the northern Adriatic Sea, shaped by fluvial, marine, and aeolian processes during the late Quaternary. The area is part of a low-lying coastal plain with a shallow hydraulic gradient, where unconfined aquifers are hydraulically connected to inland freshwater inputs, lagoon waters, and the Adriatic Sea [].
Figure 1. (a) Digital Terrain Model (DTM) of the study area. The limit of the (paleo) dune geological unit (dashed orange line) is from the 1:150,000 geological map of the Friuli Venezia Giulia plain []. The (paleo) dune planar morphology (dashed black line) is after []. Blue rectangles indicate the two local survey areas. Elevations are in meters above sea level (m a.s.l.). (b) The red rectangle highlights the study area within the Friuli Venezia Giulia Region, Italy.
Aquileia has been a UNESCO World Heritage Site since 1998. It was one of the largest towns in the Roman Empire and developed around an important river harbour, which has almost disappeared today. Several other geomorphological transformations have occurred since then, with the Grado Lagoon forming around 1200 years ago [], and important fluvial changes during and after the Roman period []. This about 70 km2 wide lagoon is characterised by several islands and tidal marshes and it is connected to the west with the Marano Lagoon, forming a coastal, shallow-water system in the northern Adriatic that covers an area of over 160 km2 []. Several areas close to the lagoon border have been reclaimed within the last century and are now mainly used for agriculture.
The Belvedere–San Marco paleo dunes form the second largest preserved inland aeolian systems in Italy, reaching up to 10 m a.s.l. They consist mainly of fine- to medium-grained sand with interbedded silty horizons and paleo soils, reflecting alternating depositional and stabilisation phases. At present, two main dune areas are well preserved (San Marco and Belvedere), but the entire dune system is apparent on the DTM (Figure 1), despite several local anthropic levelling works.
Chronostratigraphic analyses indicate that the main dune-building phase occurred at the end of the Last Glacial Maximum (22.1–21.4 ka cal BP), with possible reactivation during the Late Glacial Phase []. Therefore, these partially preserved dunes represent both an archive of past environmental conditions and a potential freshwater recharge zone.
The dunes overlie a multi-layered aquifer system composed of Holocene and Pleistocene alluvial and coastal deposits [,]. Clay-rich interbeds locally act as aquitards, strongly influencing groundwater flow and salinity distribution []. Human activities have modified the morphology of the area through agriculture [], reclamation, urbanisation, and groundwater exploitation [], increasing vulnerability to subsidence and potential saltwater intrusion.
This site was selected due to its geological significance and the lack of previous hydrogeophysical investigations. Its elevated and permeable nature suggests that it plays a key role in sustaining meteoric recharge and maintaining freshwater reservoirs in an area characterised by mean annual precipitation of 1000–1100 mm []. This makes it an ideal case study area for saltwater intrusion processes under combined anthropogenic and climatic pressures.

3. Results

3.1. Site-Scale Analysis

Two preliminary site-scale surveys targeted the two best-preserved, highest dune ridges of the system (Figure 1, blue rectangles) to characterise the internal dune architecture and detect possible local shallow salinisation. In these sites, we integrated all the geophysical methods to assess their applicability and to obtain a cross validation of the results.
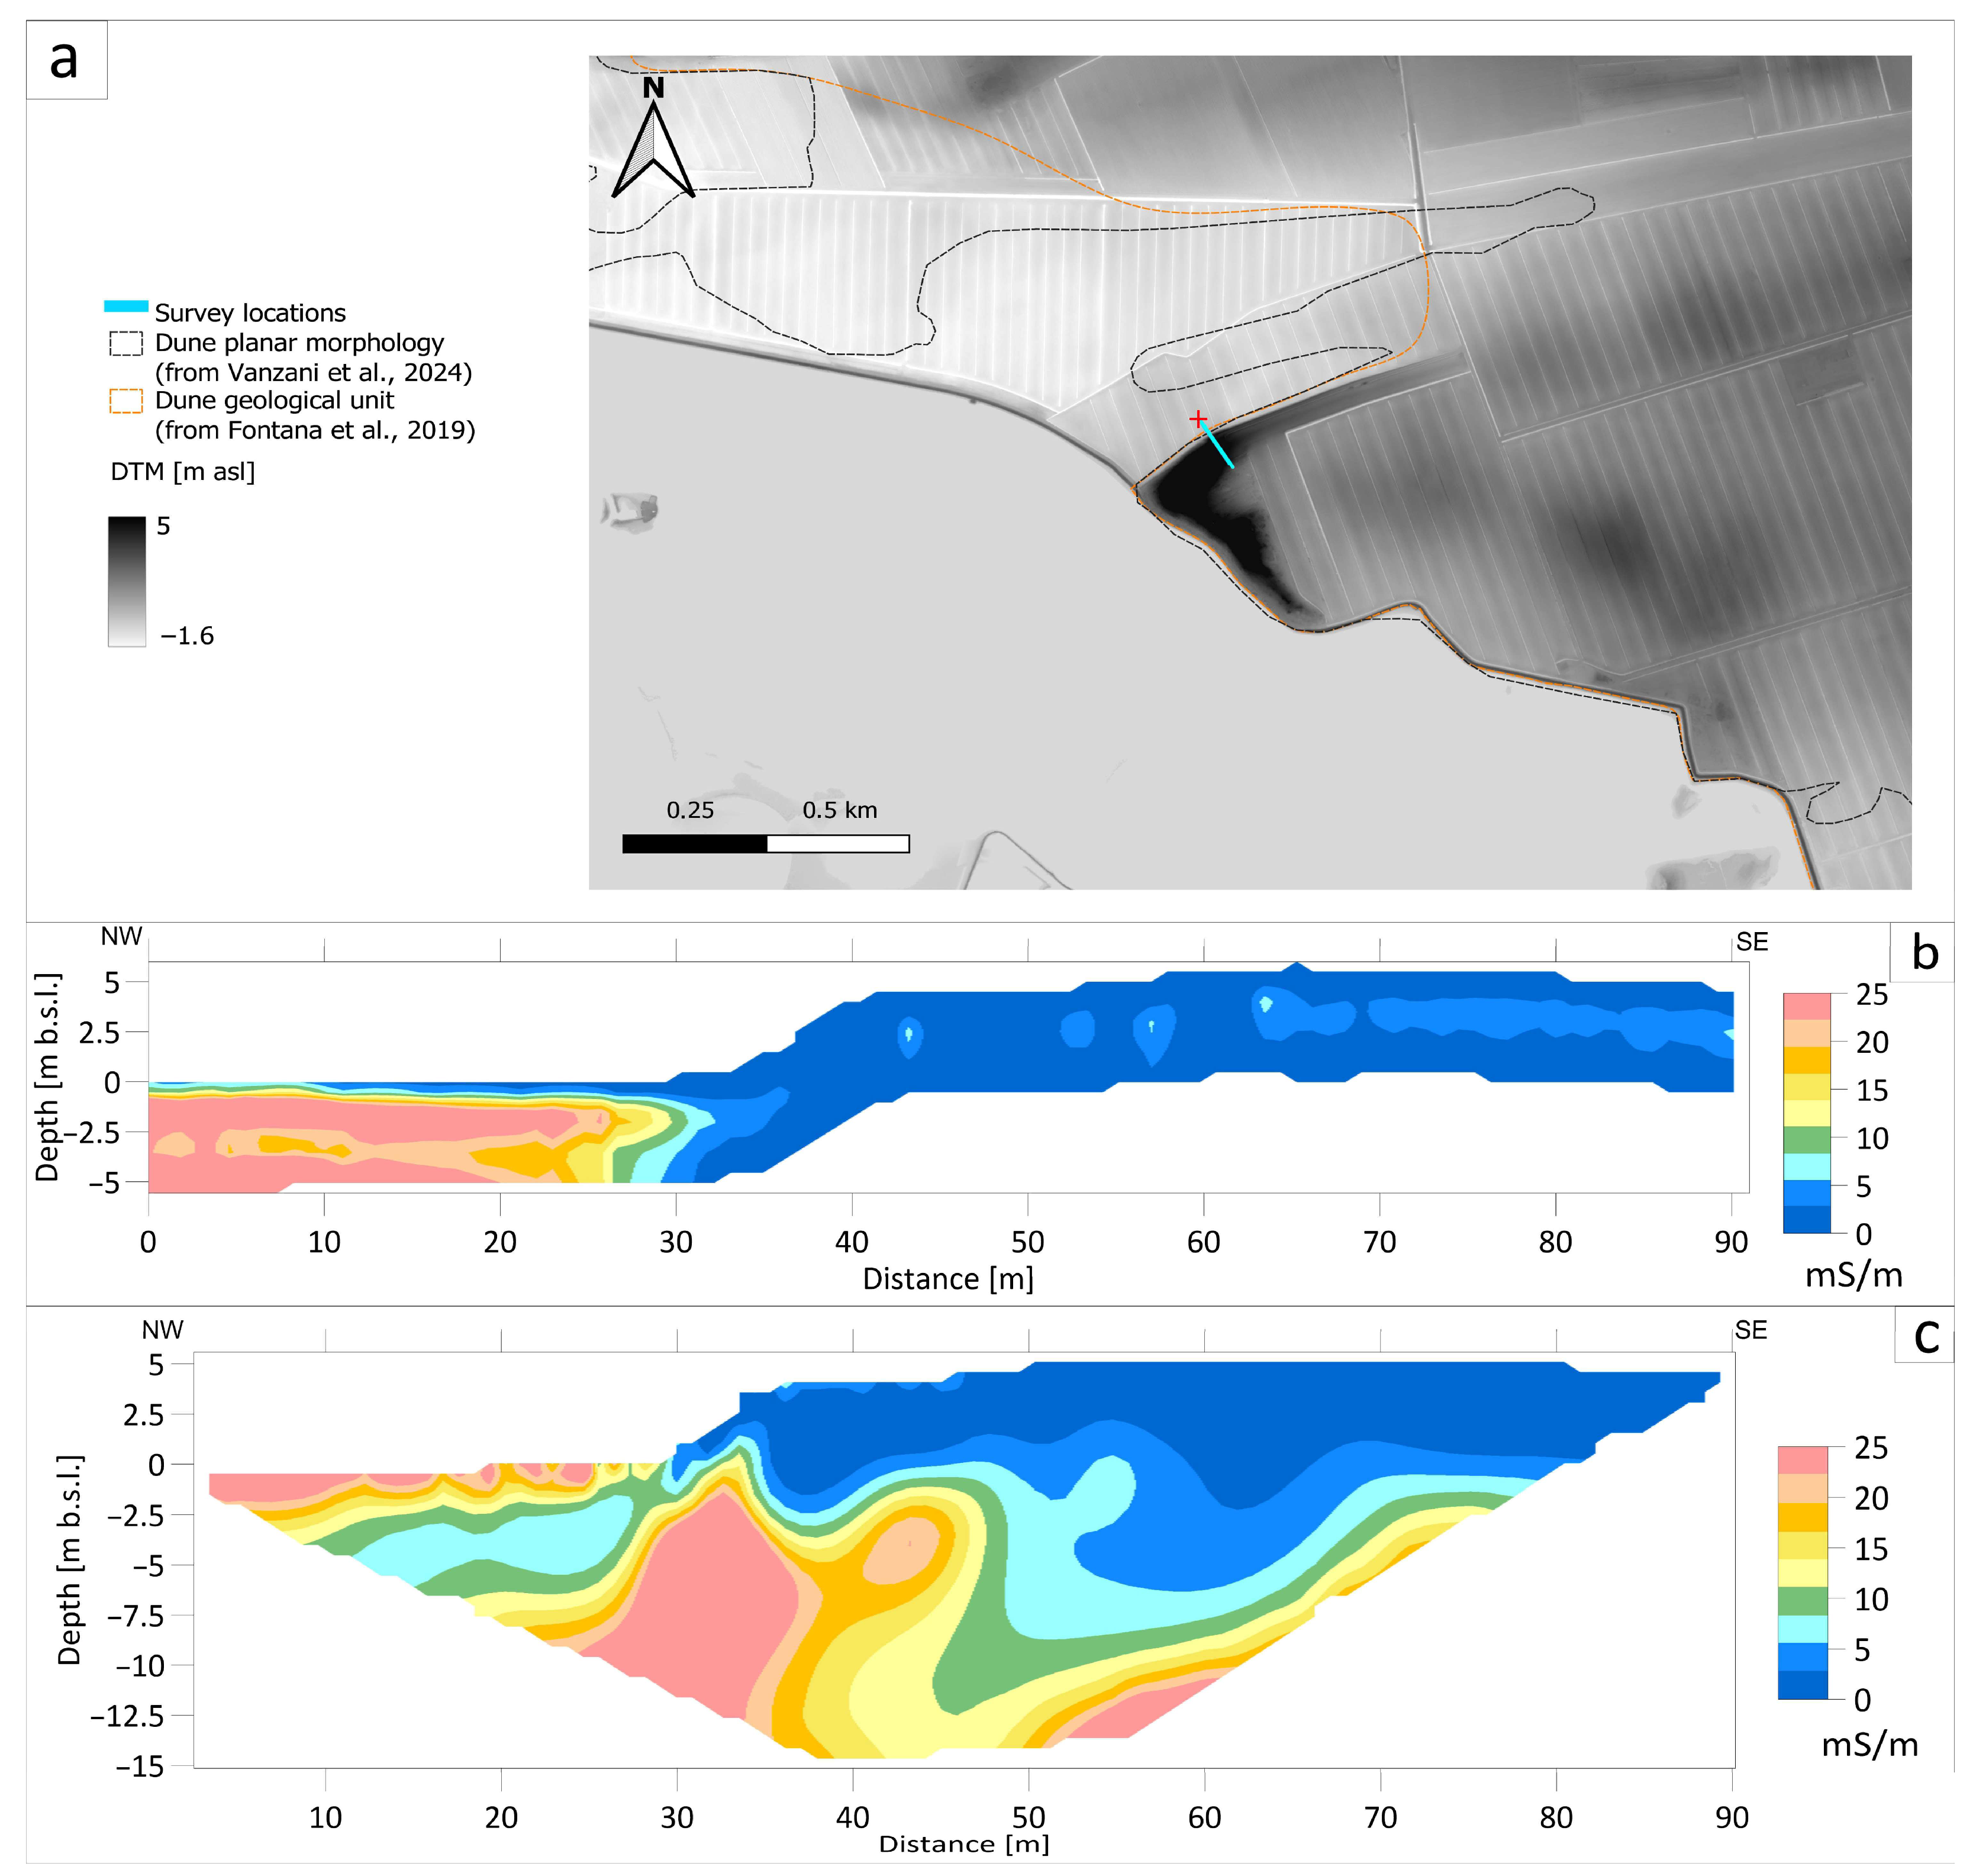
The San Marco site, located in the south-western sector of the dune complex, lies on the coastal margin and exhibits a pronounced relief, with dune crests reaching 9 m a.s.l. The geophysical survey consisted of one ERT and one FDEM profile oriented transverse to the main dune slope (Figure 2a); the elevation along the profile varies from about 0 to 5 m a.s.l. To ground-truth the geophysical datasets, a manual core was obtained at the dune toe (Figure 2a), where the water table was intercepted at 0.6 m b.g.l., and in situ groundwater EC measured 90 mS m−1, indicative of freshwater.
Figure 2. (a) Location of the San Marco survey site (cyan line) and the ground truthing point along the survey (red cross). (b) FDEM-derived bulk electrical conductivity along the transect (CMD-Explorer), (c) corresponding inverted ERT cross-section. Depth is shown relative to ground surface (m b.g.l.). The vertical scale of (b,c) is the same. Limits of the dunes in black and orange are respectively from [,].
The FDEM inversions show low bulk electrical conductivity within the dune body (mostly below 5 mS m−1), consistent with unsaturated sandy deposits, with values increasing toward the surrounding lowlands and with depth (Figure 2b). The ERT section agrees with this pattern, imaging a resistive dune core overlying more conductive units in adjacent depressions, and extending the interpretation to 12 m b.g.l. (Figure 2c). Peak bulk conductivities remain within ranges typical of non-saline conditions for clean sands. Together, these observations indicate that below the San Marco dune and in its surroundings, there is a shallow freshwater aquifer that gradually tapers laterally toward the lower plain; the point EC measurement corroborates the geophysical interpretation.
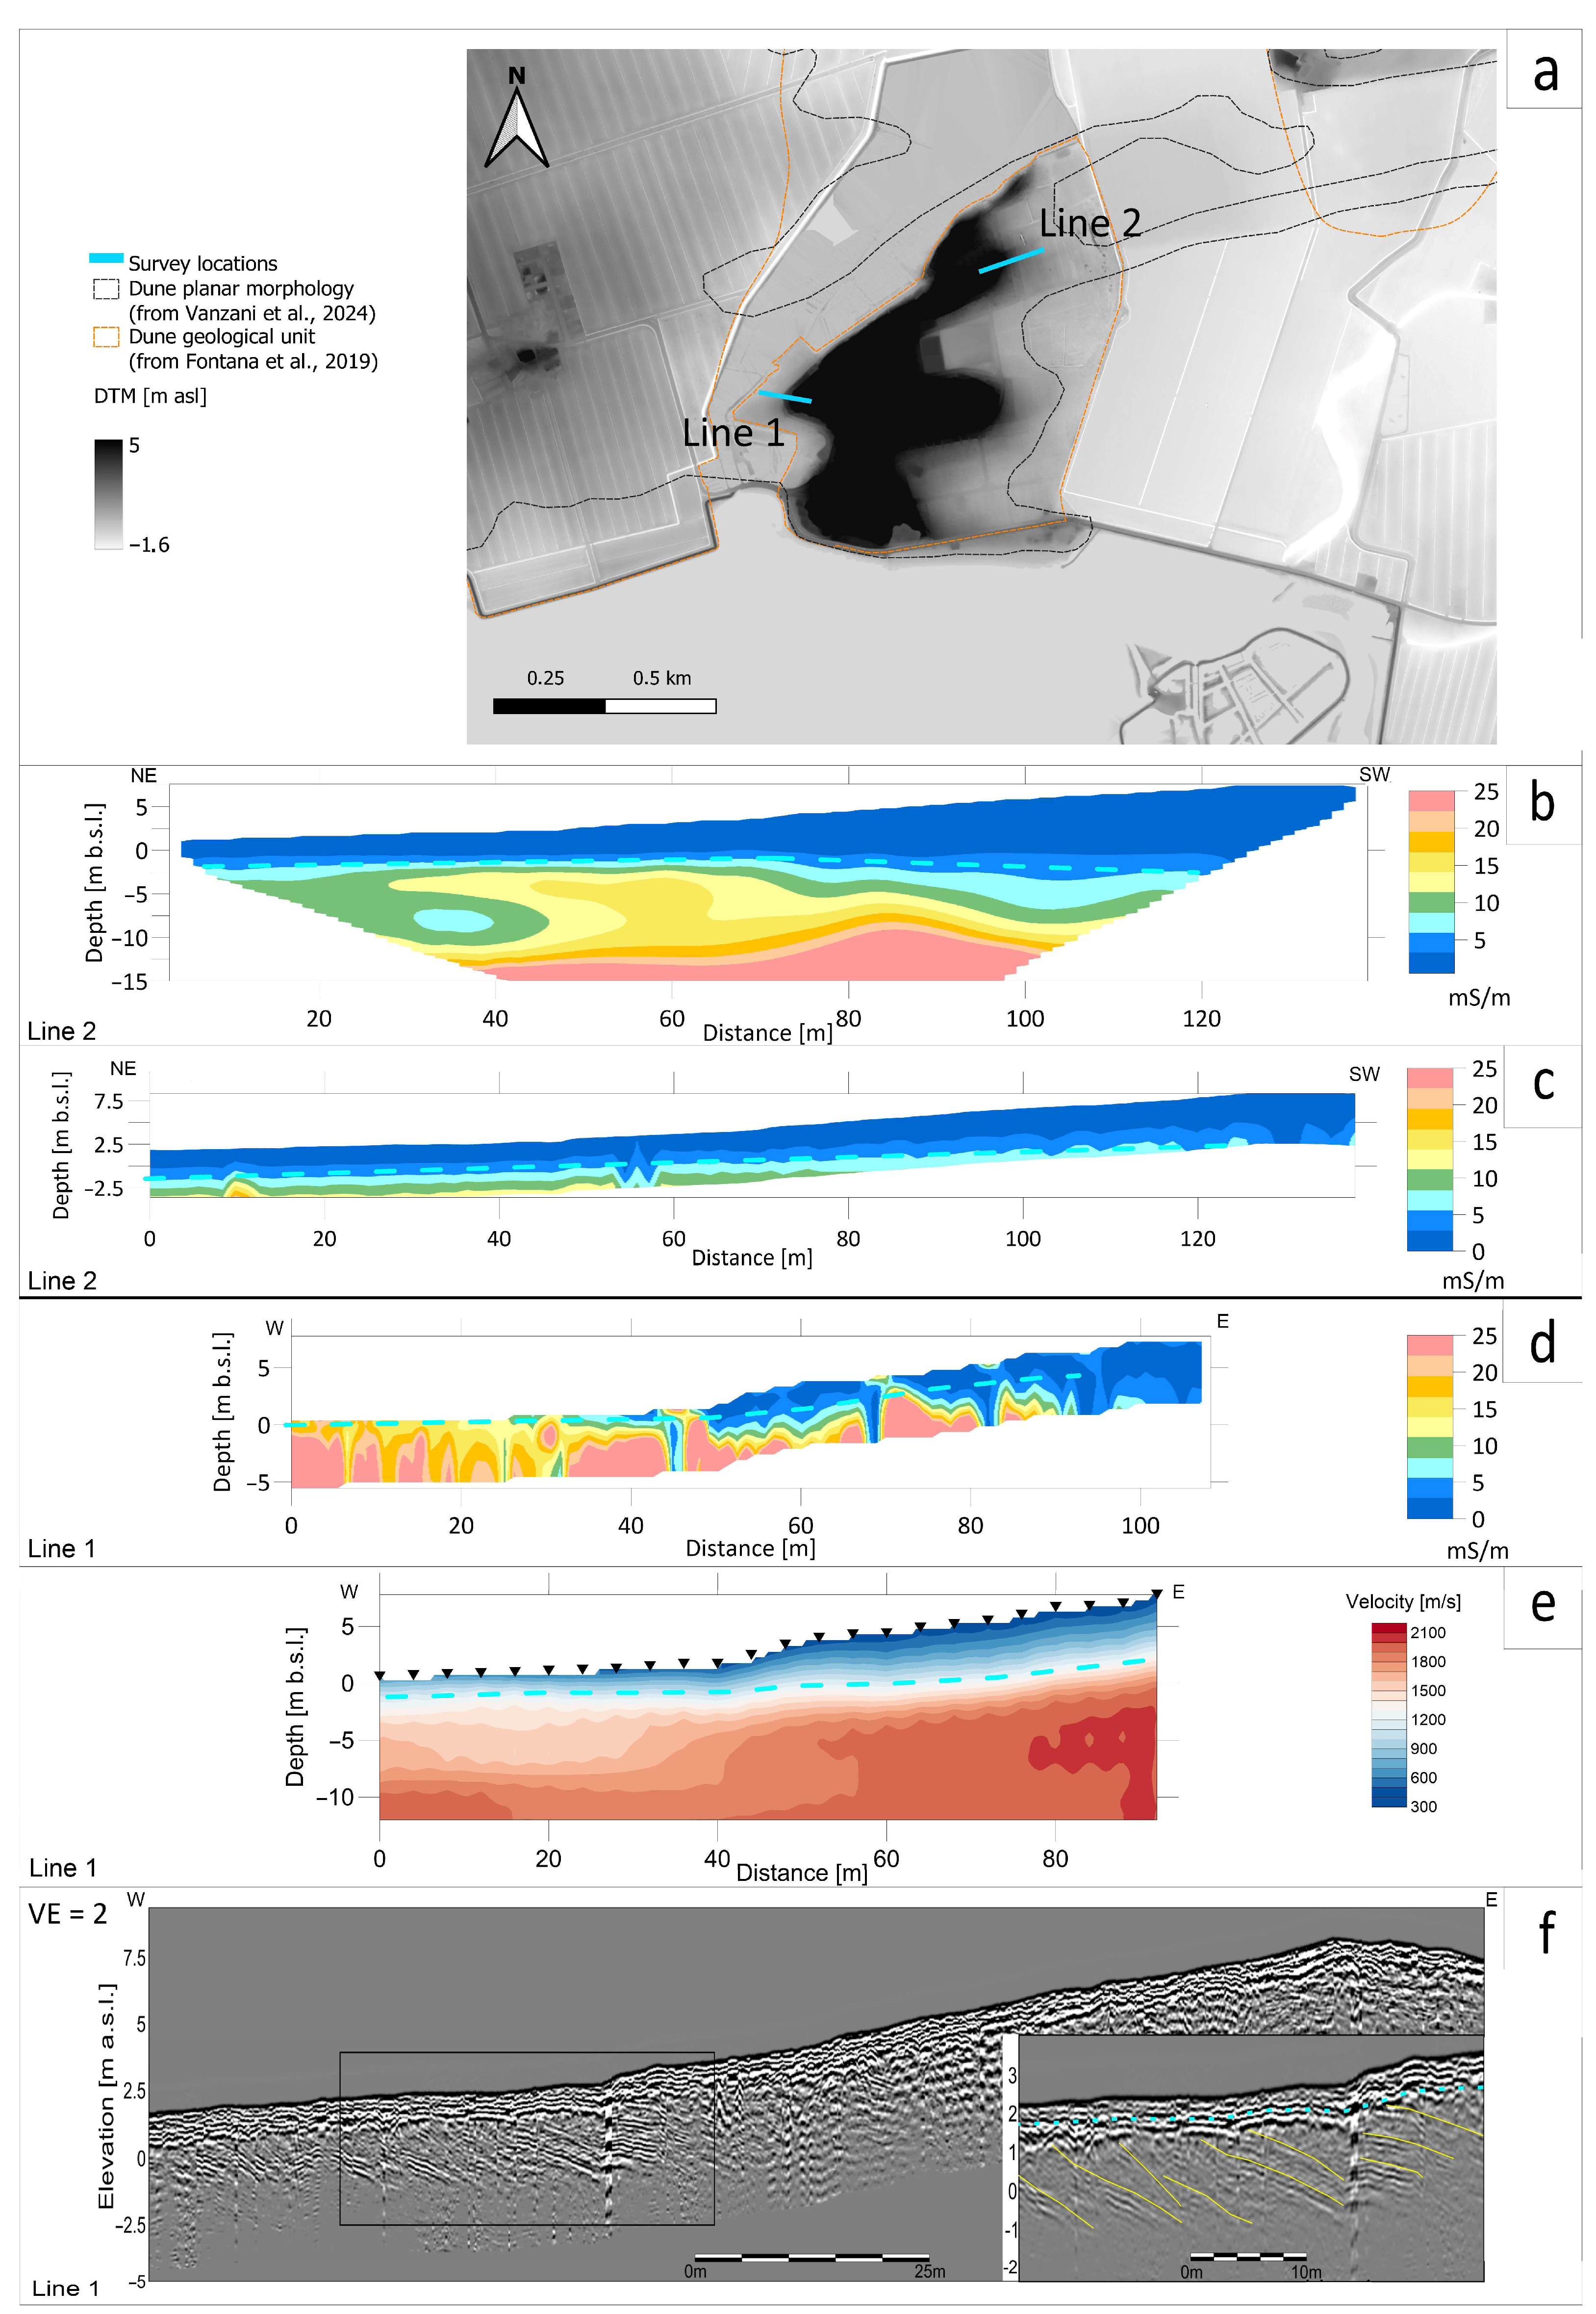
At the Belvedere site (Figure 3a), we investigated two profiles across the dune relief: a southern profile near a lagoon embayment on the west side of the dune (Line 1) of the dune and a northern profile on the opposite flank (Line 2).
Figure 3. (a) Location of the two Belvedere survey sites (cyan lines 1 and 2). (b) Inverted ERT cross-section along line 2, (c) co-located FDEM-derived electrical conductivity along the transect (CMD-Explorer), (d) FDEM-derived electrical conductivity along line 1 (CMD-Explorer), (e) corresponding inverted refraction seismic profile, (f) processed GPR profile along the ERT and the FDEM profiles. In panels (bf), the light blue dashed line marks the interpreted water table, while in the close up in (f) the yellow continuous lines highlight some of the dipping aeolian dune layers. Depth is shown relative to ground surface (m b.g.l.) for all cross-sections. The vertical scale is the same for all the panels, except (f) which has a scale that is double that of the others. Limits of the dunes in black and orange are respectively from [,].
Along the northern line (Line 2), co-located ERT and FDEM (CMD-Explorer) sections (Figure 3b,c) depict a uniformly resistive dune body with low bulk conductivities (mostly lower than 15 mS m−1) that increase only locally with depth. Maximum values remain below 25 mS m−1, consistent with freshwater-saturated sandy subsoil. The corresponding GPR profile (Figure S1) images the dune’s internal architecture, showing westward-merging stratification that persists down to the dune toe, confirming a well-bedded, permeable aeolian pack even outside the most apparent present dune structure. GPR also shows localised hyperbolae/linear diffractions attributable to anthropogenic features (buried pipes), while the FDEM section exhibits localised high-conductivity streaks consistent with man-made infrastructures; these effects are limited and do not obscure the water-table reflector or the overall conductivity pattern.
Along the southern transect (Line 1) adjacent to the embayment, FDEM cross-section again indicate low near-surface conductivities with moderate increases at depth toward the lagoon margin (still peaks close to 25 mS m−1), pointing to fresh conditions despite the proximity to brackish water. The GPR profile (Figure 3f) similarly resolves internal bedding to around 3 m b.g.l., while a co-located seismic profile (Figure 3e) shows a general velocity increase with depth, with the highest gradient corresponding to the transition from unsaturated to saturated sediments. The upper part of the dune is characterized by P-wave velocities within the 400–600 m/s range, while below the dune and in the plain at a depth close to 1 m the velocity reaches 1500 m/s, typical of water-saturated sediments. At higher depths, the velocity further increases, reaching values close to 2000 m/s, interpretable as more compact water-saturated sediments. As for Line 2, localized infrastructure signatures introduce some noise in the FDEM section, but the broader conductivity trend and the water-table expression remain clear.
Overall, the two surveys consistently indicate the presence of a resistive dune core with only modest increase in conductivity at depth or near the lagoon edge, supporting the presence of a shallow freshwater lens within the Belvedere dune as well. All the geophysical data demonstrate that the aquifer in the plain areas around the dunes is also fresh and lies at a very shallow depth (about 1 m), being hosted in sandy dipping layers, as clearly highlighted by the GPR sections (Figure 3f and Figure S1).
Across the transects, the water table position is consistently expressed by all methods: a resistivity break in ERT at the saturated interface, increasing FDEM conductivity with depth outside the dune relative to within it, a strong, continuous GPR reflector [], an abrupt transition from lower to higher P-wave velocities in the seismic data. Within method resolution, the water table arches beneath the dune crests and lowers toward the flanks, consistent with focused meteoric recharge (see Figure 3b–f).
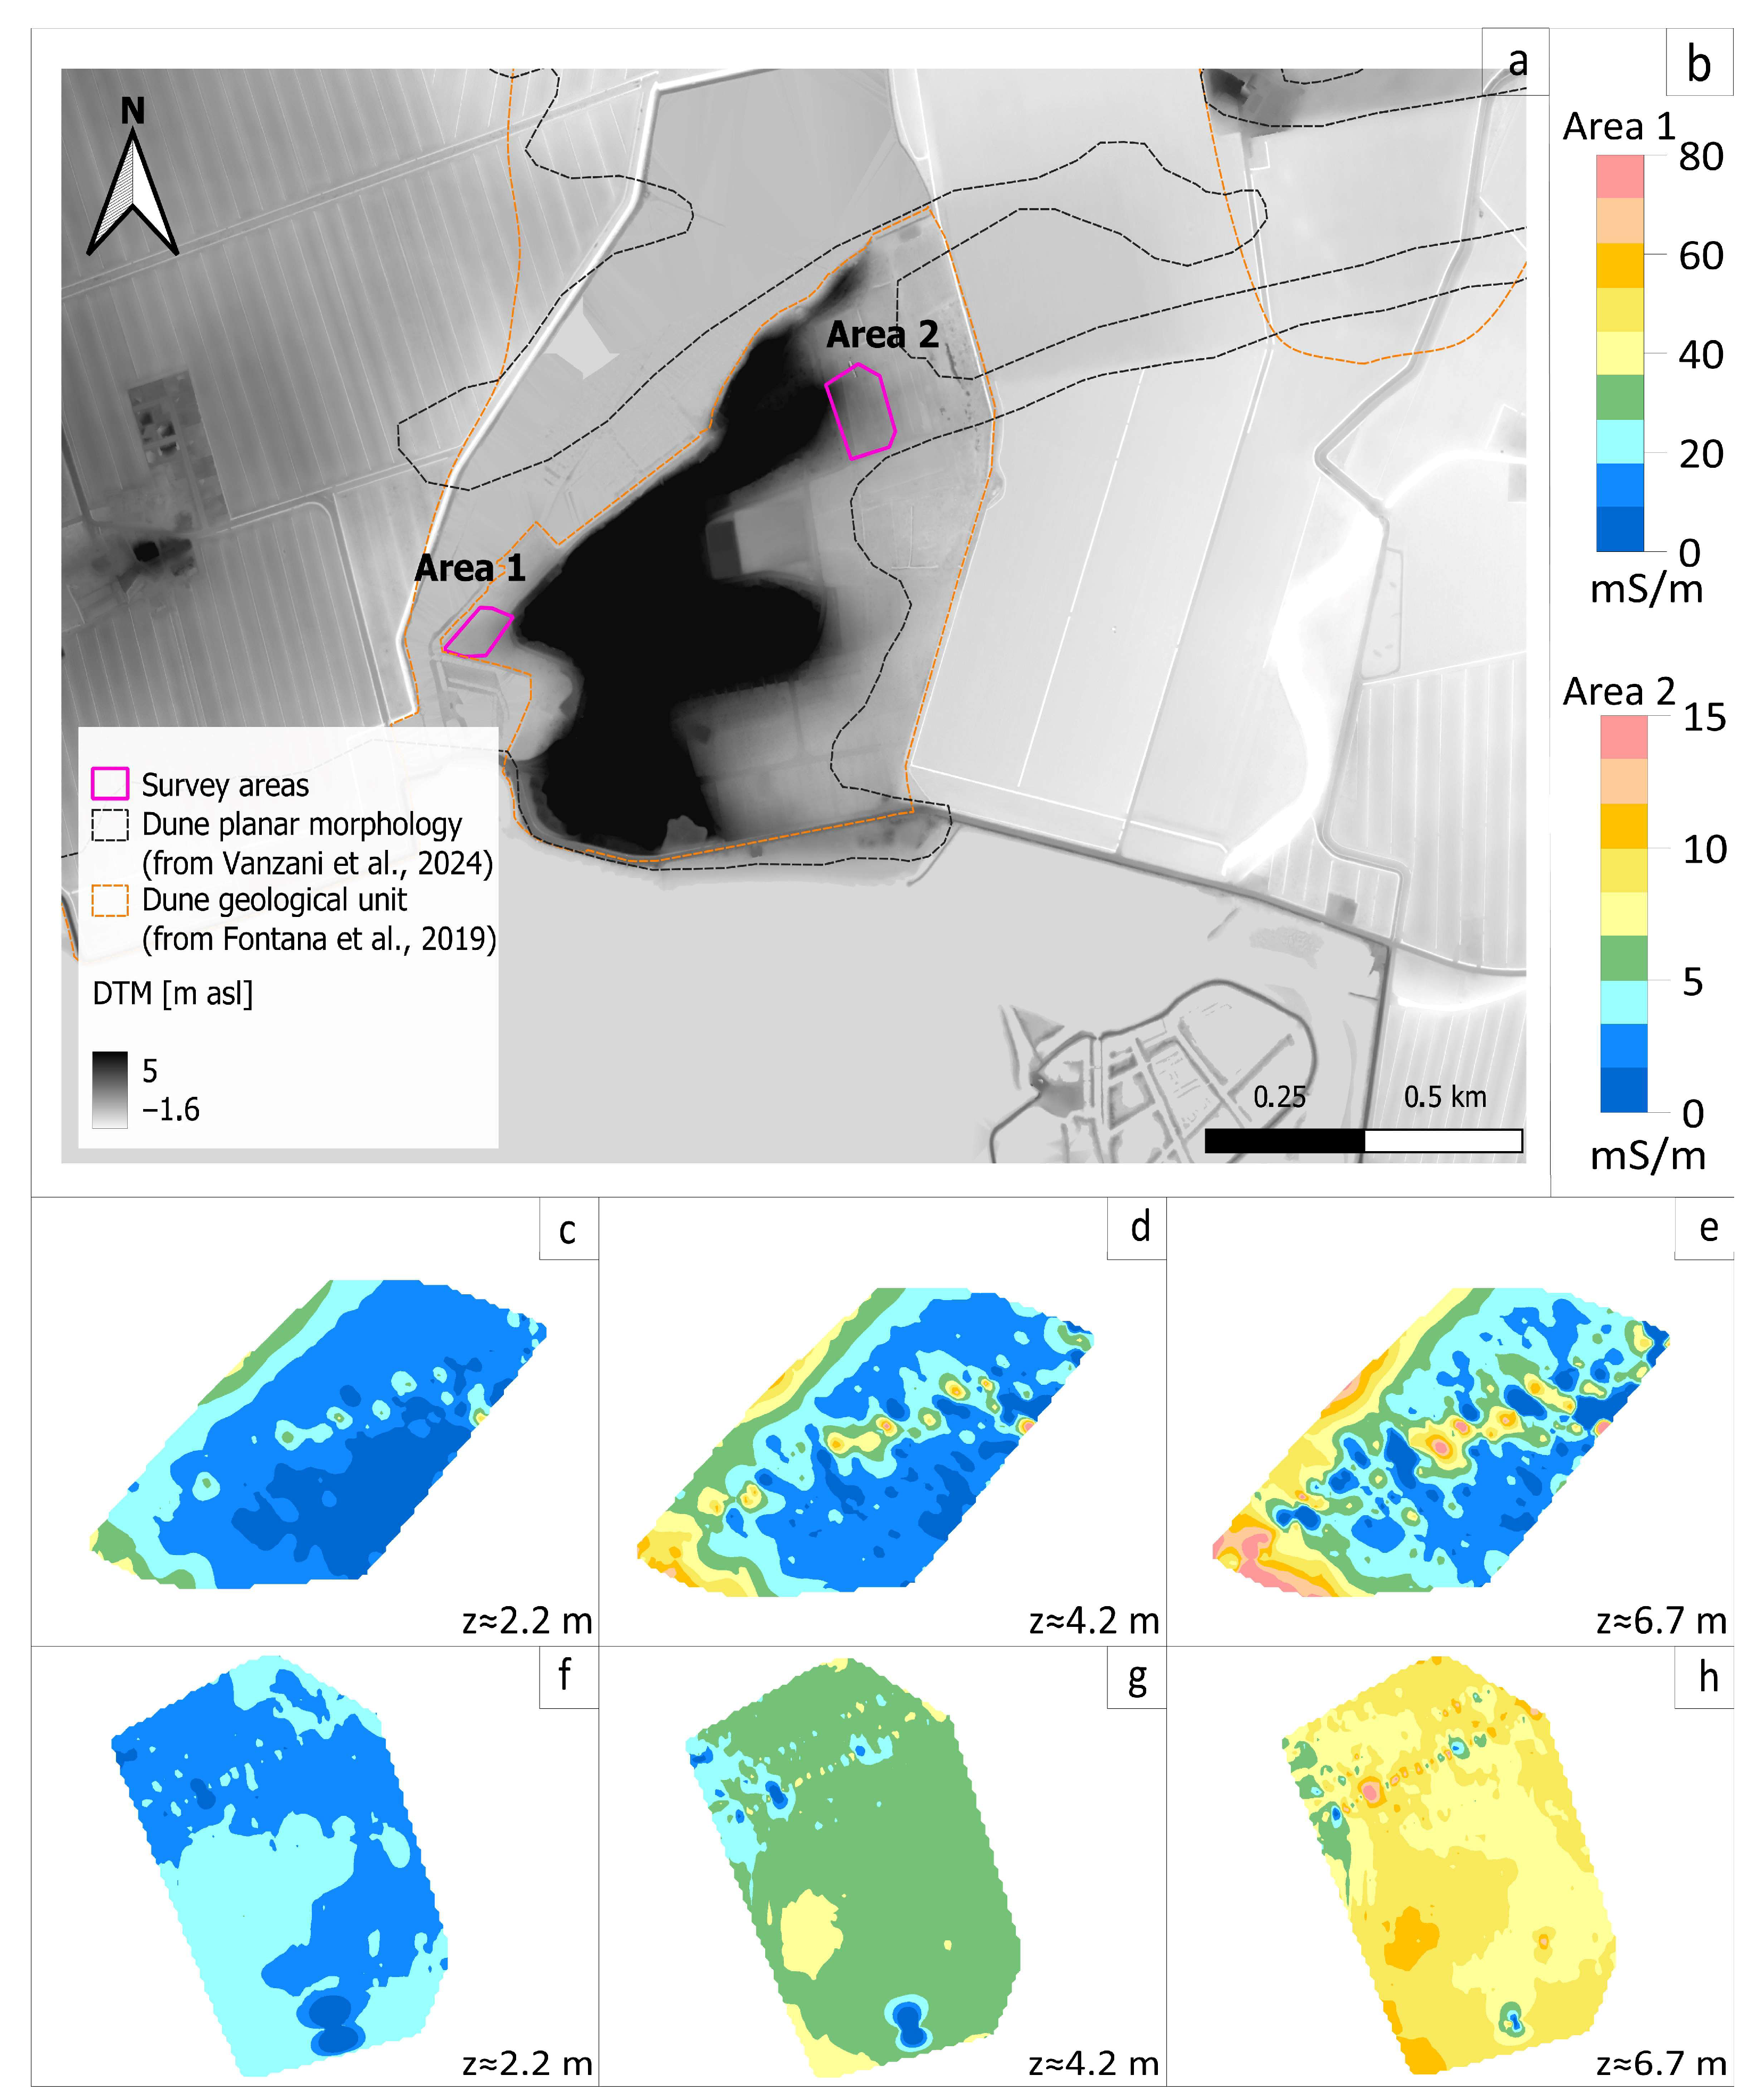
Two areas of the Belvedere dune relief were further investigated with the FDEM CMD-Explorer, namely Area 1, adjacent to a lagoonal embayment on the lagoon margin, and Area 2, farther north on the opposite side of the dune (Figure 4a). Apparent electrical conductivity (ECa) maps at nominal investigation depths of 2.2, 4.2, and 6.7 m show that Area 1 is dominated by very low near-surface ECa, with moderate increases at depth only along the sector closest to the embayment margin (Figure 4c–e). A narrow SW-NE linear anomaly cuts across the patch and is interpreted as a buried utility/pipe. Area 2 exhibits uniformly low ECa at all depths; a faint double linear feature along the northern edge most likely reflects another E-W oriented pipe (Figure 4f–h). Overall, the consistently low ECa in both patches suggests fresh water conditions and no shallow salinisation in this sector of the dune system.
Figure 4. (a) Location of the surveys on a hill-shaded DTM; magenta polygons delimit Area 1 and Area 2. (b) Colour scales for ECa in the two areas, CMD-Explorer ECa for Area 1 (ce) and for Area 2 (fh) at nominal depths z ≈ 2.2, 4.2, 6.7 m. Limits of the dunes in black and orange are respectively from [,].

3.2. Subsurface Stratigraphy

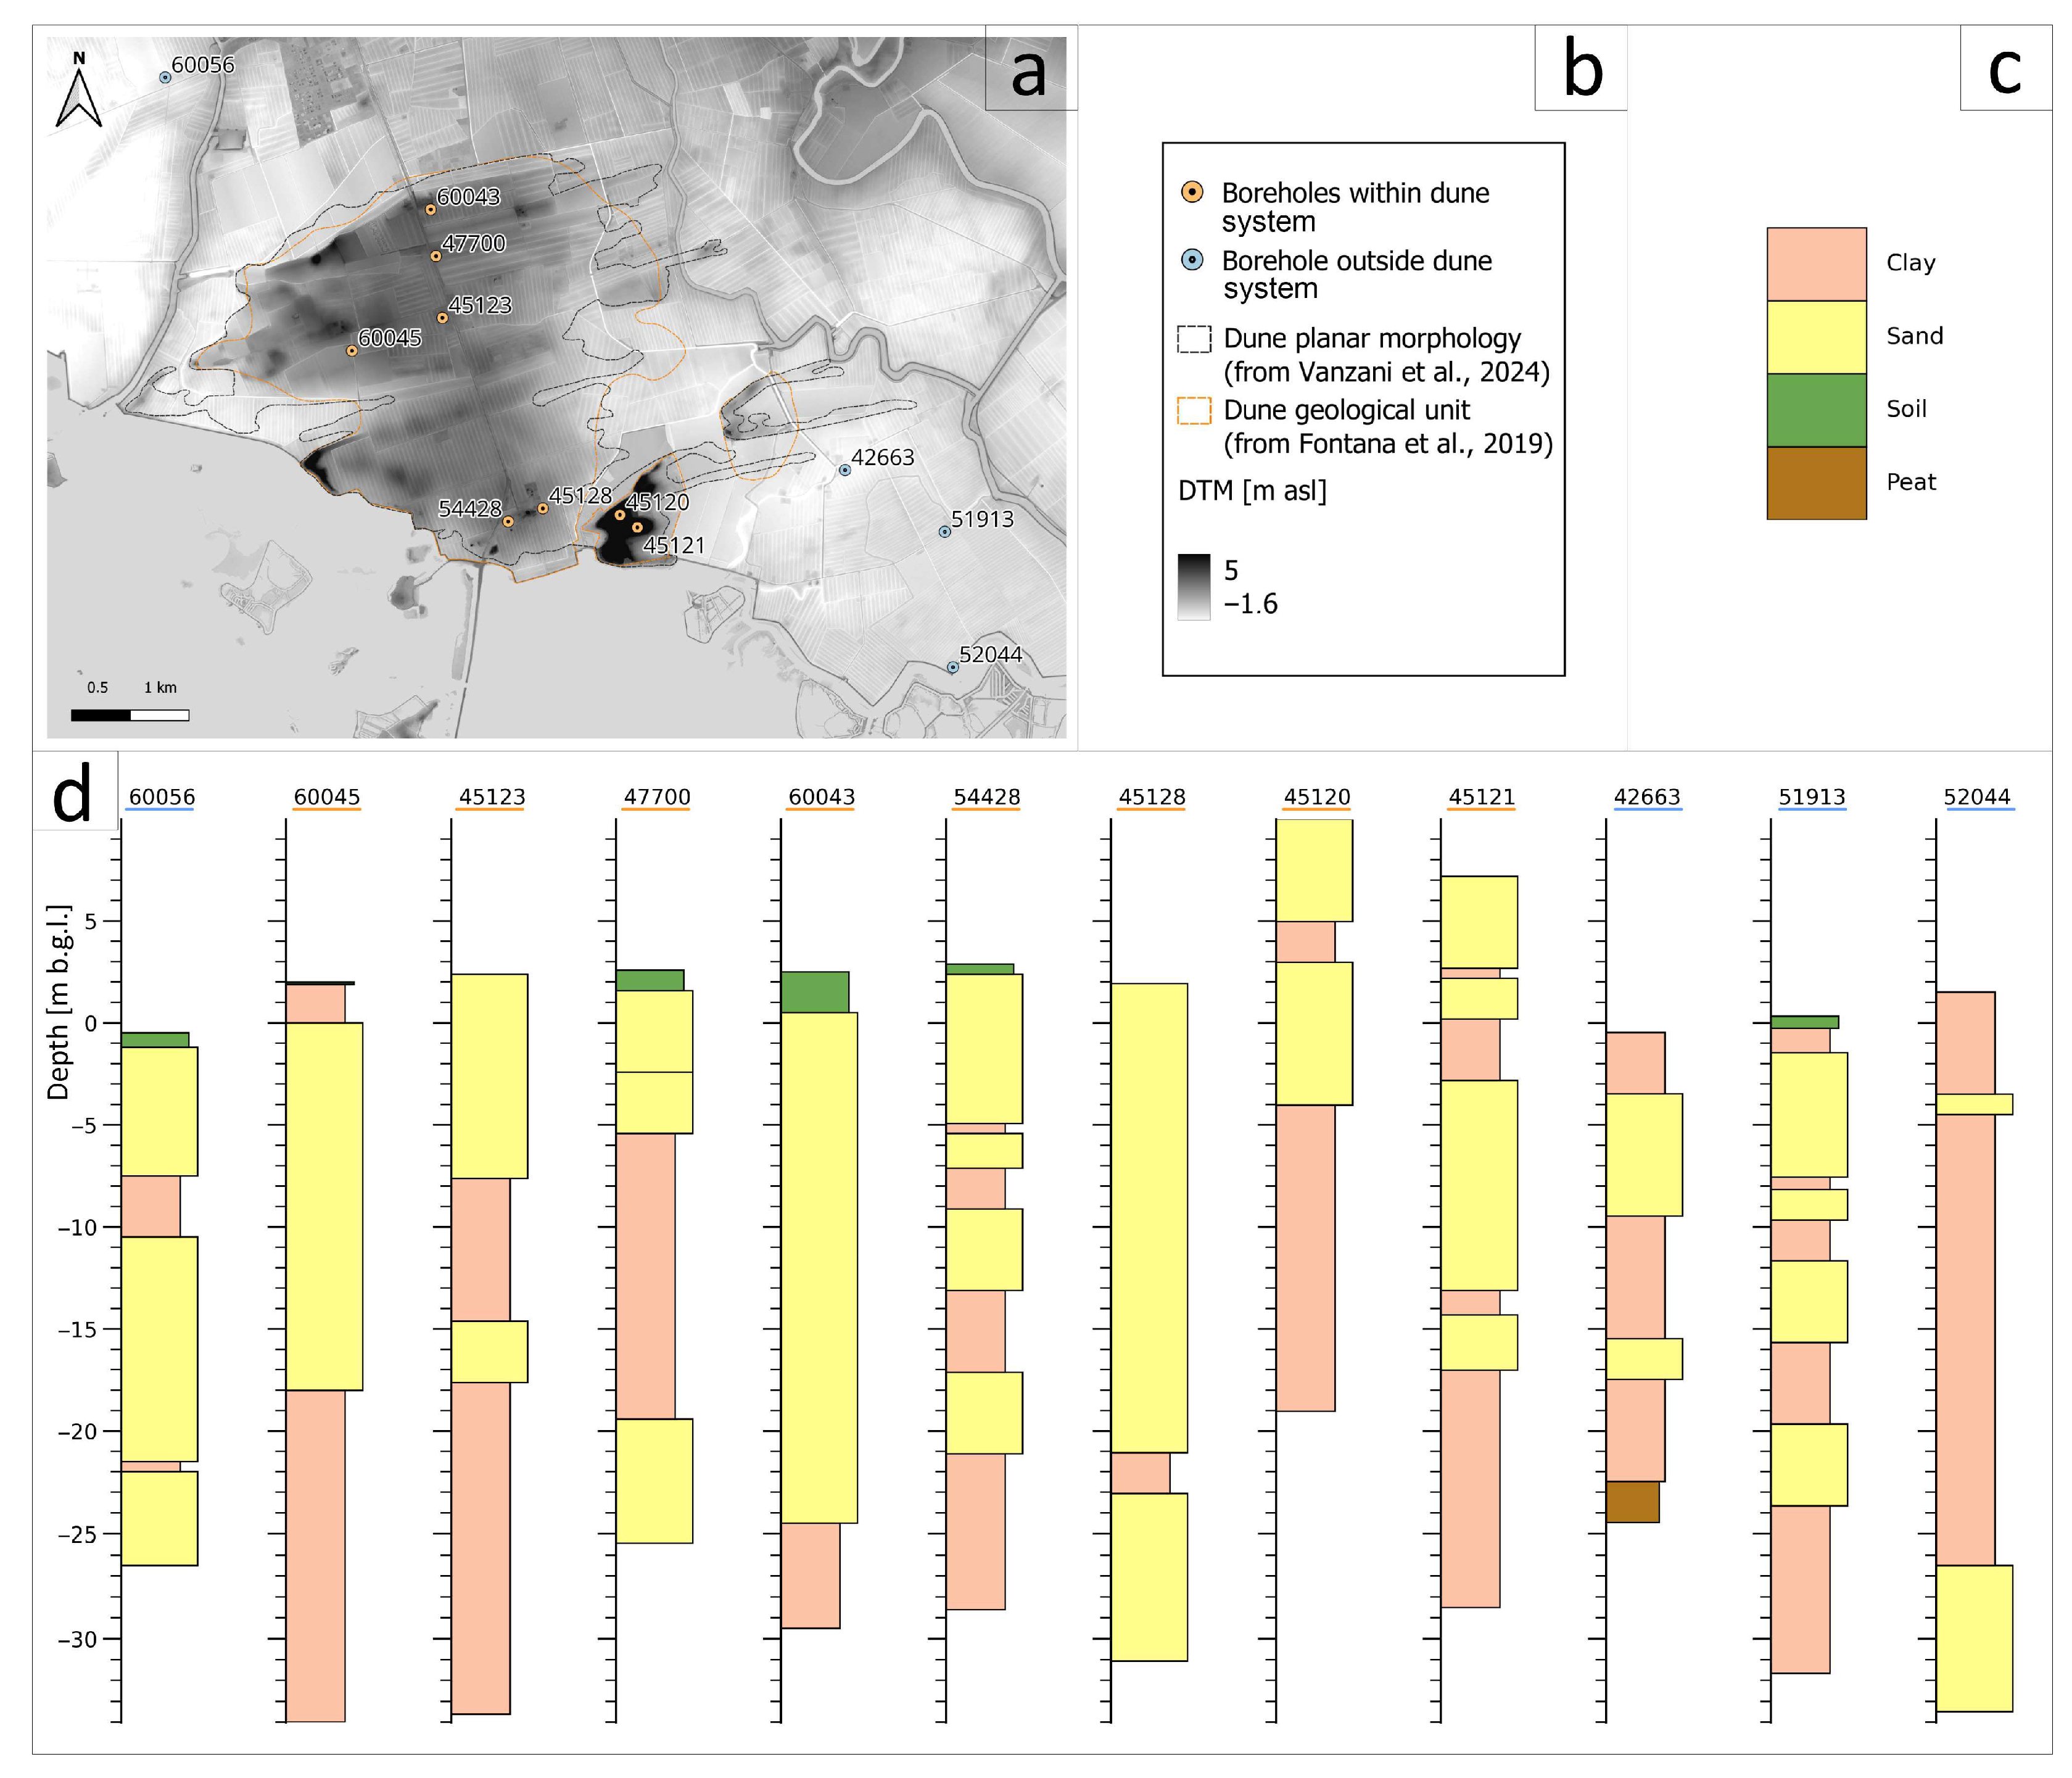
The composite borehole dataset across the study area (Figure 5) reveals a consistent vertical pattern of dune and sub-dune deposits. Within the paleo dune system, the upper 5 to 10 m are dominated by permeable aeolian sands, locally including silty sands and occasional thin gravelly or sandy silt interbeds. This dune package overlies clay-rich units that recur from about 8–12 m depth downward and continue to at least 20 to 30 m in several logs. Occasional peat/organic horizons occur within or atop the finer units, indicating periods of wetland stabilization in interdune/lagoonal settings. Laterally, sedimentary variability is modest within the dune system (e.g., boreholes 60045, 45123, 45128) but markedly increases toward the flanks, where the depositional domain becomes more lagoonal/wetland and fine-grained with sandy clay and silty sand intervals (e.g., boreholes 42663, 52044). This core-to-flank fining trend explains the observed heterogeneity at shallow depths and is consistent with the geophysical contrasts, with cleaner, more permeable sands in the dune interior and progressively finer, more conductive sediments toward the plain.
Figure 5. (a) Locations of boreholes across the study area; (b) legend for panel (a); (c) lithology codes for panel (d); (d) simplified stratigraphic logs plotted relative to ground level and depth below the ground level (m b.g.l.). For visual clarity, the borehole code numbers are underlined in orange and light blue for those within and outside the paleo dune system, respectively. Limits of the dunes in black and orange are respectively from [,].
New manual cores were obtained at 20 sites distributed across the study area to better investigate the shallow stratigraphy and, where the water table was intercepted, to measure in situ groundwater EC and temperature (the EC map is presented in Section 3.3). Core descriptions consistently show that the dune’s shallow subsurface is dominated by fine–medium, well-sorted sand, typically beneath a thin organic-rich sandy topsoil; minor silty laminae are occasional. In contrast, the surrounding lowlands/interdune depressions comprise mainly silty to clayey materials with local organic horizons, indicating lower permeability than the dune core. A representative subset of logs and photographs, three within the dune system and three outside from it, is provided in Figure S2.

3.3. Hydrogeophysical Characterisation

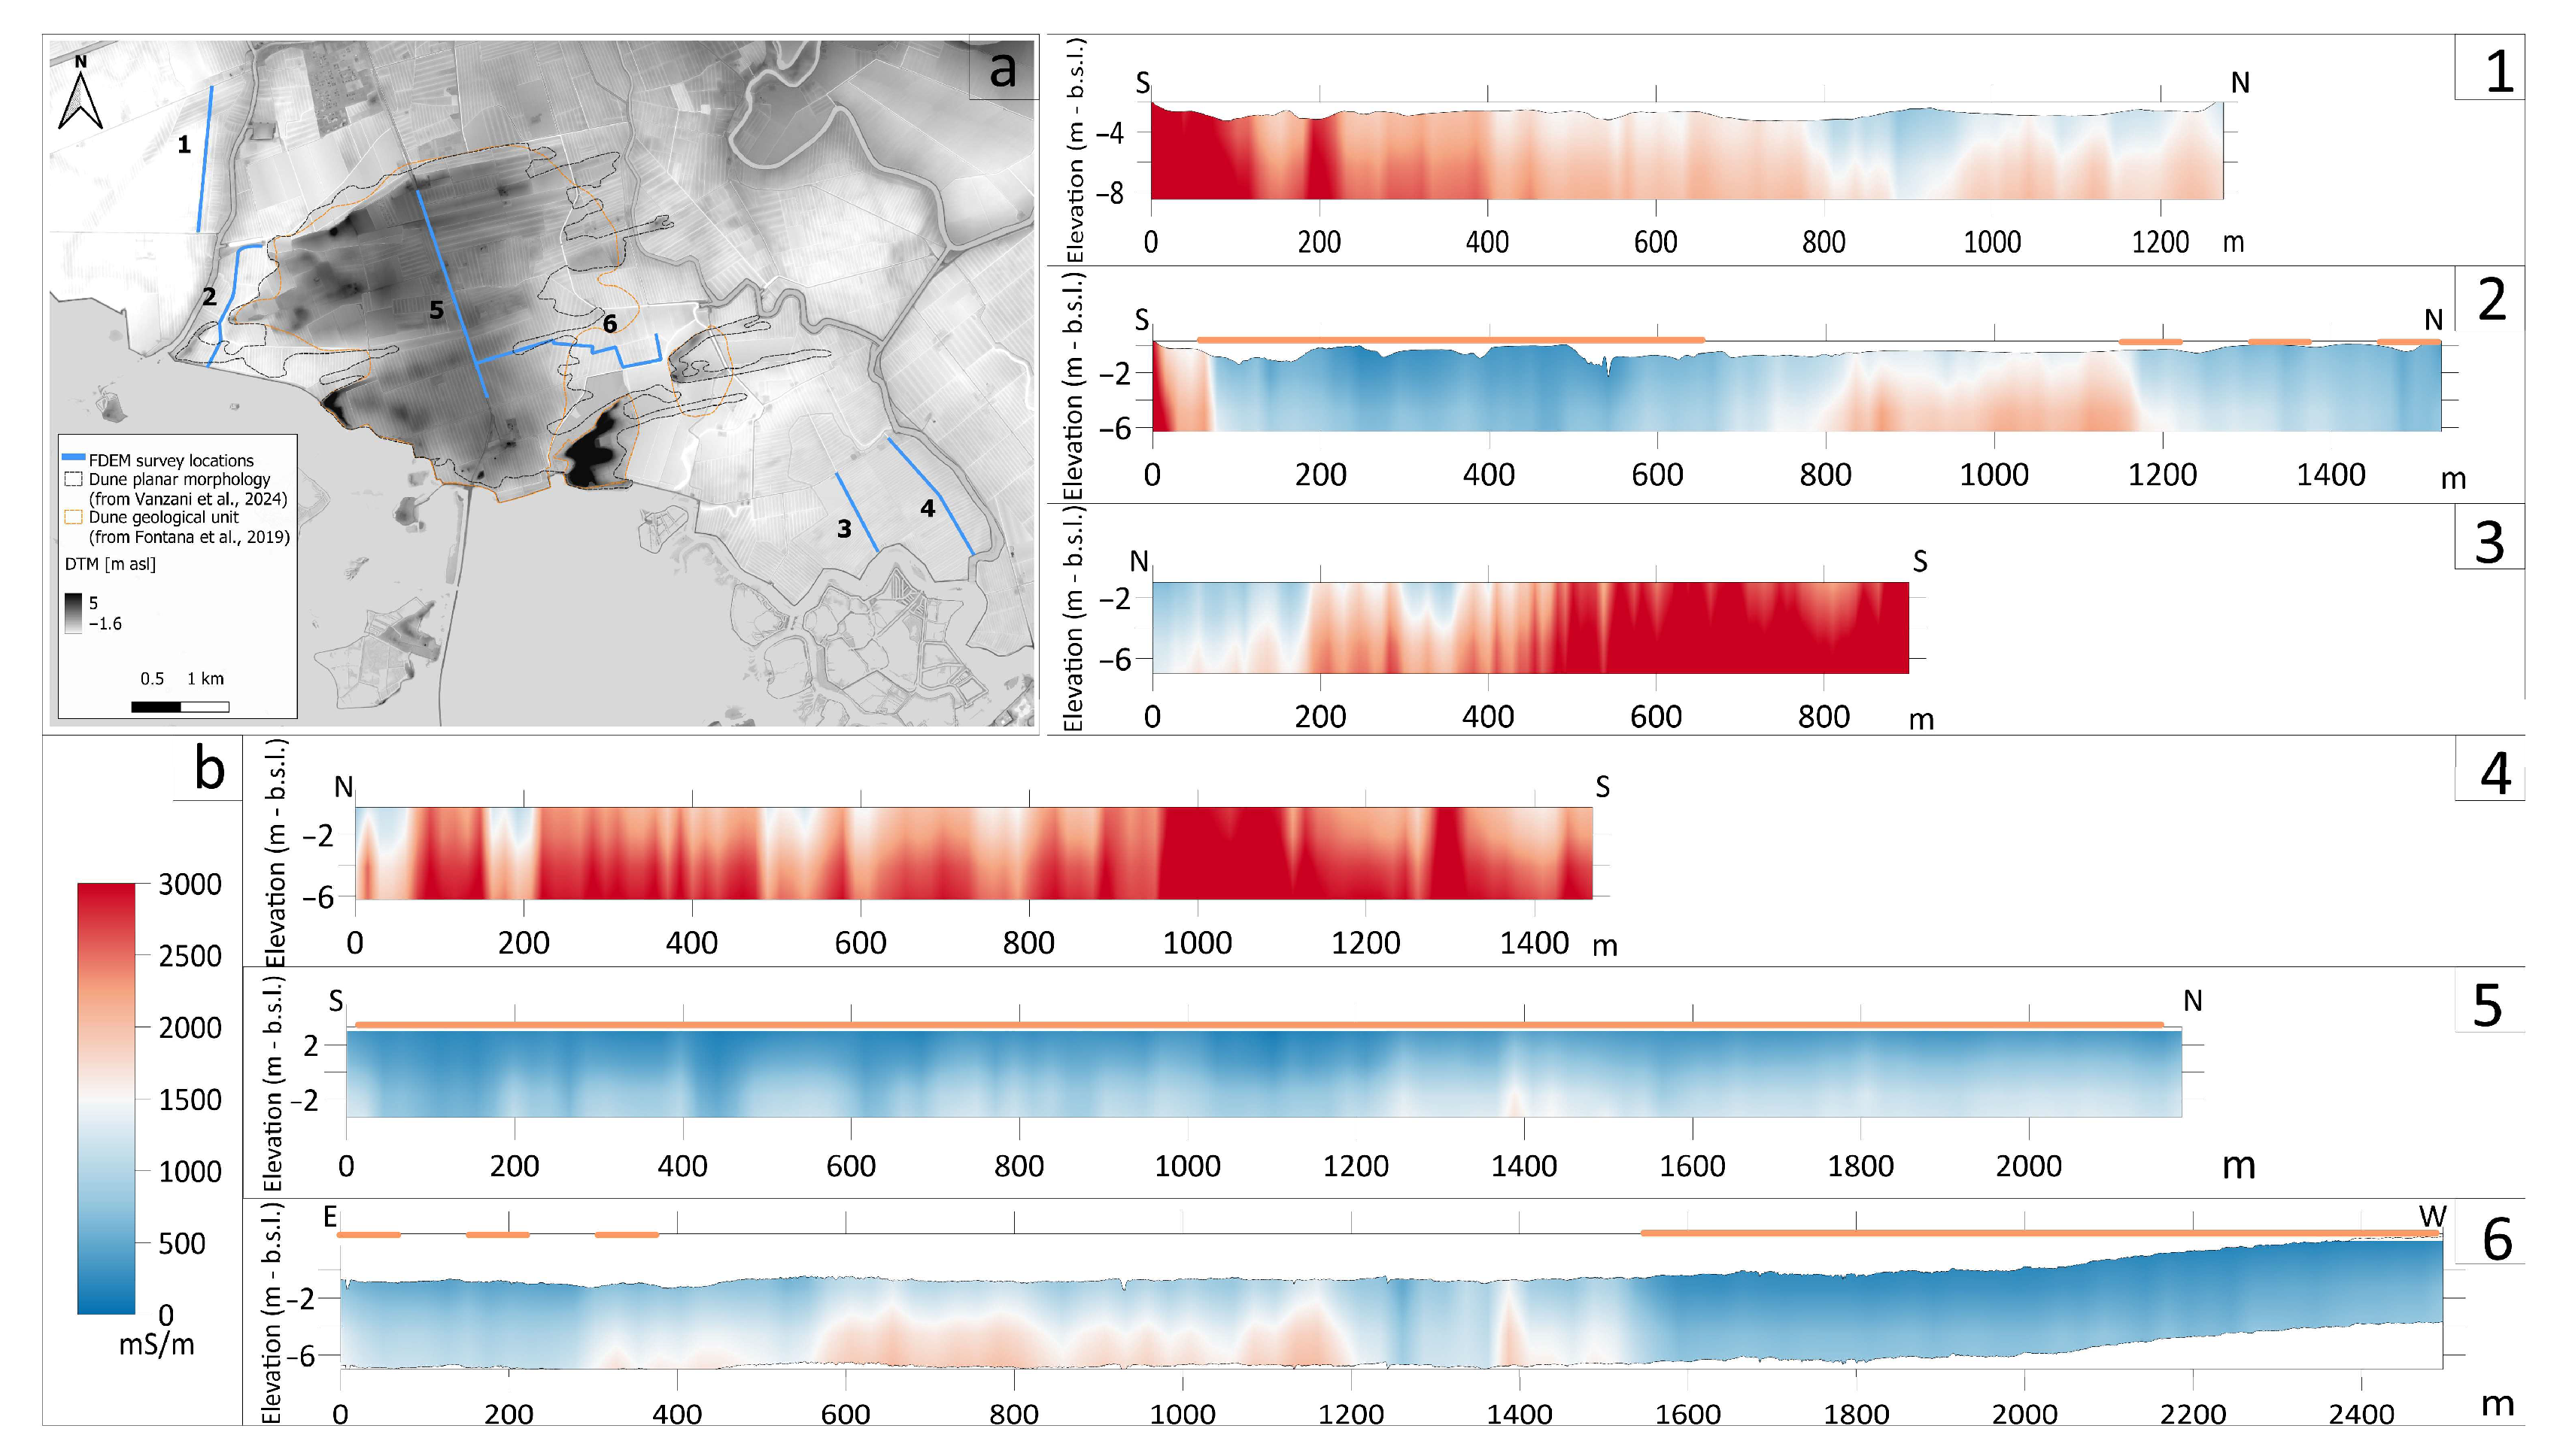
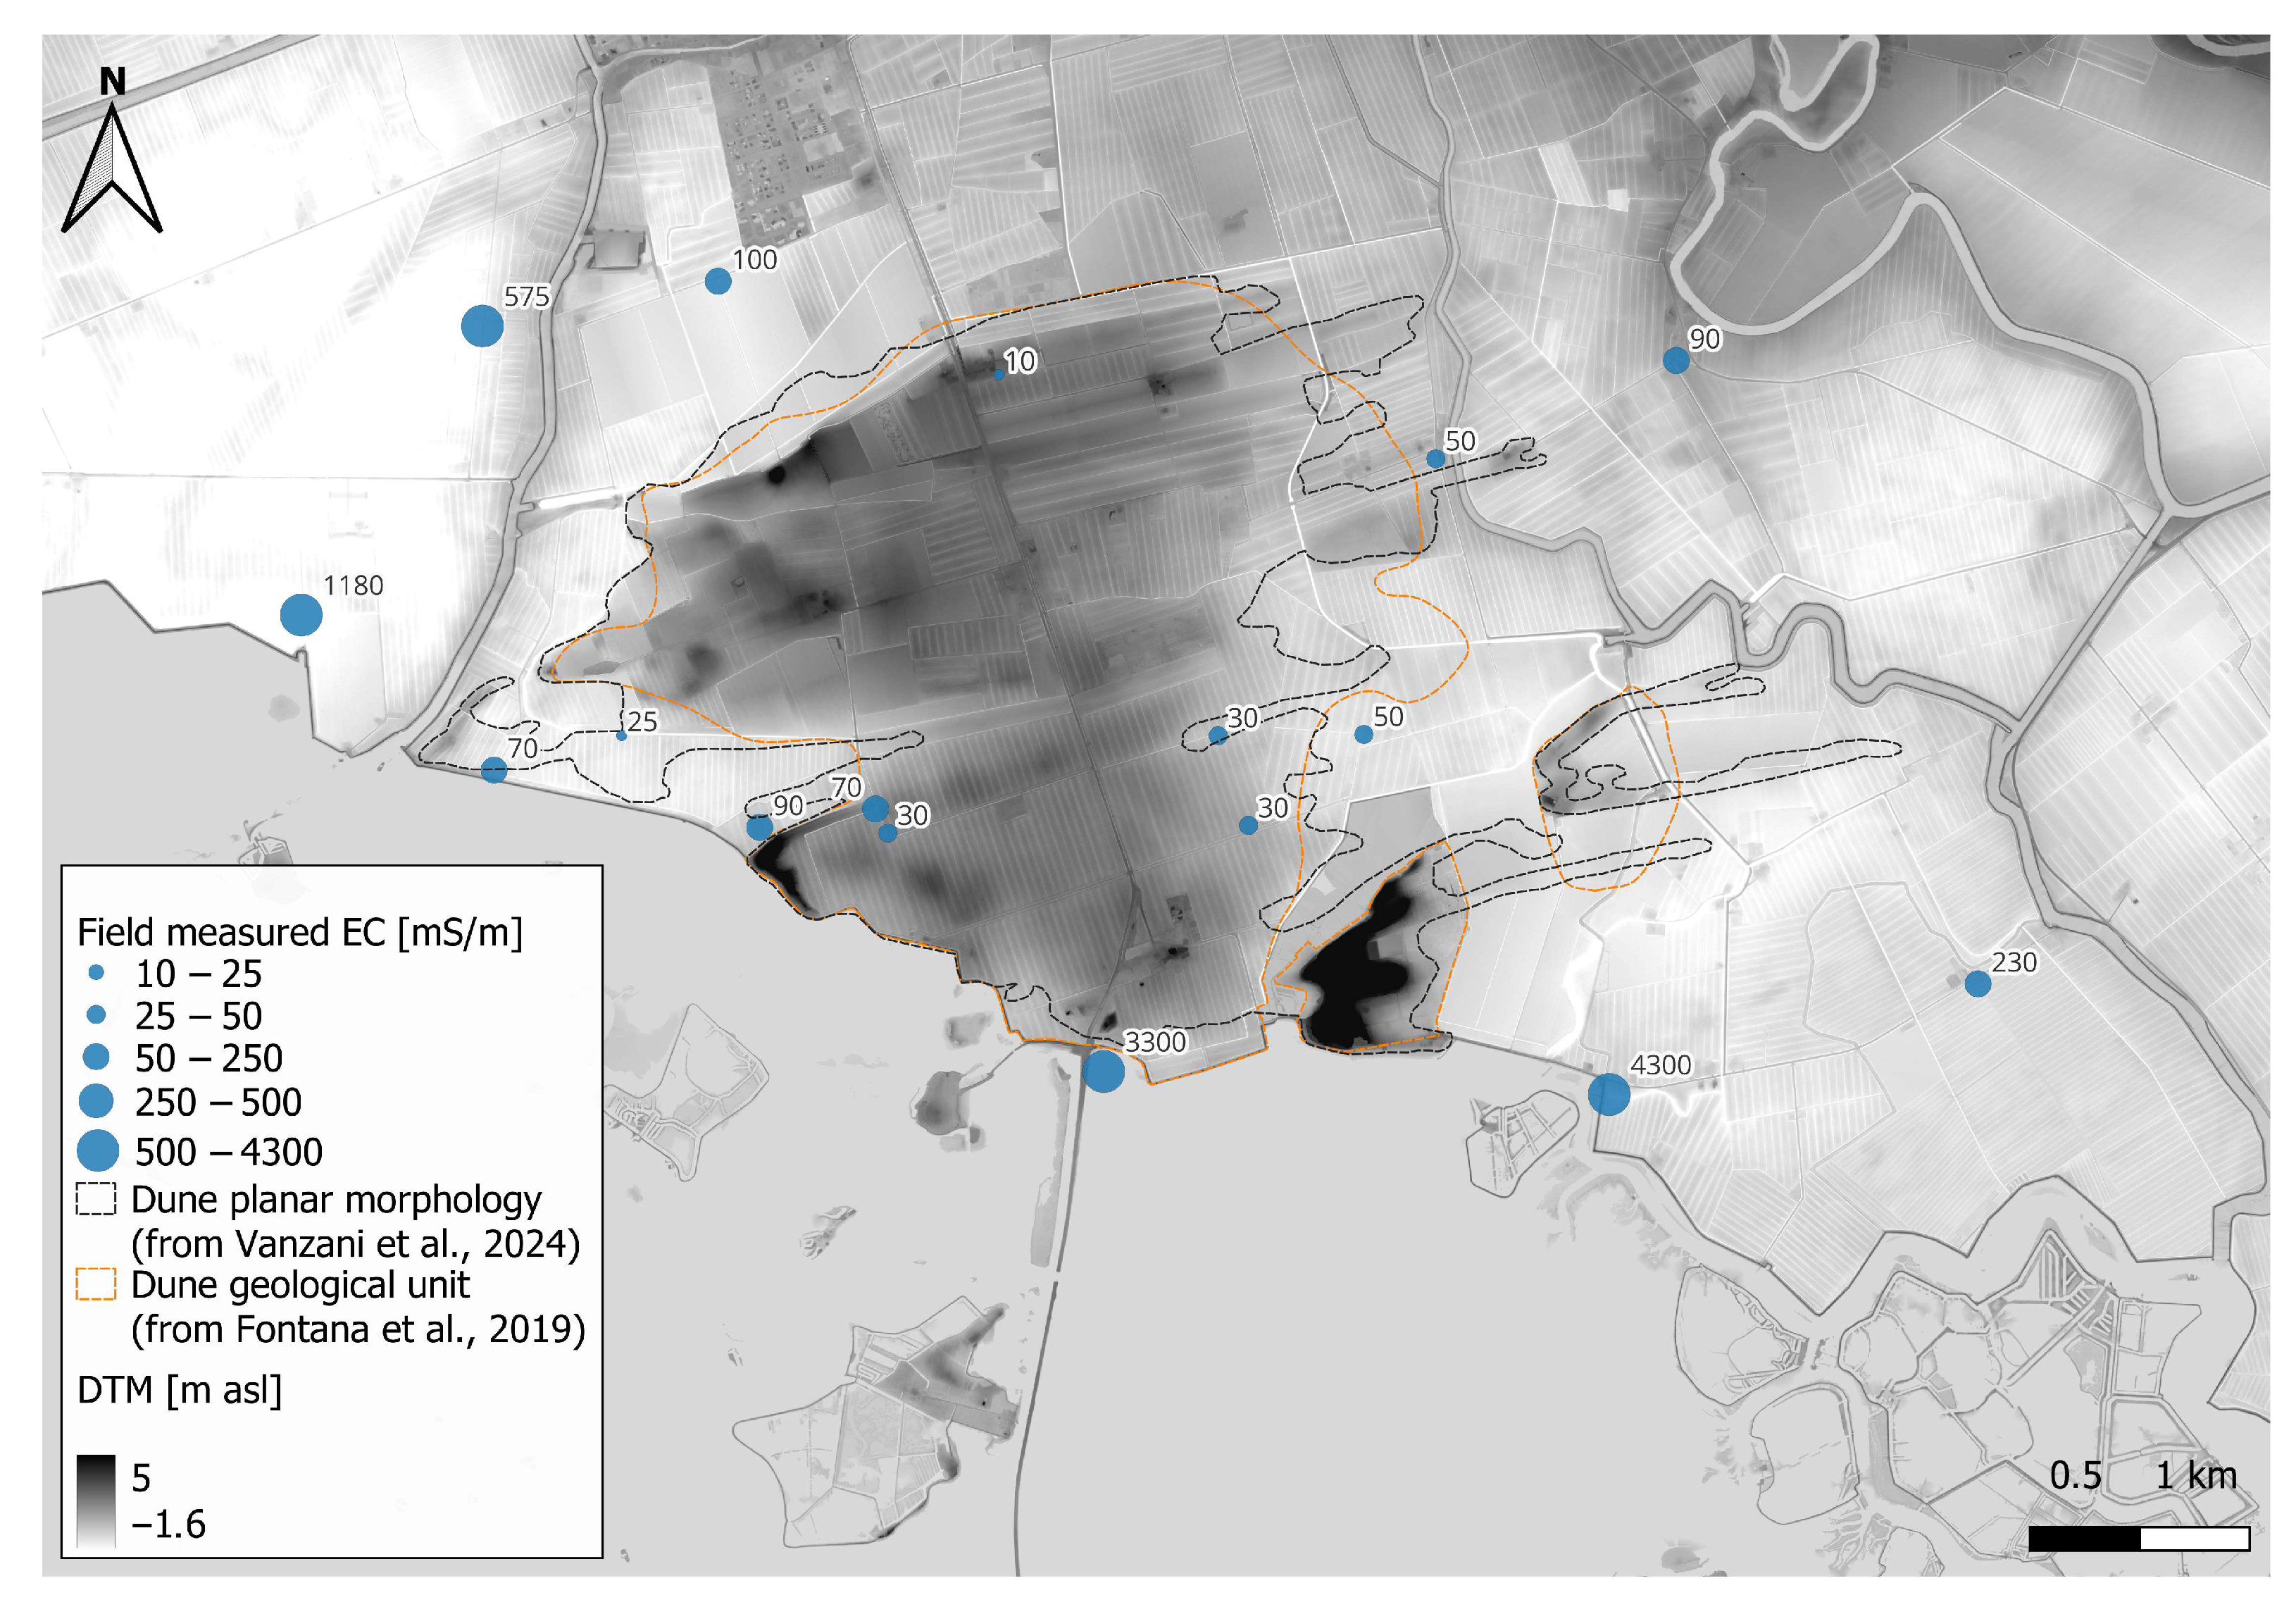
To characterise groundwater salinity within the dune system and in the lowland zone, a set of kilometre-scale FDEM transects was analysed, compared and validated by point in situ groundwater EC measurements from shallow boreholes (see the end of Section 3.2). The FDEM inverted profiles provide lateral and vertical patterns of electrical conductivity across the entire study area (Figure 6), while the point EC measurements dataset constrains porewater conditions at the water table (Figure 7). Together, these datasets establish the spatial context for the hydrogeophysical model.
Figure 6. (a) Map of selected kilometre-scale FDEM transects (blue lines) across the study area. (b) Colour scale for EC profiles in mS m−1. Electrical conductivity sections for transects (16), plotted by distance along the profile and elevation (m b.s.l.). Orientation for each section is indicated at the ends of the profiles. Solid orange bars above the sections mark portions crossing the mapped dune body [,]; dashed orange bars mark segments where the correspondence with the dune is hypothesised.
Figure 7. Groundwater electrical conductivity (EC) measurements corrected to 25 °C from shallow manual cores across the study area. Symbol sizes are scaled by EC (mS m−1). The dune geological unit (orange outline) and dune planar morphology (dashed black) are shown over the DTM. Limits of the dunes in black and orange are respectively from [,].
Figure 6 shows selected kilometre-scale FDEM lines across the study area. The orange bar above each section marks the zones where the FDEM profiles cross the mapped dune body; dashed segments indicate stretches that fall outside the dune polygons mapped in the literature [,], but likely retain dune zones. A clear pattern emerges: profiles outside the paleo dune system (i.e., numbers 1, 3, 4, and the coastal end of 2) display overall high electrical conductivity that generally increases toward the sea and with depth, consistent with saline porewaters and/or finer, saturated sediments in the lowlands. By contrast, profiles within the dune (notably numbers 5 and 6, and the inland part of 2) are uniformly low-conductive. At this broader scale, the dune system appears overall resistive and fresh-water-filled, whereas the adjacent lowland zones are conductive and prone to salinisation. This extended geophysical survey effectively maps the lateral and vertical boundaries between these two contrasting systems, visualizing key features such as the saline wedge locally intruding from the nearby lagoon and the widespread conductivity in the coastal plain, consistent with near-surface brackish to saline groundwater.
Point water EC measurements, 25 °C corrected, (Figure 7) confirm the geophysical pattern and highlight a clear and coherent spatial distribution. On the paleo dune system, values are consistently low, typically below 30 mS m−1, indicative of freshwater. In the surrounding lowlands, EC is one to two orders of magnitude higher, commonly in the thousands of mS m−1, reaching 4300 mS m−1 at the most depressed site where surface saltwater was observed (Figure 7). The agreement between direct measures and the extended geophysical mapping supports the presence of shallow freshwater reservoirs within the dune juxtaposed against brackish and/or fine-grained coastal deposits nearby.

4. Discussion

This multidisciplinary investigation provides the first quantitative evidence that the Belvedere–San Marco dune system hosts a significant shallow freshwater lens at present, acting as a natural barrier to saltwater intrusion. Across methods and scales (notably FDEM transects, ERT sections, GPR imaging, and in situ groundwater EC measurements), no high groundwater conductivity was detected within the paleo dune system. This stands in clear contrast to the surrounding coastal plain, where both geophysical outcomes and direct EC measurements indicate widespread salinisation of the shallow aquifer, consistent with established mechanisms of saline encroachment and water table salinisation in coastal settings, e.g., [].
Topography, recharge, and sedimentology together explain the fresh state of the dune aquifer. The elevated relief (up to 10 m a.s.l.) enhances infiltration of meteoric water and creates a local positive hydraulic head, so focused recharge sustains freshwater aquifers that drives flow outward and downward, counteracting saline encroachment from the lagoon. At the same time, the dune core’s highly permeable, well-sorted sands promote rapid infiltration with minimal runoff, maximising recharge, while small-scale heterogeneities (silty clay lenses, peat horizons) act only as minor semiconfining layers that may produce local variations in bulk conductivity without compromising the overall fresh conditions. Counterintuitively, higher permeability in the dune enhances recharge transmission and head build-up, thickening the freshwater lens beneath the crests (Ghyben-Herzberg behaviour) and sustaining outward and downward gradients that oppose landward wedge migration. The vulnerability of the system can increase when recharge declines or when water abstraction steepens gradients, not because of permeability per se. Comparable dune lens responses have been documented in similar temperate coastal settings [,].
ERT highlights a resistive elevated zone that coincides with the dune sands, transitioning downward to a more conductive zone near and below the water table. In light of the non-unique relationship between electrical resistivity and subsurface materials and fluids, this contrast is most plausibly attributed to increased saturation and, locally, to finer textures and/or higher pore-fluid conductivity. Where borehole control indicates clay, a basal low-permeability layer may be present, but in its absence a strict aquitard interpretation is not warranted. GPR resolves internal dune cross-bedding to about 3 m b.g.l., yet does not reveal laterally continuous, shallow low-permeability horizons that would impede vertical infiltration. However, GPR data clearly demonstrating that the dune system with typical dipping layers and cross-beddings [] also extends into plain zones that do not exhibit typical dune morphology due to anthropogenic levelling, but which can still be attributed to the paleo dune system. Taken together, the data depicts a vertically transmissive, recharge-efficient dune body overlying a less hydraulically conductive substrate, which acts as an effective hydrologic boundary at the scale of investigation without requiring a regionally extensive aquitard. At the mapping scale, the local inferences are complemented by FDEM induction, which extends the analysis laterally and provides a rapid and effective tool for the regional screening of shallow salinity. FDEM is well suited to surveys over tens of km2, providing dense lateral sampling and sensitivity to bulk electrical conductivity, a robust geophysical proxy for brackish and saline groundwater in shallow phreatic aquifers. Although the depth of investigation is modest (typically less than 10 m, depending on larger coil spacing and/or lower frequencies), modern multi-coil, multi-frequency systems (e.g., CMD-Explorer, GEM-2) enable depth-segmented inversions that resolve the near-surface salinity structure [].
ERT yields high-resolution cross-sections that image resistive dune sands over more conductive substrates and help to constrain the water table position, e.g., [,,,], at a local scale. In fact, larger regional ERT surveys would be impractical in terms of time and cost. In the proposed approach the methods are complementary: ERT and GPR resolve the shallow architecture and water table locally, while FDEM delineates the regional contrast between the resistive dune mass and the conductive coastal plain and supports repeatable, large-area screening.
The Belvedere–San Marco dunes are not merely a geomorphological relict formed about 22,000 years ago [], but they now represent an active hydrogeological asset. By sustaining a freshwater system and providing hydraulic separation from more saline lowlands, the dune likely slows salinisation in adjacent agricultural areas.
Effective management should preserve dune topography and vegetation to maintain natural recharge, protect the dune footprint from earthworks that could breach or thin the basal aquitard, and keep groundwater abstraction near dune margins conservative so that hydraulic gradients do not steepen, thus favouring lateral saline encroachment []. Any future changes to water pumping must be carefully evaluated using dedicated integrated hydrogeological modelling, e.g., [] with constraints provided by geophysical data for saltwater intrusion models [].
This study provides a spatial baseline but represents a temporal snapshot. Seasonal and interannual variability in recharge, evapotranspiration, and lagoon levels may modulate the aquifer’s thickness and salinity patterns []. Moreover, EC is used here as a proxy for salinity and should be complemented by targeted hydrochemistry (major ions, stable isotopes) where feasible. Future work should include repeated FDEM/ERT along key lines for time-lapse monitoring, and numerical flow and transport modelling to test sensitivity to different sea level rise, subsidence, and pumping scenarios.

5. Conclusions

The integrated hydrogeophysical investigation provides the first multi-scale characterisation of the Belvedere–San Marco paleo dune system demonstrating that it currently contains a significant volume of freshwater. In fact, groundwater electrical conductivity on the dune (typically lower than 30 mS m−1) together with uniformly low bulk conductivities from FDEM and ERT converge on a consistent picture of fresh conditions within the dune system, in sharp contrast to the more conductive, saline-prone lowlands around it. The formation and persistence of this fresh water lens are governed by the dune’s elevated topography, which focuses meteoric recharge and establishes a positive hydraulic head, and by a relatively low-permeability substrate at a depth that limits vertical saline upconing. As a result, the dune system acts as a natural hydraulic barrier that buffers adjacent inland areas from saltwater intrusion, and constitutes a valuable local freshwater resource. The results establish a quantitative baseline against which future monitoring can be assessed. In particular, FDEM is capable of accurately detecting the regional contrast between the resistive dune and the conductive coastal plain and that the electrical conductivity is an accurate proxy for salinity estimates. To safeguard this coastal system under pressure from sea level rise, subsidence and increasing water demand, repeated geophysical surveys along key lines, targeted in situ conductivity and selective hydrochemical analysis, together with cautious management of recharge and abstraction [,], will be essential. In particular, any future policies or management decisions relating to water pumping within the dune system and its surroundings must be carefully evaluated to prevent rapid changes to the hydrological balance, which could lead to saltwater intrusion.

Supplementary Materials

The following supporting information can be downloaded at: https://www.mdpi.com/article/10.3390/hydrology12110304/s1, Figure S1: GPR profile at the Belvedere site along the refraction seismic line; Figure S2: Representative shallow borehole logs and related field photographs from six sites across the study area.

Author Contributions

Conceptualization, B.S., E.F. and L.Z.; methodology, B.S., E.F. and L.Z.; software, B.S. and E.F.; validation, B.S. and E.F.; formal analysis, B.S. and E.F.; investigation, B.S., E.F. and L.Z.; resources, E.F. and L.Z.; data curation, B.S. and E.F.; writing—original draft preparation, B.S. and E.F.; writing—review and editing, B.S., E.F. and L.Z.; visualization, B.S. and E.F.; supervision, E.F. and L.Z.; project administration, L.Z.; funding acquisition, L.Z. All authors have read and agreed to the published version of the manuscript.

Funding

This research was founded by the European Union Next-Generation EU (Piano Nazionale di Ripresa e Resilienza (PNRR)-Missione 4, Componente 2, Investimento 1.5-D.D. 1058 23/06/2022, ECS_00000043).

Data Availability Statement

The raw data supporting the conclusions of this article will be made available by the authors on request.

Acknowledgments

This study was carried out within the PNRR research activities of the consortium iNEST (Interconnected North-Est Innovation Ecosystem). The authors acknowledge the Water 4 All Partnership in the frame of the collaborative international consortium RESCUE, financed under the 2022 Joint call of the European Partnership 101060874—Water4All. Special thanks to the management and staff of the Belvedere Pineta Camping for granting site access and permitting data acquisition within their property.

Conflicts of Interest

The authors declare no conflicts of interest.

Abbreviations

The following abbreviations are used in this manuscript:
DTMDigital Terrain Model
ECElectrical Conductivity
ECaApparent Electrical Conductivity
ERTElectrical Resistivity Tomography
FDEMFrequency-Domain Electromagnetics
FVGFriuli Venezia Giulia region
GPRGround-Penetrating Radar
m a.s.l.meters above sea level
m b.g.l.meters below ground level
m b.s.l.meters below sea level
RSSeismic Refraction (P-wave)
SWISeawater Intrusion
UNESCOUnited Nations Educational, Scientific and Cultural Organization

References

  1. Werner, A.D.; Simmons, C.T.; Gallant, J.R.; Smerdon, B.D. Seawater intrusion: Global change and groundwater response. Environ. Res. Lett. 2013, 8, 034026. [Google Scholar] [CrossRef]
  2. Panthi, J.; Pradhanang, S.; Nolte, A.; Boving, T. Saltwater intrusion into coastal aquifers in the contiguous United States—A systematic review of investigation approaches and monitoring networks. Sci. Total Environ. 2022, 836, 155641. [Google Scholar] [CrossRef]
  3. Barlow, P.M.; Reichard, E.G. Saltwater intrusion in coastal regions of North America. Hydrogeol. J. 2010, 18, 247–260. [Google Scholar] [CrossRef]
  4. Ferguson, G.; Gleeson, T. Vulnerability of coastal aquifers to groundwater use and climate change. Nat. Clim. Change 2012, 2, 342–345. [Google Scholar] [CrossRef]
  5. Da Lio, C.; Tosi, L. Land subsidence in the Friuli Venezia Giulia coastal plain, Italy: 1992-2010 results from SAR-based interferometry. Sci. Total Environ. 2018, 633, 752–764. [Google Scholar] [CrossRef]
  6. Pezzetta, E.; Lutman, A.; Martinuzzi, I.; Cucchi, F. Iron concentrations in selected groundwater samples from the lower Friulian plain, northeast Italy: Importance of salinity. Environ. Earth Sci. 2011, 62, 377–391. [Google Scholar] [CrossRef]
  7. Zavagno, E. Interazione tra Acque Marine e Acque di Falda Nella Bassa Pianura Friulana. Ph.D. Thesis, Università degli Studi di Trieste, Trieste, Italy, 2012. [Google Scholar]
  8. Felcher, S.; Strazzolini, P. Cesare Primo Mori. Lo Stato nello Stato; Aviani & Aviani: Udine, Italy, 2019. [Google Scholar]
  9. Corradin, C.; Thomas, A.T.; Camerlenghi, A.; Zini, L.; Giustiniani, M.; Busetti, M.; Foglia, L.; Bertoni, C.; Micallef, A. Characterization of an Onshore–Offshore Aquifer System in the Venetian Friulian Plain and North Adriatic Basin: A 3D Modeling Approach. Hydrogeol. J. 2025. [Google Scholar] [CrossRef]
  10. Vanzani, F.; Fontana, A.; Ronchi, L.; Boaga, J.; Chiarini, V.; Hajdas, I. The Dunes of Belvedere-San Marco of Aquileia: Integrating High-Resolution Digital Terrain Models and Multispectral Images with Ground-Penetrating Radar Survey to Map the Largest System of Continental Dunes of Northern Italy. Remote Sens. 2024, 16, 765. [Google Scholar] [CrossRef]
  11. Vandenbohede, A.; Mollema, P.N.; Greggio, N.; Antonellini, M. Seasonal dynamic of a shallow freshwater lens due to irrigation in the coastal plain of Ravenna, Italy. Hydrogeol. J. 2014, 22, 893–909. [Google Scholar] [CrossRef]
  12. Greggio, N.; Giambastiani, B.M.S.; Balugani, E.; Amaini, C.; Antonellini, M. High-resolution electrical resistivity tomography (ERT) to Characterize the Spatial Extension of Freshwater Lenses in a Salinized Coastal Aquifer. Water 2018, 10, 1067. [Google Scholar] [CrossRef]
  13. Stuyfzand, P.J. Hydrochemistry and Hydrology of the Coastal Dune Area of the Western Netherlands. Ph.D. Thesis, Vrije Universiteit Amsterdam, Amsterdam, The Netherlands, 1993. [Google Scholar]
  14. Bakker, M. The size of the freshwater zone below an elongated island with infiltration. Water Resour. Res. 2000, 36, 109–117. [Google Scholar] [CrossRef]
  15. Abu Salem, H.S.; Gemail, K.S.; Junakova, N.; Ibrahim, A.; Nosair, A.M. An integrated approach for deciphering hydrogeochemical processes during seawater intrusion in coastal aquifers. Water 2022, 14, 1165. [Google Scholar] [CrossRef]
  16. Muzzillo, R.; Zuffianò, L.E.; Rizzo, E.; Canora, F.; Capozzoli, L.; Giampaolo, V.; De Giorgio, G.; Sdao, F.; Polemio, M. Seawater intrusion proneness and geophysical investigations in the Metaponto coastal plain (Basilicata, Italy). Water 2021, 13, 53. [Google Scholar] [CrossRef]
  17. Tarallo, D.; Alberico, I.; Cavuoto, G.; Di Paola, G.; Florio, G.; Guida, D.; Nappi, R.; Rizzo, E.; Romano, G.; Russo, G.; et al. Geophysical assessment of seawater intrusion: The Volturno coastal plain case study. Appl. Water Sci. 2023, 13, 234. [Google Scholar] [CrossRef]
  18. de Louw, P.G.B.; Eeman, S.; Siemon, B.; Voortman, B.R.; Gunnink, J.; van Baaren, E.S.; Oude Essink, G.H.P. Shallow rainwater lenses in deltaic areas with saline seepage. Hydrol. Earth Syst. Sci. 2011, 15, 3659–3678. [Google Scholar] [CrossRef]
  19. Ducut, J.D.; Alipio, M.; Go, P.J.; Concepcion, R., II; Vicerra, R.R.; Bandala, A.; Dadios, E. A review of electrical resistivity tomography applications in underground imaging and object detection. Displays 2022, 73, 102208. [Google Scholar] [CrossRef]
  20. Boaga, J. The use of FDEM in hydrogeophysics: A review. J. Appl. Geophys. 2017, 139, 36–46. [Google Scholar] [CrossRef]
  21. Jol, H.M. Ground Penetrating Radar: Theory and Applications; Elsevier: Amsterdam, The Netherlands, 2009; p. 524. [Google Scholar] [CrossRef]
  22. Neal, A. Ground-penetrating radar and its use in sedimentology: Principles, problems and progress. Earth-Sci. Rev. 2004, 66, 261–330. [Google Scholar] [CrossRef]
  23. Palmer, D. Refraction Seismics: The Lateral Resolution of Structure and Seismic Velocity; Geophysical Press: London, UK, 1986; ISBN 978-0-946631-13-1. [Google Scholar]
  24. Fontana, A.; Monegato, G.; Rossato, S.; Poli, M.E.; Furlani, S.; Stefani, C. Carta Delle Unità Geologiche Della Pianura del Friuli Venezia Giulia Alla Scala 1:150,000 e Note Illustrative; Regione Autonoma Friuli Venezia Giulia-Servizio Geologico: Trieste, Italy, 2019; p. 80. [Google Scholar]
  25. Marocco, R. Evoluzione tardopleistocenica-olocenica del delta del F. Tagliamento e delle lagune di Marano e Grado (Golfo di Trieste). Alp. Mediterr. Quat. 1991, 4, 223–232. [Google Scholar]
  26. Melis, R.; Covelli, S. Distribution and morphological abnormalities of recent foraminifera in the Marano and Grado Lagoon (North Adriatic Sea, Italy). Mediterr. Mar. Sci. 2013, 14, 432–450. [Google Scholar] [CrossRef]
  27. Arnaud-Fassetta, G.; Carcaud, N.; Castanet, C.; Salvador, P.-G. The site of Aquileia (northeastern Italy): Example of fluvial geoarchaeology in a Mediterranean deltaic plain / Le site d’Aquilée (Italie nord-orientale): Exemple de géoarchéologie fluviale dans une plaine deltaïque méditerranéenne. Géomorphol. Relief Process. Environ. 2003, 9, 227–245. [Google Scholar] [CrossRef]
  28. Marocco, R. Sediment distribution and dispersal in northern Adriatic lagoons (Marano and Grado paralic system). G. Geol. 1995, 57, 77–89. [Google Scholar]
  29. Zini, L.; Calligaris, C.; Treu, F.; Zavagno, E.; Iervolino, D.; Lippi, F. Groundwater sustainability in the Friuli Plain-La sostenibilità dell’utilizzo delle acque sotterranee nella pianura friulana. Acque Sotter. Ital. J. Groundw. 2023, 12, 77–92. [Google Scholar] [CrossRef]
  30. Fontana, A.; Mozzi, P.; Bondesan, A. Late Pleistocene evolution of the Venetian-Friulian plain. Rend. Lincei. Sci. Fis. Nat. 2010, 21 (Suppl. 1), 181–196. [Google Scholar] [CrossRef]
  31. Zini, L.; Calligaris, C.; Treu, F.; Iervolino, D.; Lippi, F. Risorse Idriche Sotterranee del Friuli Venezia Giulia: Sostenibilità Dell’Attuale Utilizzo; EUT Edizioni Università di Trieste: Trieste, Italy, 2011. [Google Scholar]
  32. OSMER–ARPA FVG. Climatological Data for Friuli Venezia Giulia (1991–2020). Available online: https://www.osmer.fvg.it/clima.php (accessed on 5 November 2025).
  33. Badaruddin, S.; Werner, A.D.; Morgan, L.K. Water table salinization due to seawater intrusion. Water Resour. Res. 2015, 51, 8397–8408. [Google Scholar] [CrossRef]
  34. Rotzoll, K.; Oki, D.S.; El-Kadi, A.I. Changes of freshwater-lens thickness in basaltic island aquifers overlain by thick coastal sediments. Hydrogeol. J. 2010, 18, 1425–1436. [Google Scholar] [CrossRef]
  35. Jones, F.H.; dos Santos Scherer, C.M.; Kuchle, J. Facies architecture and stratigraphic evolution of aeolian dune and interdune deposits. Sediment. Geol. 2016, 337, 133–150. [Google Scholar] [CrossRef]
  36. Alcalá, F.; Paz, M.C.; Martínez-Pagán, P.; Santos, F. Integrated geophysical methods for shallow aquifers characterization and modelling. Appl. Sci. 2022, 12, 2271. [Google Scholar] [CrossRef]
  37. Tesfaldet, Y.T.; Puttiwongrak, A. Seasonal Groundwater Recharge Characterization Using Time-Lapse Electrical Resistivity Tomography in the Thepkasattri Watershed on Phuket Island, Thailand. Hydrology 2019, 6, 36. [Google Scholar] [CrossRef]
  38. Becker, M.W.; Cason, F.M.; Hagedorn, B. Locating Potential Groundwater Pathways in a Fringing Reef Using Continuous Electrical Resistivity Profiling. Hydrology 2023, 10, 206. [Google Scholar] [CrossRef]
  39. Hussain, M.S.; Abd-Elhamid, H.F.; Javadi, A.A.; Sherif, M.M. Management of seawater intrusion in coastal aquifers: A review. Water 2019, 11, 2467. [Google Scholar] [CrossRef]
  40. Tiwari, P.; Rupesh, R.; Sharma, S.P.; Ciazela, J. Dynamics of saltwater intrusion in a heterogeneous coastal environment: Experimental, DC resistivity, and numerical modeling approaches. Water 2024, 16, 1950. [Google Scholar] [CrossRef]
  41. Kumar, S.S.; Deb Barma, S.; Amai, M. Simulation of coastal aquifer using mSim toolbox and COMSOL multiphysics. J. Earth Syst. Sci. 2020, 129, 66. [Google Scholar] [CrossRef]
  42. Nhan, P.Q.; Trung, D.T.; Le, T.T.; Hung, N.K.; Hoang, P.M.; Thinh, T.D. A Simplified Approach of Pumping Rate Optimization for Production Wells to Mitigate Saltwater Intrusion: A Case Study in Vinh Hung District, Long An Province, Vietnam. Hydrology 2024, 11, 185. [Google Scholar] [CrossRef]
  43. Mao, D.; Wang, X.; Meng, J.; Ma, X.; Jiang, X.; Wan, L.; Yan, H.; Fan, Y. Infiltration Assessments on Top of Yungang Grottoes by Time-Lapse Electrical Resistivity Tomography. Hydrology 2022, 9, 77. [Google Scholar] [CrossRef]
Disclaimer/Publisher’s Note: The statements, opinions and data contained in all publications are solely those of the individual author(s) and contributor(s) and not of MDPI and/or the editor(s). MDPI and/or the editor(s) disclaim responsibility for any injury to people or property resulting from any ideas, methods, instructions or products referred to in the content.

Article Metrics

Citations

Article Access Statistics

Article metric data becomes available approximately 24 hours after publication online.