Abstract
Hydroclimatic and geomorphological prerequisites for mudflow hazard were studied using data on several of the largest flood events in the Khamar-Daban mountain area (Lake Baikal, East Siberia) for the period from 1966 to 2022. The data include flood-forming precipitation and atmospheric circulation patterns, the amount of related suspended sediment discharge in the years of high floods, as well as terrain features favorable for the formation of catastrophic floods and mudflows. Floods and mudflows in the area can arise under conditions of extremely high daily precipitation (up to 200 mm or more) after the territory becomes moistened by prolonged rainfall under meridional air transport. The maximum water discharge correlates with a multifold increase in the suspended sediment discharge and turbidity. The increase in sediment discharge associated with maximum water discharge (floods) of ≤10% probability is apparently due to 4–9 times higher flow rates. On the other hand, the formation of the solid runoff component in the area is controlled geomorphologically by slope processes depending on slope steepness, elevation contrasts, and the thickness of soft sediments subject to denudation and transport. The geomorphological conditions are most favorable for the development of mudflows and catastrophic floods in the catchments of the Bezymyannaya, Slyudyanka, Khara-Murin, and Utulik rivers. Floods and mudflows are especially hazardous on the southern shore of Lake Baikal, encircled by the Khamar-Daban Range, where active mudflow processes pose risks to the towns of Slyudyanka and Baikalsk, as well as to the sludge storage facilities of the abandoned Baikal Pulp and Paper Mill.
1. Introduction
The formation of rainfall and mudflow floods becomes possible under the combined effect of hydroclimatic and geomorphological factors [1,2,3,4]. The formation of mudflows depends on the magnitude and variability of water and sediment flows, which, in turn, are controlled by moisture patterns, including precipitation and floods. The formation and propagation of storm floods in the mountains are commonly determined by daily precipitation increased to the maximum level.
Large hazardous mudflows arise in the drainage basins of rivers on the major northern slope of the Khamar-Daban Range that flanks Lake Baikal in the south (East Siberia). The rivers of the area are prone to flood and mudflow hazards created by hydrological, climatic, and topographic conditions, the latter being a combination of surface and subsurface terrain-forming processes typical of mountainous provinces [5,6]. The mountainous terrain of the area is favorable for rapid rainwater runoff during floods, along with the active development of erosion processes that supply voluminous debris material. Rainfall floods and mudflows most often occur during the warm season from May to September.
Floods and the related mudflows pose risks of infrastructure damage to the densely populated and economically developed urban territories in the area, including large and small towns (Slyudyanka, Baikalsk, Kultuk) and villages (Utulik, etc.), industrial enterprises, mines, and motor and railroads. Of special concern is the potential damage to the sludge storage facilities of the currently abandoned Baikal Pulp and Paper Mill (BPPM), which are located in close proximity to Lake Baikal and have been filled.
This study aims at a comprehensive analysis of hydroclimatic and geomorphological prerequisites for mudflow hazard on the southern shore of Lake Baikal. The data include records of weather and hydrological stations located on several mudflow-prone rivers flowing from the Khamar-Daban Range into southern Lake Baikal. The addressed issues are as follows: (i) rainfall floods and flood-forming precipitation for the period from 2001 to 2022; (ii) maximum rainfall flood discharge over 1966–2022; (iii) air circulation patterns in the area; (iv) the amount of suspended load estimated from records at hydrological stations; (v) terrain features and topographic conditions favorable for the origin of catastrophic floods and mudflows.
2. Data and Methods
2.1. Study Area
The study area is located in the southern Irkutsk region and the Republic of Buryatia (East Siberia, Russia) and encompasses the drainage basins of the Snezhnaya, Khara-Murin, Utulik, Bezymyannaya, Slyudyanka, and Pokhabikha rivers on the major northern slope of the Khamar-Daban Range and the southern shore of Lake Baikal (Table 1, Figure 1 and Figure 2).

Table 1.
Morphometric characteristics of rivers and their drainage basins.
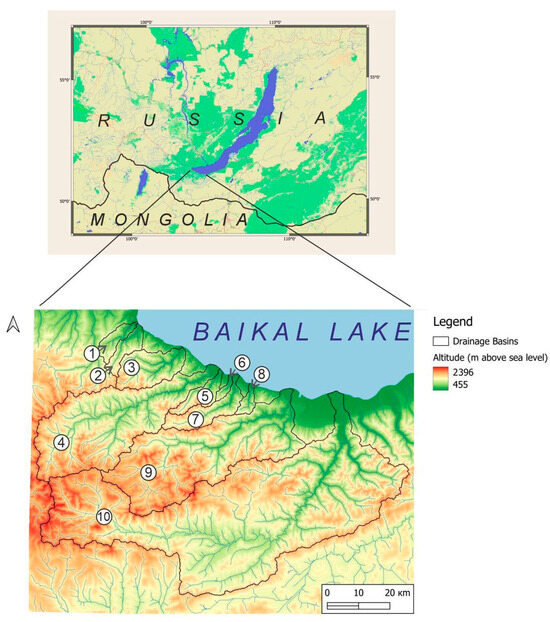
Figure 1.
Study area on the southern shore of Lake Baikal. Numerals stand for the names of river drainage basins: 1—Pokhabikha; 2—Slyudyanka; 3—Bezymyannaya; 4—Utulik; 5—Babkha; 6—Kharlakhta; 7—Solzan; 8—Bolshaya Osinovka; 9—Khara-Murin; 10—Snezhnaya.
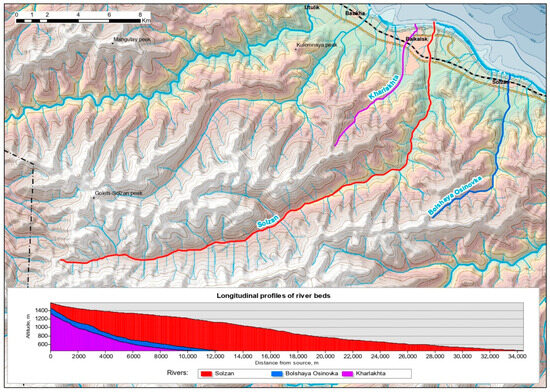
Figure 2.
Longitudinal profiles of riverbeds on the northern slope of the Khamar-Daban Range.
The Khamar-Daban northern slope is the steepest, and the rivers flowing down the slope into the lake generate the greatest hazard of destructive or even catastrophic floods and mudflows. The area underwent a number of large mudflow events in 1915, 1927, 1932, 1934, 1938, 1960, and 1962, and the most destructive one in 1971, when mudflows triggered by heavy July rainfalls formed on almost all waterways into southern Baikal and destroyed buildings and bridges on the Circum–Baikal Railway [7], damaged the Trans-Siberian railway, motor roads, and other infrastructure. The mudflow activity of the 1910s–1970s was followed by a prolonged lull during which the river basins accumulated large amounts of material as a potential source for future mudflows, most often associated with rainfall floods in the area [8].
The study area belongs to the craton-orogen transition along the shoulders of the Baikal rift and the Sayan-Baikal orogenic area [9]. The modern surface topography of the Baikal region was shaped during Cenozoic tectonic activity, which caused subsidence and uplift of blocks, with large elevation contrasts and oriented the major morphostructures in the northeastern direction [10].
The types of terrain in the area vary from high mountains with pre-Holocene glacial features to swampy lowlands. The areas of low mountains are composed of Archean–Proterozoic granitoids and rarely occurring Neogene basalts, while the plainland Baikal shore area, including the Kultuk–Slyudyanka (Pokhabikha and Slyudyanka rivers), Utulik–Solzan (Bezymyannaya, Utulik, Solzan, Babkha, Bolshaya Osinovka, and Kharlakhta rivers), and westernmost Tankhoi (Khara-Murin–Snezhnaya river section) plains, is occupied by Neogene–Quaternary sediments (Table 2).
Table 2.
Terrain types and surface processes on the northern slope of the Khamar-Daban Range and in the drainage basins.
The drainage basins are flanked by the Khamar-Daban Range in the south and extend from southwest to northeast. The surface area of the basins and the length of the main rivers generally increase from west to east according to the morphostructure of the Baikal Rift Zone. The basins of the Pokhabikha and Slyudyanka rivers are bounded by the N–S Komarinsky Ridge (1499 m asl maximum elevation) in the west and are separated from the Bezymyannaya catchment by the Stanovoy Range (Lysaya Mt., 1583 m asl) in the east and the Peak Chersky Massif (2090 m asl) in the southeast. The main massifs are the Mangutai (1856 m asl), Sosnovsky (844 m asl), and Bezymyanny (2086 m) Barren Mountains in the Bezymyannaya–Utulik divide; the Vershina Mt. and Margasan Mt. in the Utulik watershed further westward; and Tumbusun Duma Mt. (2256 m asl) in the south. The mountains of Kulemnaya, Golets Solzan, and an unnamed peak (2046 m asl) delineate the eastern watershed line.
The terrain of the region, with large elevation contrasts, is favorable for mudflow formation due to rapid rainwater runoff during floods and related high erosion rates. Rainfall floods and mudflows are most frequent in the warm season, from May to September. Storm floods can arise in the mountains at the highest daily precipitation [11,12,13].
The main river valleys of the area accommodate debris on the river bottoms, bank terraces, natural levees, and alluvial fans of lateral tributaries. The soft sediments are brought by landslides, earthflows [3,7], and other slope processes [2] and become washed out during flood events, thus increasing significantly the solid component of the runoff. Slope processes can be additionally triggered by high seismicity in the area [14,15,16,17], which increases their intensity [18,19] and induces mudflows [20].
Mudflows are especially destructive along the Slyudyanka, Bezymyannaya, Utulik, and Khara-Murin rivers, while the Pokhabikha River is less hazardous [21]. Mudflows from the upper reaches of rivers within the Utulik–Solzan plain emerge over wide flats, where they lose the bulk of transported material, and often turn into water flows when approaching the lake.
2.2. Methods
The flood onset is marked by the critical water level (Hcr) measurable at weather stations of the national Roshydromet network, at which water spills over the floodplain in the vicinity of the respective station to significantly inundate croplands and residential areas. We studied data series of daily water levels on the rivers of the area for the warm season (June to September) and selected the cases of >Hcr highs over the period from 2001 to 2020.
Precipitation was analyzed for all >Hcr flood events on a yearly, monthly, and daily basis: the warm season from May to September; one or two months before the flood events (as a characteristic of preliminary moistening of the catchment area); and the days of maximum precipitation, as well as daily precipitation accumulated before the flood.
The weather patterns and precipitation in the years of floods were considered dependent on atmospheric circulation in the Northern Hemisphere, classified according to the number of days with different elementary circulation mechanisms (ECMs) [22]. The assumed ECM types were as follows: Zonal circulation, no polar intrusions, 2 or 3 southern cyclone breaks (1–2); Disruption of zonal circulation, one polar intrusion, 1 to 3 southern cyclone breaks (3–7); Meridional northern circulation, 2 to 4 polar intrusions, 2 to 4 southern cyclone breaks (8–12); Meridional southern circulation, no polar intrusions, 2 to 4 southern cyclone breaks penetrating the polar region (13). Additionally, letters a, b, and c denote ECM subtypes, which differ in detail across the Northern Hemisphere but do not change the basic patterns; letters “w”, “s”, etc. (winter, summer, etc.) refer to seasonal differences affecting the properties of the ground surface. The types of weather associated with certain ECMs correlate with local moisture patterns. Meridional ECMs, especially ECMs 12a and 13s, cause the most hazardous weather for mudflows, as they trigger the breakthrough of southern cyclones producing the heaviest rainfall. Currently, the circulation processes that support mesolatitudinal air transport are increasing in total duration, which leads to higher precipitation, floods, and hazardous slope processes [23,24,25].
Maximum water and sediment discharge by rainfall floods was analyzed for six mudflow- and flood-hazardous rivers in the Slyudyanka district from records of the Snezhnaya–Vydrino, Khara-Murin–Murino, Utulik–Utulik, Bezymyannaya–Mangutai, Slyudyanka–Slyudyanka, and Pokhabikha–Slyudyanka hydrological stations (the station names here and below consist of the river (first) and town or village (second) names, which are the same in some cases) (Figure 3) over the period from 1966 to 2022.
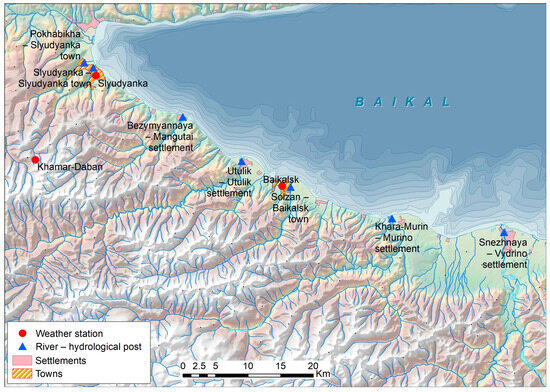
Figure 3.
Location of hydrological posts and weather stations in the area.
The data series were used to plot empirical probability curves, with different analytical approximation options: the type III Pearson curve with parameter estimation using the method of moments and the graph-analytical method [26], or the Vinogradov C3 functionally normal distribution curve and nonparametric approximation methods [27]. In this way, we calculated standard probability values of maximum flood discharge and plotted average quantiles of the respective probability curves for all methods. The amount of suspended sediment was then estimated for the years of high floods in which the probability of maximum water discharge was below 10%.
The geomorphological structure and terrain-forming slope processes within the selected drainage basins were studied using hydrological-morphological analysis, which is often applied to assess fluvial hazard [28,29], as well as several methods for describing slope processes [2,3,30,31], including the morphometry of landforms [32].
The hydrological and geological hazards were identified using data on the dynamic properties and space-time patterns of fluvial systems. In this study, it is assumed that medium and large rivers develop through-going (transit) systems of erosion channels since erosion in their catchments is mostly of fluvial origin, while other agents, including slope processes, serve as a background. On the contrary, non-fluvial and fluvial processes on small rivers either predominate or balance each other at different periods of time.
2.3. Data
The study is based on the records of hydrological and weather stations of the Roshydromet network (Figure 3). The records of daily water levels on six mudflow- and flood-hazardous rivers of the northern slope of the Khamar-Daban Range for the period of 2001 through 2020 were obtained from the Snezhnaya–Vydrino, Khara-Murin–Murino, Solzan–Baikalsk, Kharlakhta–Baikalsk, Slyudyanka–Slyudyanka, and Pokhabikha–Slyudyanka hydrological stations. The data series of the maximum rainfall discharge, suspended sediment discharge, and turbidity, as well as air circulation patterns, cover the 1966–2022 time range [33,34]. Precipitation maximums were identified from long-term Roshydromet data series of daily precipitation, which were used together with long-term data on yearly, monthly, and seasonal (May to September) precipitation [35]. Fluctuations in the atmospheric circulation of the Northern Hemisphere were analyzed from records of the 20th–early 21st centuries [36]. The integrated reanalysis of the data [37] allowed for constructing composite pressure maps for the ground surface, as well as the 500 and 700 mb geopotential heights [38].
3. Results
3.1. Hydroclimatic Prerequisites for Mudflow Formation
3.1.1. Rainfall Floods and Flood-Forming Precipitation
According to the data on daily water levels on the six mudflow- and flood-hazardous rivers of the northern slope of the Khamar-Daban Range (Figure 3) over the period from 2001 through 2020, the critical value for flood onset (Hcr) caused by rainfall was surpassed in 2001, 2005, and 2019 (Table 3, Figure 4 and Figure 5).
Table 3.
Large flash flood events recorded at the northern slope of the Khamar-Daban Range during warm seasons of 2001 through 2020, after [39].
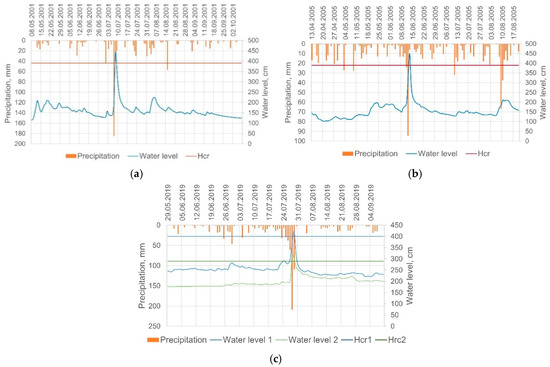
Figure 4.
Water levels and atmospheric precipitation in years of rainfall floods. (a) Flood of 2001: precipitation at the Khamar-Daban weather station, water level at the Snezhnaya–Vydrino hydrological station; (b) flood of 2005: precipitation at the Khamar-Daban weather station, water level at the Snezhnaya–Vydrino station; (c) flood of 2019: precipitation at the Khamar-Daban weather station, water level at the Solzan–Baikalsk (1) and Slyudyanka–Slyudyanka (2) stations; Hcr1 is for the Solzan–Baikalsk station, and Hcr2 is for the Slyudyanka–Slyudyanka station.
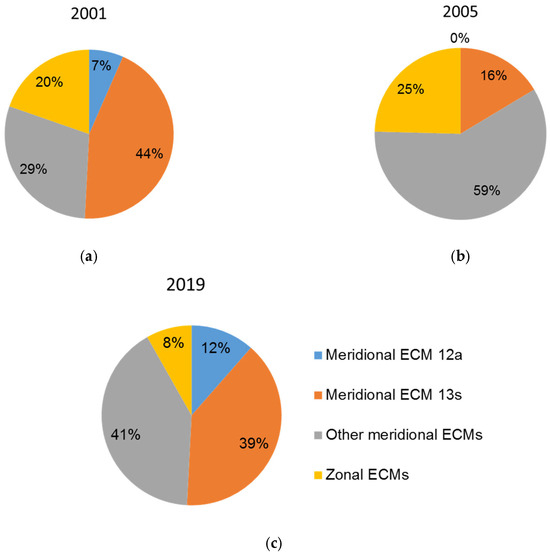
Figure 5.
Diagrams of ECM types 12a and 13s according to Dzerdzievsky’s classification [11] observed two months before the peak of floods in 2001 (a), 2005 (b), and 2019 (c).
The formation of rainfall floods and mudflows crucially depends on the conditions and spatial patterns of precipitation. The annual precipitation in the Khamar-Daban Range mostly falls in the summer months under predominant cyclonic conditions: precipitation from June to August accounts for 50 to 75% of the annual total. Note that June rainfalls occur while snow still remains in the mountains (June 7 is the average long-term date of snowmelt).
Abundant summer precipitation in the area is often associated with Mongolian cyclones. Stationary southern cyclones produce days-long rainfalls that cause river floods. Heavy rainfall, floods, mudflows, and landslides in Siberia commonly occur under ECM 12a and 13s patterns [22,24] (Figure 5).
ECM 12a is the most turbulent pattern in the Northern Hemisphere, with virtually no zonal transport, and ECM 13s allows southern cyclones to reach the Far East and the cyclones from the Mongolian branch of the polar front to enter Transbaikalia and East Siberia. As shown by data reanalysis, active cyclone generation extending from the ground surface to the mid-troposphere was observed during the floods of 2001 and 2005, and a low-level cyclone prevailed during the 2019 flood (Figure 6).
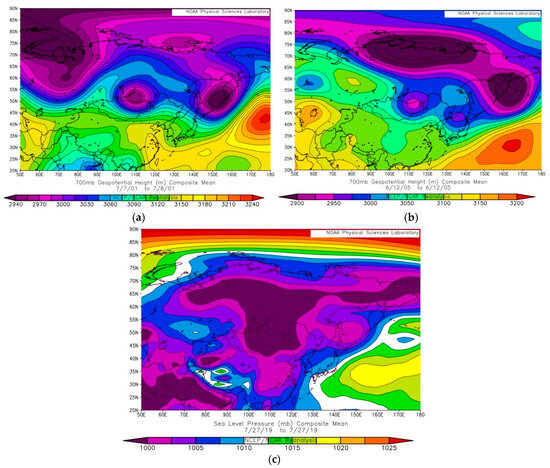
Figure 6.
700 mb geopotential height at 00 h UTC on 7 July 2001 (a) and 12 June 2005 (b), and the sea level pressure field at 00 h UTC on 27 July 2019 (c).
The moisture patterns of mountainous areas are additionally affected by local factors. Specifically, the average annual precipitation according to Roshydromet monitoring data for the 1962–2006 period was 775 mm at the Baikalsk weather station located in the foothills (478 m asl) but amounted to 1394 mm (1.8 times more) at the higher-elevation Khamar-Daban station (1442 m). The average long-term precipitation for the warm season (May to September) is 567 mm in Baikalsk, compared with 989 mm (1.7 times more) at the Khamar-Daban station. The maximum daily precipitation recorded during the catastrophic mudflow floods of 26 July 1971 (Figure 7) was 51 mm in Slyudyanka, 197 mm in Baikalsk, and 260 mm at the Khamar-Daban station (5.1 and 1.3 times more, respectively). The data from the Khamar-Daban station were selected for analysis as they cover significant portions of the drainage basins and are more representative than those from the Slyudyanka, Baikalsk, and other weather stations restricted to the narrow shore zone. The long-term averages were estimated over the 1936–2022 period. The historical daily maximums recorded at the Khamar-Daban station between 1936 and 2022 were 207.8 mm for June (20 June 1960) and 260 mm for July (26 July 1971).
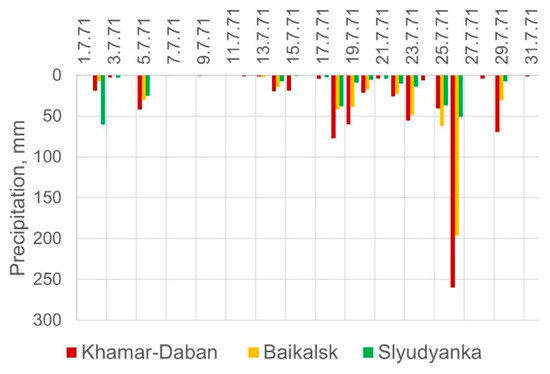
Figure 7.
Precipitation recorded at the Khamar-Daban, Baikalsk, and Slyudyanka weather stations during the largest mudflow and rainfall flood of July 1971.
For the three floods of 2001, 2005, and 2019 (Table 4), the annual and seasonal (May to September) precipitation values were about the long-term average, as were those for one and two months before the July 2001 and July 2019 floods, whereas the precipitation levels were, respectively, 1.5 and 2.3 times above the background in the months of these two floods. In the case of the June 2005 flood, monthly precipitation exceeded the average already in April and May before it reached the high June level. The reason is that the 2005 flood was fed by both rain and snow, which accumulated in abundance around the Khamar-Daban station and was melting at that time. Predominant atmospheric circulation from April to June 2005 was of different types [36], except ECM 12a, with brief interventions of ECM 13s (Figure 4b and Figure 5b).
Table 4.
Flood-forming precipitation in the years of floods, after [39].
Before the July 2001 flood, the area was under meridional circulation, predominantly ECM 13s; since the end of May, ECM 13s lasted 22 days in June, and ECM 13s was observed from June 24 till the flood peak. Heavy rainfall began on June 1 and continued almost uninterruptedly until the peak of the flood, with 291 mm of precipitation falling in 8 days. The second-highest daily precipitation maximum for the observation period was recorded during the event of July 2019, when meridional circulation prevailed in the Northern Hemisphere from May to July. ECMs 12a and 13s acted on approximately half of the days in the three months, including 13s on 12–15 July and 19–24 and 12a on 25–26 July. Heavy rainfall was almost continuous before the flood event, and the amount of precipitation reached 466 mm before the flood peak. Thus, the floods of July 2001 and July 2019 were of pluvial origin. Furthermore, the event of July 2019 was accompanied by mudflows on several rivers.
3.1.2. Maximum Water Discharge in Rainfall Floods
Maximum flood water discharge (Figure 8) was analyzed using records from six hydrological stations for the period from 1966 to 2022.
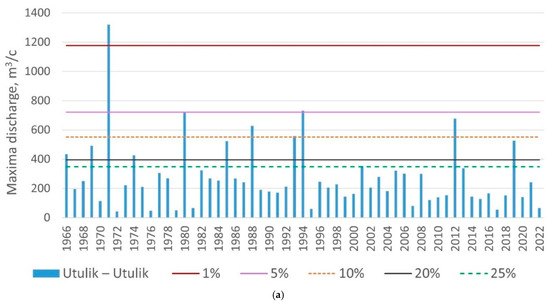
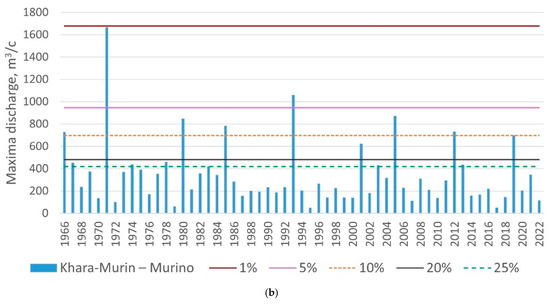
Figure 8.
Maximum flood water discharge for the period 1966–2022 and lines of its 1, 5, 10, 20, and 25% probability for data from the Utulik–Utulik (a) and Khara-Murin–Murino (b) hydrological stations.
The data were used to plot empirical probability curves (with different options of analytical approximation) for each data series, to calculate maximum flood discharge values of standard probability, and select years of high flood above the 1%, 5%, 10%, 20%, and 25% probability thresholds. The plots of Figure 8 are based on quantile values of the maximum flood flow distribution curves for these probabilities, averaged over all methods.
The maximum water discharge probability was the lowest for the observation period during the catastrophic event of July 1971, when mudflows triggered by stormy July rains swept over almost all waterways in the southwestern Baikal region and damaged motor and railroads. Buildings and bridges collapsed along the Circum–Baikal Railway, which stopped traffic for many days, and 20 km of track were destroyed on the Trans-Siberian Railway, which was out of service for seven days. Damage was also caused to several bridges and pavement of the Irkutsk–Ulan-Ude roadway, as well as a cable communication line [12]. The probability of maximum discharge of this flood on the rivers of the area was within 0.001–1.88%, as calculated by different methods (Figure 9).
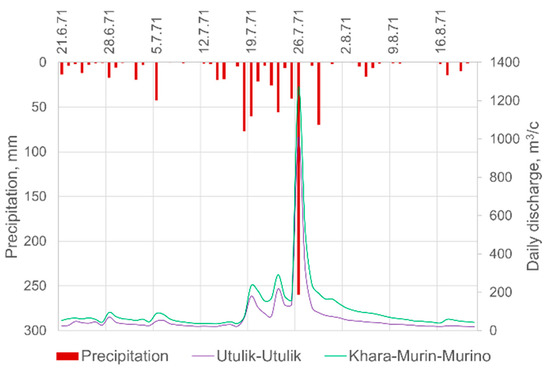
Figure 9.
Water discharge at Utulik–Utulik and Khara-Murin–Murino hydrological stations and precipitation at the Khamar-Daban weather station during the largest mudflow and rainfall flood event of 1971.
The riverbed morphology influences annual water level variations, as well as the volume of transported material, flow rates, and water discharge. Water level fluctuations during floods are prominent in narrow valley segments, in the absence of floodplains, but are poorly pronounced in the lower reaches of rivers with floodplain overflows. In accordance with the structure of the riverbeds, the water discharge increase in July 1971 was due to a higher water level and 3–4 times higher average flow depth and flow velocity, compared to the low-water values. At the same time, the increase in flow width was mostly limited to 1.4 times, except at the Slyudyanka–Slyudyanka station (4.6 times); the water level rise was smaller than it could have been with the given water discharge because the flow rate became 4–9 times faster (Table 5).
Table 5.
Hydrometric characteristics of riverbeds during the catastrophic mudflow flood of July 26, 1971, compared to low-water conditions.
3.1.3. Suspended Sediment Discharge
Suspended sediment discharge (Table 6) was analyzed for high-flood years with a <10% probability of maximum water discharge (Table 3).
Table 6.
Highest suspended sediment discharge in years of average and high water levels and floods for the 1966–2022 period *.
Average suspended sediment discharge values are around or below 0.5 kg/s. At <10% probability of maximum water discharge, the maximum suspended sediment discharge becomes orders of magnitude larger, from n1–n10 kg/s to n100–n1000 kg/s. The highest values were recorded in the summer months. The dates of maximum suspended sediment discharge and maximum turbidity coincide with those of maximum water discharge.
The suspended sediment discharge measured at the Slyudyanka–Slyudyanka hydrological station during the catastrophic mudflow of 26 July 1971 amounted to 650 kg/s, compared with 0.003 kg/s on 15 September of the same year, at low water [40]. The respective values of average flow turbidity were 4500 g/m3 at the peak of the event and 2.1 g/m3 during the low-water period. The highest turbidity recorded in July 1971 was 1200 g/m3 at the Khara-Murin–Murino hydrological station and 9100 g/m3 at the Slyudyanka–Slyudyanka station. The highest values of suspended sediment discharge, measured along with turbidity and water discharge during the event of July 1971, reached 1500 kg/s and 1300 kg/s at the Khara-Murin–Murino and Slyudyanka–Slyudyanka stations, respectively. Note that average monthly suspended sediment discharge at the two stations fluctuated, respectively, from 0.003 to 0.16 kg/s and from 0.001 to 0.013 kg/s.
3.2. Geomorphological Prerequisites for Mudflow Formation
The formation of the runoff solid component in the area has strong geomorphological controls, such as slope angle, elevation contrasts, and related terrain energy (Table 7), and the thickness of soft sediments subject to denudation and transport (slope processes in our case). In this study, only morphometric characteristics of the drainage basins and some of their derivatives (e.g., the erosion potential of the territory) are considered. The effect of topography on soil erosion was analyzed using the LS factors of slope length (L) and steepness (S), which were included in the Universal Soil Loss Equation (USLE) via a combined function. The calculations were performed with the System for Automated Geoscientific Analyses (SAGA) V 9.7.1. [41], providing an easy-to-use one-step tool for obtaining the LS factor of the USLE based on the Digital Elevation Model (DEM).
Table 7.
Morphometric parameters of drainage basins.
Another parameter, the topographic humidity index, which refers to local topography-dependent humidity, showed moderate fluctuations in all considered drainage basins (Table 7), i.e., the morphoclimatic characteristics of the basins share much similarity within the northern slope of the Khamar-Daban Range.
Terrain with elevation contrasts of 500 to 1600 m occupies the largest areas in the Bezymyannaya, Khara-Murin, Slyudyanka, and Utulik drainage basins, which also have the highest average LS factors.
The obtained estimates show that the area is geomorphically favorable for slope processes driven by gravity and water flows, which become active at increased overall humidity and provide motion of material directly into riverbeds.
The morphometric characteristics of the drainage basins vary significantly depending on their size. The small drainage basins of the Pokhabikha, Slyudyanka, Bezymyannaya, Kharlakhta, and Bolshaya Osinovka rivers (group 1) are located at the lower morphostructural level and are homogeneous in terms of geomorphology. They fall within the junction of the Baikal and Tunka rift basins [10], which has a complex terrain history, and differ in small surface area, short river lengths, and moderate erosion. Most of the slopes in the territory are steep or relatively steep, while the elevations are low to medium. Therefore, the terrain was formed mostly under gravity and water-gravity slope processes. The elevation contrasts are large over a great part of the Slyudyanka, Bezymyannaya, Solzan, and Kharlakhta drainage basins and over a smaller part of the Pokhabikha basin.
The Utulik and Khara-Murin drainage basins (group 2) are slightly larger than those of group 1 but are also dominated by areas of large elevation contrasts, steep to moderately steep slopes, and high LS factors. The drainage basins of this group are highly prone to hydrological hazard, including in the lower reaches of the rivers, where important infrastructure facilities are located.
The Snezhnaya River (group 3) has the largest catchment and is remarkable for the diversity of landforms and non-fluvial erosion patterns, which, combined with water flows, maintain voluminous transport of material. The average LS values are the lowest compared to the other basins, i.e., the contribution of slope processes to the fluvial terrain sculpturing is minor. However, mudflows and other geological hazards may be expected locally in the middle reaches of the main river and its tributaries, given the geomorphological heterogeneity of the territory. Further research is required in this respect, using more detailed analyses and sub-basin division of the basin area.
4. Discussion and Conclusions
The atmospheric circulation patterns that have predominated recently under the hydroclimatic conditions of the southern Baikal area maintain increased precipitation, with the ensuing rainfall flood and mudflow hazards, such as the events of July 2001 and 2019. The floods of 2001 and 2019 occurred under meridional atmospheric circulation and prolonged heavy rainfalls, whereas the flood of June 2005 formed mainly under zonal circulation with lower precipitation and was of mixed nival–pluvial origin.
Destructive and catastrophic floods and mudflows result from abundant summer precipitation and can transport significant amounts of boulder-pebble material through river valleys. All flood events we considered were preceded by continuous rains, which lasted from 8 to 17 days and provided preliminary moistening of the ground surface, with the highest daily precipitation (up to 200 mm) immediately before the flood peak.
The highly elevated part of the Khamar-Daban Range receives up to twice as much precipitation as the foothills. This difference remains overlooked when using data from weather stations located in the foothills. Therefore, it is important to set up a monitoring network for mountain catchments where flash floods and mudflows originate and develop, especially if the foothills below are densely populated.
Judging by the morphometric characteristics of the terrain, the geomorphological conditions in the Bezymyannaya, Slyudyanka, Khara-Murin, and Utulik drainage basins are favorable for mudflows and catastrophic floods, unlike those of the Snezhnaya, Pokhabikha, and Kharlakhta rivers, where the respective average parameter values are low. The difference is due, among other factors, to the size difference of the drainage basins (small surface area for the former and large area for the latter). On the other hand, the data from the Snezhnaya drainage basin are insufficient to predict potential hydrological and geomorphological hazards. The conditions in the Pokhabikha drainage basin are the least favorable for mudflows and flash floods.
The mudflow-active basins are prone to erosion hazard, which was studied using estimates of erosion potential (Figure 10) based on elevation contrasts in the lateral and vertical dimensions.
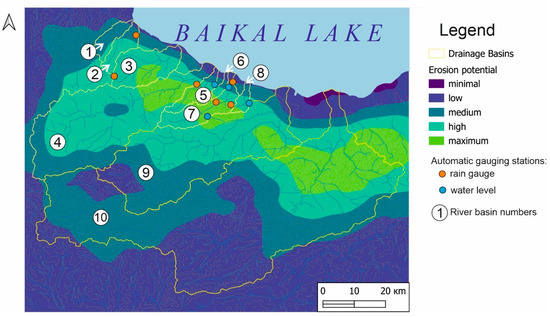
Figure 10.
Map of erosion potential and proposed distribution of monitoring stations. Drainage basin numbers: 1–Pokhabikha; 2—Slyudyanka; 3—Bezymyannaya; 4—Utulik; 5—Babkha; 6—Kharlakhta; 7—Solzan; 8—Bol. Osinovka; 9—Khara-Murin; 10—Snezhnaya.
The elevation contrasts in the vertical dimension were estimated within cells and those in the lateral dimension were calculated as the density of contour lines per unit area. This approach allows considering both slope steepness and topography determined by surface and sub-surface factors.
Erosion potential is the lowest in coastal plains and low on flat and gently sloping watershed surfaces, whereas high values are typical of steep and rugged surfaces. The highest erosion potential occupies significant areas in the Bezymyannaya, Utulik, Babkha, Solzan, Kharlakhta, Bolshaya Osinovka, Khara-Murin, and Snezhnaya drainage basins, especially in the Solzan, Babkha, and Utulik basins, where the erosion potential is high on both right and left riverbanks. The areas of high erosion potential are located in the middle reaches of most rivers but in the upper reaches of small rivers (Kharlakhta, Bolshaya Osinovka). Meanwhile, the erosion potential of flat coastal areas in the river lower reaches can increase significantly under rapid mudflows, which pose risks to residential buildings, infrastructure facilities, and potentially endangered man-made structures (sludge ponds).
During mudflow floods, <10% probability maximum water discharge increases primarily due to 4–9 times higher flow velocities in steep narrow riverbeds, but the corresponding increase in water level and flow width is much smaller. High flow velocities provide high transport capacity of the flow and create prerequisites for mudflows, such as the most destructive event of July 1971. Note that all studied rivers demonstrated the lowest probability of maximum water discharge over the entire observation period: 0.001–1.9%.
The maximum suspended sediment discharge and turbidity in most cases correlated with the maximum water discharge and increased at <10% probability of the latter.
Thus, mitigation of hydrological and geological hazards requires comprehensive studies of all geological, geomorphological, and morphodynamic factors maintaining recurrent mudflow activity. The obtained hydroclimatic and geomorphological data allow us to propose a layout of a monitoring network (Figure 10), proceeding from the population density of the territory, the location of potentially hazardous facilities, and the availability of cellular network coverage. This can be a network of automatic precipitation and water level gauges with online data transmission via a GSM (cellular) channel. The period of measurements and data transmission (minutes to seconds) is set depending on the actual synoptic and hydrological conditions. The stations can be equipped with emergency systems that warn of approaching floods and mudflows, with regard to the amount of precipitation and the travel time of flood waves. The details of instruments and their emplacement can be updated further based on calculated velocity, direction, and arrival time of flows to a certain distance.
Author Contributions
Conceptualization and methodology, N.V.K. and M.Y.O.; formal analysis and data curation, A.A.R. and A.A.Y.; investigation of hydroclimatic prerequisites for mudflow formation, N.V.K.; investigation of geomorphological prerequisites for mudflow formation, M.Y.O., A.A.R., and A.A.Y.; writing—original draft preparation, all authors; writing—review and editing, all authors. All authors have read and agreed to the published version of the manuscript.
Funding
This research was funded by the Russian Science Foundation, grant number 24-27-20059.
Data Availability Statement
Data can be provided upon reasonable request.
Conflicts of Interest
The authors declare no conflicts of interest.
References
- Budz, M.D. Conditions of mudflow formation in the Baikal region. In Landslides, Mudflows, and Thermokarst in East Siberia: Engineering-Geological Implications; Nauka: Moscow, Russia, 1969; pp. 60–95. (In Russian) [Google Scholar]
- Agafonov, B.P. Exolithodynamics of the Baikal Rift Zone; Nauka: Novosibirsk, Russia, 1990; 176p. (In Russian) [Google Scholar]
- Makarov, S.A. Mudflows of the Baikal Region; Institute of Geography: Irkutsk, Russia, 2012; 111p. [Google Scholar]
- Laperdin, V.K.; Rybchenko, A.A. Estimated parameters of mudflow-forming components of the environment of the south of Lake Baikal. Ustoichivoe Razvit. Grnykh Territ. 2016, 8, 52–58. [Google Scholar] [CrossRef]
- Zhuang, J.; Cui, P.; Hu, K.; Chen, X.; Ge, Y. Characteristics of earthquake-triggered landslides and post-earthquake debris flows in Beichuan County. J. Mt. Sci. 2010, 7, 246–254. [Google Scholar] [CrossRef]
- Laperdin, V.K.; Levi, K.G.; Imaev, V.S.; Molochny, V.G. Geological Hazards in the Southwestern Baikal Region; Institute of the Earth’s Crust: Irkutsk, Russia, 2016; 199p. (In Russian) [Google Scholar]
- Laperdin, V.K.; Demiyanovich, N.I.; Trzhtsinsky, Y.B. Catastrophic summer floods in 1971 and slope processes. In Hydrogeology and Petrochemistry of East Siberia: Methods of Geological Research; Institute of the Earth’s Crust: Irkutsk, Russia, 1972; pp. 19–23. (In Russian) [Google Scholar]
- Kichigina, N. Geographical analysis of river flood hazard in Siberia. Int. J. River Basin Manag. 2020, 18, 255–264. [Google Scholar] [CrossRef]
- Suvorov, E.G.; Antipov, A.N.; Semenov, Y.M.; Bashalkhanova, L.B.; Vyrkin, V.B.; Gagarinova, O.V.; Dudenko, S.V.; Zabortseva, T.I.; Kirichenko, A.V.; Lysanova, G.I. Ecologically Oriented Land Use Planning in the Baikal Region. Slyudyanka District; Institute of Geography: Irkutsk, Russia, 2002; 142p. (In Russian) [Google Scholar]
- Mats, V.D. (Ed.) The Cenozoic History of the Baikal Rift Basin; GEO: Novosibirsk, Russia, 2001; 251p. [Google Scholar]
- Vorobyev, V.V.; Antipov, A.N.; Khabarov, V.F. (Eds.) Atlas of Irkutsk Oblast: Ecological Conditions of Development; Institute of Geography: Irkutsk, Russia, 2004; 90p. (In Russian) [Google Scholar]
- The State of Lake Baikal and Measures for its Protection in 2010; A State Report; Ministry of Natural Resources and Ecology. Rosgeolfond: Irkutsk, Russia, 2012; 395p. (In Russian)
- Makarov, S.; Cherkashina, A.; Atutova, Z.; Bardash, A.; Voropai, N.; Kichigina, N.; Mutin, B.; Osipova, O.; Ukhova, N. Debris flows of the Tunkinsky Goltsy Mountains (Tunkinsky District, Republic of Buryatia in Eastern Siberia). Int. J. Geohazards Environ. 2016, 2, 166–179. [Google Scholar] [CrossRef][Green Version]
- Solonenko, V.P. Mudflow activity in Pleistocene areas of catastrophic earthquakes. Bull. MOIP Ser. Geol. 1963, 2, 133–140. [Google Scholar][Green Version]
- Khromovskikh, V.S. Seismogeology of the Southern Baikal Region; Nauka: Moscow, Russia, 1965; 122p. (In Russian) [Google Scholar][Green Version]
- Miroshnichenko, A.I.; Levi, K.G.; Sankov, V.A.; Lukhnev, A.V.; Lukhneva, O.F. Statistical analysis of geological and geophysical parameters of the Mongolian-Baikal region. Phys. Mesomech. 2023, 26, 581–592. [Google Scholar] [CrossRef]
- Rebetsky, Y.L.; Dobrynina, A.A.; Sankov, V.A. Tectonophysical zoning of active faults of the Baikal rift system. Geodyn. Tectonophys. 2024, 15, 0775. [Google Scholar] [CrossRef]
- Ivanovsky, L.N. The Anthropogene history of valleys in the southern coast of Lake Baikal. In History of River Valleys and Land Reclamation Issues. Siberia and the Far East; Nauka: Novosibirsk, Russia, 1979; pp. 55–62. [Google Scholar]
- Laperdin, V.K.; Trzhtsinsky, Y.B. Seismotectonics of the Baikal rift zone as a basis for predicting surface geological processes. In Geological Changes and their Prediction; Nauka: Novosibirsk, Russia, 1985; pp. 49–59. (In Russian) [Google Scholar]
- Galkin, V.I. Mudflows debris transport into Lake Baikal. In Bottom Sediments of Lake Baikal; Nauka: Moscow, Russia, 1981; 192p. (In Russian) [Google Scholar]
- Litvin, V.M. Regional assessment of the intensity of surface geological processes in southern East Siberia. Ing. Geol. 1991, 6, 72–81. [Google Scholar]
- Dzerdzeevsky, B.L. Climatic epochs in the twentieth century and some comments on the analysis of past climates. Quat. Geol. Clim. 1969, 16, 49–60. [Google Scholar]
- Ormanova, G.; Karaca, F.; Kononova, N. Analysis of the impacts of atmospheric circulation patterns on the regional air quality over the geographical center of the Eurasian Continent. Atmos. Res. 2020, 237, 104858. [Google Scholar] [CrossRef]
- Kononova, N.K.; Lupo, A.R. Changes in the dynamics of the Northern Hemisphere atmospheric circulation and the relationship to surface temperature in the 20th and 21st centuries. Atmosphere 2020, 11, 255. [Google Scholar] [CrossRef]
- Malygina, N.; Papina, T.; Kononova, N.; Barlyaeva, T. Influence of atmospheric circulation on precipitation in Altai Mountains. J. Mt. Sci. 2017, 14, 46–59. [Google Scholar] [CrossRef]
- Elderton, S.W.P.; Johnson, N.L. Systems of Frequency Curves; Cambridge University Press: Cambridge, UK, 1969. [Google Scholar]
- Vinogradov, Y.B. Mathematical Modeling of Runoff Formation Processes: An Experience of Critical Analysis; Gidrometeoizdat: Leningrad, Russia, 1988; 312p. (In Russian) [Google Scholar]
- Chalov, R.S. Riverbed Science: Theory, Geography, Practice. In Volume 3: Anthropogenic Impacts, Hazards and Management of Riverbed Processes; KRASAND: Moscow, Russia, 2009; 640p. (In Russian) [Google Scholar]
- Baggio, T.; Martini, M.; Bettella, F.; D’Agostino, V. Debris flow and debris flood hazard assessment in mountain catchments. Catena 2024, 245, 108338. [Google Scholar] [CrossRef]
- Vyrkin, V.B. Formation of Modern Surface Topography in Baikal-Type Depressions; Institute of Geography: Irkutsk, Russia, 1998; 175p. (In Russian) [Google Scholar]
- Wells, S.G.; Harvey, A.M. Sedimentologic and geomorphic variations in storm-generated alluvial fans, Howgill Fells, northwest England. Geol. Soc. Am. Bull. 1987, 98, 182–198. [Google Scholar] [CrossRef]
- Bazilova, V.O.; de Haas, T.; Immerzeel, W.W. Controls of morphometric and climatic catchment characteristics on debris flow and flood hazard on alluvial fans in High Mountain Asia: A machine learning approach. J. Geophys. Res. Earth Surf. 2025, 130, e2024JF008029. [Google Scholar] [CrossRef]
- Information System on Water Resources and Water Management of River Basins of Russia. GIS Portal of the Center of Register and Cadaster. Available online: http://gis.vodinfo.ru (accessed on 11 September 2024).
- Automated Information System for State Monitoring of Water Bodies (AIS GMVO). Available online: https://gmvo.skniivh.ru (accessed on 29 March 2024).
- All-Russian Research Institute of Hydrometeorological Information—World Data Center (VNIIGMI-MCD. Available online: http://meteo.ru/data (accessed on 1 September 2024).
- Fluctuations in the Atmospheric Circulation of the Northern Hemisphere in the 20th and Early 21st Centuries. Available online: https://atmospheric-circulation.ru (accessed on 1 September 2024).
- Kalnay, E.; Kanamitsu, M.; Kistler, R.; Collins, W.; Deaven, D.; Gandin, L.; Iredell, M.; Saha, S.; White, G.; Woollen, J.; et al. The NCEP/NCAR 40-Year Reanalysis Project. Bull. Am. Meteorol. Soc. 1996, 77, 437–471. [Google Scholar] [CrossRef]
- Daily Mean Composites. Physical Sciences Laboratory. Available online: https://psl.noaa.gov/data/composites/day/ (accessed on 29 March 2025).
- Kichigina, N.V.; Rybchenko, A.A.; Yuryev, A.A. Hydroclimatic features of mud flood formation in the Slyudyansky District of Irkutsk Oblast. Geogr. Nat. Resour. 2025, 46, 168–175. [Google Scholar] [CrossRef]
- Hydrological Yearbook; Kuptsova, M.A., Ed.; Irkutsk Hydrometeorological Service: Irkutsk, Russia, 1971; Volume 7, p. 367. [Google Scholar]
- Conrad, O.; Bechtel, B.; Bock, M.; Dietrich, H.; Fischer, E.; Gerlitz, L.; Wehberg, J.; Wichmann, V.; Böhner, J. System for Automated Geoscientific Analyses (SAGA) v. 2.1.4. Geosci. Model Dev. 2015, 8, 1991–2007. [Google Scholar] [CrossRef]
Disclaimer/Publisher’s Note: The statements, opinions and data contained in all publications are solely those of the individual author(s) and contributor(s) and not of MDPI and/or the editor(s). MDPI and/or the editor(s) disclaim responsibility for any injury to people or property resulting from any ideas, methods, instructions or products referred to in the content. |
© 2025 by the authors. Licensee MDPI, Basel, Switzerland. This article is an open access article distributed under the terms and conditions of the Creative Commons Attribution (CC BY) license (https://creativecommons.org/licenses/by/4.0/).