Abstract
Heat and power cogeneration plants based on fuel cells are interesting systems for energy- conversion at low environmental impact. Various fuel cells have been proposed, of which proton-exchange membrane fuel cells (PEMFC) and solid oxide fuel cells (SOFC) are the most frequently used. However, experimental testing rigs are expensive, and the development of commercial systems is time consuming if based on fully experimental activities. Furthermore, tight control of the operation of fuel cells is compulsory to avoid damage, and such control must be based on accurate models, able to predict cell behaviour and prevent stresses and shutdown. Additionally, when used for mobile applications, intrinsically dynamic operation is needed. Some selected examples of steady-state, dynamic and fluid-dynamic modelling of different types of fuel cells are here proposed, mainly dealing with PEMFC and SOFC types. The general ideas behind the thermodynamic, kinetic and transport description are discussed, with some examples of models derived for single cells, stacks and integrated power cogeneration units. This review can be considered an introductory picture of the modelling methods for these devices, to underline the different approaches and the key aspects to be taken into account. Examples of different scales and multi-scale modelling are also provided.
1. Introduction
Fuel cells (FCs) are electrochemical devices that allow direct chemical-to-electric energy transformation with high efficiency (up to ca. 60%, upgraded to ca. 85% if thermal energy can be recovered). In comparison, internal combustion engines are based on more conversion steps (chemical–thermal–mechanical–electrical) and thus are far less efficient.
Different types of FCs are available, classified according to the electrolyte: alkaline (A), proton exchange membrane (PEM), phosphoric acid (PA), molten carbonate (MC) and solid oxide (SO). The operating temperature is strictly related to the nature of the electrolyte, and in turn affects the type of electrocatalyst allowed and the possible criticisms in their use [1]. For instance, in SOFC the electrolyte allows the transport of oxygen ions through the oxygen vacancies of the oxide. Such ionic mobility is significant at high temperature (ca. 800 °C), at which kinetics is very fast and allows relatively inexpensive catalysts, since their activity can be relatively small. This temperature range also allows the direct internal reforming of organic substrates, making superfluous the addition of a fuel processor to produce H2 as fuel for the FC. Conversely, a traditional PEMFC works with a membrane (e.g., based on Nafion®) that transports protons. It must operate in humid conditions, and this limits the temperature of use to a maximum of 80 °C (except for the high temperature formulations). Such a low temperature also implies the use of a very active catalyst, typically based on Pt, since thermal activation of the surface reactions is limited. As a consequence of the low temperature of operation and of the use of a noble metal catalyst, the tolerance of PEMFCs to sulphur and CO is very poor. This imposes a careful purification of the H2 feed. Indeed, CO adsorbs at low temperature over Pt, so that the concentration of CO admissible in the feed is lower than 20 ppmv. Operation at higher temperature allows much higher CO concentration, even allowing the avoidance of significant purification of the feed, because at higher temperature the adsorption is almost insignificant. Alternative PEMFC designs operate at higher temperature through different membranes, such as those using polybenzimidazole (PBI) as electrolyte, which can stand a 200 °C maximum temperature, and thus, some percentage of CO concentration is allowed in the feed.
Due to the features of the various FCs, the preferred use is also different. The high efficiency, fast start-up, long life (ca. 5000 h) and high-power density (0.3–0.8 W/cm2) make PEMFC preferable for mobility applications, whereas high-temperature FCs are best fitted for stationary applications. The main features and effects of operating parameters have been reviewed recently [2]. Examples of the application of PEMFCs in vehicles are available from different suppliers, e.g., Toyota Mirai and Chevrolet Colorado ZH2. The size of a PEMFC system is typically reported to be up to 250 kW, where less than 10 kW are generally required for single houses, and ca. 50 kW is required to power small buildings.
As for stationary or large-scale applications, FCs may be used as stand-alone devices or connected to the grid. This option is somehow more complex, since the FC supplies DC, which must be converted to AC and conditioned to the voltage of the grid. Furthermore, sufficient stability of the cell should be ensured for grid connection. The development of simulation tools and models to predict the transient and steady state behaviour of the cell is a valuable contribution to predicting the safe operating modes. Fault prediction is one of the major issues in improving system reliability, considering permanent faults (e.g., due to membrane deterioration, poisoning, leakage and cell aging), transient faults (caused by flooding or drying) and external issues attributed to failures of the cooling system, of the feed supply, etc.. Furthermore, some cells, such as PEMFC and SOFC, are particularly sensitive to operating conditions [3]. Modelling offers a method to improve the control, optimisation and reliability of these FCs.
In addition, models to describe the poisoning rate of CO and the consequent voltage losses and regeneration conditions are useful for performance monitoring and correction [4].
The phenomena underpinning FC operation and connection with an upstream fuel processor or a downstream user occur on very different time and length scales, requiring proper modelling tools to achieve the desired information. Careful validation against the basic kinetic, thermodynamic and electrochemical principles, as well as against experimental data, is compulsory, but the choice of the proper modelling methods is also fundamental. A very detailed review made a comprehensive description of the available equations to compute transport phenomena, electrochemical thermodynamics and kinetics and cell performance [5]. The scheme of the interconnections between these modelling activities and the different time and length scales of each of them are sketched in Figure 1 and Figure 2.
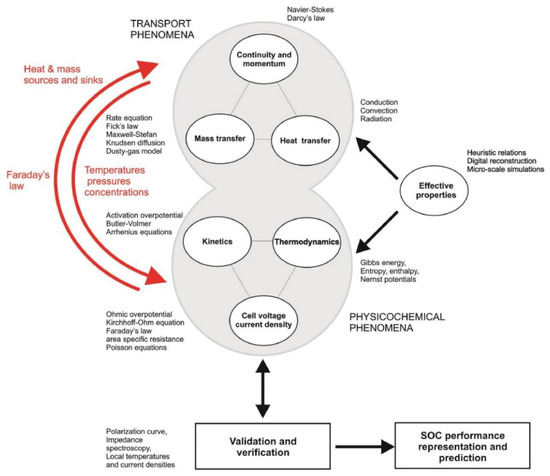
Figure 1.
Modelling items in SOFCs. Reproduced from [5] under the Creative Commons Licence.
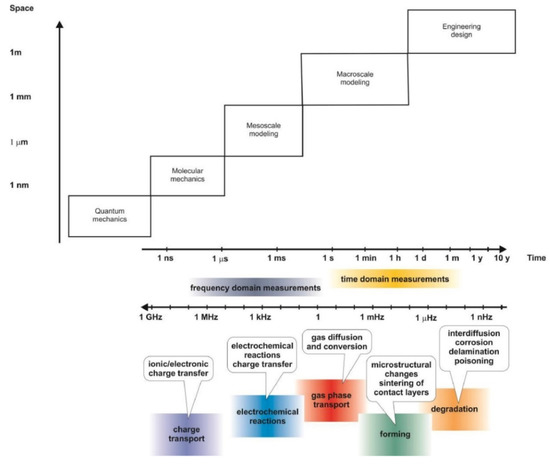
Figure 2.
Time, frequency and length scales for the phenomena underpinning SOFC modelling.
It should be stated that two diversified approaches may be used in modelling FCs. Macroscale models are based on the mass and energy balances or on computational fluid dynamics (CFD) to describe the performance of the cell on a macroscopic viewpoint. Simplified electrochemistry and low detail are used, and the goal is to have a picture of the behaviour of cells or full stacks, often including the preceding fuel processor, if present. Microscale models, instead, go much more into the detail of single aspects or specific elements of the system, e.g., mass and charge transport within one electrode or within the two-electrodes/electrolyte assembly. Solutions of partial differential equations or user-developed models are often used, with much higher accuracy of the representation, but with larger computational cost and tighter viewpoint. Multiscale models are sometimes proposed to join the two approaches [6].
In this work, recent modelling and simulation papers are reviewed to offer an up-to-date panorama of the opportunities and strategies available for FC modelling. Examples are discussed, from microscopic phenomena, such as the retrieval of transport parameters and kinetics, to the models for sizing and rating single cells, stacks and integrated power systems, including fuel processors and connection to the grid. This addresses the modelling issues through different scales. In addition, some examples of multiscale modelling re added as an attempt to integrate the different phenomena at various lengths and times. DFT modelling of electrodes is covered by other papers and is not the domain of this work [7]. The main features of the models are here presented and discussed only, leaving the interested reader to the original reference for a detailed description and expansion. This review focuses on the two most advanced types of FCs, namely SOFCs and PEMFCs, due to their wider use and their interesting application in either stationary or mobile power generation.
2. Kinetics, Thermodynamics and Transport Phenomena
In order to build complex models to interpret or predict the performance of a stack, it is necessary to focus on a reliable description of the underlying phenomena, i.e., the thermodynamics, kinetics and transport phenomena. Examples where the reader can retrieve approaches and data are reported in the following.
As for thermodynamics, an example of modelling of SOFC is reported in [8], considering internal reforming of methane and shift reaction. The equilibrium constants parametrised with temperature are reported for both reactions. A mathematical model was also built to evaluate the thermodynamic performance of the SOFC coupled with a thermoelectric generator and an absorption heat pump to recover the waste heat of SOFC exhaust gas [8].
Reaction rates can be modelled through the Butler Volmer equation:
where α is the charge transfer coefficient, e0 the elementary charge, Z the number of electrons transferred in the reactions, V the potential, kB the Boltzmann constant and T the temperature. The direct application in this form adds problems for the parametrisation of the dependence between current density and voltage, so that simplified equations are often used, such as the Tafel expression, which neglects the contribution of the reverse reaction step:
This approximation is appropriate for operating points at high current density, but further corrections are needed in the opposite case. Computationally fast electrochemical models are useful to predict FC behaviour and provide the control logic. A 0-D thermodynamically consistent electrochemical model for PEMFC has been developed, including the transport of gaseous species along the channel and through gas diffusion layer (GDL) [9]. An optimal set of calibration parameters has been also retrieved on a physical consistent basis. Very good extrapolation capabilities for operation points outside the calibrated parameters space has been also demonstrated.
Gas–liquid mass transfer in the porous layers or in the current collectors has been modelled in the case of a PEMFC [10]. Liquid water, vapour, and non-condensable gases in the pores were modelled to assess the best operating conditions and criticisms. Furthermore, mathematical modelling of a composite continuum-network formulation has been developed to describe species diffusion and convection in gas diffusion layers in PEMFC. This helps the fluid dynamic study of the system developing a control volume mesh to monitor anisotropic effective transport properties as diffusivity and permeability [11].
A single-anode SOFC was tested to retrieve the characteristic curves to build a 2D steady-state simulation code in Fortran. This was based on a robust electrochemical kinetic model with semi-empirical approach, where the parameters derived from data fitting were used in physically derived equations [12]. To size and rate FCs, reliable kinetic models are needed, but they are multivariable devices. Simulation involves nonlinear parameter estimation issues, often leading to multiple local minima, and so imposing the choice of robust optimisation algorithms [13,14].
A 2D micro-/macroscale model has been instead proposed for an intermediate temperature SOFC, including mass-transfer quantification and flow-pattern profiles in the channels. A counter-flow assembly demonstrated better performance with respect to co-flow configuration, but the latter led to more uniform current density and temperature distribution. The limiting overpotentials were also clarified in the model, depending on current density ranges [15,16].
3. Fuel cell and Stacks
A residential power generator (60 kW) based on a PEMFC stack was designed to operate at 75 °C, 100% humidity (regulated through careful water management) and 3 bar pressure [17]. Additionally, the model of a PEMFC was developed in MATLAB Simulink to assess the electric current and voltage under steady-state conditions. The electric current was determined by the intersection of the polarisation curve and used as input to simulate the cell behaviour. Experimental validation was carried out considering an integrated system including a 500 W PEMFC, a 12 V-12 A battery, a super-capacitor to manage peak loads and a 48 V DC-DC boost converter. The excursion between the model and experimental data ranged from 2% to 6%, as a function of the load resistance, with a maximum efficiency of 48% [18].
The behaviour of a PEMFC stack was investigated considering stability and efficiency under different conditions, to optimise the operating points during connection to the grid [19]. The equivalent circuit of the simulated PEMFC is reported in Figure 3. V0C is the open circuit voltage, Td is the response time, N the number of cells, Ifc and Vfc the current and voltage of the cell and IE the exchange current.
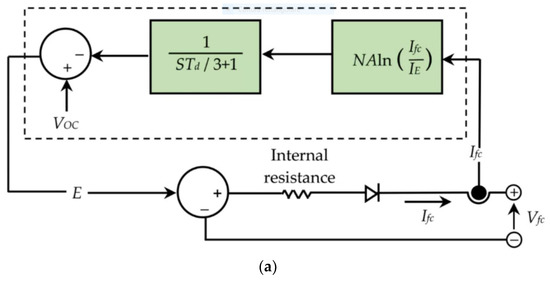
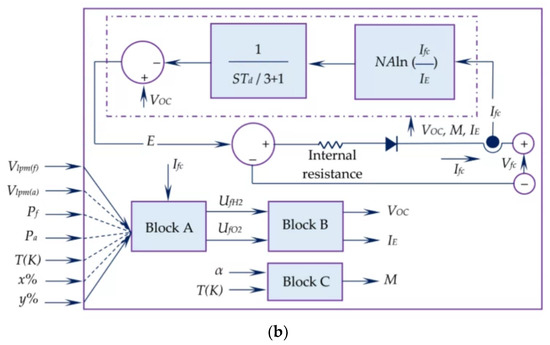
Figure 3.
Equivalent circuit of the simulated PEMFC, (a) simplified, (b) detailed. Reproduced from [19] under the Creative Commons Licence.
The detailed mathematical model is as follows [19]:
Block A in the detailed scheme reported in Figure 3 calculates the conversion (U) of hydrogen and oxygen, based on the volumetric flow rates (V), composition (x%, y%), pressure of both gases (P) and temperature (T), assuming ideal gas behaviour.
The partial pressure of the different species and Nernst voltage are expressed as:
Block B calculates V0C and IE and block C measures M (Tafel slope). α (charge transfer coefficient), ΔG (activation barrier) and Kc (voltage constant) depend on the polarisation curve at the rated operating conditions and on the variation of the gas pressures at varying temperatures.
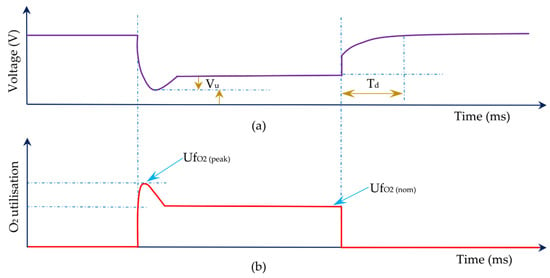
Figure 4.
Profiles of voltage (a) and O2 utilisation (b) vs. time. Reproduced from [19] under the Creative Commons Licence.
Overall, the scheme of the FC stack, including 45 cells, and the details of the block for connection to the grid are exemplified in Figure 5 [19].
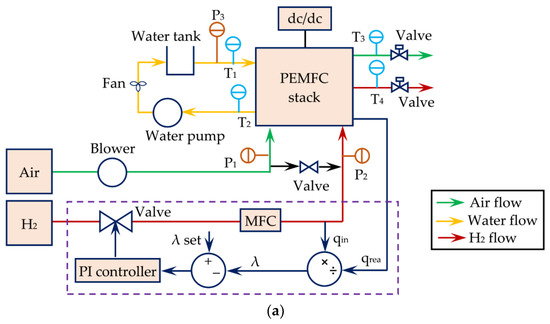
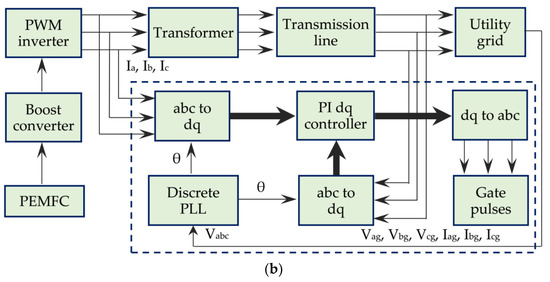
Figure 5.
(a) PEMFC scheme and (b) blocks for connection to the grid. Reproduced from [19] under the Creative Commons Licence.
The simulation showed that variable pressure of air did not significantly affect fuel usage, but strongly affected the efficiency. Critical pressures were determined to ensure stable operation at 0.8 bar for air and 1.4 for the fuel. The latter parameter affected both fuel consumption and efficiency [19].
The performance of a PEMFC depends on many structural and working parameters (flowrates, pressure and relative humidity, membrane hydration, T and P of the cell, etc.), so that the development of robust models to optimise its operating point saves precious time during the set-up of the device [14,20,21]. Nevertheless, the complexity of the governing equations and the multiple dependence on so many variables make the modelling very difficult.
As for most applications, models can be classified as empirical, semi-empirical and mechanistic, with a growing degree of complexity, but also of accuracy/robustness in the representation of the phenomena. In the present case purely empirical models are very weak, while mechanistic models are usually too complex and computationally expensive, due to the high number of factors and the mathematic nature of the problem, which is algebraic–differential [14]. Overall, semi-empirical models may be a reasonable compromise, with regression of some unknown quantities and inclusion/solution of the fundamental equations. Among these, the zero-dimensional steady-state models, such as the Generalised Steady State Electrochemical Model (GSSEM), have been most often employed due to their relative simplicity and versatility [22]. However, the need to retrieve some of the parameters brings about an additional problem: the selection of the optimisation algorithm. Usually, the characteristic I-V curve of the cell is fitted through the model to accomplish the non-linear regression of the missing parameters. Therefore, the typical objective function is:
The calculated cell potential includes all the hypotheses and formulations of the model proposed and the unknown parameters to be regressed. The search algorithms applied to FCs are different, e.g., genetic algorithm [23], artificial neural network [24], artificial bee colony [25], harmony search [26], whale optimisation algorithm [27] and some hybrid formulations. Often, the physical meaning of the retrieved parameters is not demonstrated when the optimisation search algorithm is insufficiently robust [14]. Typically, they fail when describing the electrochemical phenomena or evaluating cell resistance and reversible voltage, or again when computing the concentration losses and estimating the effects of the operating parameters.
Some of the features and criticisms of GSSEM models are discussed in the following. Full details can be found in the references [14,22].
The cell voltage is calculated as:
where ENernst is the thermodynamic potential, while the η terms represent the losses due to activation, ohmic and concentration effects, and T(K) is the cell temperature. A scheme of the polarisation curve of a PEMFC is exemplified in Figure 6.
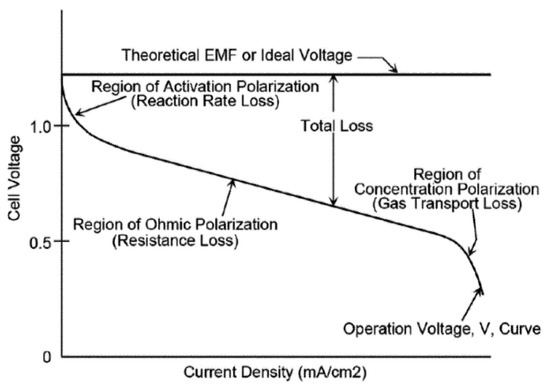
Figure 6.
Polarisation curve of a PEMFC. Reproduced from [20] under the Creative Commons Licence.
ξi are parameters that can be derived, in principle, from thermodynamic and kinetic mechanistic equations, and have a precise physical meaning.
For instance,
with R the gas constant (8.3143 J/mol K), F the Faraday constant (96,487 As/mol), ne the number of electrons per mole and αc the charge transfer coefficient of the cathode, which can be either calculated from the values of ξ3 or ξ4, as regressed from the model. A consistent set of parameters would return similar values when calculating αc from both parameters, which does not happen in most cases, as well examined in [14,20].
where pH2 and pO2 are the effective partial pressures of the two species, Pi are the inlet pressures at the anode and cathode, Pwsat is the vapour pressures, RHi are the relative humidity of the anode and cathode side and i is the current density of the cell.
The voltage drops are differently computed.
The activation term is due to the slow kinetics, which causes overpotentials and lower current densities. The current density can be calculated through the Butler–Volmer equation in the following form (i0 is the exchange current density, i.e., the rate of the reactions at equilibrium when the net current is nil, nF the charge transferred, αi the charge transfer coefficient for both reactions and E/Er the actual and equilibrium potentials, kB and h the Boltzmann and Planck constants, Ci the surface concentration of the reacting compounds and ΔG the Gibbs free energy):
The current densities at the cathode and anode can be calculated as follows, and consequently the activation losses, higher for the cathode than for the anode:
The reversible potentials for hydrogen oxidation at the anode and oxygen reduction at the cathode are, respectively, 0 V and 1.23 V at T = 25 °C and P = 1 atm.
The ohmic losses include the resistance towards electron and proton transport:
indicating with A the active area and with Ri the resistances towards electron flow (usually unknown and to be retrieved by regression) and the membrane one, l is the thickness of the membrane and ρM is its specific resistivity, reported in the above example for a Nafion membrane, whose resistivity is strongly dependent on its water content λ.
The concentration voltage drop is instead related to mass transfer limitations, which may limit the feed of reactants to the electrodes surface, causing a voltage loss.
iL being the limiting current density and B another unknown parameter of the cell to be retrieved via regression. In the optimisation, it is better to set the upper and lower limits for the search of the different parameters. For instance, αI = 0.2–2, CH+ =10−11–10−4, ΔGch,i = 10–70 kJ/mol, RC = 1–8 × 10⁻⁴ Ω, λ = 10–24 and B = 0.0136–0.5, as suggested in [14].
Once the voltage of a single cell has been modelled, the voltage of the stack can be calculated by multiplying the one of the single cell by the number of cells of the stack. The total power output is computed from the product of the current and the voltage of the stack [20].
Artificial Neural Network was used as robust search algorithm to extract the FC parameters in [28], a slime-mould optimisation algorithm was applied in [13] and a flower pollination algorithm was instead applied in [29].
A similar model was applied to interpret the experimental data collected over a 30-cell stack by varying temperature, pressure and relative humidity [30]. The model correctly represented the stack operation within ca. 10% error. A decrease in the activation losses was evident at increasing temperature due to the increase in the exchange current density. Mass transfer limitations also decreased with increasing temperature. An increase in pressure improved the operation due to higher partial pressures of both the reactants. The effect of relative humidity was more sensitive to the cathode than the anode, due to the higher flowrate. Overall, the polarisation curves were correctly represented by the model, although with a systematic voltage overestimation by ca. 10% due to simplified model assumptions.
A model implemented in Matlab© has been developed for a PEMFC and for an integrated electrolyser/fuel cell, with economic analysis [31]. The model develops through mass balances at the anode, cathode and membrane, as synthetically described below. The 1-D model assumes uniform distribution of reactants and current. At the anode, H2 is the only species considered, considering its inlet flow and the one consumed, quantified by the Faraday equation:
where n is the number of cells in the stack, I the current intensity and SH2 the stoichiometric ratio.
At the cathode, besides the oxygen balance, water must be also considered.
where SO2 the stoichiometric ratio, RHc is the relative humidity at the cathode and Psat is the saturation pressure for water, calculated as a function of temperature. The total flowrate at the cathode is the sum of that of oxygen and water [31].
As for the membrane, no crossover of oxygen and hydrogen is considered, but only protons and water transport. They are modelled considering different mechanisms: electro-osmotic drag (eod), diffusion (diff), pressure gradients and thermo-osmosis, of which only the first two are considered significant.
where I is the current intensity, A the active area, nd the eod coefficient, λmembr the water content of the membrane and DH2O the water diffusion coefficient, quantified as described in [31].
The scheme of the model is reported in Figure 7. Costs of the order of 6 × 10⁴ US$ have been estimated, which is comparably high with respect to rival technologies.
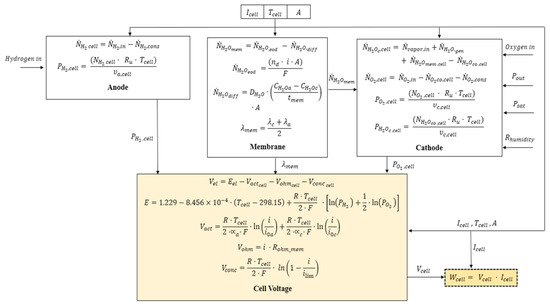
Figure 7.
Synopsis of the model of a PEMFC. Reprinted with permission from ref. [31]. Copyright 2021, Elsevier.
The effect of gas crossover is of course important, being almost unavoidable in PEMFC, and attempts to consider it should be undertaken. N2 and O2 flow to the anode and H2 to the cathode, leading to parasitic reactions, mixed potentials and an overall reduction in efficiency. Furthermore, it leads to degradation due to the formation of pinholes. An example of modelling gas crossover in HT-PEMFC is reported by Chippar and Ju [32].
A very accurate steady state model of a SOFC tube, based on experimental data, has been developed in [33], returning in general a 1% error (max deviation 8%). The model included mass and heat balances for both the solid and fluid, also ensuring a satisfactory account of the thermal management of the system.
Overall, different factors should be reproduced in the model, tightly connected with the cell configuration details. The different loading of the electrocatalyst, for instance, introduces modifications on the microscale, which make determinant variations to the performance parameters on the macroscale. Modelling of the macro-model and the related micro-model from the microstructure parameters (cathode inter-layer thickness, effective electronic and ionic conductivities, exchange current density, operating temperature, output current density, electrode- and electrolyte-particle radii, composition and porosity) is reported in [34]. This allows optimisation of the loading of the active layer over the electrodes. Another example focuses on the modelling of a SOFC cell considering the connection between microscale effects, e.g., fuel and air channels, anode and cathode current collectors, anode and cathode active layers and electrolyte, on macroscale modelling of the performance. The computational domain was discretised to represent all the relevant transport, chemical and electrochemical processes in a planar anode-supported SOFC operating by direct internal reforming [35,36].
An example of multiscale modelling applied to SOFC is given in [6], where, starting from the experimental investigation of an SOFC stack and microstructure detailed assessment for the electrodes, a finite volume numerical model was set up, resulting in a current–voltage characteristic curve that showed a fair resemblance to the experimental data.
4. Failure Modelling
Different causes of cell failure can be detected, among which some electrode-deactivation modes may be modelled vs. time due to a progressive decline in performance. For instance, in the case of Pt or Pd catalysts for PEMFCs, the progressive corrosion of the metal or of the carbon layer is known and can be described as a function of time. This in turn affects the oxygen transport resistance, with a catalytic effect of Pt itself and acceleration during high voltage excursions [37]. A comprehensive review on failure mode analysis, specifically related to SOFC type cells, has been recently published, summarising models, experimental monitoring and prediction of performance data [38].
In the last decade, P. Costamagna et al. widely studied fuel cell systems, often based on SOFCs, developing specific models for the description of stacks and electrodes, integrated fuel processors and, more recently, their failure modes. In particular, two classical failure detection approaches, based on fault signature matrix or on data with statistical classification, were applied independently or combined. The random forest classification was used to select regular and faulty modes. A hybrid approach coupling a model-based scheme with a statistical classifier emerged as the most effective [39,40,41,42]. The logic of these models is comparatively reported in Figure 8.
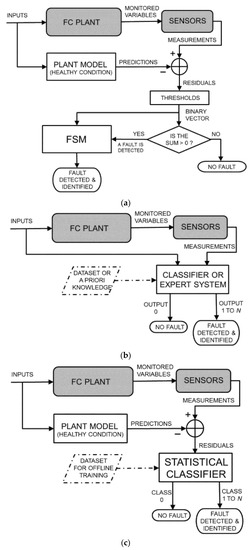
Figure 8.
Conceptual sketch of fault detection and isolation (FDI). (a) classical model-based FDI based on parity equations with output errors, residual binarisation, and fault signature matrix; (b) data-driven FDI; (c) hybrid approach. Reproduced from [39] under the Creative Commons Licence.
The degradation modes for SOFC have been extensively analysed by Eichhorn Colombo and Kharton [43], including coking, sulphur poisoning, formation of local hot spots due to excessive current densities and frequent power cycling. In order to model the probability of failure, or in other terms, the reliability of the system, a hierarchy of analysis is proposed, as in Figure 9, and the failure probability is correlated with the stresses of the cell or stack, which determine the correlation between current density and failure probability.
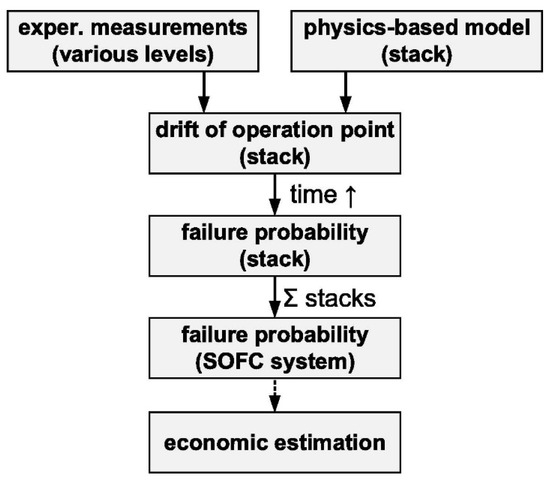
Figure 9.
Block diagram for the development of failure models. Reprinted with permission from ref. [43]. Copyright 2021, Elsevier.
An empirical degradation rate can be calculated and affects the cell voltage over time:
The model can be integrated with a non-linear equation solver to build the expected cell behaviour at a given time, building for instance the polarisation curve including the degradation of the cell (Figure 10).
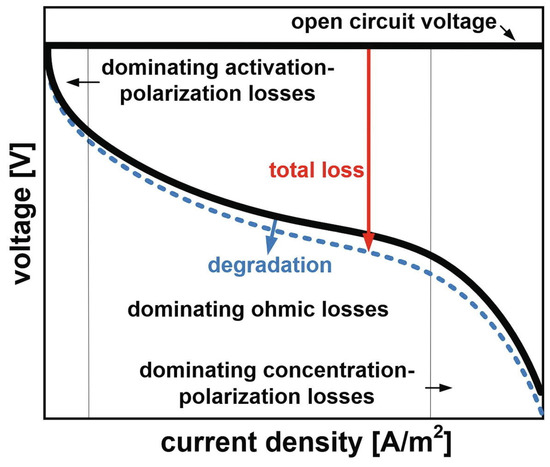
Figure 10.
Principal current density-voltage relationship for a SOFC, including deactivation. Reprinted with permission from ref. [43]. Copyright 2021, Elsevier.
Different formulations can be given for the degradation rate, either derived from experimental data, or more easily visualised in terms of virtual age, which quantifies the extent of loss of each element as a function of current density, voltage or operating temperature [43]. Based on statistics, if a system is constituted of components connected in series, the system fails if any of the components fails. If they are connected in parallel, failure occurs when all the components fail. If an SOFC system is based on n independent identical stacks, failure of k stacks being in operation occurs with a probability of:
where Pf is the failure probability of a stack. The reliability of the system is calculated as:
Overall, at constant current density, SOFC degradation rate increases with operating temperature, while at constant temperature it increases with the current density. The failure probability can be plotted vs. the virtual age of the system, as in Figure 11.
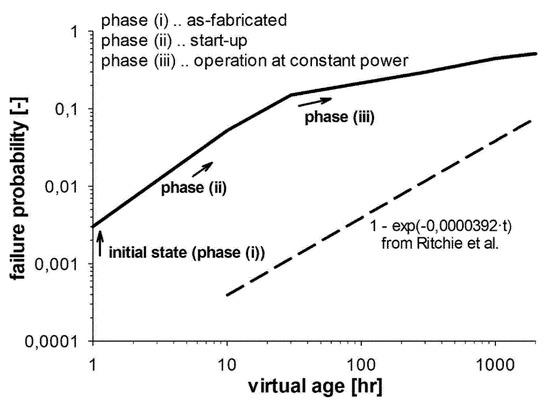
Figure 11.
Failure probability function in comparison to that from [44]. Reprinted with permission from ref. [43]. Copyright 2021, Elsevier.
A multiscale 3D model to describe the degradation of an SOFC was also presented in [45]. The deactivation of Ni electrodes due to Ni particle coarsening (anode) and Cr poisoning (cathode) was proposed considering 38,000 h of operation. The validation experimental data referred to the performance of a stack including 18 cells, considering how different regimes determine the loss of performance at various rates. It was confirmed that potentiostatic operation, moderate temperature, low current and counterflow configuration improve the long-term performance of the stack.
5. Dynamic Modelling
In addition to steady-state modelling, dynamic simulation is important to highlight the transient behaviour of the system. Different models were briefly reviewed in [10], and Matlab© and Simulink© tools are often used to this scope, as detailed in [20].
Besides the computation of all the variables described for steady-state models, dynamic modelling adds the dynamic computation of the activation losses and of cell thermodynamics due to the formation of a charge double layer (CDL). Therefore, the following time-dependent equations add:
where Rc sums the steady-state losses for activation and concentration and C is the double layer charge [20]. Furthermore, the temperature of the cell does not remain constant, and its value affects most of the variables of the model. Its variation with time is:
where CT is the thermal capacitance, H the global heat transfer coefficient, Tf the reference temperature and Tcell the lumped temperature of the FC [20].
For instance, a dynamic model of a Horizon H-500 PEMFC was described [46], where the double layer formations were been described as a capacitor. A dynamic model of a PEMFC was developed and validated against experimental data in [47] and in [48], focusing on the temperature profile through the cell, produced by the reaction due to ohmic losses and removed through convection in the channels. Steady-state assessment of voltage and ohmic losses was accompanied by dynamic modelling of concentration and activation losses in [49] and the dynamic response under step current variations in [50].
The integration of the heat-exchange apparatus is also important, especially for FCs operating at high temperature. Heat can be used to sustain reforming to produce hydrogen, to feed a parallel turbine cycle based on steam or an Organic Rankine Cycle (ORC) or for residential heat cogeneration in the case of low enthalpy sources. An example of integration with an ORC is reported in [20], and with a water absorption cycle is described in [51]. In addition, the dynamic simulation of hot water supply simultaneously with power generation in a house is reported in [52].
Unsteady operation modelling was also revealed as important in the case of internal methane reforming SOFC. A planar anode-supported structure has been considered to compute the behaviour of this very temperature-dependent system, which is more complex than direct hydrogen fuelled cells. A 3D model was set up imparting step changes in the output voltage and monitoring the resulting temporal profiles of temperature, current density, activation overpotential and gas concentration. An overshoot was observed in the activation when a step in voltage from 0.7 V to 0.8 V was applied, affecting only the exit region. The maximum temperature excursion was ca. 22 °C [53].
6. Fluid Dynamic Modelling
The detailed description of the flow field at the anode and cathode is an important piece of information. It affects the distribution of reactants (and thus cell performance), but also heat and water management. Accurate description is specifically needed at the cathode side, characterised by smaller gas diffusion coefficients. If flooding should occur, gas diffusion through the gas diffusion layer and at the catalyst layer would be inhibited, with overheating and dying of the membrane. Modelling the flow pattern implied the knowledge of the geometry of the channels, their discretisation into a proper mesh and the solution of the governing equations of such problems through home developed algorithms, often aided by commercial or open packages, such as Ansys Fluent© or Open Foam®.
A button SOFC has been described with a 3D Computational Fluid Dynamic (CFD) model to retrieve the temperature, current and concentration patterns in a cross section of the cell, allowing better control of the operating conditions and preventing thermal stress and cell damage [54]. The model was based on electrode kinetics and mass transport, and was elaborated in the ANSYS© Fluent environment, using a specific add-on for SOFC. An experimental investigation supported the activity, referring to a button SOFC with a La0.8Sr0.2MnO3 cathode and NiO-YSZ anode. The nodes of the model implemented were based on modelling fluid flow, including heat and mass transport into the channels and pores of the anode and cathode, current and potential in the solid material (including porous layers) and electrochemical reactions at the interface between the electrode and electrolyte [54]. The key steps of the model are the following:
The conservation of momentum is:
In the equation, ρ is the density, v the velocity, yi the composition in mass fraction and Si the sink or source of the i-th species.
The charge conservation is calculated as:
with σ as electric conductivity and ϕ the Nernst potential calculated as:
However, the actual cell potential is calculated by taking into account the jump potential and the activation over-potential, and the current density is calculated through the Butler–Volmer equation.
where ηact is the activation overpotential for the anode (a) or cathode (c). Equations for heat-transfer computation are also available, such as:
where Sh is the heat source and E the volumetric source. Details are reported in the original reference [54]. The model was implemented and loaded on a mesh of 3 million volume cells. The results showed increasing current density and power density for a given voltage and flowrates, and the parameters also increased with increasing flowrates (Figure 12). The concentration profiles of hydrogen and oxygen at the electrodes are also shown.
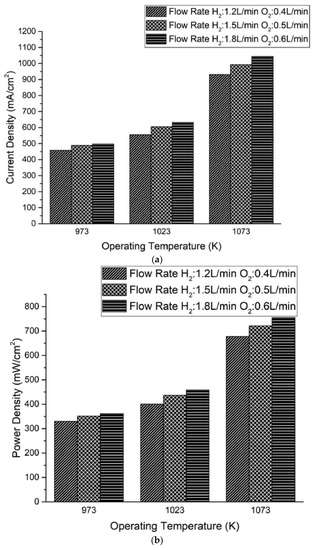
Figure 12.
(a) current density and (b) power density variation with temperature and flowrates for a button SOFC (0.6 V). Reprinted with permission from ref. [54]. Copyright 2021, Elsevier.
A very detailed 3-D fluid dynamic model was developed by Atyabi et al. [55] to compare the flow pattern of oxygen between straight parallel and sinusoidal cathodic channels. CFD via finite volume and SIMPLE algorithm was applied to model cathodic flowrate. The results showed that higher velocity was attained in the sinusoidal configuration, with increased diffusion towards the GDL, though at the expense of a greater pressure drop. Through the quantification of a uniformity index of different variables, the sinusoidal channels were characterised by more uniform oxygen mass fraction and temperature distribution, reducing the thermal stress [55].
In the same line, Kuo et al. [56,57] demonstrated that a wave flow field improves mass transfer and convection with a more uniform temperature profile. Furthermore, bio-inspired flow patterns improved the uniformity of reactants and consequently power density, with respect to parallel-spiral flow [58]. Counterflow configuration led to higher membrane conductivity than co-current flow [59].
A CFD framework was also used to model diffusion and convection in porous transport layers, such as GDL. A macroscopic control volume was developed and implemented in a finite volume code with Ansys Fluent, embedding the microscopic porous network into the mesh [11].
Transient effects are significant for mobile applications, and were the focus of a 3-D CFD study of a PEMFC with a serpentine channel. A step-change in the mass flow rates resulted in current- and power-density increases with time at low cell voltage due to concentration losses, but this was negligible at high voltages [60].
7. Water Management
Water management is a fundamental isse in ensuring stable performance for fuel cells operating at temperatures lower than 100 °C (e.g., in PEMFC), where liquid water is expected to form and accumulate in the cell [61,62,63]. On one hand, the use of humid inlet gases is compulsory to avoid the drying of the membrane. The conductivity of the membrane is tightly related to its water content. If the cathodic gas near the membrane is not saturated with vapour, the membrane may release water, decreasing its proton conductivity and adding ohmic losses. The water transport in the membrane is also further complicated by the transport of protons across it, in the form of hydrated ions. The existence of a water concentration gradient from the cathode to the anode can stimulate the back-diffusion of water. Based on the local temperature and pressure in the pores of the cathode, water can be either in vapour or liquid state. On the other hand, the water forming during the reaction must be effectively discharged from the channels to avoid accumulation and thus flooding of the cell [64,65]. In such a case, unstable performance may be observed, with abrupt voltage change when water is expelled. If both conditions coexist periodically, the expected lifetime of the cell is shortened [66]. Furthermore, the excess water prevents the correct transport and contact between the gases and the electrodes.
The former issue can be accomplished by including an external humidifier in the form of a heat exchanger that provides some heat and vapour to the incoming gases. This is of course an additional item that adds costs and management constraints to the assembly. However, a solution has been proposed to spatially resolve the heat removal from the cell so as to achieve an appropriate humidity of the gases [66]. For instance, if the temperature of the cathode is allowed to increase only gradually, providing accurate cooling, the gas can remain saturated along the channel without the need of external humidity supply. A model was developed for a proper thermal profile, neglecting pressure drop along the channel, the thickness of the gas diffusion layers and hydraulic permeation across the membrane. The model demonstrated the possibility of use the product water to keep the gases saturated through the channel, a conclusion confirmed by experimental validation [66].
Detailed models have been also developed to investigate droplet formation and discharge in the channels of a PEMFC [65]. Multiphase flow fields of oxygen, hydrogen and water must be studied to optimise operation and ensure the long-term stability of the device. Microchannels are designed to narrow the depth and width of the flow field and are usually modelled through finite element simulation. The pore size distribution of the carbon paper affects the droplets’ size and shape. Smaller channels increase the droplet pressure difference and improve their discharge rate [65].
8. Integrated Fuel Processors
A dynamic model based on simulation and experimental data was developed for a stand-alone PEMFC, including a reformer, a FC and the power conditioning system [67]. A similar system was also modelled for a residential power generation unit based on methanol reforming [68,69,70].
Hydrogen production via steam-reforming of biomass-derived compounds, such as bioethanol, is receiving increasing attention [71,72,73,74,75,76,77], including for the design of integrated processes for fuel processing and conversion into FCs. Ethanol in particular has the advantage of being a nontoxic liquid, being flexibly reformable, and its material yield and energetic input can be tuned by varying the water/ethanol ratio in the reacting mixture [78]. It can also be used at low purity levels [72,79], thus limiting the reactant cost. The catalysts for ethanol reforming are a substantially commercial reality [80,81] and can meet diverse market options, such as residential power co-generation [82,83] or centralised production in biorefineries. An integrated plant for joint electrical and thermal power production from diluted bioethanol, with a size of 8–11 kW (of which Pelectical ≥ 4 kW), has been designed and rated, based on a PEMFC, with special emphasis on thermal integration [84,85,86]. This unit exploits diluted bioethanol as inexpensive feed with respect to the anhydrous pure ethanol. This point is key for the economy of the generator, and opens possibilities for thermal energy valorisation.
9. Conclusions
Models for the description of various FC types have been derived over the years. They allow computation of the steady-state or transient behaviour of the cell, and can be used for the faster and inexpensive simulation of cell operation under different conditions. Simpler systems include only single cells or stacks, while more complex layouts include the fuel processor and possibly the connection with the grid. Failure models are also available to predict the reliability of the cells.
The thermodynamic description of the electrochemical system is available together with kinetics for different FCs, mainly PEMFC and SOFC devices, which are currently the most frequently investigated forms. Different overpotentials are also under discussion with the relative modelling tools. Finally, transport phenomena are accounted for through proper modelling to estimate the efficiency of the system, but also to cope with the removal of water through the channels.
Overall, relatively easy models can be implemented with reasonably accurate predictions of cell behaviour, allowing sizing and rating, but also optimisation in connection with fuel processors and lifetime prediction.
Nevertheless, many points remain open for improvements. Even if the different components of electrochemical resistances can be well defined, the specific values of the characteristic parameters or their evolution in time need retieval. In this field, artificial neural neworks and genetic algorithms are growing in use, although the previsions are still affected by errors. For most practical applications, semiempirical models may better respond to the need for retrieving robust estimators of performance.
Besides the intrinsic working mechanisms, deeper efforts are needed to compute undesired phenomena, such as crossover and water management. This latter point may be an important issue to assess under dynamic conditions, in order to rapidly tune the operating parameters to reverse water accumulation. In general, it is stongly suggested to provide modelling details on failure-mode prediction and remediation. These models, together with the description of dynamic cell behaviour, are valuable for enabling safe and durable operation, which is at the basis of a reliable establishment of these technologies. In the same frame, adapting CFD modelling to the estimation of critical conditions and to the tuning of working parameters to circumvent major events, such as drying or flooding, may be one of the keys favouring the spread of these technologies.
Funding
This research received no external funding.
Institutional Review Board Statement
Not applicable.
Informed Consent Statement
Not applicable.
Data Availability Statement
All the data are available in this paper and in the cited references.
Conflicts of Interest
The author declares no conflict of interest.
References
- Hydrogen & Fuel Cells. Available online: https://www.nrel.gov/hydrogen/ (accessed on 1 November 2021).
- Ogungbemi, E.; Wilberforce, T.; Ijaodola, O.; Thompson, J.; Olabi, A.G. Review of operating condition, design parameters and material properties for proton exchange membrane fuel cells. Int. J. Energy Res. 2021, 45, 1227–1245. [Google Scholar] [CrossRef]
- Singh, M.; Zappa, D.; Comini, E. Solid oxide fuel cell: Decade of progress, future perspectives and challenges. Int. J. Hydrog. Energy 2021, 46, 27643–27674. [Google Scholar] [CrossRef]
- Tullius, V.; Zobel, M.; Dyck, A. Development of a Heuristic Control Algorithm for Detection and Regeneration of CO Poisoned LT-PEMFC Stacks in Stationary Applications. Energies 2020, 13, 4648. [Google Scholar] [CrossRef]
- Beale, S.B.; Andersson, M.; Boigues-Muñoz, C.; Frandsen, H.L.; Lin, Z.; McPhail, S.J.; Ni, M.; Sundén, B.; Weber, A.; Weber, A.Z. Continuum scale modelling and complementary experimentation of solid oxide cells. Prog. Energy Combust. Sci. 2021, 85, 100902. [Google Scholar] [CrossRef]
- Mozdzierz, M.; Berent, K.; Kimijima, S.; Szmyd, J.S.; Brus, G. A multiscale approach to the numerical simulation of the solid oxide fuel cell. Catalysts 2019, 9, 253. [Google Scholar] [CrossRef]
- Cruz-Martínez, H.; Guerra-Cabrera, W.; Flores-Rojas, E.; Ruiz-Villalobos, D.; Rojas-Chávez, H.; Peña-Castañeda, Y.A.; Medina, D.I. Pt-free metal nanocatalysts for the oxygen reduction reaction combining experiment and theory: An overview. Molecules 2021, 26, 6689. [Google Scholar] [CrossRef]
- Mei, S.; Lu, X.; Zhu, Y.; Wang, S. Thermodynamic assessment of a system configuration strategy for a cogeneration system combining SOFC, thermoelectric generator, and absorption heat pump. Appl. Energy 2021, 302, 117573. [Google Scholar] [CrossRef]
- Kravos, A.; Ritzberger, D.; Tavčar, G.; Hametner, C.; Jakubek, S.; Katrašnik, T. Thermodynamically consistent reduced dimensionality electrochemical model for proton exchange membrane fuel cell performance modelling and control. J. Power Sources 2020, 454, 227930. [Google Scholar] [CrossRef]
- Rubio, A.; Agila, W. Dynamic Model of Proton Exchane Membrane Fuel Cells: A Critical Review and a Novel Model. In Proceedings of the 2019 8th International Conference on Renewable Energy Research and Applications (ICRERA), Brasov, Romania, 3–6 November 2019; pp. 353–358. [Google Scholar]
- García-Salaberri, P.A. Modeling diffusion and convection in thin porous transport layers using a composite continuum-network model: Application to gas diffusion layers in polymer electrolyte fuel cells. Int. J. Heat Mass Transf. 2021, 167, 120824. [Google Scholar] [CrossRef]
- Bianchi, F.R.; Spotorno, R.; Piccardo, P.; Bosio, B. Solid Oxide Fuel Cell Performance Analysis through Local Modelling. Catalysts 2020, 10, 519. [Google Scholar] [CrossRef]
- Gupta, J.; Nijhawan, P.; Ganguli, S. Optimal parameter estimation of PEM fuel cell using slime mould algorithm. Int. J. Energy Res. 2021, 45, 14732–14744. [Google Scholar] [CrossRef]
- Alizadeh, M.; Torabi, F. Precise PEM fuel cell parameter extraction based on a self-consistent model and SCCSA optimization algorithm. Energy Convers. Manag. 2021, 229, 113777. [Google Scholar] [CrossRef]
- Sohn, S.; Nam, J.H.; Jeon, D.H.; Kim, C.J. A micro/macroscale model for intermediate temperature solid oxide fuel cells with prescribed fully-developed axial velocity profiles in gas channels. Int. J. Hydrog. Energy 2010, 35, 11890–11907. [Google Scholar] [CrossRef]
- Sohn, S.; Baek, S.M.; Nam, J.H.; Kim, C.J. Two-dimensional micro/macroscale model for intermediate-temperature solid oxide fuel cells considering the direct internal reforming of methane. Int. J. Hydrog. Energy 2016, 41, 5582–5597. [Google Scholar] [CrossRef]
- Zhang, Y.; Zhang, Y.; Li, X.; Cao, G. Control design of 60 kW PEMFC generation system for residential applications. J. Zhejiang Univ. Sci. A 2013, 14, 679–685. [Google Scholar] [CrossRef]
- Omran, A.; Lucchesi, A.; Smith, D.; Alaswad, A.; Amiri, A.; Wilberforce, T.; Sodré, J.R.; Olabi, A.G. Mathematical model of a proton-exchange membrane (PEM) fuel cell. Int. J. Thermofluids 2021, 11, 100110. [Google Scholar] [CrossRef]
- Ahmed, K.; Farrok, O.; Rahman, M.M.; Ali, M.S.; Haque, M.M.; Azad, A.K. Proton exchange membrane hydrogen fuel cell as the grid connected power generator. Energies 2020, 13, 6679. [Google Scholar] [CrossRef]
- Ansari, S.A.; Khalid, M.; Kamal, K.; Abdul Hussain Ratlamwala, T.; Hussain, G.; Alkahtani, M. Modeling and simulation of a proton exchange membrane fuel cell alongside a waste heat recovery system based on the organic rankine cycle in MATLAB/SIMULINK environment. Sustainability 2021, 13, 1218. [Google Scholar] [CrossRef]
- Yu, X.; Starke, M.R.; Tolbert, L.M.; Ozpineci, B. Fuel cell power conditioning for electric power applications: A summary. IET Electr. Power Appl. 2007, 1, 643–656. [Google Scholar] [CrossRef]
- Mann, R.F.; Amphlett, J.C.; Hooper, M.A.I.; Jensen, H.M.; Peppley, B.A.; Roberge, P.R. Development and application of a generalised steady-state electrochemical model for a PEM fuel cell. J. Power Sources 2000, 86, 173–180. [Google Scholar] [CrossRef]
- Priya, K.; Sudhakar Babu, T.; Balasubramanian, K.; Sathish Kumar, K.; Rajasekar, N. A novel approach for fuel cell parameter estimation using simple Genetic Algorithm. Sustain. Energy Technol. Assess. 2015, 12, 46–52. [Google Scholar] [CrossRef]
- Grondin-Perez, B.; Roche, S.; Lebreton, C.; Benne, M.; Damour, C.; Kadjo, J.-J.A. Mechanistic Model versus Artificial Neural Network Model of a Single-Cell PEMFC. Engineering 2014, 6, 418–426. [Google Scholar] [CrossRef]
- Askarzadeh, A.; Rezazadeh, A. A new artificial bee swarm algorithm for optimization of proton exchange membrane fuel cell model parameters. J. Zhejiang Univ. Sci. C 2011, 12, 638–646. [Google Scholar] [CrossRef]
- Askarzadeh, A.; Rezazadeh, A. A grouping-based global harmony search algorithm for modeling of proton exchange membrane fuel cell. Int. J. Hydrog. Energy 2011, 36, 5047–5053. [Google Scholar] [CrossRef]
- El-Fergany, A.A.; Hasanien, H.M.; Agwa, A.M. Semi-empirical PEM fuel cells model using whale optimization algorithm. Energy Convers. Manag. 2019, 201, 112197. [Google Scholar] [CrossRef]
- Fawzi, M.; El-Fergany, A.A.; Hasanien, H.M. Effective methodology based on neural network optimizer for extracting model parameters of PEM fuel cells. Int. J. Energy Res. 2019, 43, 8136–8147. [Google Scholar] [CrossRef]
- Kumar, P.; Gnanasekar, S.; Andrews, N.G.; Natarajan, R. An integrated approach on proton exchange membrane fuel cell performance enhancement combining flower pollination algorithm and nanofluids. IET Renew. Power Gener. 2021, 15, 2216–2227. [Google Scholar] [CrossRef]
- Chugh, S.; Chaudhari, C.; Sonkar, K.; Sharma, A.; Kapur, G.S.; Ramakumar, S.S.V. Experimental and modelling studies of low temperature PEMFC performance. Int. J. Hydrog. Energy 2020, 45, 8866–8874. [Google Scholar] [CrossRef]
- Escobar-Yonoff, R.; Maestre-Cambronel, D.; Charry, S.; Rincón-Montenegro, A.; Portnoy, I. Performance assessment and economic perspectives of integrated PEM fuel cell and PEM electrolyzer for electric power generation. Heliyon 2021, 7, e06506. [Google Scholar] [CrossRef]
- Chippar, P.; Ju, H. Numerical modeling and investigation of gas crossover effects in high temperature proton exchange membrane (PEM) fuel cells. Int. J. Hydrog. Energy 2013, 38, 7704–7714. [Google Scholar] [CrossRef]
- Costamagna, P.; Grosso, S.; Travis, R.; Magistri, L. Integrated planar solid oxide fuel cell: Steady-state model of a bundle and validation through single tube experimental data. Energies 2015, 8, 13231–13254. [Google Scholar] [CrossRef]
- Chen, D.; Bi, W.; Kong, W.; Lin, Z. Combined micro-scale and macro-scale modeling of the composite electrode of a solid oxide fuel cell. J. Power Sources 2010, 195, 6598–6610. [Google Scholar] [CrossRef]
- Ho, T.X.; Kosinski, P.; Hoffmann, A.C.; Vik, A. Numerical modeling of solid oxide fuel cells. Chem. Eng. Sci. 2008, 63, 5356–5365. [Google Scholar] [CrossRef]
- Ho, T.X.; Kosinski, P.; Hoffmann, A.C.; Vik, A. Numerical analysis of a planar anode-supported SOFC with composite electrodes. Int. J. Hydrog. Energy 2009, 34, 3488–3499. [Google Scholar] [CrossRef]
- Borup, R.L.; Kusoglu, A.; Neyerlin, K.C.; Mukundan, R.; Ahluwalia, R.K.; Cullen, D.A.; More, K.L.; Weber, A.Z.; Myers, D.J. Recent developments in catalyst-related PEM fuel cell durability. Curr. Opin. Electrochem. 2020, 21, 192–200. [Google Scholar] [CrossRef]
- Peng, J.; Huang, J.; Wu, X.-L.; Xu, Y.-W.; Chen, H.; Li, X. Solid oxide fuel cell (SOFC) performance evaluation, fault diagnosis and health control: A review. J. Power Sources 2021, 505, 230058. [Google Scholar] [CrossRef]
- Costamagna, P.; De Giorgi, A.; Gotelli, A.; Magistri, L.; Moser, G.; Sciaccaluga, E.; Trucco, A. Fault diagnosis strategies for SOFC-based power generation plants. Sensors 2016, 16, 1336. [Google Scholar] [CrossRef]
- Costamagna, P.; De Giorgi, A.; Moser, G.; Serpico, S.B.; Trucco, A. Data-driven techniques for fault diagnosis in power generation plants based on solid oxide fuel cells. Energy Convers. Manag. 2019, 180, 281–291. [Google Scholar] [CrossRef]
- Costamagna, P.; De Giorgi, A.; Moser, G.; Pellaco, L.; Trucco, A. Data-driven fault diagnosis in SOFC-based power plants under off-design operating conditions. Int. J. Hydrog. Energy 2019, 44, 29002–29006. [Google Scholar] [CrossRef]
- Costamagna, P.; De Giorgi, A.; Magistri, L.; Moser, G.; Pellaco, L.; Trucco, A. A Classification Approach for Model-Based Fault Diagnosis in Power Generation Systems Based on Solid Oxide Fuel Cells. IEEE Trans. Energy Convers. 2016, 31, 676–687. [Google Scholar] [CrossRef]
- Eichhorn Colombo, K.W.; Kharton, V.V. Reliability analysis of a multi-stack solid oxide fuel cell from a systems engineering perspective. Chem. Eng. Sci. 2021, 238, 116571. [Google Scholar] [CrossRef]
- Ritchie, A.J.; Brouwer, J. Design of fuel cell powered data centers for sufficient reliability and availability. J. Power Sources 2018, 384, 196–206. [Google Scholar] [CrossRef]
- Babaie Rizvandi, O.; Miao, X.Y.; Frandsen, H.L. Multiscale modeling of degradation of full solid oxide fuel cell stacks. Int. J. Hydrog. Energy 2021, 46, 27709–27730. [Google Scholar] [CrossRef]
- Azri, M.; Mubin, A.N.A.; Ibrahim, Z.; Rahim, N.A.; Raihan, S.R.S. Mathematical Modelling for Proton Exchange Membrane Fuel Cell (PEMFC). J. Theor. Appl. Inf. Technol. 2016, 86, 409–419. [Google Scholar]
- Benchouia, N.; Hadjadj, A.; Derghal, A.; Khochemane, L.; Mahmah, B. Modeling and validation of fuel cell PEMFC (accepté le 30 juin 2013). Revue des Energies Renouvelables 2013, 16, 365–377. [Google Scholar]
- Acedo-Valencia, J.; Sierra, J.; Figueroa-Ramírez, S.; Mandujano, H.; Meza, M.; Tadeo, J.; Grajeda, S. Numerical study of heat transfer in a PEM fuel cell with different flow-fields. In Proceedings of the XV International Congress of the Mexican Hydrogen, Mexico City, Mexico, 22–25 September 2015. [Google Scholar]
- Xue, X.D.; Cheng, K.W.E.; Sutanto, D. Unified mathematical modelling of steady-state and dynamic voltage–current characteristics for PEM fuel cells. Electrochim. Acta 2006, 52, 1135–1144. [Google Scholar] [CrossRef]
- Zhao, J.; Jian, Q.; Luo, L.; Huang, B.; Cao, S.; Huang, Z. Dynamic behavior study on voltage and temperature of proton exchange membrane fuel cells. Appl. Therm. Eng. 2018, 145, 343–351. [Google Scholar] [CrossRef]
- Guo, X.; Zhang, H.; Zhao, J.; Wang, F.; Wang, J.; Miao, H.; Yuan, J. Performance evaluation of an integrated high-temperature proton exchange membrane fuel cell and absorption cycle system for power and heating/cooling cogeneration. Energy Convers. Manag. 2019, 181, 292–301. [Google Scholar] [CrossRef]
- Tripodi, A.; Bahadori, E.; Ramis, G.; Rossetti, I. Feasibility assessment, process design and dynamic simulation for cogeneration of heat and power by steam reforming of diluted bioethanol. Int. J. Hydrog. Energy 2019, 44, 2–22. [Google Scholar] [CrossRef]
- Ho, T.X. Dynamic characteristics of a solid oxide fuel cell with direct internal reforming of methane. Energy Convers. Manag. 2016, 113, 44–51. [Google Scholar] [CrossRef]
- Alhazmi, N.; Almutairi, G.; Alenazey, F.; AlOtaibi, B. Three-dimensional computational fluid dynamics modeling of button solid oxide fuel cell. Electrochim. Acta 2021, 390, 138838. [Google Scholar] [CrossRef]
- Atyabi, S.A.; Afshari, E. A numerical multiphase CFD simulation for PEMFC with parallel sinusoidal flow fields. J. Therm. Anal. Calorim. 2019, 135, 1823–1833. [Google Scholar] [CrossRef]
- Kuo, J.-K.; Chen, C.-K. The effects of buoyancy on the performance of a PEM fuel cell with a wave-like gas flow channel design by numerical investigation. Int. J. Heat Mass Transf. 2007, 50, 4166–4179. [Google Scholar] [CrossRef]
- Kuo, J.-K.; Yen, T.-H.; Chen, C.-K. Three-dimensional numerical analysis of PEM fuel cells with straight and wave-like gas flow fields channels. J. Power Sources 2008, 177, 96–103. [Google Scholar] [CrossRef]
- Roshandel, R.; Arbabi, F.; Moghaddam, G.K. Simulation of an innovative flow-field design based on a bio inspired pattern for PEM fuel cells. Renew. Energy 2012, 41, 86–95. [Google Scholar] [CrossRef]
- Ge, S.-H.; Yi, B.-L. A mathematical model for PEMFC in different flow modes. J. Power Sources 2003, 124, 1–11. [Google Scholar] [CrossRef]
- Kupeli, S.; Celik, E.; Karagoz, I. Response of a proton exchange membrane fuel cell to step changes in mass flow rates. Fuel Cells 2021, 21, 338–346. [Google Scholar] [CrossRef]
- Zawodzinski, T.A.; Neeman, M.; Sillerud, L.O.; Gottesfeld, S. Determination of water diffusion coefficients in perfluorosulfonate ionomeric membranes. J. Phys. Chem. 1991, 95, 6040–6044. [Google Scholar] [CrossRef]
- Fuller, T.F.; Newman, J. Water and Thermal Management in Solid-Polymer-Electrolyte Fuel Cells. J. Electrochem. Soc. 1993, 140, 1218–1225. [Google Scholar] [CrossRef]
- Nguyen, T.V.; White, R.E. A Water and Heat Management Model for Proton-Exchange-Membrane Fuel Cells. J. Electrochem. Soc. 1993, 140, 2178–2186. [Google Scholar] [CrossRef]
- Su, S.; Liang, J.; Luo, Y.; Liu, Z.; Li, X.; Yin, P.; Chen, L.; Cui, Y.; Wang, D. A new water management system for air-breathing direct methanol fuel cell using superhydrophilic capillary network and evaporation wings. Energy Convers. Manag. 2021, 246, 114665. [Google Scholar] [CrossRef]
- Zhang, R.; Yang, B.; Lei, X.; Ming, P.; Li, B.; Lei, Y.; Yang, D.; Zhang, C. Droplets dynamics theory and micro-flow field experiments of improving self-humidifying feature and maximum power density in fuel cells. Chem. Eng. J. 2022, 429, 131974. [Google Scholar] [CrossRef]
- Tolj, I.; Bezmalinovic, D.; Barbir, F. Maintaining desired level of relative humidity throughout a fuel cell with spatially variable heat removal rates. Int. J. Hydrog. Energy 2011, 36, 13105–13113. [Google Scholar] [CrossRef]
- El-Sharkh, M.Y.; Rahman, A.; Alam, M.S.; Sakla, A.A.; Byrne, P.C.; Thomas, T. Analysis of Active and Reactive Power Control of a Stand-Alone PEM Fuel Cell Power Plant. IEEE Trans. Power Syst. 2004, 19, 2022–2028. [Google Scholar] [CrossRef]
- El-Sharkh, M.Y.; Rahman, A.; Alam, M.S.; Byrne, P.C.; Sakla, A.A.; Thomas, T. A dynamic model for a stand-alone PEM fuel cell power plant for residential applications. J. Power Sources 2004, 138, 199–204. [Google Scholar] [CrossRef]
- Iulianelli, A.; Ribeirinha, P.; Mendes, A.; Basile, A. Methanol steam reforming for hydrogen generation via conventional and membrane reactors: A review. Renew. Sustain. Energy Rev. 2014, 29, 355–368. [Google Scholar] [CrossRef]
- Wang, S.; Wang, S. Exergy analysis and optimization of methanol generating hydrogen system for PEMFC. Int. J. Hydrog. Energy 2006, 31, 1747–1755. [Google Scholar] [CrossRef]
- Xuan, J.; Leung, M.K.H.; Leung, D.Y.C.; Ni, M. A review of biomass-derived fuel processors for fuel cell systems. Renew. Sustain. Energy Rev. 2009, 13, 1301–1313. [Google Scholar] [CrossRef]
- Remiro, A.; Valle, B.; Oar-arteta, L.; Aguayo, T.; Bilbao, J.; Gayubo, A.G. Hydrogen production by steam reforming of bio-oil and bio-ethanol mixtures in a continuous thermal-catalytic process. Int. J. Hydrog. Energy 2014, 39, 6889–6898. [Google Scholar] [CrossRef]
- Zou, J.; Yang, H.; Zeng, Z.; Wu, C.; Williams, P.T.; Chen, H. Hydrogen production from pyrolysis catalytic reforming of cellulose in the presence of K alkali metal. Int. J. Hydrog. Energy 2016, 41, 10598–10607. [Google Scholar] [CrossRef]
- Alvarez, J.; Kumagai, S.; Wu, C.; Yoshioka, T.; Bilbao, J.; Olazar, M.; Williams, P.T. Hydrogen production from biomass and plastic mixtures by pyrolysis-gasification. Int. J. Hydrog. Energy 2014, 39, 10883–10891. [Google Scholar] [CrossRef]
- Ma, Z.; Xiao, R.; Zhang, H. Catalytic steam reforming of bio-oil model compounds for hydrogen-rich gas production using bio-char as catalyst. Int. J. Hydrog. Energy 2017, 42, 3579–3585. [Google Scholar] [CrossRef]
- Cheekatamarla, P.K.; Finnerty, C.M. Synthesis gas production via catalytic partial oxidation reforming of liquid fuels. Int. J. Hydrog. Energy 2008, 33, 5012–5019. [Google Scholar] [CrossRef]
- Ni, M.; Leung, D.Y.C.; Leung, M.K.H. A review on reforming bio-ethanol for hydrogen production. Int. J. Hydrog. Energy 2007, 32, 3238–3247. [Google Scholar] [CrossRef]
- Tripodi, A.; Compagnoni, M.; Ramis, G.; Rossetti, I. Process simulation of hydrogen production by steam reforming of diluted bioethanol solutions: Effect of operating parameters on electrical and thermal cogeneration by using fuel cells. Int. J. Hydrog. Energy 2017, 42, 23776–23783. [Google Scholar] [CrossRef]
- García-díez, E.; García-labiano, F.; De Diego, L.F.; Abad, A.; Gayán, P.; Adánez, J.; Ruíz, J.A.C. Optimization of hydrogen production with CO2 capture by autothermal chemical-looping reforming using different bioethanol purities. Appl. Energy 2016, 169, 491–498. [Google Scholar] [CrossRef]
- Akpan, E.; Akande, A.; Aboudheir, A.; Ibrahim, H.; Idem, R. Experimental, kinetic and 2-D reactor modeling for simulation of the production of hydrogen by the catalytic reforming of concentrated crude ethanol (CRCCE) over a Ni-based commercial catalyst in a packed-bed tubular reactor. Chem. Eng. Sci. 2007, 62, 3112–3126. [Google Scholar] [CrossRef]
- Mathure, P.V.; Ganguly, S.; Patwardhan, A.V.; Saha, R.K. Steam reforming of ethanol using a commercial nickel-based catalyst. Ind. Eng. Chem. Res. 2007, 46, 8471–8479. [Google Scholar] [CrossRef]
- Lanzini, A.; Santarelli, M.; Orsello, G. Residential Solid Oxide Fuel Cell Generator Fuelled by Ethanol: Cell, Stack and System Modelling with a Preliminary Experiment. Fuel Cells 2010, 10, 654–675. [Google Scholar] [CrossRef][Green Version]
- Farra, N.; Tzanetakis, T.; Thomson, M.J. Experimental Determination of the Efficiency and Emissions of a Residential Microcogeneration System Based on a Stirling Engine and Fueled by Diesel and Ethanol. Energy Fuels 2012, 26, 889–900. [Google Scholar] [CrossRef]
- Tripodi, A.; Pizzonia, A.; Bahadori, E.; Rossetti, I. Integrated Plant Layout for Heat and Power Cogeneration from Diluted Bioethanol. ACS Sustain. Chem. Eng. 2018, 6, 5358–5369. [Google Scholar] [CrossRef]
- Rossetti, I.; Compagnoni, M.; Torli, M. Process simulation and optimisation of H2 production from ethanol steam reforming and its use in fuel cells. 1. Thermodynamic and kinetic analysis. Chem. Eng. J. 2015, 281, 1024–1035. [Google Scholar] [CrossRef]
- Rossetti, I.; Compagnoni, M.; Torli, M. Process simulation and optimization of H2 production from ethanol steam reforming and its use in fuel cells. 2. Process analysis and optimization. Chem. Eng. J. 2015, 281, 1036–1044. [Google Scholar] [CrossRef]
Publisher’s Note: MDPI stays neutral with regard to jurisdictional claims in published maps and institutional affiliations. |
© 2022 by the author. Licensee MDPI, Basel, Switzerland. This article is an open access article distributed under the terms and conditions of the Creative Commons Attribution (CC BY) license (https://creativecommons.org/licenses/by/4.0/).