


Trace Elements in Indoor Dust Exposure from Child Development Centers and Health Risk Assessment in Haze and Industrial Areas, Thailand

Abstract
1. Introduction
2. Materials and Methods
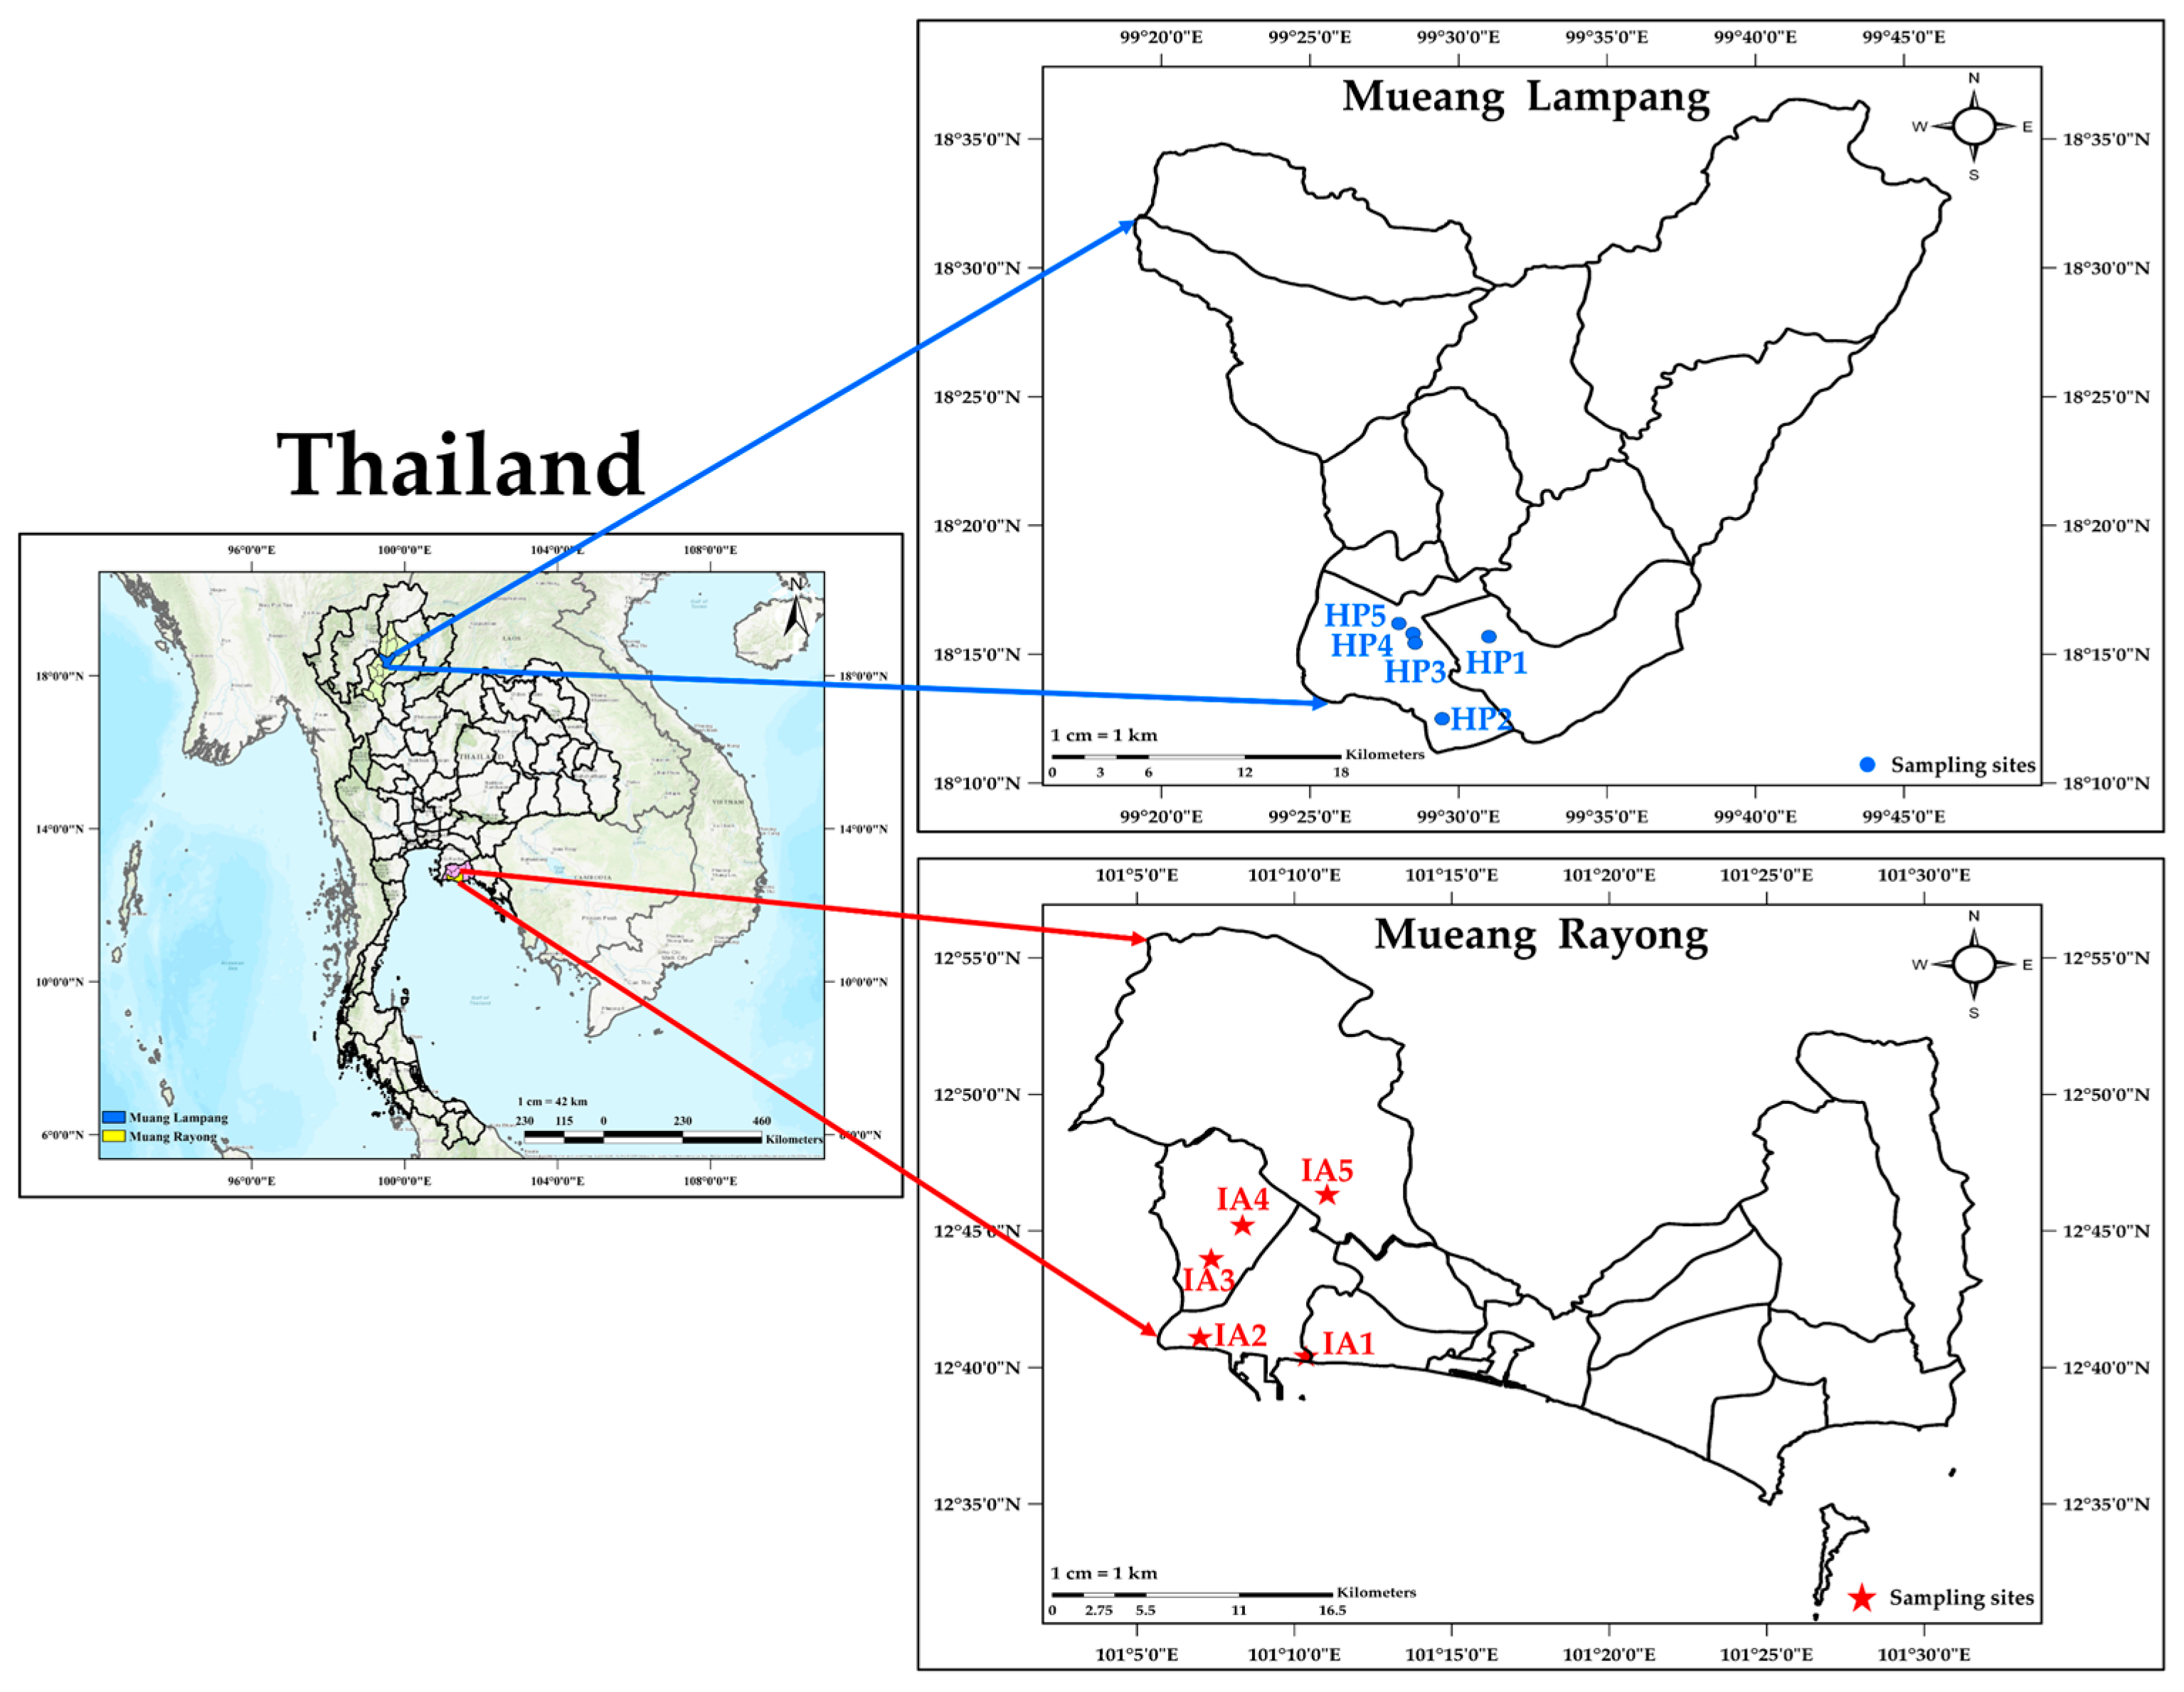
2.1. Sampling Sites
2.2. Extraction and Analysis of Trace Elements-Bound Dust Sample
2.3. Pollution Assessment of Trace Elements in Dust
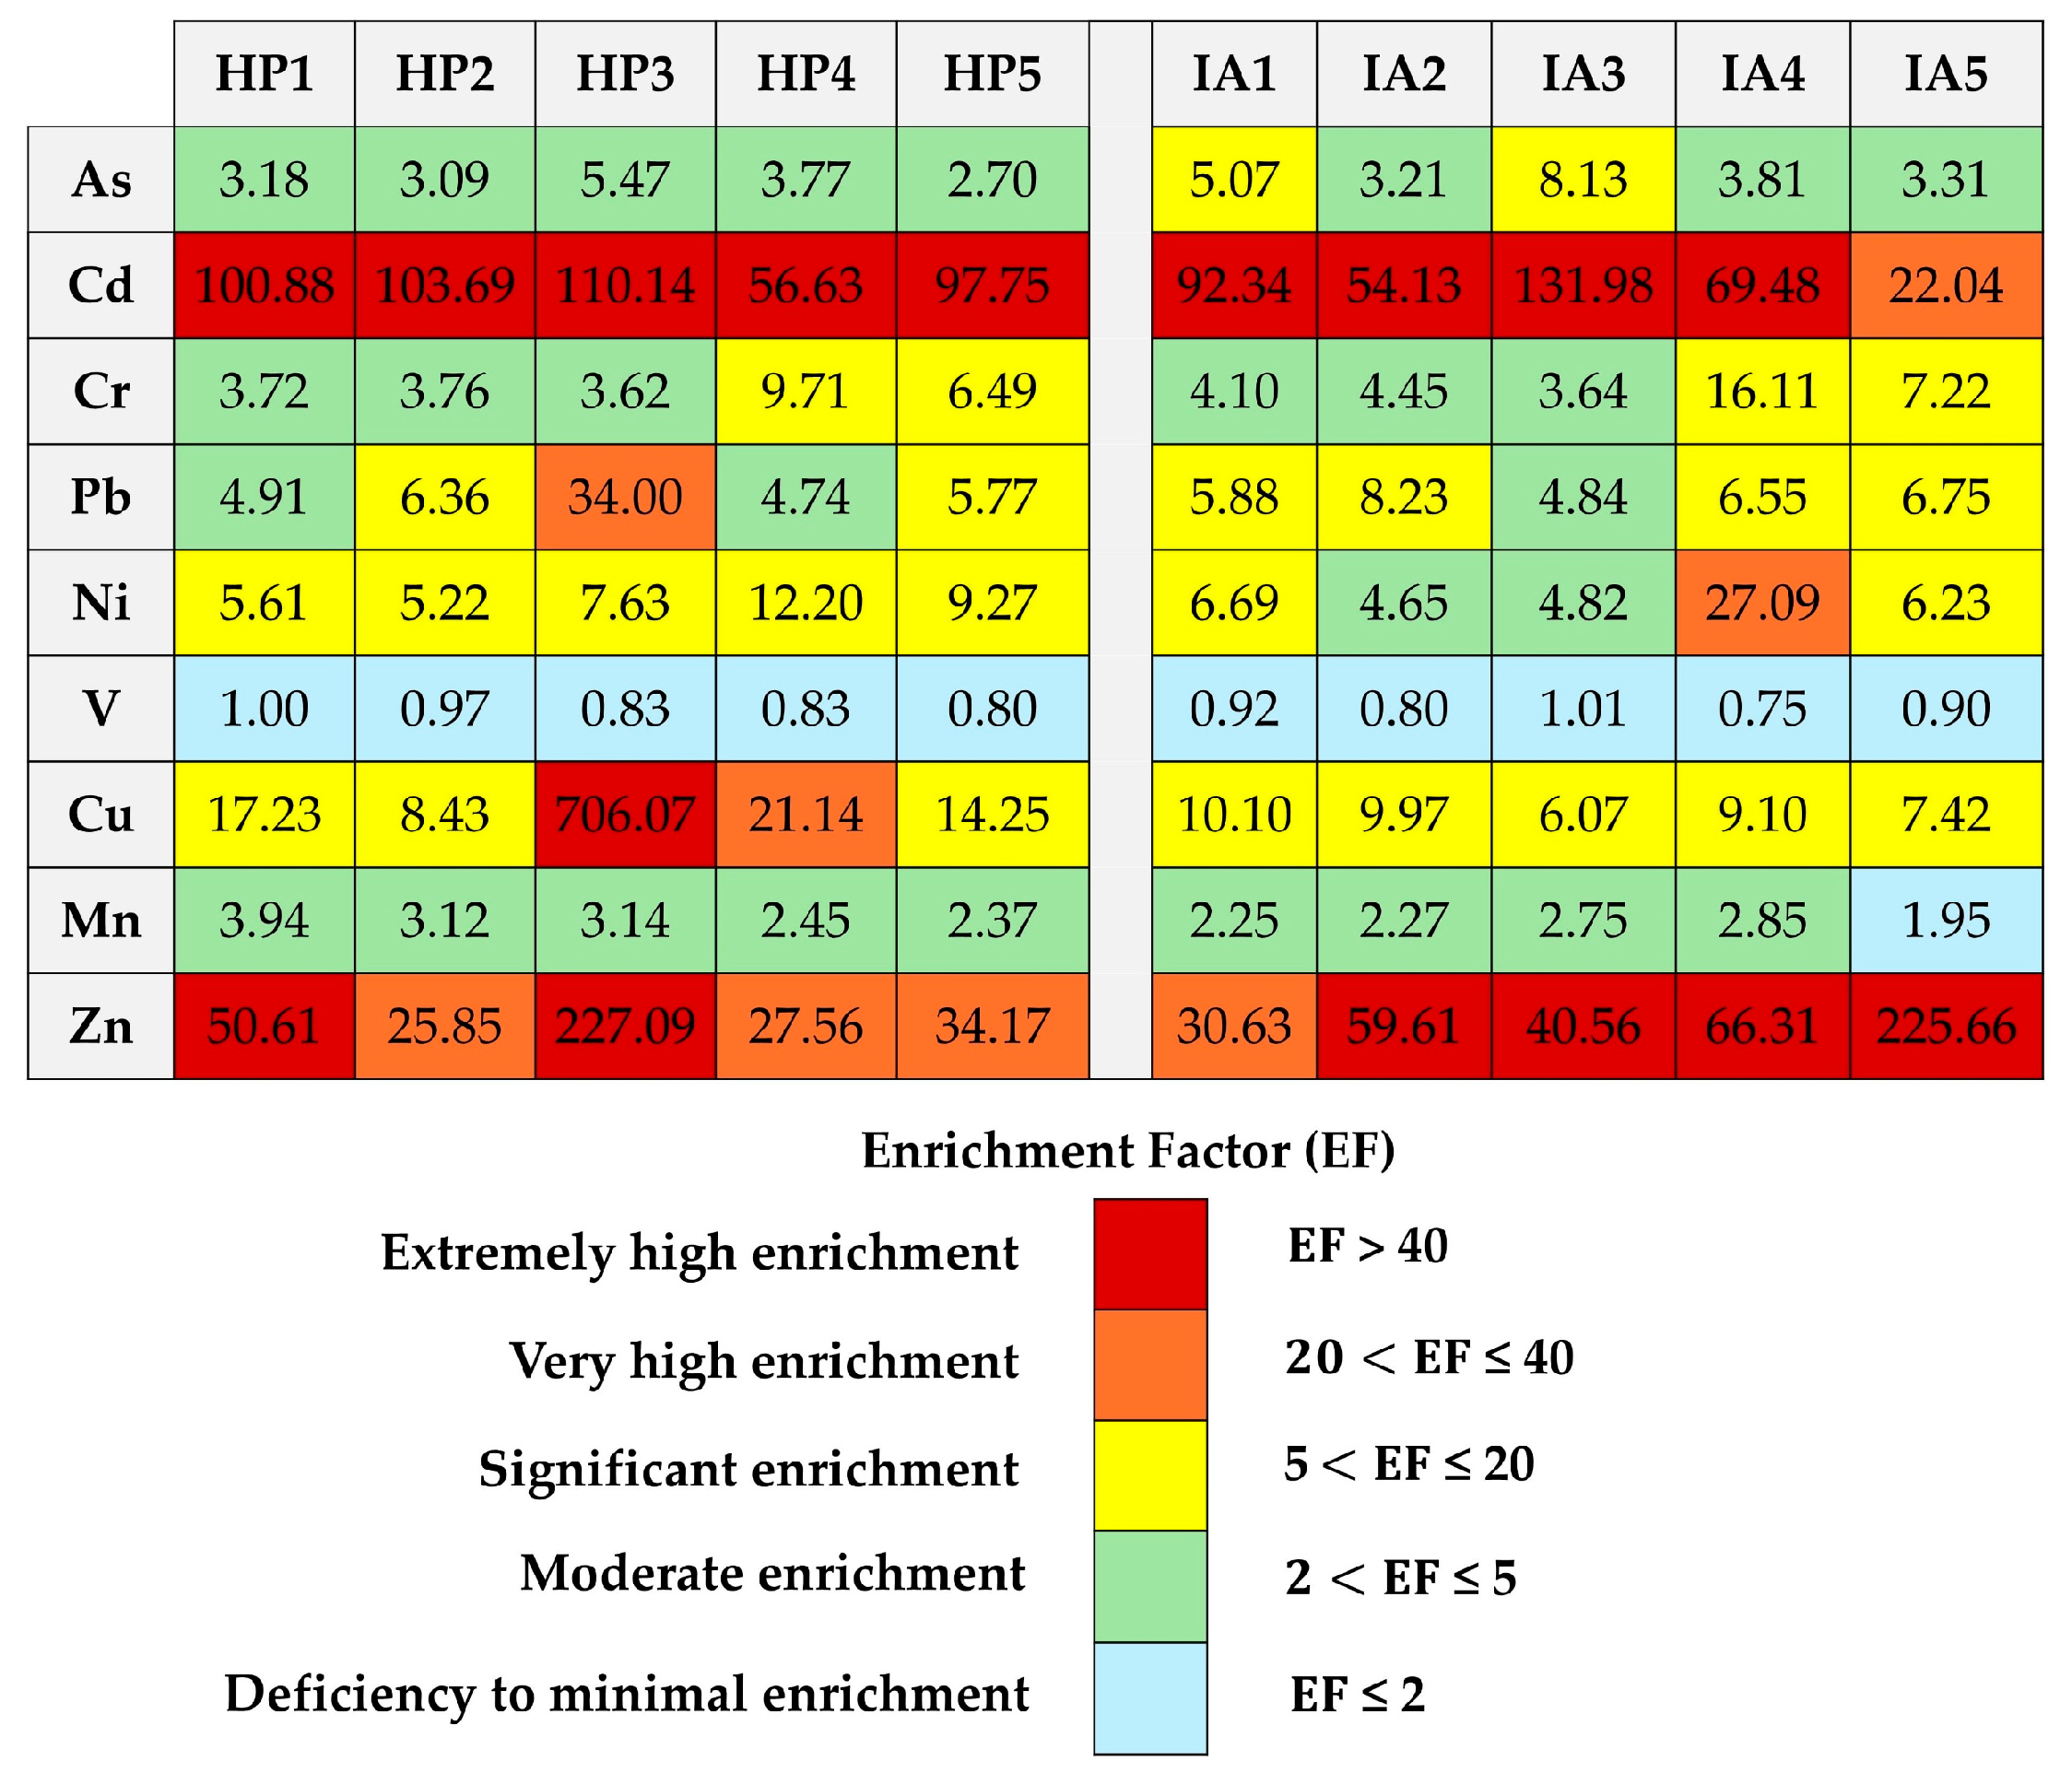
2.3.1. Enrichment Factor
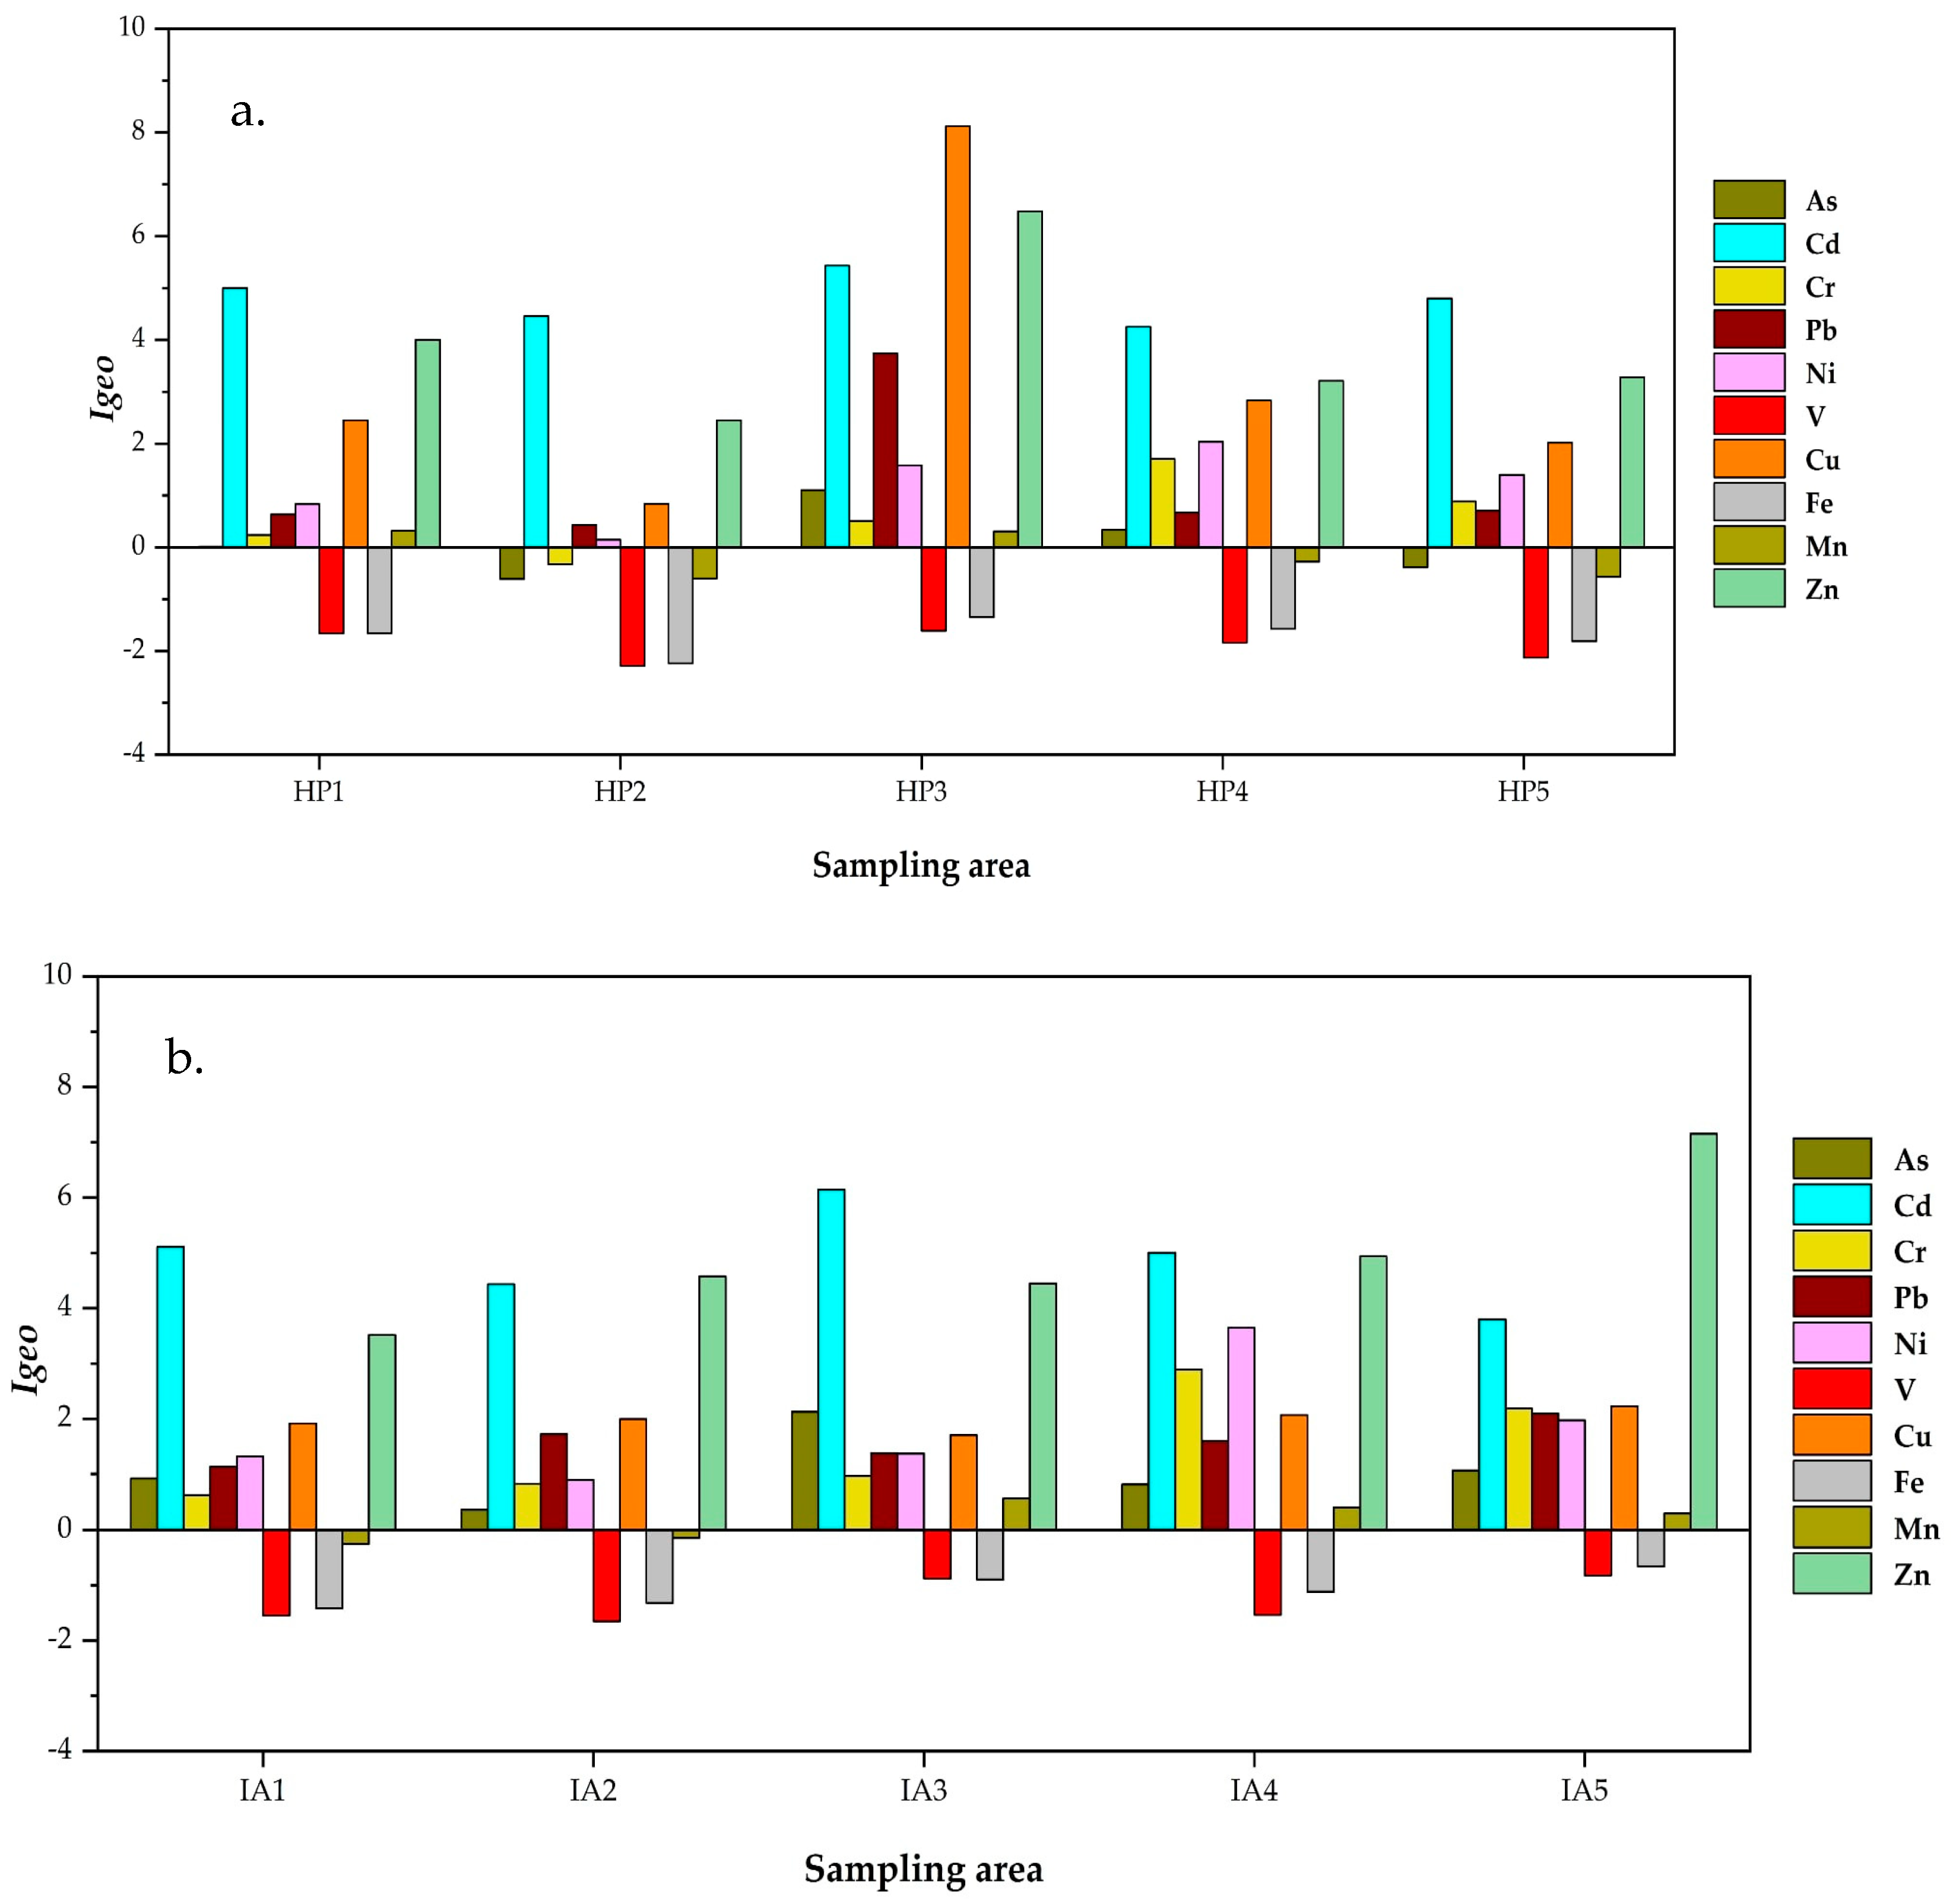
2.3.2. Geo-Accumulation Index
2.3.3. Assessment of the Potential Ecological Risk Index (RI)
2.4. Health Risk Assessment
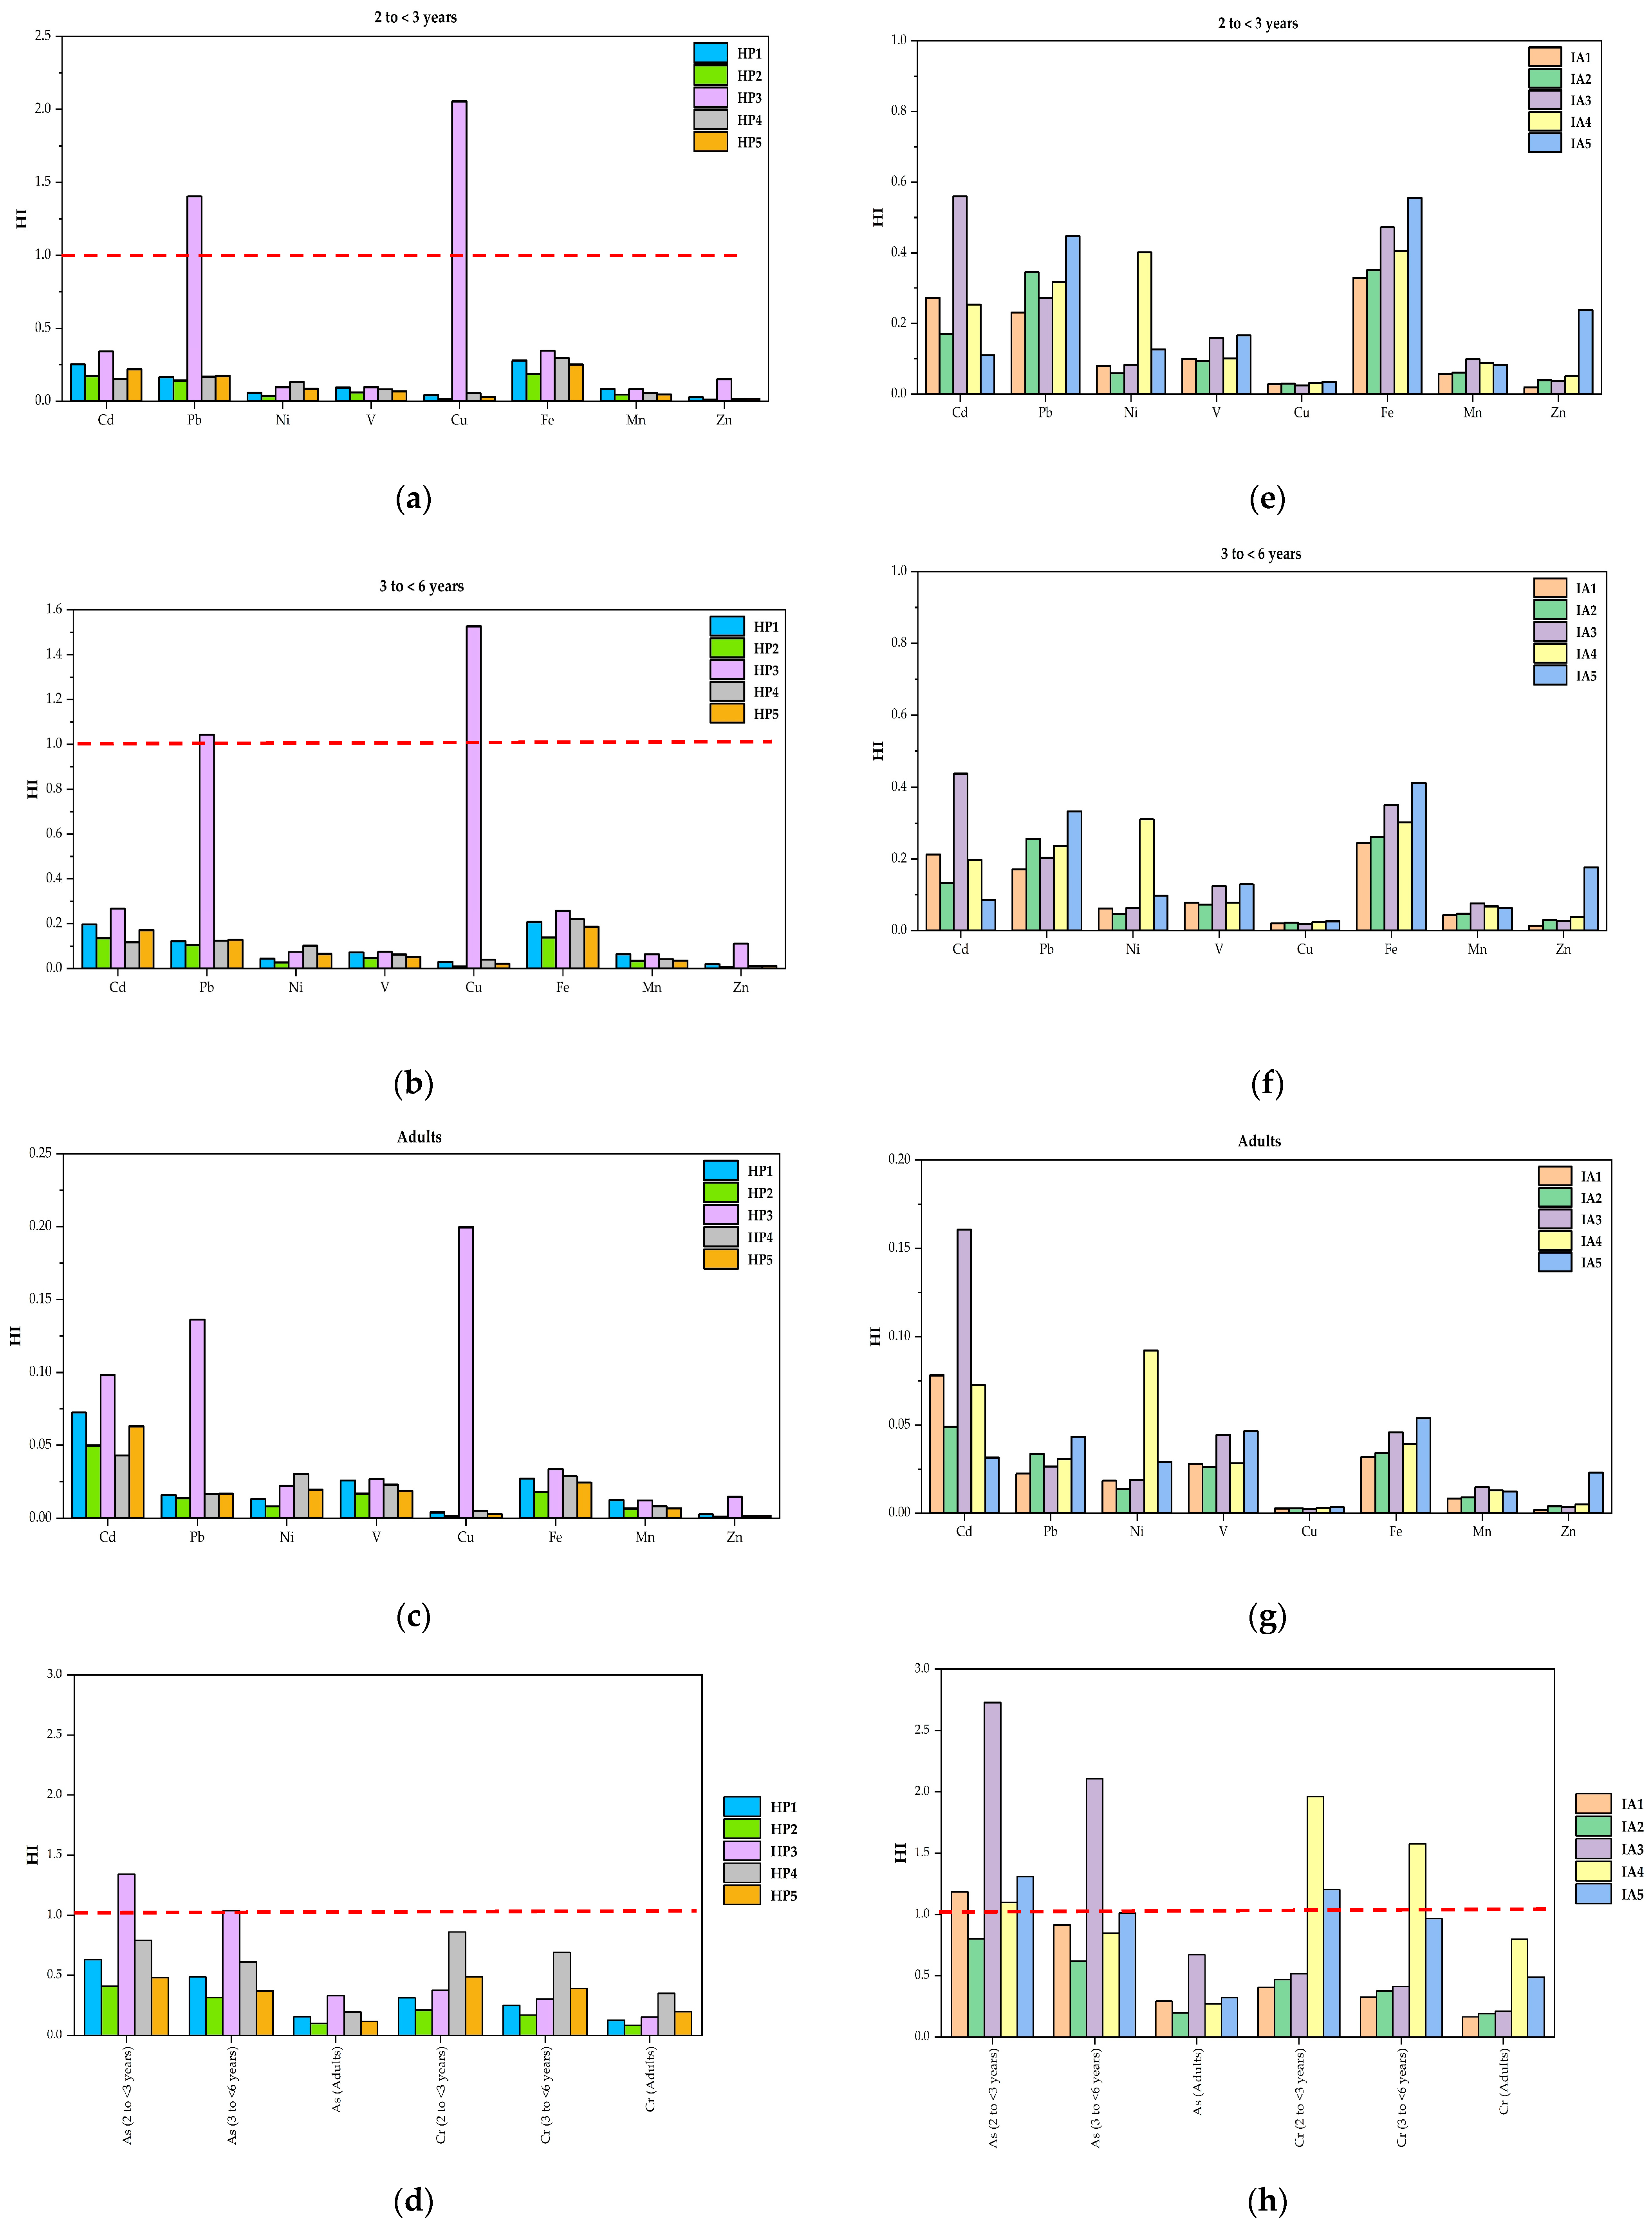
2.4.1. Non-Carcinogenic Risk Assessment
2.4.2. Carcinogenic Risk Assessment
2.5. Data Analysis
3. Results and Discussion
3.1. Concentration of Trace Elements in Indoor Dust
3.2. Assessment of Trace Elements Pollution in Indoor Dust
3.3. Source Apportionment of Indoor Child Development Centers
3.4. Health Risk Assessment of Indoor Dust
3.4.1. Non-Carcinogenic Risk of Indoor Dust
3.4.2. Carcinogenic Risk of Indoor Dust
4. Conclusions
Limitations of This Study
Supplementary Materials
Author Contributions
Funding
Institutional Review Board Statement
Informed Consent Statement
Data Availability Statement
Acknowledgments
Conflicts of Interest
References
- World Health Organization (WHO); International Agency for Research on Cancer (IARC). Occupational Exposure as a Firefighter: IARC Monographs on the Identification of Carcinogenic Hazards to Humans; IARC Monographs 132; IARC: Lyon, France, 2023; pp. 47–196.
- Roy, A.; Jha, A.K.; Kumar, A.; Bhattacharya, T.; Chakraborty, S.; Raval, N.P. Heavy metal pollution in indoor dust of residential, commercial, and industrial areas: A review of evolutionary trends. Air Qual. Atmos. Health 2024, 17, 891–918. [Google Scholar] [CrossRef]
- Maung, T.Z.; Bishop, J.E.; Holt, E.; Turner, A.M.; Pfrang, C. Indoor air pollution and the health of vulnerable groups: A systematics review focused on particulate matter (PM), volatile organic compounds (VOCs) and their effects on children and people with pre-existing lung disease. Int. J. Environ. Res. Public Health 2022, 19, 8752. [Google Scholar] [CrossRef]
- Somsunun, K.; Prapamontol, T.; Kuanpan, T.; Santijitpakdee, T.; Kohsuwan, K.; Jeytawan, N.; Thongjan, N. Health risk assessment of heavy metals in indoor household dust in urban and rural areas of Chiang Mai and Lamphun Provinces, Thailand. Toxics 2023, 11, 1018. [Google Scholar] [CrossRef]
- Zhu, Y.; Costa, M. Metals and molecular carcinogenesis. Carcinogenesis 2020, 41, 1161–1172. [Google Scholar] [CrossRef]
- Hassan, S.K.M. Metals concentrations and distribution in the household, stairs and entryway dust of some Egyptian homes. Atmos. Environ. 2012, 54, 207–215. [Google Scholar] [CrossRef]
- Jaafar, B.I.; Kadhum, S.A. Bioaccessibility and distribution of heavy metals in particles from a dust storm in Iraq. In Proceedings of the Fourth International Scientific Conference of Agriculture, Environment and Sustainable Development, Al Diwaniyah, Iraq, 17–18 May 2023. [Google Scholar]
- Health Effects Institute (HEI). State of Global Air 2024: A Special Report on Global Exposure to Air Pollution and Its Health Impacts, with a Focus on Children’s Health; Special report; Health Effects Institute: Boston, MA, USA, 2024; pp. 21–22. [Google Scholar]
- World Health Organization (WHO). Educational Course: Chemical Pollution of Indoor Air and Its Risk to Children’s Health; World Health Organization: Copenhagen, Denmark, 2021; pp. 1–136.
- Moghtaderi, T.; Aminiyan, M.M.; Alamdar, R.; Moghtaderi, M. Index-based evaluation of pollution characteristics and health risk of potentially toxic metals in schools dust of Shiraz megacity, SW Iran. Hum. Ecol. Risk Assess. Int. J. 2019, 25, 410–437. [Google Scholar] [CrossRef]
- Muhamad-Darus, F.; Nasir, R.A.; Sumari, S.M.; Ismali, Z.S.; Omar, N.A. Nursery Schools: Characterization of heavy metal content in indoor dust. Asian J. Environ. Sci. 2011, 2, 53–60. [Google Scholar] [CrossRef]
- Xu, R.; Zheng, X.; Lin, Y.; Lin, C.; Guo, Y.; Huo, X. Assessment of dust trace elements in an e-waste recycling area and related children’s health risks. Sci. Total Environ. 2021, 791, 148154. [Google Scholar] [CrossRef]
- Zhang, Z.; Liang, W.; Zheng, X.; Zhong, Q.; Hu, H.; Huo, X. Kindergarten dust heavy metal(loid) exposure associates with growth retardation in children. Environ. Sci. Pollut. Res. Int. 2023, 30, 118341–118351. [Google Scholar] [CrossRef]
- Dubey, S.; John, R.; Singh, M.; Khare, P.; Taneja, A. Seasonal variation in metals concentration associated with settled dust and their risk assessment in school children of Agra (India). Environ. Adv. 2024, 15, 100480. [Google Scholar] [CrossRef]
- Shiani, A.; Kiani, A.; Massahi, T.; Omer, A.K.; Soleimani, H. Association between exposure to heavy metals and dyslexic risk among children: A narrative review. J. Health Rep. Technol. 2024, 10, e148966. [Google Scholar] [CrossRef]
- Igra, A.M.; Warnqvist, A.; Rahman, S.M.; Ekström, E.C.; Rahman, A.; Vahter, M.; Kippler, M. Environmental metal exposure and growth to 10 years of age in a longitudinal mother-child cohort in rural Bangladesh. Environ. Int. 2021, 156, 106738. [Google Scholar] [CrossRef] [PubMed]
- Zeng, X.; Xu, X.; Boezen, H.M.; Huo, X. Children with health impairments by heavy metals in an e-waste recycling area. Chemosphere 2016, 148, 408–415. [Google Scholar] [CrossRef]
- Mitra, S.; Chakraborty, A.J.; Tareq, A.M.; Emran, T.B.; Nainu, F.; Khusro, A.; Idris, A.M.; Khandaker, M.U.; Osman, H.; Alhumaydhi, F.A.; et al. Impact of heavy metals on the environment and human health: Novel therapeutic insights to counter the toxicity. J. King Saud Univ. Sci. 2022, 34, 101865. [Google Scholar] [CrossRef]
- Capitão, C.; Martins, R.; Santos, O.; Bicho, M.; Szigeti, T.; Katsonouri, A.; Bocca, B.; Ruggieri, F.; Wasowicz, W.; Tolonen, H.; et al. Exposure to heavy metals and red blood cell parameters in children: A systematic review of observational studies. Front. Pediatr. 2022, 10, 921239. [Google Scholar] [CrossRef] [PubMed]
- Nayak, S.; Karn, N. Heavy metal exposure and neurodevelopmental disorder in children: A comprehensive review. Int. J. Sci. Res. 2025, 14, 1134–1136. [Google Scholar] [CrossRef]
- Kawichai, S.; Bootdee, S. Health risk assessment on exposure to PM2.5-bound PAHs from an urban-industrial area in Rayong City, Thailand. Open Access Maced. J. Med. Sci. 2022, 10, 1–10. [Google Scholar] [CrossRef]
- Wang, C.F.; Chang, C.Y.; Tsal, S.F. Characteristics of road dust from different sampling sites in Northern Taiwan. J. Air Waste Manag. Assoc. 2005, 55, 1236–1244. [Google Scholar] [CrossRef]
- Arar, S.; Al-Hunaiti, A.; Masad, M.H.; Maragkidou, A.; Wraith, D.; Hussein, T. Elemental contamination in indoor floor dust and its correlation with PAHs, fungi, and gram+/− bacteria. Int. J. Environ. Res. Public Health 2019, 16, 3552. [Google Scholar] [CrossRef]
- Sakunkoo, P.; Thonglua, T.; Sangkham, S.; Jirapornkul, C.; Limmongkon, Y.; Daduang, S.; Tessiri, T.; Rayubkul, J.; Thongtip, S.; Maneenin, N.; et al. Human health risk assessment of PM2.5-bound heavy metal of anthropogenic sources in the Khon Kaen province of Northeast Thailand. Heliyon 2022, 8, e09572. [Google Scholar] [CrossRef]
- Niampradit, S.; Kliengchuay, W.; Mingkhwan, R.; Worakhunpiset, S.; Kiangkoo, N.; Sudsandee, S.; Hongthong, A.; Siriratruengsuk, W.; Muangsuwan, T.; Tantrakarnapa, K. The elemental characteristics and human health risk of PM2.5 during haze episodes and non-haze episodes in Chiang Rai province, Thailand. Int. J. Environ. Res. Public Health 2022, 19, 6127. [Google Scholar] [CrossRef]
- Pongpiachan, S.; Liu, S.; Huang, R.; Zhao, Z.; Palakun, J.; Kositanont, C.; Cao, J. Variation in day-of-week and seasonal concentrations of atmospheric PM2.5-bound metals and associated health risks in Bangkok, Thailand. Arch. Environ. Contam. Toxicol. 2017, 72, 364–379. [Google Scholar] [CrossRef] [PubMed]
- Zarcinas, B.A.; Pongsakul, P.; McLaughlin, M.J.; Cozens, G. Heavy metals in soils and crops in southeast Asia. 2. Thailand. Environ. Geochem. Health 2004, 26, 359–371. [Google Scholar] [CrossRef]
- Prakongkep, N.; Suddhiprakarn, A.; Kheoruenromne, I.; Smirk, M.; Gilkes, R.J. The geochemistry of Thai paddy soils. Geoderma 2008, 144, 310–324. [Google Scholar] [CrossRef]
- Nag, R.; O’Rourke, S.M.; Cummins, E. Risk factors and assessment strategies for the evaluation of human or environmental risk from metal(loid)s—A focus on Ireland. Sci. Total Environ. 2022, 802, 149839. [Google Scholar] [CrossRef]
- Kawichai, S.; Bootdee, S.; Chantara, S. Health risk assessment and source apportionment of PM2.5-bound heavy metals in the initial eastern economic corridor (EEC): A case study of Rayong province, Thailand. Atmos. Pollut. Res. 2024, 15, 102205. [Google Scholar] [CrossRef]
- Simasuwannarong, B.; Satapanajaru, T.; Khuntong, S.; Pengthamkeerati, P. Spatial distribution and risk assessment of As, Cd, Cu, Pb, and Zn in topsoil at Rayong province, Thailand. Water Air Soil Pollut. 2012, 223, 1931–1943. [Google Scholar] [CrossRef]
- Akoto, R.; Anning, A.K. Heavy metal enrichment and potential ecological risk from different solid mine wastes at a mine site in Ghana. Environ. Adv. 2021, 3, 100028. [Google Scholar] [CrossRef]
- Dat, N.D.; Nguyen, V.T.; Vo, T.D.H.; Bui, X.T.; Bui, M.H.; Nguyen, L.S.P.; Nguyen, X.C.; Tran, A.T.K.; Nguyen, T.T.A.; Ju, Y.R.; et al. Contamination, source attribution, and potential health risks of heavy metals in street dust of a metropolitan area in Southern Vietnam. Environ. Sci. Pollut. Res. Int. 2021, 28, 50405–50419. [Google Scholar] [CrossRef]
- Luo, H.; Wang, Q.; Guan, Q.; Ma, Y.; Ni, F.; Yang, E.; Zhang, J. Heavy metal pollution levels, source apportionment and risk assessment in dust storms in key cities in Northwest China. J. Hazard. Mater. 2022, 422, 126878. [Google Scholar] [CrossRef]
- Cao, Y.; Wang, R.; Liu, Y.; Li, Y.; Jia, L.; Yang, Q.; Zeng, X.; Li, X.; Wang, Q.; Wang, R.; et al. Improved calculations of heavy metal toxicity coefficients for evaluating potential ecological risk in sediments based on seven major Chinese water systems. Toxics 2023, 11, 650. [Google Scholar] [CrossRef]
- Zhu, H.; Zhang, L.; Zhao, H.; Zhang, B.; Chen, H.; Shi, F. Ecological risk assessment of heavy metals in road dust based on improved potential ecological risk index: A case study in Zhengzhou, China. E3S Web Conf. 2020, 194, 04042. [Google Scholar] [CrossRef]
- United State Environmental Protection Agency (US-EPA). Exposure Factors Handbook: 2011 Edition (Final Report); National Center for Environmental Assessment: Washington, DC, USA, 2011; EPA/600/R-09/052F. Available online: https://cfpub.epa.gov/ncea/risk/recordisplay.cfm?deid=236252 (accessed on 25 March 2025).
- Zglobicki, W.; Telecka, M. Heavy metals in urban street dust: Health risk assessment (Lublin City, E Poland). Appl. Sci. 2021, 11, 4092. [Google Scholar] [CrossRef]
- Al-Shidi, H.K.; Al-Reasi, H.A.; Sulaiman, H. Heavy metals levels in road dust from Mucat, Oman: Relationship with traffic volumes, and ecological and health risk assessments. Int. J. Environ. Health Res. 2022, 32, 264–276. [Google Scholar] [CrossRef] [PubMed]
- Isley, C.F.; Fry, K.L.; Liu, X.; Filippelli, G.M.; Entwistle, J.A.; Martin, A.P.; Kah, M.; Meza-Figueroa, D.; Shukle, J.T.; Jabeen, K.; et al. International analysis of sources and human health risk associated with trace metal contaminants in residential indoor dust. Environ. Sci. Technol. 2022, 56, 1053–1068. [Google Scholar] [CrossRef]
- Unsal, M.H.; Ignatavičius, G.; Valiulis, A.; Prokopciuk, N.; Valskiené, R.; Valskys, V. Assessment of heavy metal contamination in dust Vilnius school: Source identification, pollution levels, and potential health risks for Children. Toxics 2024, 12, 224. [Google Scholar] [CrossRef] [PubMed]
- Rout, T.K.; Ebhin Masto, R.; Padhy, P.K.; Ram, L.C.; George, J.; Joshi, G. Heavy metals in dusts from commercial and residential areas of Jharia coal mining town. Environ. Earth Sci. 2015, 73, 347–359. [Google Scholar] [CrossRef]
- Parra, S.; Fuente-Mella, H.; González-Rojas, A.; Bravo, M.A. Exposure to environmental pollution in schools of Puchuncaví Chile: Characterization of heavy metals, health risk assessment, and effects on children’s academic performance. Sustainability 2024, 16, 2518. [Google Scholar] [CrossRef]
- Wang, P.; Hu, J.; Zhang, Q.; Ma, W.; Tian, L.; Liu, T.; Li, J.; Zheng, H.; Han, G. Source and health risks of heavy metals in kindergarten dust: The role of particle size. Environ. Res. 2024, 26, 119955. [Google Scholar] [CrossRef]
- Pollution Control Department (PCD). Laws and Standards. Available online: https://www.pcd.go.th/laws/25162/ (accessed on 4 March 2025).
- Ratchakitcha Ministry of Industry Laws: Soil and Underground Standard. Available online: https://ratchakitcha.soc.go.th/search-result (accessed on 4 March 2025).
- Ma, J.; Li, Y.; Liu, Y.; Wang, X.; Lin, C.; Cheng, H. Metal(loid) bioaccessibility and children’s health risk assessment of soil and indoor dust from rural and urban school and residential areas. Environ. Geochem. Health 2020, 42, 1291–1303. [Google Scholar] [CrossRef]
- Briffa, J.; Sinagra, E.; Blundell, R. Heavy metal pollution in the environment and their toxicological effects on humans. Heliyon 2020, 6, e04691. [Google Scholar] [CrossRef] [PubMed]
- Dingle, J.H.; Kohl, L.; Khan, N.; Meng, M.; Shi, Y.A.; Pedroza-Brambila, M.; Chow, C.W.; Chan, A.W.H. Source and composition of metals in indoor house dust in a mid-size Canadian city. Environ. Pollut. 2021, 289, 117867. [Google Scholar] [PubMed]
- Lwebue, C.M.A.; Nwose, N.; Tesi, G.O.; Olisah, C.; Ujam, O.T.; Odali, E.W.; Egobueze, F.E.; Nwajei, G.E.; Martincigh, B.S. Concentrations, sources, and health risk assessment of metals in indoor dust collected from visual arts studios of selected tertiary institutions in Southern Nigeria. Environ. Forensics 2023, 24, 55–70. [Google Scholar]
- Gul, H.K.; Gullu, G.; Babaei, P.; Nikravan, A.; Kurt-Karakus, P.B.; Salihoglu, G. Assessment of house dust trace elements and human exposure in Ankara, Turkey. Environ. Sci. Pollut. Res. 2023, 30, 7718–7735. [Google Scholar]
- Liu, B.; Huang, F.; Yu, Y.; Li, X.; He, Y.; Gao, L.; Hu, X. Heavy metals in indoor dust across China: Occurrence, sources and health risk assessment. Arch. Environ. Contam. Toxicol. 2021, 81, 67–76. [Google Scholar] [CrossRef]
- Yaparla, D.; Shiva Nagendra, S.M.; Gummadi, S.N. Characterization and health risk assessment of indoor dust in biomass and LPG-based households of rural Telangana, India. J. Air Waste Manage. Assoc. 2019, 69, 1438–1451. [Google Scholar] [CrossRef]
- Zhang, W.; Tong, Y.; Wang, H.; Chen, L.; Ou, L.; Wang, X.; Liu, G.; Zhu, Y. Emission of metals from polletized and uncompressed biomass fuels combustion in rural household stoves in China. Sci. Rep. 2014, 4, 5611. [Google Scholar]
- Han, Q.; Wang, M.; Xu, X.; Li, M.; Liu, Y.; Zhang, C.; Li, S.; Wang, M. Health risk assessment of heavy metals in road dust from the fourth-tier industrial city in central China based on Monte Carlo simulation and bioaccessibility. Ecotoxicol. Environ. Saf. 2023, 252, 114627. [Google Scholar] [CrossRef]
- Zhu, R.; Ma, G.; Cai, Y.; Chen, Y.; Yang, T.; Duan, B.; Xue, Z. Ceramic tiles with black pigment made from stainless steel plant dust: Physical properties and long-term leaching behavior of heavy metals. J. Air Waste Manag. Assoc. 2016, 66, 402–411. [Google Scholar]
- Omalaoye, J.A.; Uzairu, A.; Gimba, C.E. Heavy metal assessment of some ceramic produsts imported into Nigeria from China. Arch. Appl. Sci. Res. 2010, 2, 120–125. [Google Scholar]
- Tu, X.; Fang, X.; Fang, H.; Ye, C.; Liu, Z.; Jia, X.; He, D.; Wang, J.; Huang, H.; Zou, C.; et al. Chemical composition characteristics and source apportionment of PM2.5 in ceramic industrial base during winter. Aerosol Air Qual. Res. 2022, 22, 210390. [Google Scholar] [CrossRef]
- Rojas, J.C.; Sánchez, N.E.; Schneider, I.; Oliveira, M.L.S.; Teixeira, E.C.; Silva, L.F.O. Exposure to nanometric pollutants in primary schools: Environmental implications. Urban Clim. 2017, 27, 412–419. [Google Scholar] [CrossRef]
- Shi, T.; Wang, Y. Heavy metals in indoor dust: Spatial distribution, influencing factors, and potential health risks. Sci. Total Environ. 2021, 755, 142367. [Google Scholar] [CrossRef] [PubMed]
- Duan, J.; Tan, J. Atmospheric heavy metals and arsenic in China: Situation, sources and control policies. Atmos. Environ. 2013, 74, 93–101. [Google Scholar] [CrossRef]
- Soltani, N.; Keshavarzi, B.; Moore, F.; Cave, M.; Sorooshian, A.; Mahmoudi, M.R.; Ahmadi, M.R.; Golshani, R. In vitro bioaccessibility, phase partitioning, and health risk of potentially toxic elements in dust of an iron mining and industrial complex. Ecotoxicol. Environ. Saf. 2021, 212, 111972. [Google Scholar] [CrossRef]
- Liu, K.; Shang, Q.; Wan, C.; Song, P.; Ma, C.; Cao, L. Characteristics and sources of heavy metals in PM2.5 during a typical haze episode in rural and urban areas in Taiyuan, China. Atmosphere 2018, 9, 2. [Google Scholar] [CrossRef]
- Lee, B.K.; Hieu, N.T. Seasonal variation and sources of heavy metals in atmospheric aerosols in a residential area of Ulsan, Korea. Aerosol Air Qual. Res. 2011, 11, 679–688. [Google Scholar]
- Dimitriou, K.; Kassomenos, P. Airborne heavy metals in two cities of North Rhine Westphalia-Performing inhalation cancer risk assessment in terms of atmospheric circulation. Chemosphere 2017, 186, 78–87. [Google Scholar] [CrossRef]
- Han, X.; Lu, X.; Wu, Q.; Wu, Y. Health risks and contamination levels of heavy metals in dusts from parks and squares of an industrial city in semi-arid area of China. Int. J. Environ. Res. Public Health 2017, 14, 886. [Google Scholar] [CrossRef]
- Du, H.; Lu, X.; Han, X. Determunation of priority control factors for risk management of heavy metal(loid)s in park dust in Mianyang city. Sci. Rep. 2024, 14, 27440. [Google Scholar] [CrossRef]
- United States Environmental Protection Agency (US-EPA). Risk Assessment Guidance for Superfund Volume I Human Health Evaluation Manual (Part A). Office of Emergency and Remedial Response. Washington, DC, USA: US-EPA. 1989. Available online: https://www.epa.gov/sites/default/files/2015-09/documents/rags_a.pdf (accessed on 28 September 2024).
- United State-Environmental Protection Agency (US-EPA). Regional Screening Levels (RSL) Summary Table (TR = 1E-06, HQ = 1; November 2024). Available online: https://www.epa.gov/risk/regional-screening-levels-rsls-generic-tables (accessed on 25 December 2024).
- United State-Environmental Protection Agency (US-EPA). Health Effects Assessment Summary Tables. Available online: https://nepis.epa.gov/Exe/ZyNET.EXE?ZyActionL=Register&User=anonymous&Password=anonymous&Client=EPA&Init=1 (accessed on 25 December 2024).
- Fahimah, N.; Siti Salami, I.R.; Oginawati, K.; Mubiarto, H. Appraisal of pollution levels and non-carcinogenic health risks associated with the emergence of heavy metals in Indonesian community water for sanitation, hygiene, and consumption. Emerg. Contam. 2024, 10, 100313. [Google Scholar] [CrossRef]
- Dodge, D.E.; Harris, G.; Marty, M.A.; Siegel, D.; Mahmud, A.; Servin, A.; Yee, S.; Zuo, Y.-P.; Collin, J.F.; Salmon, A.G.; et al. Air Toxics Hot Spots Program Risk Assessment Guideline; Guidance Manual for Preparation of Health Risk Assessments; California Office of Environmental Health Hazard Assessment (OEHHA): Oakland, CA, USA, 2015; pp. 7-4–7-5.
- Chu, H.; Liu, Y.; Xu, N.; Xu, J. Concentration, sources, influencing factors and hazards of heavy metals in indoor and outdoor dust: A review. Environ. Chem. Lett. 2023, 21, 1203–1230. [Google Scholar] [CrossRef]
- Shetty, B.R.; Pai, B.J.; Salmataj, S.A.; Naik, N. Assessment of carcinogenic and non-carcinogenic risk indices of heavy metal exposure in different age group using Monte Carlo Simulation Approach. Sci. Rep. 2024, 14, 30319. [Google Scholar] [CrossRef] [PubMed]
- Yang, D.; Li, Z.; Yue, Z.; Liu, J.; Zhai, Z.; Li, Z.; Gao, M.; Hu, A.; Zhu, W.; Ding, N.; et al. Variations in sources, composition, and exposure risk of PM2.5 in both pre-heating and heating seasons. Aerosol Air Qual. Res. 2022, 2, 210333. [Google Scholar] [CrossRef]

| Site | Code | Classrooms Characteristics | GPS Position Lat-Long |
|---|---|---|---|
| Haze area (HP) | HP1 | The child development center is located within the community. The distance between the site and the highway is approximately 1.1 km. The building is a single floor with two classrooms. Its building is constructed from concrete materials. | 18°15′41.44″ N 99°31′1.405″ E |
| HP2 | The sampling site is close to a temple area, a nearby alley 8 m wide, and a T-junction road with a high level of traffic intensity. Its buildings consist of a single floor with two classrooms and are constructed from concrete materials. | 18°12′29.65″ N 99°29′26.74″ E | |
| HP3 | The child development center is located in front of a primary school area. Buildings consist of a single floor and a classroom. It is constructed from concrete materials. It is near the construction and landfilling supply store. It is approximately 153 m away from a highway. | 18°15′25.95″ N 99°28′32.98″ E | |
| HP4 | The location is close to the municipal and government offices. The distance is 362 m from the highway. The structure comprises one level and a classroom. The building is constructed of concrete materials and is located near parking areas. | 18°15′48.50″ N 99°28′28.54″ E | |
| HP5 | The sampling site is surrounded by an 8-m-wide alley and T-junction roads. This site is located within a community. Its buildings consist of one level and a classroom and are constructed from concrete materials. | 18°16′11.23″ N 99°27′59.45″ E | |
| Industrial area (IA) | IA1 | The child development center is located within a temple and a primary school. It is surrounded by the community. The structures include a single level and one educational classroom. It is composed of concrete materials and is situated between oil refineries and a coal power plant. | 12°40′25.95″ N 101°10′22.08″ E |
| IA2 | The sampling site is located inside a temple. It is close to the intersection and traffic density during rush hours. It is near petroleum and liquefied natural gas (LNG) plants. Constructed from concrete materials, it spans just one floor and contains a classroom. | 12°41′6.575″ N 101°7′0.4794″ E | |
| IA3 | The child development center is located at the primary school of the Maptaphut city municipality. It is built from concrete materials and consists of a single floor with two classrooms. The Eastern Economic Corridor (EEC) project surrounds this site with construction and land leveling for the industrial area. | 12°43′59.73″ N 101°7′21.59″ E | |
| IA4 | This site is close to an intersection and a temple. The building comprises a floor and four classrooms, built from concrete materials. It is located close to a tapioca flour factory and local market. | 12°45′13.86″ N 101°8′21.14″ E | |
| IA5 | The sampling is in a community near a highway. There is a single floor and a classroom. Its buildings are constructed from concrete materials. It is located close to the steel and iron recycling and natural gas power plants. | 12°46′33.61″ N 101°10′44.26″ E |
| Code | Concentrations of Trace Elements in Indoor Dust (mg kg−1, n = 3) | ||||||||||
|---|---|---|---|---|---|---|---|---|---|---|---|
| As | Cd | Cr | Pb | Ni | V | Cu | Fe | Mn | Zn | ||
| HP1 a | Median | 11.1 | 1.5 | 43.5 | 41.8 | 36.4 | 27.1 | 117.1 | 13,883 | 637.2 | 569.6 |
| Mean ± SD | 11.4 ± 0.5 | 1.4 ± 0.1 | 44.7 ± 2.3 | 41.0 ± 2.5 | 36.1 ± 0.7 | 26.7 ± 1.0 | 115.7 ± 3.5 | 13,956 ± 378 | 637.5 ± 6.1 | 576.1 ± 28.7 | |
| HP2 a | Median | 7.8 | 1.0 | 29.8 | 35.6 | 22.9 | 17.4 | 37.9 | 9397 | 332.3 | 197.6 |
| Mean ± SD | 7.4 ± 0.9 | 1.0 ± 0.1 | 30.1 ± 1.3 | 35.4 ± 0.5 | 22.4 ± 1.5 | 17.3 ± 0.6 | 37.8 ± 3.5 | 9318 ± 184 | 336.8 ± 14.2 | 196.4 ± 6.3 | |
| HP3 a | Median | 24.1 | 1.9 | 55.2 | 347.3 | 60.5 | 27.3 | 5865.1 | 17,275 | 630.7 | 3187.9 |
| Mean ± SD | 24.2 ± 0.3 | 2.0 ± 0.1 | 53.8 ± 5.9 | 351.1 ± 18.4 | 60.8 ± 2.3 | 27.6 ± 0.5 | 5875 ± 384 | 17,290 ± 257 | 630.9 ± 7.2 | 3203 ± 182 | |
| HP4 a | Median | 13.8 | 0.8 | 127.4 | 41.7 | 84.7 | 24.7 | 156.3 | 15,010 | 422.2 | 341.4 |
| Mean ± SD | 14.3 ± 1.0 | 0.9 ± 0.1 | 123.4 ± 14.8 | 41.9 ± 0.6 | 83.1 ± 2.9 | 23.6 ± 2.3 | 150.4 ± 15.0 | 14,784 ± 442 | 420.4 ± 8.9 | 332.4 ± 16.0 | |
| HP5 a | Median | 8.8 | 1.2 | 127.4 | 41.8 | 50.5 | 19.3 | 87.0 | 12,386 | 348.0 | 356.8 |
| Mean ± SD | 8.6 ± 0.3 | 1.2 ± 0.0 | 69.9 ± 6.0 | 43.2 ± 2.8 | 53.5 ± 8.1 | 19.3 ± 0.5 | 85.9 ± 5.7 | 12,523 ± 592 | 343.7 ± 10.9 | 349.0 ± 15.4 | |
| Median | 11.1 | 1.2 | 55.2 | 41.8 | 50.5 | 24.7 | 117.1 | 13,883 | 422.2 | 356.8 | |
| Mean ± SD | 13.2 ± 6.2 | 1.3 ± 0.4 | 64.4 ± 34.0 | 102.5 ± 128.9 | 51.2 ± 21.8 | 22.9 ± 4.3 | 1253 ± 2397 | 13,574 ± 2745 | 473.9 ± 139.1 | 931.3 ± 1184 | |
| IA1 A | Median | 21.8 | 1.6 | 60.1 | 57.5 | 51.8 | 30.4 | 80.6 | 16,690 | 432.9 | 410.6 |
| Mean ± SD | 21.3 ± 1.2 | 1.6 ± 0.1 | 58.0 ± 6.7 | 57.7 ± 1.5 | 50.6 ± 3.6 | 28.9 ± 3.1 | 79.9 ± 1.4 | 16,437 ± 456 | 428.5 ± 8.8 | 410.7 ± 10.5 | |
| IA2 A | Median | 14.1 | 1.0 | 65.0 | 86.8 | 39.9 | 27.3 | 84.0 | 17,463 | 459.0 | 852.7 |
| Mean ± SD | 14.4 ± 0.8 | 1.0 ± 0.1 | 67.2 ± 4.8 | 86.4 ± 0.8 | 37.7 ± 4.9 | 26.9 ± 0.9 | 84.3 ± 2.4 | 17,578 ± 248 | 462.6 ± 8.4 | 854.7 ± 26.3 | |
| IA3 A | Median | 47.9 | 3.1 | 74.2 | 66.3 | 52.2 | 46.5 | 67.4 | 24,796 | 761.9 | 783.1 |
| Mean ± SD | 49.2 ± 2.4 | 3.2 ± 0.1 | 74.0 ± 1.0 | 68.3 ± 4.5 | 52.5 ± 1.0 | 45.9 ± 2.3 | 69.0 ± 3.9 | 23,619 ± 316 | 754.4 ± 13.3 | 781.5 ± 10.6 | |
| IA4 A | Median | 19.5 | 1.5 | 281.8 | 58.1 | 253.4 | 29.9 | 90.4 | 20,325 | 671.0 | 1099.1 |
| Mean ± SD | 19.8 ± 0.6 | 1.4 ± 0.2 | 281.4 ± 3.5 | 79.4 ± 37.5 | 253.5 ± 0.6 | 29.1 ± 1.5 | 88.9 ± 3.6 | 20,310 ± 142 | 671.1 ± 2.8 | 1099 ± 1.5 | |
| IA5 A | Median | 24.0 | 0.6 | 166.2 | 107.0 | 78.3 | 47.2 | 95.7 | 27,645 | 628.2 | 852.7 |
| Mean ± SD | 23.6 ± 1.1 | 0.6 ± 0.2 | 172.5 ± 11.2 | 112.0 ± 11.5 | 79.8 ± 3.2 | 47.8 ± 1.3 | 99.2 ± 8.9 | 27,783 ± 420 | 628.0 ± 9.9 | 5114 ± 60.3 | |
| Median | 21.8 | 1.5 | 74.2 | 73.5 | 53.5 | 30.4 | 84.0 | 20,325 | 628.2 | 852.7 | |
| Mean ± SD | 25.7 ± 12.6 | 1.6 ± 0.9 | 130.6 ± 89.2 | 80.8 ± 24.2 | 94.8 ± 83.4 | 35.7 ± 9.6 | 84.3 ± 11.1 | 21,146 ± 4296 | 588.9 ± 129.0 | 1652 ± 1806 | |
| p-value 1 | <0.001 | 0.713 | 0.005 | 0.004 | 0.217 | <0.001 | 0.050 | <0.001 | 0.010 | 0.004 | |
| Code | Concentrations of Trace Elements in Indoor Dust (mg kg−1 ± SD) | References | |||||||||
|---|---|---|---|---|---|---|---|---|---|---|---|
| As | Cd | Cr | Pb | Ni | V | Cu | Fe | Mn | Zn | ||
| Haze area in Lampang, Thailand | 13.2 ± 6.2 | 1.3 ± 0.4 | 64.4 ± 34.0 | 102.5 ± 128.9 | 51.2 ± 21.8 | 22.9 ± 4.3 | 1253 ± 2397 | 13,574 ± 2745 | 473.9 ± 139.1 | 931.3 ± 1184 | This study |
| Industrial area in Rayong, Thailand | 25.7 ± 12.6 | 1.6 ± 0.9 | 130.6 ± 89.2 | 80.8 ± 24.2 | 94.8 ± 83.4 | 35.7 ± 9.6 | 84.3 ± 11.1 | 21,146 ± 4296 | 588.9 ± 129.0 | 1652 ± 1806 | This study |
| Schools in industrial areas, Iran | 2.8 ± 1.7 | 1.0 ± 2.3 | 172.8 ± 122.1 | 258.8 ± 268.2 | 50.1 ± 22.5 | - | 40.0 ± 22.4 | 16,946 ± 8691 | 288.9 ± 156.1 | 258.8 ± 210.6 | [10] |
| Kindergarten in an E-waste recycling town, China (in 2019 and 2020) | 6.8 and 6.3 | 1.5 and 1.4 | 155.8 and 1318 | 153.7 and 92.3 | 70.0 and 1050 | 20.2 and 22.6 | 161.7 and 234.1 | - | 421.1 and 414.4 | 2427 and 1352.9 | [13] |
| Schools in an urban area, Lithuania | 4.6–70.0 | - | 60.8–221.2 | 20.4–564.2 | - | 26.2–150.9 | 51.3–395.4 | 1569–25,649 | - | 219.5–16,131 | [41] |
| Schools in an industrial area, Puchuncaví, Chile | 39.5–331.9 | 0.6–15.1 | 373.4–505.4 | 41.8–324.5 | 103.8–164.2 | 330.5–418.4 | 276.5–54,081 | - | 636.2–889.5 | 389.4–1823 | [43] |
| Schools in an industrial area, Quintero, Chile | 43.0–76.4 | 0.6–2.3 | 307.6–594.8 | 12.8–67.6 | 96.1–179.6 | 293.5–482.5 | 143.3–1450.6 | - | 635.8–965.0 | 199.3–728.6 | [43] |
| Kindergarten in Beijing, China | - | 0.4 ± 0.2 | 81.3 ± 14.8 | 38.1 ± 18.8 | 25.6 ± 6.5 | 78.4 ± 10.3 | 41.2 ± 16.9 | - | 614.3 ± 105.0 | 239.0 ± 112.4 | [44] |
| Urban schools in Lanzhou, China | 14.7 ± 1.9 | 1.5 ± 0.4 | 70.3 ± 24.4 | 104.3 ± 31.3 | 41.8 ± 6.5 | - | 75.9 ± 26.7 | - | - | 321.8 ± 32.6 | [47] |
| Rural schools in Lanzhou, China | 14.0 ± 5.1 | 1.86 ± 1.36 | 75.0 ± 28.7 | 115.7 ± 60.5 | 32.3 ± 7.8 | - | 77.4 ± 29.3 | - | - | 385.8 ± 221.5 | [47] |
| Standard of soil | 6 | 67 | - | 400 | 436.5 | - | 2920 | - | 1710 | - | [45] |
| Standard of soil in an industrial area | 27 | 810 | 640 | 750 | 41,000 | 1000 | - | - | 32,000 | 1000 | [46] |
| Code | The Potential Ecological Risk Factor () of Trace Elements in Indoor Dust | RI | |||||||||
|---|---|---|---|---|---|---|---|---|---|---|---|
| As | Cd | Cr | Pb | Ni | V | Cu | Fe | Mn | Zn | ||
| HP1 | 15.14 | 1442.00 | 3.54 | 11.70 | 13.37 | 0.95 | 41.04 | 0.48 | 1.88 | 24.10 | 1554.0 |
| HP2 | 9.83 | 989.20 | 2.39 | 10.11 | 8.31 | 0.62 | 13.41 | 0.32 | 0.99 | 8.22 | 1043.0 |
| HP3 | 32.25 | 1950.00 | 4.27 | 100.30 | 22.52 | 0.98 | 2083.00 | 0.59 | 1.86 | 134.00 | 4330.0 |
| HP4 | 19.02 | 857.20 | 9.80 | 11.96 | 30.78 | 0.84 | 53.34 | 0.50 | 1.24 | 13.91 | 998.6 |
| HP5 | 11.52 | 1253.00 | 5.55 | 12.33 | 19.81 | 0.69 | 30.45 | 0.43 | 1.01 | 14.60 | 1350.0 |
| IA1 | 28.44 | 1554.00 | 4.60 | 16.49 | 18.76 | 1.03 | 28.32 | 0.56 | 1.26 | 17.19 | 1671.0 |
| IA2 | 19.26 | 974.30 | 5.34 | 24.70 | 13.95 | 0.96 | 29.91 | 0.60 | 1.36 | 35.76 | 1106.0 |
| IA3 | 65.56 | 3192.00 | 5.87 | 19.52 | 19.44 | 1.63 | 24.47 | 0.81 | 2.22 | 32.70 | 3364.0 |
| IA4 | 26.38 | 1445.00 | 22.33 | 22.69 | 93.88 | 1.03 | 31.54 | 0.69 | 1.97 | 45.97 | 1691.0 |
| IA5 | 31.42 | 627.00 | 13.69 | 32.01 | 29.56 | 1.70 | 35.18 | 0.95 | 1.85 | 213.98 | 987.3 |
| Trace Elements | HP | IA | |||
|---|---|---|---|---|---|
| PC1 | PC2 | PC1 | PC2 | PC3 | |
| As | 0.915 | 0.336 | −0.178 | 0.960 | −0.192 |
| Cd | 0.919 | −0.238 | −0.580 | 0.781 | −0.109 |
| Cr | −0.180 | 0.978 | 0.294 | −0.010 | 0.954 |
| Pb | 0.942 | 0.012 | 0.809 | −0.066 | 0.091 |
| Ni | 0.198 | 0.955 | −0.046 | −0.038 | 0.996 |
| V | 0.782 | 0.320 | 0.576 | 0.774 | −0.176 |
| Cu | 0.946 | 0.012 | 0.781 | −0.436 | 0.344 |
| Fe | 0.808 | 0.556 | 0.772 | 0.619 | 0.107 |
| Mn | 0.820 | −0.009 | 0.151 | 0.870 | 0.445 |
| Zn | 0.969 | 0.006 | 0.977 | 0.089 | 0.040 |
| Eigenvalues | 6.569 | 2.285 | 3.980 | 3.498 | 1.946 |
| % of Variance | 65.7 | 22.8 | 39.8 | 34.9 | 19.4 |
| Cumulative % | 65.7 | 88.5 | 39.8 | 74.7 | 94.2 |
| Major sources | Mixed source of traffic emission, road dust, and biomass burning | Industrial emissions/soil dust | Traffic emissions or road dust | Industrial emission/Fuel combustion | Coal -powerplant/soil dust |
| Code | Route | 2 to <3 Years | 3 to <6 Years | Adult | ||||||||||||
|---|---|---|---|---|---|---|---|---|---|---|---|---|---|---|---|---|
| As | Cd | Cr | Pb | Ni | As | Cd | Cr | Pb | Ni | As | Cd | Cr | Pb | Ni | ||
| HP1 | CRInh | 8.85 × 10⁻¹⁰ | 1.40 × 10⁻¹⁰ | 1.22 × 10⁻⁸ | 1.12 × 10⁻¹¹ | 2.13 × 10⁻¹⁰ | 2.24 × 10⁻⁹ | 3.55 × 10⁻¹⁰ | 3.08 × 10⁻⁸ | 2.82 × 10⁻¹¹ | 5.39 × 10⁻¹⁰ | 6.56 × 10⁻⁹ | 1.04 × 10⁻⁹ | 9.03 × 10⁻⁸ | 8.28 × 10⁻¹¹ | 1.58 × 10⁻⁹ |
| CRIng | 3.38 × 10⁻⁶ | 1.09 × 10⁻⁷ | 4.44 × 10⁻⁶ | 6.91 × 10⁻⁸ | 1.22 × 10⁻⁵ | 7.53 × 10⁻⁶ | 2.42 × 10⁻⁷ | 9.89 × 10⁻⁶ | 1.54 × 10⁻⁷ | 2.71 × 10⁻⁵ | 7.39 × 10⁻⁶ | 2.38 × 10⁻⁷ | 9.70 × 10⁻⁶ | 1.51 × 10⁻⁷ | 2.66 × 10⁻⁵ | |
| CRDermal | 6.62 × 10⁻⁷ | 1.18 × 10⁻⁸ | 1.16 × 10⁻⁶ | 4.51 × 10⁻¹⁰ | 1.99 × 10⁻⁶ | 1.84 × 10⁻⁶ | 3.26 × 10⁻⁸ | 3.21 × 10⁻⁶ | 1.25 × 10⁻⁹ | 5.51 × 10⁻⁶ | 1.65 × 10⁻⁵ | 2.93 × 10⁻⁷ | 2.88 × 10⁻⁵ | 1.12 × 10⁻⁸ | 4.94 × 10⁻⁵ | |
| TCR | 4.04 × 10⁻⁶ | 1.21 × 10⁻⁷ | 5.61 × 10⁻⁶ | 6.96 × 10⁻⁸ | 1.42 × 10⁻⁵ | 9.36 × 10⁻⁶ | 2.75 × 10⁻⁷ | 1.31 × 10⁻⁵ | 1.55 × 10⁻⁷ | 3.26 × 10⁻⁵ | 2.39 × 10⁻⁵ | 5.31 × 10⁻⁷ | 3.86 × 10⁻⁵ | 1.62 × 10⁻⁷ | 7.60 × 10⁻⁵ | |
| HP2 | CRInh | 5.74 × 10⁻¹⁰ | 9.64 × 10⁻¹¹ | 8.22 × 10⁻⁹ | 9.66 × 10⁻¹² | 1.33 × 10⁻¹⁰ | 1.45 × 10⁻⁹ | 2.43 × 10⁻¹⁰ | 2.08 × 10⁻⁸ | 2.44 × 10⁻¹¹ | 3.35 × 10⁻¹⁰ | 4.26 × 10⁻⁹ | 7.15 × 10⁻¹⁰ | 6.09 × 10⁻⁸ | 7.16 × 10⁻¹¹ | 9.83 × 10⁻¹⁰ |
| CRIng | 2.19 × 10⁻⁶ | 7.46 × 10⁻⁸ | 3.00 × 10⁻⁶ | 5.97 × 10⁻⁸ | 7.57 × 10⁻⁶ | 4.88 × 10⁻⁶ | 1.66 × 10⁻⁷ | 6.67 × 10⁻⁶ | 1.33 × 10⁻⁷ | 1.68 × 10⁻⁵ | 4.79 × 10⁻⁶ | 1.63 × 10⁻⁷ | 6.55 × 10⁻⁶ | 1.30 × 10⁻⁷ | 1.65 × 10⁻⁵ | |
| CRDermal | 4.30 × 10⁻⁷ | 8.08 × 10⁻⁹ | 7.81 × 10⁻⁷ | 3.90 × 10⁻¹⁰ | 1.23 × 10⁻⁶ | 1.19 × 10⁻⁶ | 2.24 × 10⁻⁸ | 2.16 × 10⁻⁶ | 1.08 × 10⁻⁹ | 3.42 × 10⁻⁶ | 1.07 × 10⁻⁵ | 2.01 × 10⁻⁷ | 1.94 × 10⁻⁵ | 9.69 × 10⁻⁹ | 3.07 × 10⁻⁵ | |
| TCR | 2.62 × 10⁻⁶ | 8.28 × 10⁻⁸ | 3.79 × 10⁻⁶ | 6.01 × 10⁻⁸ | 8.80 × 10⁻⁶ | 6.08 × 10⁻⁶ | 1.89 × 10⁻⁷ | 8.85 × 10⁻⁶ | 1.34 × 10⁻⁷ | 2.03 × 10⁻⁵ | 1.55 × 10⁻⁵ | 3.65 × 10⁻⁷ | 2.60 × 10⁻⁵ | 1.40 × 10⁻⁷ | 4.72 × 10⁻⁵ | |
| HP3 | CRInh | 1.89 × 10⁻⁹ | 1.90 × 10⁻¹⁰ | 1.47 × 10⁻⁸ | 9.58 × 10⁻¹¹ | 3.59 × 10⁻¹⁰ | 4.76 × 10⁻⁹ | 4.80 × 10⁻¹⁰ | 3.71 × 10⁻⁸ | 2.42 × 10⁻¹⁰ | 9.08 × 10⁻¹⁰ | 1.40 × 10⁻⁸ | 1.41 × 10⁻⁹ | 1.09 × 10⁻⁷ | 7.10 × 10⁻¹⁰ | 2.66 × 10⁻⁹ |
| CRIng | 7.20 × 10⁻⁶ | 1.47 × 10⁻⁷ | 5.35 × 10⁻⁶ | 5.93 × 10⁻⁷ | 2.05 × 10⁻⁵ | 1.60 × 10⁻⁵ | 3.27 × 10⁻⁷ | 1.19 × 10⁻⁵ | 1.32 × 10⁻⁶ | 4.57 × 10⁻⁵ | 1.57 × 10⁻⁵ | 3.21 × 10⁻⁷ | 1.17 × 10⁻⁵ | 1.29 × 10⁻⁶ | 4.48 × 10⁻⁵ | |
| CRDermal | 1.41× 10⁻⁶ | 1.59 × 10⁻⁸ | 1.40 × 10⁻⁶ | 3.87 × 10⁻⁹ | 3.35 × 10⁻⁶ | 3.91 × 10⁻⁶ | 4.41 × 10⁻⁸ | 3.87 × 10⁻⁶ | 1.07 × 10⁻⁸ | 9.28 × 10⁻⁶ | 3.51 × 10⁻⁵ | 3.96 × 10⁻⁷ | 3.47 × 10⁻⁵ | 9.62 × 10⁻⁸ | 8.32 × 10⁻⁵ | |
| TCR | 8.62 × 10⁻⁶ | 1.63 × 10⁻⁷ | 6.76 × 10⁻⁶ | 5.96 × 10⁻⁷ | 2.39 × 10⁻⁵ | 2.00 × 10⁻⁵ | 3.72 × 10⁻⁷ | 1.58 × 10⁻⁵ | 1.33 × 10⁻⁶ | 5.50 × 10⁻⁵ | 5.08 × 10⁻⁵ | 7.19 × 10⁻⁷ | 4.65 × 10⁻⁵ | 1.39 × 10⁻⁶ | 1.28 × 10⁻⁴ | |
| HP4 | CRInh | 1.11 × 10⁻⁹ | 8.35 × 10⁻¹¹ | 3.37 × 10⁻⁸ | 1.14 × 10⁻¹¹ | 4.91 × 10⁻¹⁰ | 2.81 × 10⁻⁹ | 2.11 × 10⁻¹⁰ | 8.51 × 10⁻⁸ | 2.89 × 10⁻¹¹ | 1.24 × 10⁻⁹ | 8.24 × 10⁻⁹ | 6.19 × 10⁻¹⁰ | 2.50 × 10⁻⁷ | 8.47 × 10⁻¹¹ | 3.64 × 10⁻⁹ |
| CRIng | 4.25 × 10⁻⁶ | 6.47 × 10⁻⁸ | 1.23 × 10⁻⁵ | 7.07 × 10⁻⁸ | 2.81 × 10⁻⁵ | 9.45 × 10⁻⁶ | 1.44 × 10⁻⁷ | 2.73 × 10⁻⁵ | 1.57 × 10⁻⁷ | 6.24 × 10⁻⁵ | 9.28 × 10⁻⁶ | 1.41 × 10⁻⁷ | 2.68 × 10⁻⁵ | 1.54 × 10⁻⁷ | 6.13 × 10⁻⁵ | |
| CRDermal | 8.32 × 10⁻⁷ | 7.00 × 10⁻⁹ | 3.20 × 10⁻⁶ | 4.61 × 10⁻¹⁰ | 4.58 × 10⁻⁶ | 2.31 × 10⁻⁶ | 1.94 × 10⁻⁸ | 8.87 × 10⁻⁶ | 1.28 × 10⁻⁹ | 1.27 × 10⁻⁵ | 2.07 × 10⁻⁵ | 1.74 × 10⁻⁷ | 7.95 × 10⁻⁵ | 1.15 × 10⁻⁸ | 1.14 × 10⁻⁴ | |
| TCR | 5.08 × 10⁻⁶ | 7.18 × 10⁻⁸ | 1.55 × 10⁻⁵ | 7.11 × 10⁻⁸ | 3.26 × 10⁻⁵ | 1.18 × 10⁻⁵ | 1.64 × 10⁻⁷ | 3.63 × 10⁻⁵ | 1.59 × 10⁻⁷ | 7.51 × 10⁻⁵ | 3.00 × 10⁻⁵ | 3.16 × 10⁻⁷ | 1.07 × 10⁻⁴ | 1.66 × 10⁻⁷ | 1.75 × 10⁻⁴ | |
| HP5 | CRInh | 6.74 × 10⁻¹⁰ | 1.22 × 10⁻¹⁰ | 1.91 × 10⁻⁸ | 1.18 × 10⁻¹¹ | 3.16 × 10⁻¹⁰ | 1.70 × 10⁻⁹ | 3.08 × 10⁻¹⁰ | 4.82 × 10⁻⁸ | 2.97 × 10⁻¹¹ | 7.99 × 10⁻¹⁰ | 4.99 × 10⁻⁹ | 9.05 × 10⁻¹⁰ | 1.41 × 10⁻⁷ | 8.73 × 10⁻¹¹ | 2.34 × 10⁻⁹ |
| CRIng | 2.57 × 10⁻⁶ | 9.46 × 10⁻⁸ | 6.96 × 10⁻⁶ | 7.28 × 10⁻⁸ | 1.81 × 10⁻⁵ | 5.73 × 10⁻⁶ | 2.10 × 10⁻⁷ | 1.55 × 10⁻⁵ | 1.62 × 10⁻⁷ | 4.02 × 10⁻⁵ | 5.62 × 10⁻⁶ | 2.07 × 10⁻⁷ | 1.52 × 10⁻⁵ | 1.59 × 10⁻⁷ | 3.94 × 10⁻⁵ | |
| CRDermal | 5.04 × 10⁻⁷ | 1.02 × 10⁻⁸ | 1.81 × 10⁻⁶ | 4.75 × 10⁻¹⁰ | 2.95 × 10⁻⁶ | 1.40 × 10⁻⁶ | 2.84 × 10⁻⁸ | 5.03 × 10⁻⁶ | 1.32 × 10⁻⁹ | 8.17 × 10⁻⁶ | 1.25 × 10⁻⁵ | 2.54 × 10⁻⁷ | 4.51 × 10⁻⁵ | 1.18 × 10⁻⁸ | 7.32 × 10⁻⁵ | |
| TCR | 3.08 × 10⁻⁶ | 1.05 × 10⁻⁷ | 8.79 × 10⁻⁶ | 7.33 × 10⁻⁸ | 2.10 × 10⁻⁵ | 7.13 × 10⁻⁶ | 2.39 × 10⁻⁷ | 2.06 × 10⁻⁵ | 1.63 × 10⁻⁷ | 4.83 × 10⁻⁵ | 1.82 × 10⁻⁵ | 4.62 × 10⁻⁷ | 6.04 × 10⁻⁵ | 1.71 × 10⁻⁷ | 1.13 × 10⁻⁴ | |
| Code | Route | 2 to <3 Years | 3 to <6 Years | Adult | ||||||||||||
|---|---|---|---|---|---|---|---|---|---|---|---|---|---|---|---|---|
| As | Cd | Cr | Pb | Ni | As | Cd | Cr | Pb | Ni | As | Cd | Cr | Pb | Ni | ||
| IA1 | CRInh | 1.66 × 10⁻⁹ | 1.51 × 10⁻¹⁰ | 1.58 × 10⁻⁸ | 1.57 × 10⁻¹¹ | 2.99 × 10⁻¹⁰ | 4.20 × 10⁻⁹ | 3.83 × 10⁻¹⁰ | 4.00 × 10⁻⁸ | 3.98 × 10⁻¹¹ | 7.56 × 10⁻¹⁰ | 1.23 × 10⁻⁸ | 1.12 × 10⁻⁹ | 1.17 × 10⁻⁷ | 1.17 × 10⁻¹⁰ | 2.22 × 10⁻⁹ |
| CRIng | 6.35 × 10⁻⁶ | 1.17 × 10⁻⁷ | 5.77 × 10⁻⁶ | 9.74 × 10⁻⁸ | 1.71 × 10⁻⁵ | 1.41 × 10⁻⁵ | 2.61 × 10⁻⁷ | 1.28 × 10⁻⁵ | 2.17 × 10⁻⁷ | 3.80 × 10⁻⁵ | 1.39 × 10⁻⁵ | 2.56 × 10⁻⁷ | 1.26 × 10⁻⁵ | 2.13 × 10⁻⁷ | 3.73 × 10⁻⁵ | |
| CRDermal | 1.24 × 10⁻⁶ | 1.27 × 10⁻⁸ | 1.50 × 10⁻⁶ | 6.36 × 10⁻¹⁰ | 2.79 × 10⁻⁶ | 3.45 × 10⁻⁶ | 3.52 × 10⁻⁸ | 4.17 × 10⁻⁶ | 1.76 × 10⁻⁹ | 7.73 × 10⁻⁶ | 3.09 × 10⁻⁵ | 3.15 × 10⁻⁷ | 3.74 × 10⁻⁵ | 1.58 × 10⁻⁸ | 6.93 × 10⁻⁵ | |
| TCR | 7.60 × 10⁻⁶ | 1.30 × 10⁻⁷ | 7.29 × 10⁻⁶ | 9.81 × 10⁻⁸ | 1.99 × 10⁻⁵ | 1.76 × 10⁻⁵ | 2.97 × 10⁻⁷ | 1.71 × 10⁻⁵ | 2.19 × 10⁻⁷ | 4.58 × 10⁻⁵ | 4.48 × 10⁻⁵ | 5.73 × 10⁻⁷ | 5.01 × 10⁻⁵ | 2.29 × 10⁻⁷ | 1.07 × 10⁻⁴ | |
| IA2 | CRInh | 1.13 × 10⁻⁹ | 9.49 × 10⁻¹¹ | 1.83 × 10⁻⁸ | 2.36 × 10⁻¹¹ | 2.23 × 10⁻¹⁰ | 2.84 × 10⁻⁹ | 2.40 × 10⁻¹⁰ | 4.63 × 10⁻⁸ | 5.96 × 10⁻¹¹ | 5.62 × 10⁻¹⁰ | 8.35 × 10⁻⁹ | 7.04 × 10⁻¹⁰ | 1.36 × 10⁻⁷ | 1.75 × 10⁻¹⁰ | 1.65 × 10⁻⁹ |
| CRIng | 4.30 × 10⁻⁶ | 7.35 × 10⁻⁸ | 6.69 × 10⁻⁶ | 1.46 × 10⁻⁷ | 1.27 × 10⁻⁵ | 9.57 × 10⁻⁶ | 1.64 × 10⁻⁷ | 1.49 × 10⁻⁵ | 3.25 × 10⁻⁷ | 2.83 × 10⁻⁵ | 9.40 × 10⁻⁶ | 1.61 × 10⁻⁷ | 1.46 × 10⁻⁵ | 3.19 × 10⁻⁷ | 2.78 × 10⁻⁵ | |
| CRDermal | 8.42 × 10⁻⁷ | 7.95 × 10⁻⁹ | 1.74 × 10⁻⁶ | 9.52 × 10⁻¹⁰ | 2.07 × 10⁻⁶ | 2.34 × 10⁻⁶ | 2.21 × 10⁻⁸ | 4.83 × 10⁻⁶ | 2.64 × 10⁻⁹ | 5.75 × 10⁻⁶ | 2.09 × 10⁻⁵ | 1.98 × 10⁻⁷ | 4.33 × 10⁻⁵ | 2.37 × 10⁻⁸ | 5.16 × 10⁻⁵ | |
| TCR | 5.14 × 10⁻⁶ | 8.15 × 10⁻⁸ | 8.45 × 10⁻⁶ | 1.47 × 10⁻⁷ | 1.48 × 10⁻⁵ | 1.19 × 10⁻⁵ | 1.86 × 10⁻⁷ | 1.98 × 10⁻⁵ | 3.27 × 10⁻⁷ | 3.40 × 10⁻⁵ | 3.03 × 10⁻⁵ | 3.59 × 10⁻⁷ | 5.81 × 10⁻⁵ | 3.43 × 10⁻⁷ | 7.93 × 10⁻⁵ | |
| IA3 | CRInh | 3.83 × 10⁻⁹ | 3.11 × 10⁻¹⁰ | 2.02 × 10⁻⁸ | 1.86 × 10⁻¹¹ | 3.10 × 10⁻¹⁰ | 9.68 × 10⁻⁹ | 7.86 × 10⁻¹⁰ | 5.10 × 10⁻⁸ | 4.71 × 10⁻¹¹ | 7.84 × 10⁻¹⁰ | 2.84 × 10⁻⁸ | 2.31 × 10⁻⁹ | 1.50 × 10⁻⁷ | 1.38 × 10⁻¹⁰ | 2.30 × 10⁻⁹ |
| CRIng | 1.46 × 10⁻⁵ | 2.41 × 10⁻⁷ | 7.36 × 10⁻⁶ | 1.15 × 10⁻⁷ | 1.77 × 10⁻⁵ | 3.26 × 10⁻⁵ | 5.36 × 10⁻⁷ | 1.64 × 10⁻⁵ | 2.57 × 10⁻⁷ | 3.94 × 10⁻⁵ | 3.20 × 10⁻⁵ | 5.26 × 10⁻⁷ | 1.61 × 10⁻⁵ | 2.52 × 10⁻⁷ | 3.87 × 10⁻⁵ | |
| CRDermal | 2.87 × 10⁻⁶ | 2.61 × 10⁻⁸ | 1.92 × 10⁻⁶ | 7.52 × 10⁻¹⁰ | 2.89 × 10⁻⁶ | 7.95 × 10⁻⁶ | 7.23 × 10⁻⁸ | 5.32 × 10⁻⁶ | 2.09 × 10⁻⁹ | 8.01 × 10⁻⁶ | 7.13 × 10⁻⁵ | 6.48 × 10⁻⁷ | 4.77 × 10⁻⁵ | 1.87 × 10⁻⁸ | 7.19 × 10⁻⁵ | |
| TCR | 1.75 × 10⁻⁵ | 2.67 × 10⁻⁷ | 9.29 × 10⁻⁶ | 1.16 × 10⁻⁷ | 2.06 × 10⁻⁵ | 4.06 × 10⁻⁵ | 6.09 × 10⁻⁷ | 2.17 × 10⁻⁵ | 2.59 × 10⁻⁷ | 4.74 × 10⁻⁵ | 1.03 × 10⁻⁴ | 1.18 × 10⁻⁶ | 6.39 × 10⁻⁵ | 2.71 × 10⁻⁷ | 1.11 × 10⁻⁴ | |
| IA4 | CRInh | 1.54 × 10⁻⁹ | 1.41 × 10⁻¹⁰ | 7.68 × 10⁻⁸ | 2.17 × 10⁻¹¹ | 1.50 × 10⁻⁹ | 3.90 × 10⁻⁹ | 3.56 × 10⁻¹⁰ | 1.94 × 10⁻⁷ | 5.47 × 10⁻¹¹ | 3.79 × 10⁻⁹ | 1.14 × 10⁻⁸ | 1.04 × 10⁻⁹ | 5.69 × 10⁻⁷ | 1.61 × 10⁻¹⁰ | 1.11 × 10⁻⁸ |
| CRIng | 5.89 × 10⁻⁶ | 1.09 × 10⁻⁷ | 2.80 × 10⁻⁵ | 1.34 × 10⁻⁷ | 8.56 × 10⁻⁵ | 1.31 × 10⁻⁵ | 2.43 × 10⁻⁷ | 6.23 × 10⁻⁵ | 2.98 × 10⁻⁷ | 1.90 × 10⁻⁴ | 1.29 × 10⁻⁵ | 2.38 × 10⁻⁷ | 6.11 × 10⁻⁵ | 2.93 × 10⁻⁷ | 1.87 × 10⁻⁴ | |
| CRDermal | 1.15 × 10⁻⁶ | 1.18 × 10⁻⁸ | 7.29 × 10⁻⁶ | 8.75 × 10⁻¹⁰ | 1.40 × 10⁻⁵ | 3.20 × 10⁻⁶ | 3.27 × 10⁻⁸ | 2.02 × 10⁻⁵ | 2.43 × 10⁻⁹ | 3.87 × 10⁻⁵ | 2.87 × 10⁻⁵ | 2.93 × 10⁻⁷ | 1.81 × 10⁻⁴ | 2.18 × 10⁻⁸ | 3.47 × 10⁻⁴ | |
| TCR | 7.05 × 10⁻⁶ | 1.21 × 10⁻⁷ | 3.54 × 10⁻⁵ | 1.35 × 10⁻⁷ | 9.95 × 10⁻⁵ | 1.63 × 10⁻⁵ | 2.76 × 10⁻⁷ | 8.27 × 10⁻⁵ | 3.01 × 10⁻⁷ | 2.29 × 10⁻⁴ | 4.16 × 10⁻⁵ | 5.32 × 10⁻⁷ | 2.43 × 10⁻⁴ | 3.15 × 10⁻⁷ | 5.34 × 10⁻⁴ | |
| IA5 | CRInh | 1.84 × 10⁻⁹ | 6.11 × 10⁻¹¹ | 4.71 × 10⁻⁸ | 3.06 × 10⁻¹¹ | 4.72 × 10⁻¹⁰ | 4.64 × 10⁻⁹ | 1.54 × 10⁻¹⁰ | 1.19 × 10⁻⁷ | 7.72 × 10⁻¹¹ | 1.19 × 10⁻⁹ | 1.36 × 10⁻⁸ | 4.53 × 10⁻¹⁰ | 3.49 × 10⁻⁷ | 2.27 × 10⁻¹⁰ | 3.50 × 10⁻⁹ |
| CRIng | 7.02 × 10⁻⁶ | 4.73 × 10⁻⁸ | 1.72 × 10⁻⁵ | 1.89 × 10⁻⁷ | 2.69 × 10⁻⁵ | 1.56 × 10⁻⁵ | 1.05 × 10⁻⁷ | 3.82 × 10⁻⁵ | 4.21 × 10⁻⁷ | 6.00 × 10⁻⁵ | 1.53 × 10⁻⁵ | 1.03 × 10⁻⁷ | 3.75 × 10⁻⁵ | 4.13 × 10⁻⁷ | 5.88 × 10⁻⁴ | |
| CRDermal | 1.37 × 10⁻⁶ | 5.12 × 10⁻⁹ | 4.47 × 10⁻⁶ | 1.23 × 10⁻⁹ | 4.40 × 10⁻⁶ | 3.81 × 10⁻⁶ | 1.42 × 10⁻⁸ | 1.24 × 10⁻⁵ | 3.42 × 10⁻⁹ | 1.22 × 10⁻⁵ | 3.42 × 10⁻⁵ | 1.27 × 10⁻⁷ | 1.11 × 10⁻⁴ | 3.07 × 10⁻⁸ | 1.09 × 10⁻⁴ | |
| TCR | 8.39 × 10⁻⁶ | 5.25 × 10⁻⁸ | 2.17 × 10⁻⁵ | 1.90 × 10⁻⁷ | 3.13 × 10⁻⁵ | 1.94 × 10⁻⁵ | 1.20 × 10⁻⁷ | 5.07 × 10⁻⁵ | 4.24 × 10⁻⁷ | 7.21 × 10⁻⁵ | 4.95 × 10⁻⁵ | 2.31 × 10⁻⁷ | 1.49 × 10⁻⁴ | 4.44 × 10⁻⁷ | 1.68 × 10⁻⁴ | |
Disclaimer/Publisher’s Note: The statements, opinions and data contained in all publications are solely those of the individual author(s) and contributor(s) and not of MDPI and/or the editor(s). MDPI and/or the editor(s) disclaim responsibility for any injury to people or property resulting from any ideas, methods, instructions or products referred to in the content. |
© 2025 by the authors. Licensee MDPI, Basel, Switzerland. This article is an open access article distributed under the terms and conditions of the Creative Commons Attribution (CC BY) license (https://creativecommons.org/licenses/by/4.0/).
Share and Cite
Bootdee, S.; Sillapapiromsuk, S.; Kawichai, S. Trace Elements in Indoor Dust Exposure from Child Development Centers and Health Risk Assessment in Haze and Industrial Areas, Thailand. Toxics 2025, 13, 547. https://doi.org/10.3390/toxics13070547
Bootdee S, Sillapapiromsuk S, Kawichai S. Trace Elements in Indoor Dust Exposure from Child Development Centers and Health Risk Assessment in Haze and Industrial Areas, Thailand. Toxics. 2025; 13(7):547. https://doi.org/10.3390/toxics13070547
Chicago/Turabian StyleBootdee, Susira, Sopittaporn Sillapapiromsuk, and Sawaeng Kawichai. 2025. "Trace Elements in Indoor Dust Exposure from Child Development Centers and Health Risk Assessment in Haze and Industrial Areas, Thailand" Toxics 13, no. 7: 547. https://doi.org/10.3390/toxics13070547
APA StyleBootdee, S., Sillapapiromsuk, S., & Kawichai, S. (2025). Trace Elements in Indoor Dust Exposure from Child Development Centers and Health Risk Assessment in Haze and Industrial Areas, Thailand. Toxics, 13(7), 547. https://doi.org/10.3390/toxics13070547