Abstract
To investigate the levels of polychlorinated biphenyls (PCBs) in the black soils of Northeast China, we collected 59 surface soil samples from the central black soil region of Jilin Province. We analyzed the concentrations and sources of seven PCBs in the black soil, assessed the ecological risks associated with PCB contamination, and provided a risk assessment for PCBs in this soil type. The mean concentrations of the seven PCBs (PCB28, PCB52, PCB101, PCB118, PCB138, PCB153, and PCB180) were as follows: 1.61 μg/kg, 10.61 μg/kg, 0.37 μg/kg, 4.11 μg/kg, 0.70 μg/kg, 1.07 μg/kg, and 2.09 μg/kg, respectively. Principal component analysis revealed that PCB contamination in black soil is mainly attributed to automobile exhaust emissions during transportation, waste incineration processes, and insulation materials from electronic and electrical equipment. PCB28 and PCB52 are the primary causes of PCB danger, according to the findings of the ecological risk assessment, with Liaoyuan City having the highest risk. By applying contemporary industrial economic theory to analyze the annual accumulation of contaminants, we forecasted future PCB concentrations in black soil and issued a risk warning for these seven PCBs. Our results indicate that under the three scenarios considered, the presence of these seven PCBs in black soil does not pose a significant risk. However, given that our study examined only seven PCBs, the actual environmental risk may be underestimated.
1. Introduction
Polychlorinated biphenyls (PCBs) are designated as synthetic aromatic molecules composed of carbon, hydrogen, and chlorine [1]. Owing to their high thermal stability and excellent electrical insulation properties, PCBs have been widely utilized in applications such as additives in pesticides, plasticizers, and insulation materials [2,3,4]. As persistent organic pollutants, PCBs can present health risks to humans, even at low concentrations [5,6]. Existing studies have demonstrated that exposure to polychlorinated biphenyls (PCBs) can lead to tumors, immune deficiencies, endocrine disorders, gastrointestinal diseases, and liver diseases [7,8]. While many countries have completely banned the production and use of PCBs, legacy contamination remains a significant issue. The rapid advancement of industry has led to an increase in waste and pollutants being converted into PCBs and related compounds, which subsequently enter the soil via diverse pathways. Given the propensity of organic pollutants to be adsorbed by soil particles [9,10], researchers have identified soil as a crucial medium for the detection of PCBs, serving as a significant sink for these contaminants [11].
Several researchers have explored the concentrations, sources, ecological hazards, and health risks associated with PCBs across diverse environmental matrices, such as water bodies [12,13,14,15], soil [16,17], and the atmosphere [18,19,20]. PCB concentrations were determined following EU standard methods [21], and their sources were analyzed using principal component analysis [6,13]. The ecological hazard level was assessed using the risk quotient (RQ) [6] and the contamination severity index (CSI) [22], whereas health risks were evaluated based on the health quotient (HQ), as outlined by the U.S. Environmental Protection Agency [23]. The notable variations in PCB concentrations observed across different regions can likely be attributed to differences in economic development, population density, and the specific locations of sampling sites.
China’s agricultural development predominantly focuses on the Northeast region, which is renowned for its fertile black soil. This black soil plays a crucial role in China’s agricultural productivity. However, in recent years, rapid industrial growth coupled with the extensive use of pesticides in agricultural practices has led to the detection of PCBs in this fertile soil. Unlike many other organic pollutants, PCBs can present health risks to humans, even at very low concentrations. Furthermore, PCBs can enter the human body via the consumption of crops and other agricultural produce, potentially causing health problems. Consequently, assessing the risk posed by PCB residues in the black soil of central Jilin Province is essential. Previous studies have predicted the future risks of pollutants using methods such as mass balance models [24] and machine learning [25,26]. However, the performance of these methods varies significantly and is limited by data availability. In this study, a dynamic relationship model between economic activity and ecological risk is established by using GDP as a proxy variable for pollution source activity intensity (AI). Additionally, the economic activity index (GDP), pollution emission intensity (EI), and ecological risk index (CSI) are integrated into a dynamic evaluation framework. The study examines the trend of PCB ecological risk under different economic growth scenarios (GDP 6% and 3% growth rates), providing a reference for mitigating the risks caused by PCB residues.
In contrast to previous studies that have focused on agricultural soils, this research centers on the black soil of central Jilin Province, with an emphasis on analyzing PCB residues and forecasting future PCB trends in this region. The primary objectives of this study are, therefore, (1) to investigate the relationship between PCB concentrations and soil properties such as pH and organic matter content, (2) to conduct source analysis of PCBs, (3) to assess the ecological risks associated with PCB contamination, and (4) to perform a risk warning evaluation for PCBs.
2. Materials and Methods
2.1. Study Area and Sample Collection
Located in Northeast China, Jilin Province has a temperate continental monsoon climate, distinguished by its four distinct seasons and concurrent rainfall and warmth during the growing season [27]. The region receives an average annual precipitation of approximately 567 mm, with average temperatures ranging from 3 to 5 degrees Celsius. The predominant soil types for agriculture in this area are black calcareous soil and black soil. Meanwhile, the key industries supporting the regional economy include automobile manufacturing, petrochemicals, and the processing of agricultural products. In the central Jilin Province’s black soil region, we collected 59 surface soil samples (Figure 1). Surface soil samples (0–20 cm depth) were collected from farmland in the black soil region. At each site, a composite soil sample was composed of five individual soil samples, which were taken from a square plot with a side length of 1 km (four samples from the corners and one from the center, each weighing 1 kg). Fresh soil samples were transported to the laboratory in high-density polyethylene (HPPE) bags, with sampling sites selected randomly. Samples were prepared by removing larger stones and debris, passing them through a 100-mesh sieve, and storing them at low temperatures prior to analysis.
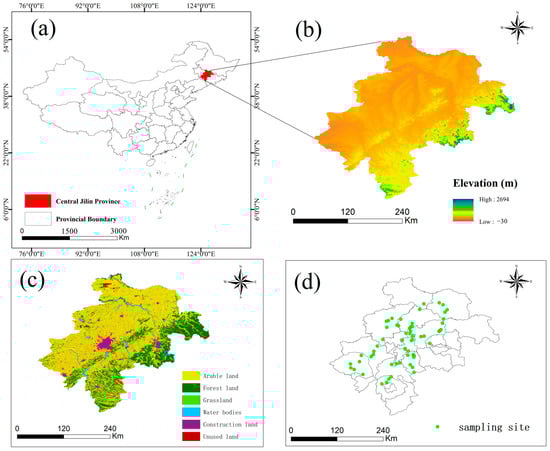
Figure 1.
Map of the study area and sampling sites (a) Central Jilin Province, China (b) Elevation (c) Land use type (d) Sampling point.
2.2. Sample Analysis
In this study, seven PCBs (PCB28, PCB52, PCB101, PCB118, PCB138, PCB153, and PCB180) were detected in the black soil region of central Jilin Province. Throughout the pre-treatment and analysis of soil samples, we strictly adhered to the protocols set by the Ministry of Ecology and Environment [28].
Weigh 20 g (to the nearest 0.01 g) of a 1 mm sieve soil sample into a 250 mL conical flask and add an appropriate amount of anhydrous sodium sulfate for dehydration. Add 40.0 μg of substitute, dissolved in an acetone–hexane solvent mixture (1:1, v/v). Add 100 mL of the acetone–hexane solvent mixture to the conical flask. Perform ultrasonic extraction for 20 min, filter the extract, and collect it in a concentration apparatus. Wash the container with the same solvent mixture as above. Reduce the extract to approximately 2 mL using a rotary evaporator, then add 10 mL of hexane and concentrate the mixture to 2 mL before proceeding with purification. First, purify the darker-colored concentrate using sulfuric acid (which removes most oxygenated compounds and some organochlorine pesticides). Transfer the concentrate to a 150 mL separatory funnel, add 10 mL of sulfuric acid, and gently shake it for 1 min. Allow the layers to separate and discard the sulfuric acid layer. The magnesium silicate solid-phase extraction column was washed with 8 mL of hexane to keep the surface of adsorbent in the column moistened, and the concentrate was transferred to the extraction column for 1 min, and then the effluent was discarded. Add 2 mL of the acetone–hexane solvent mixture (acetone:hexane/v:v/1:9), let it sit for 1 min, collect the cleanup solution, and wash the extraction column with the above solvent until the volume of the collected cleanup solution reaches 10 mL. Concentrate the cleanup solution with a rotary evaporator, add the internal standard, and condense it to 1.0 mL. Transfer the final solution to a sample vial for analysis.
A gas chromatography–mass spectrometer (GC-MS, Clarus 680/600 T, PerkinElmer Inc., Waltham, MA, USA) was used to analyze the liquids that were to be analyzed. The gas chromatographic conditions were as follows: an injection port temperature of 250 °C, an initial temperature of 100 °C held for 2 min, a temperature increase of 15 °C/min up to 220 °C, a hold at that temperature for 5 min, followed by a temperature drop to 260 °C over 20 min. The temperature of the column was 100 °C for 2 min, 220 °C for 5 min at a rate of 15 °C/min, and finally 260 °C for 20 min at the same rate. Soil pH was measured with a pH electrode (Model PB-10, Sartorius, Gottingen, Germany) in a 1:2.5 (soil/distilled water) extract, and soil organic matter (OM) content was analyzed based on residual titration.
2.3. Quality Assurance and Quality Control
Before each usage, the glassware was washed with a solution of hexane and acetone in a ratio of 1:1, and then subjected to ultrasonic cleaning and drying at 400 °C. As part of the sample analysis, both blank and parallel sample tests were conducted. One blank sample was processed for every five samples, and it was found that the blank samples did not contain any target chemicals. With limits of detection (LODs) ranging from 0.01 to 0.21 ng/g, the PCB recoveries ranged from 80.9% to 106.4%. The relative standard deviation (RSD) was less than 5%.
2.4. Ecological Risk Assessment
The ecological risk of soil pollutants was assessed using the soil contamination severity index (CSI) [22,29,30]. In order to determine the severity of an impact on a biological community, this index uses the effect range low (ERL) and effect range medium (ERM) values [31]. Principal component analysis was used to obtain Wi for each PCB. ERM designates a concentration at which negative consequences are expected to occur frequently, whereas ERL designates a concentration below which negative effects are expected to occur infrequently. The following is the calculating formula:
In the formula, represents the weight of each PCB, denotes the concentration of each PCB, and ERL and ERM refer to the effect range low and effect range medium, respectively. Uncontaminated (CSI 0.5), very low severity (0.5 CSI 1), low severity (1 CSI 1.5), low to moderate severity ( CSI ), moderate severity ( CSI 2.5), moderate to high severity ( CSI ), high severity ( CSI ), very high severity ( CSI ), and ultra-high severity ( CSI) are the nine pollution levels classified according to the CSI values. Factor analysis and principal component analysis (PCA), which solely take anthropogenic variables into account when determining the weight values, are used to determine the weights of each PCB. The following formula is used to determine each PCB’s weight:
2.5. Temporal Dynamic Trends of PCBs in Soil
2.5.1. Dynamic Source Release Modelling
Assuming that under natural attenuation conditions, pollutants diffuse from active pollution sources into the surrounding soil [32], analyzing this process requires examining the emission intensity (EI) of the pollution sources. The activity intensity (AI) of the polluting source multiplied by the time integral of the decay coefficient yields the environmental impact (EI) [33], with a positive correlation existing between EI and AI [34]. All of Jilin Province’s manufacturing operations are considered potential pollution hotspots in this analysis. An annual evaluation of advancements in the AI is carried out in order to study the dynamics of EI trends [35]. The AI is positively correlated with gross domestic product (GDP) [36]; therefore, the calculation process for EI is as follows:
In the equation, and represent the emission intensity (EI) and activity intensity (AI) of the pollution source in year m (where m = 2002, 2003, …, 2045). K denotes the natural degradation rate of the pollutant (with K = 0.95).
Aside from Changchun, the GDP of other cities in central Jilin Province did not show a significant growth trend. To highlight the temporal trend of pollutants, the AI data from 2002 to 2022 utilized the GDP of Changchun [37], and scenario simulations were conducted to predict AI values from 2023 to 2045. The scenario simulations included three scenarios: (a) fitting historical data to predict future values; (b) a 6% annual GDP growth rate starting in 2023; and (c) a 3% annual GDP growth rate starting in 2023.
2.5.2. Time-Dynamic Trends in PCB Accumulation
The yearly contribution rate of pollution sources to soil pollutants can be calculated by observing the direct correlation between EI and this rate. The temporal distribution of pollutants can be predicted using the following formula:
In the equation, represents the average concentration of the i-th pollutant in the soil of Changchun City in the year m.
2.6. Statistical Analysis
Using ArcGIS 10.7 (ESRI, Redlands, CA, USA) software, inverse distance weighting interpolation was applied to map the spatial distribution of PCBs in the soil. Principal component analysis was conducted using SPSS 17.0 (SPSS Inc., Chicago, IL, USA), and correlation plots were created using Origin 2024b (Origin Inc., Asheboro, NC, USA) to explore the relationships between PCBs, soil organic matter, and pH.
3. Results and Discussion
3.1. PCB Concentration
The concentration distribution of the seven PCBs in the agricultural soil of the black soil region in central Jilin Province is shown in Figure 2. The concentrations fluctuate with the sampling location, with the total concentration of the seven PCBs ranging from 9.849 to 185.930 μg/kg, and averaging 20.556 μg/kg. PCB28 and PCB52 were detected in Liaoyuan City, where PCB52 exhibited the highest concentration, at 167.619 μg/kg. This may be attributed to lower chlorinated PCBs tending to volatilize into the atmosphere and disperse through air currents [4]. Small amounts of PCB28 were also found in Dehui and Yushu Cities. The concentration of PCB101 ranged from 0 to 0.724 μg/kg, indicating its relatively low presence in samples from the black soil region. PCB118 was predominantly found in the Jiutai and Tiexi Districts, whereas PCB138, PCB153, and PCB180 showed higher concentrations in Fuyu and Yushu Cities.
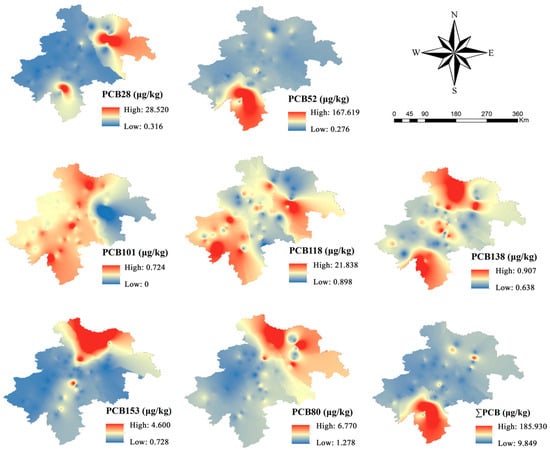
Figure 2.
Geographical distribution of PCBs in the black soil area of central Jilin Province.
The concentration range for lower chlorinated PCBs (PCB28 and PCB52) was 1.27 to 179.44 μg/kg, averaging 12.22 μg/kg, which accounts for 60% of the total PCB concentrations. Conversely, the total concentration of higher chlorinated PCBs (PCB101, PCB118, PCB138, PCB153, and PCB180) was 491.72 μg/kg, with an average of 8.33 μg/kg, constituting 40% of the total PCB concentrations. Due to their lower molecular weight and higher volatility, lower chlorinated PCBs can readily volatilize from pollution sources into the atmosphere and be transported over long distances. This volatility enables lower chlorinated PCBs to more easily reach areas distant from the pollution sources, whereas higher chlorinated PCBs, due to their lower volatility, tend to accumulate more in soils near the pollution sources [38].
The global concentrations of PCBs are summarized in Table 1. The average concentration of PCB28 (1.61 μg/kg) was lower than that of Dilovasi, Turkey (1.72 μg/kg), and Birgunj, Nepal (2.01 μg/kg), and higher than that of areas such as Hong Kong (1.30 μg/kg), Tripura, India (0.49 μg/kg), Nigeria (0.78 μg/kg), and Hawaii, USA (0.58 μg/kg). The average concentration of PCB 52 (10.62 μg/kg) was higher than that of the above-mentioned areas, and the average concentration of PCB 101 (0.37 μg/kg) was higher than the average concentration of PCB 101 (0.19 μg/kg) in Tripura, India (0.19 μg/kg), Nigeria (0.19 μg/kg), India (0.15 μg/kg), Thailand (0.49 μg/kg). kg), and Nigeria (0.33 μg/kg). The mean concentration of PCB118 (4.10 μg/kg) was significantly higher than that of the above-mentioned districts, and the mean concentration of PCB138 (0.70 μg/kg) was higher than that of Tripura, India (0.13 μg/kg), and Birgunj, Nepal (0.10 μg/kg). The mean concentration of PCB153 (1.07 μg/kg) was lower than that of Hawaii, USA (3.13 μg/kg), but higher than that of the other regions, and the mean concentration of PCB180 (2.09 μg/kg) was also higher than that of the above regions. Overall, the seven PCB concentrations in this study were high.

Table 1.
Concentrations of PCBs in soil around the world (μg/kg).
3.2. Correlation Analysis
Soil pH and organic matter content are presented in Table 2. The sample soil pH generally falls within the neutral to slightly alkaline or slightly acidic range, while the organic matter data indicate that soil fertility in the study area is not uniformly distributed.
Table 2.
Description of soil pH and organic matter content.
To investigate the distribution variations of PCBs in soils across different regions, this study explored the relationships between soil organic matter content, pH, and PCB concentrations. The results suggest that a higher organic matter content enhances the binding of chemicals to soil particles [45], contributing to pollutant accumulation. A significant correlation was observed between PCB distribution and soil organic matter content [46,47]. In this study, no significant linear correlation was found between total PCB concentrations and soil pH (Figure 3), indicating that pH variations have a minimal impact on PCB levels. However, a significant positive correlation was observed between PCB concentrations and organic matter content. This is likely due to the high organic matter content in black soils, which enhances the binding of PCBs to soil particles.
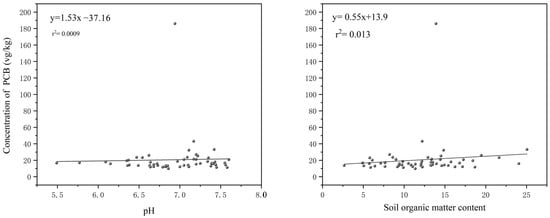
Figure 3.
Correlation analysis of PCB concentration with pH and soil organic matter content.
3.3. PCB Source Analysis
In this study, SPSS 27 was utilized to conduct principal component analysis (PCA), a method widely employed to identify the sources of various organic contaminants [6,48,49]. To assess the suitability of the original data for PCA, the Kaiser–Meyer–Olkin (KMO) measure of sampling adequacy and Bartlett’s test of sphericity were conducted. The results indicated that the original data were appropriate for PCA, with a KMO value exceeding 0.5 and a significant Bartlett’s test result (p < 0.001).
A total of seven PCBs were identified in the farmland soils of the black soil region in central Jilin Province. A three-dimensional PCA analysis was performed on these seven congeners, yielding a cumulative variance contribution of 66.88% (Table 3 and Table 4). In the black soil region of central Jilin Province, PC1 comprised PCB101, PCB138, and PCB153; PC2 included PCB-28 and PCB52; and PC3 consisted of PCB118 and PCB180. The variance contribution rates for PC1, PC2, and PC3 were 27.83%, 21.13%, and 17.92%, respectively. IPC1 exhibited the highest loadings for PCB101, PCB138, and PCB153, collectively accounting for 10.38% of the total PCB concentration. Previous studies indicate that PCBs containing 5–6 chlorine atoms are commonly found in emissions from waste incineration and gasoline engine operations [50]. Therefore, it can be inferred that PC1 likely originates from PCBs generated by anthropogenic activities, such as vehicle exhaust and waste incineration.
Table 3.
Interpretation of the total variance of the main principal.
Table 4.
Component matrix after rotation.
PC2 exhibited the highest loading for PCB28, which accounted for 7.82% of the total PCB concentration. Transformer oils are known to contain high concentrations of PCB28, which suggests that the soil contamination observed may be primarily attributed to the insulation materials used in electrical and electronic equipment [39].
PC3 showed the highest loadings for PCB118 and PCB180, collectively accounting for 30.16% of the total PCB concentration. PCB-containing discarded electronic devices (such as capacitors and transformers) may release PCB 118 and PCB 180 into the soil through mishandling or burning during informal dismantling processes [51]. Given that major industries and large electronic waste processing facilities are concentrated in the central region [52], atmospheric deposition could serve as a significant source of these two congeners.
3.4. Ecological Risk Evaluation of PCBs in Soil
Figure 4 illustrates the geographic distribution of PCB-CSI values in the farmland soils of the black soil region in central Jilin Province. The highest CSI value was observed in Liaoyuan City, where only 1.7% of the samples fell into the “extremely high severity” category, with the majority classified as “very low severity”. Given the absence of ERL and ERM values for individual PCB congeners, this section focuses on the overall risk posed by total PCB concentrations. Based on the regional distribution maps presented in Section 3.1 and the analysis of farmland soils in the black soil region of central Jilin Province, PCB28 and PCB52 appear to be the primary contributors to the relatively high PCB-related risks. These congeners are commonly used as insulation fluids in capacitors and transformer oils. Once released into the soil, they can be readily transported by surface runoff [53]. Furthermore, highly chlorinated PCBs (PCB101, PCB118, PCB138, PCB153, and PCB180) can undergo dechlorination in the natural environment, potentially transforming into lower chlorinated congeners such as PCB28 and PCB52 [54].
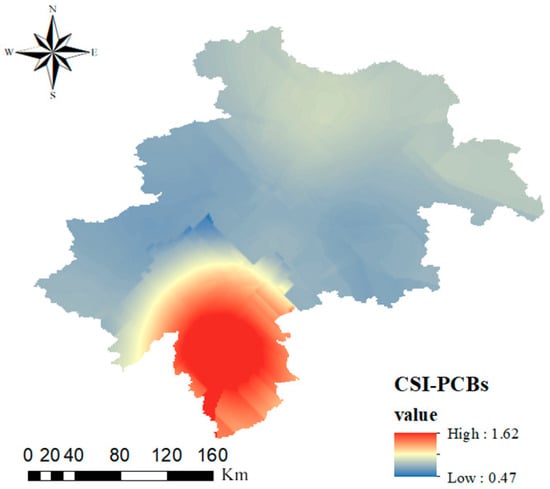
Figure 4.
PCB contamination severity index (CSI) values distributed geographically in the central black soil zone of Jilin Province.
3.5. PCB Risk Warning
The projected future ecological risks of PCBs, based on annual average PCB concentrations, are depicted in Figure 5. To better illustrate these outcomes, three distinct scenarios were modeled, beginning with the year 2023. Under a scenario with an annual GDP growth rate of 6%, soil risk is expected to rise by one level by 2040, though it will remain within the “low risk” category. In the remaining two scenarios, the ecological risk levels are forecasted to remain stable and categorized as “low risk”. Despite the potential for increased industrial activity and associated PCB emissions under a 6% GDP growth scenario, we anticipate that stringent environmental protection policies and technological advances could mitigate any substantial increases in soil PCB concentrations, thereby maintaining low risk levels.
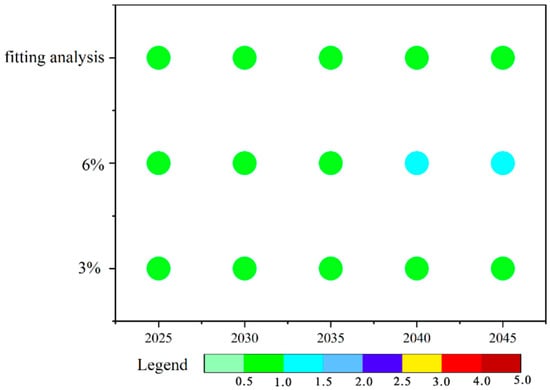
Figure 5.
The predicted soil PCB contamination severity index (CSI), according to fitting studies and predictions; with a 6% annual GDP growth rate; and with a 3% annual GDP growth rate.
Since 1980, China has progressively phased out the use of electrical equipment and industrial products containing PCBs, alongside implementing a comprehensive suite of laws and regulations, such as the Soil Pollution Prevention and Control Law. This law outlines prevention and control measures for soil pollutants, including PCBs, delineates the responsibilities of both government entities and enterprises in soil pollution prevention, and establishes clear remediation standards. Additionally, a nationwide environmental monitoring network has been established to systematically track PCB levels in soil, water, and air. Monitoring data are utilized to evaluate pollution levels and inform targeted preventive actions. Furthermore, a series of pollution prevention measures and actions proposed by the government in the 2022 Jilin Environmental Bulletin [55], along with a 30% year-on-year decrease in illegal discharge cases, demonstrate that these efforts have significantly reduced the environmental risks posed by pollutants. Consequently, across all three scenarios, it is unlikely that PCB concentrations in soil will present significant ecological risks.
3.6. Uncertainty Analysis
This study’s prediction of soil risk may have certain limitations. These limitations stem from two primary factors: First, the GDP of Changchun was used as a proxy for the entire central region of Jilin Province, potentially leading to an overestimation of the actual economic activity and associated pollution levels. Second, the relationship between GDP growth and annual pollution levels is subject to change due to uncertainties in future economic development. This variability could result in either an overestimation or underestimation of the predicted soil ecological risk values compared to actual conditions. Despite these uncertainties, the overall findings suggest that there remains no significant ecological risk posed by PCBs in the soil.
4. Conclusions
The agricultural soils in the black soil region of central Jilin Province exhibit relatively low levels of polychlorinated biphenyl (PCB) contamination. Specifically, higher concentrations of PCB101, PCB138, PCB153, and PCB180 were observed in Fuyu City, while PCB28 was predominantly distributed in Yushu City. PCB118 showed elevated levels in Siping City and Jiutai District, and Liaoyuan City recorded the highest average concentration of PCB52. Overall, significant regional concentration variations were evident. Correlation analysis indicated no clear relationship between PCB concentrations and soil pH, but a positive correlation was identified with soil organic matter (SOM) content. The inherently high organic matter content of black soil enhances the adsorption of PCBs onto soil particles. The primary sources of PCBs in the study area include transportation, waste incineration, and atmospheric deposition. Human activities significantly influence the input levels of these contaminants. However, only 1.7% of the samples fall into the “extremely high severity” category; the spatial distribution of high-risk sites correlates strongly with historical industrial hotspots, suggesting localized contamination legacies. The early warning assessment further indicates that no significant ecological risks are expected to occur in central Jilin Province in the next 20 years under all three projection scenarios. This preliminary optimistic trend may stem from recent centralized governance efforts in high-priority zones, yet it should not overshadow the need for targeted interventions in lagging regions to address persistent disparities. This optimistic outlook is largely attributed to the ongoing efforts and effective measures implemented for soil pollution prevention and control in the study area.
Author Contributions
Investigation, writing—original draft, formal analysis, data curation, and visualization, J.L.; Conceptualization, methodology, writing—review and editing, funding acquisition, and project administration, Y.C.; Supervision, resources, and investigation, D.P.; Supervision, and methodology, J.Z.; Conceptualization and supervision, Y.Z.; Formal analysis, P.S.; Validation, W.S. All authors have read and agreed to the published version of the manuscript.
Funding
This study was supported by the Jilin Science and Technology Development Planning Project [20210203006SF, 20210203150SF], the Sixth Batch of Young Science and Technology Talents Promotion Program of Jilin Province [QT202216].
Institutional Review Board Statement
Not applicable.
Informed Consent Statement
Not applicable.
Data Availability Statement
The data presented in this paper are available on request from the corresponding authors.
Conflicts of Interest
The authors declare that they have no known competing financial interests or personal relationships that could influence the work reported in this paper.
References
- Carlos, N.; Melissa, V.; Guillermo, M.; Eunha, H.; Lisa, L.A. Polychlorinated biphenyls (PCBs) in recreational marina sediments of San Diego Bay, southern California. Mar. Pollut. Bull. 2018, 126, 204–214. [Google Scholar] [CrossRef]
- Everaert, G.; De Laender, F.; Goethals, P.L.M.; Janssen, C.R. Multidecadal Field Data Support Intimate Links between Phytoplankton Dynamics and PCB Concentrations in Marine Sediments and Biota. Environ. Sci. Technol. 2015, 49, 8704–8711. [Google Scholar] [CrossRef] [PubMed]
- Koh, W.X.; Hornbuckle, K.C.; Thorne, P.S. Human Serum from Urban and Rural Adolescents and Their Mothers Shows Exposure to Polychlorinated Biphenyls Not Found in Commercial Mixtures. Environ. Sci. Technol. 2015, 49, 8105–8112. [Google Scholar] [CrossRef] [PubMed]
- Xu, G.; Yu, Y.; Wang, Y.; Wang, J.; Yu, R.; Chen, X.; Cui, Z. Polychlorinated biphenyls in vegetable soils from Changchun, Northeast China: Concentrations, distribution, sources and human health risks. Hum. Ecol. Risk Assess. Int. J. 2017, 24, 590–601. [Google Scholar] [CrossRef]
- Neugebauer, J.; Wittsiepe, J.; Kasper-Sonnenberg, M.; Schöneck, N.; Schölmerich, A.; Wilhelm, M. The influence of low level pre- and perinatal exposure to PCDD/Fs, PCBs, and lead on attention performance and attention-related behavior among German school-aged children: Results from the Duisburg Birth Cohort Study. Int. J. Hyg. Environ. Health 2015, 218, 153–162. [Google Scholar] [CrossRef]
- Jiang, S.; Wan, M.; Lin, K.; Chen, Y.; Wang, R.; Tan, L.; Wang, J. Spatiotemporal distribution, source analysis and ecological risk assessment of polychlorinated biphenyls (PCBs) in the Bohai Bay, China. Mar. Pollut. Bull. 2024, 198, 115780. [Google Scholar] [CrossRef]
- Frignani, M.; Piazza, R.; Bellucci, L.G.; Cu, N.H.; Zangrando, R.; Albertazzi, S.; Moret, I.; Romano, S.; Gambaro, A. Polychlorinated biphenyls in sediments of the Tam Giang-Cau Hai Lagoon, Central Vietnam. Chemosphere 2007, 67, 1786–1793. [Google Scholar] [CrossRef][Green Version]
- Faroon, O.; Olson, J. Toxicological Profile for Polychlorinated Biphenyls (PCBs); US Department of Health and Human Services, Public Health Service, Agency for Toxic Substances and Disease Registry: Atlanta, GA, USA, 2000. [Google Scholar]
- Armitage, J.M.; Hanson, M.; Axelman, J.; Cousins, I.T. Levels and vertical distribution of PCBs in agricultural and natural soils from Sweden. Sci. Total Environ. 2006, 371, 344–352. [Google Scholar] [CrossRef]
- Ranjbaran, S.; Sobhanardakani, S.; Cheraghi, M.; Lorestani, B.; Sadr, M.K. Ecological and human health risks assessment of some polychlorinated biphenyls (PCBs) in surface soils of central and southern parts of city of Tehran, Iran. J. Environ. Health Sci. Eng. 2021, 19, 1491–1503. [Google Scholar] [CrossRef]
- Arsalan, J.; Stuart, H.; Sadegh, H.; Stuart, H. Influence of environmental variables on the spatial distribution of PCBs in Norwegian and UK soils: Implications for global cycling. Environ. Sci. Technol. 2002, 36, 2146–2153. [Google Scholar] [CrossRef]
- Han, L.; Chang, C.; Yan, S.; Qu, C.; Tian, Y.; Guo, J.; Guo, J. Distribution, Sources and Risk Assessment of Polychlorinated Biphenyls in Sediments from Beiluo River. Toxics 2023, 11, 139. [Google Scholar] [CrossRef] [PubMed]
- De Rosa, E.; Montuori, P.; Triassi, M.; Masucci, A.; Nardone, A. Occurrence and Distribution of Persistent Organic Pollutants (POPs) from Sele River, Southern Italy: Analysis of Polychlorinated Biphenyls and Organochlorine Pesticides in a Water–Sediment System. Toxics 2022, 10, 662. [Google Scholar] [CrossRef] [PubMed]
- Zhang, Q.; Li, Y.; Miao, Q.; Pei, G.; Nan, Y.; Yu, S.; Mei, X.; Feng, W. Distribution, Sources, and Risk of Polychlorinated Biphenyls in the Largest Irrigation Area in the Yellow River Basin. Water 2022, 14, 3472. [Google Scholar] [CrossRef]
- Zhang, Y.; Wang, C.; Du, L. Distribution, Source and Potential Risk Assessment of Polychlorinated Biphenyls (PCBs) in Sediments from the Liaohe River Protected Area, China. Sustainability 2021, 13, 10750. [Google Scholar] [CrossRef]
- Ge, J.; Woodward, L.A.; Li, Q.X.; Wang, J. Composition, distribution and risk assessment of organochlorine pesticides in soils from the Midway Atoll, North Pacific Ocean. Sci. Total Environ. 2013, 452–453, 421–426. [Google Scholar] [CrossRef]
- Yu, H.; Liu, Y.; Shu, X.; Ma, L.; Pan, Y. Assessment of the spatial distribution of organochlorine pesticides (OCPs) and polychlorinated biphenyls (PCBs) in urban soil of China. Chemosphere 2020, 243, 125392. [Google Scholar] [CrossRef]
- Mamontova, E.A.; Mamontov, A.A. Air Monitoring of Polychlorinated Biphenyls and Organochlorine Pesticides in Eastern Siberia: Levels, Temporal Trends, and Risk Assessment. Atmosphere 2022, 13, 1971. [Google Scholar] [CrossRef]
- Wang, X.; Banks, A.P.W.; He, C.; Drage, D.S.; Gallen, C.L.; Li, Y.; Li, Q.; Thai, P.K.; Mueller, J.F. Polycyclic aromatic hydrocarbons, polychlorinated biphenyls and legacy and current pesticides in indoor environment in Australia—Occurrence, sources and exposure risks. Sci. Total Environ. 2019, 693, 133588. [Google Scholar] [CrossRef]
- Yang, X.; Wu, J.; Li, M.; Qi, M.; Wang, R.; Hu, J.; Jin, J. Particle size distributions and health risks of polychlorinated dibenzo-p-dioxin/furans, polychlorinated biphenyls, and polychlorinated naphthalenes in atmospheric particles around two secondary copper smelters in Shandong Province, China. Chemosphere 2021, 269, 128742. [Google Scholar] [CrossRef]
- Barış, G.; Oltan, C. An environmental friendly and stable analytical method for the determination of indicator polychlorinated biphenyls (PCBs) in solid and waste oil samples by gas chromatography-electron capture detector (GC-ECD). Microchem. J. 2022, 178, 107325. [Google Scholar] [CrossRef]
- Peng, J.; Chen, Y.; Xia, Q.; Rong, G.; Zhang, J. Ecological risk and early warning of soil compound pollutants (HMs, PAHs, PCBs and OCPs) in an industrial city, Changchun, China. Environ. Pollut. 2021, 272, 116038. [Google Scholar] [CrossRef] [PubMed]
- USEPA. Regional Screening Table-User’s Guide, Mid-Atlantic Risk Assessment; USEPA: Washington, DC, USA, 2019. [Google Scholar]
- Zhang, Y.; Li, S.; Lai, Y.; Wang, L.; Wang, F.; Chen, Z. Predicting future contents of soil heavy metals and related health risks by combining the models of source apportionment, soil metal accumulation and industrial economic theory. Ecotoxicol. Environ. Saf. 2019, 171, 211–221. [Google Scholar] [CrossRef] [PubMed]
- Chen, D.; Wang, X.; Luo, X.; Huang, G.; Tian, Z.; Li, W.; Liu, F. Delineating and identifying risk zones of soil heavy metal pollution in an industrialized region using machine learning. Environ. Pollut. 2023, 318, 120932. [Google Scholar] [CrossRef] [PubMed]
- Emamgholizadeh, S.; Bazoobandi, A.; Mohammadi, B.; Ghorbani, H.; Amel Sadeghi, M. Prediction of soil cation exchange capacity using enhanced machine learning approaches in the southern region of the Caspian Sea. Ain Shams Eng. J. 2023, 14, 101876. [Google Scholar] [CrossRef]
- Li, W.; Zhang, S.; Gao, F.; Chen, Z.; Jiang, J.; Sun, G.-X. Spatial distribution, sources apportionment and risk assessment of heavy metals in the Changchun black soil area, China. J. Hazard. Mater. Adv. 2024, 13, 100402. [Google Scholar] [CrossRef]
- MEE. National Environmental Protection Standard of the People’s Republic of China—Soil and Sediment—Determination of Polychlorinated Biphenyls (PCBs)—Gas Chromatographic Methods; MEE: Beijing, China, 2017. [Google Scholar]
- Pejman, A.; Nabi Bidhendi, G.; Ardestani, M.; Saeedi, M.; Baghvand, A. A new index for assessing heavy metals contamination in sediments: A case study. Ecol. Indic. 2015, 58, 365–373. [Google Scholar] [CrossRef]
- Zhang, M.; He, P.; Qiao, G.; Huang, J.; Yuan, X.; Li, Q. Heavy metal contamination assessment of surface sediments of the Subei Shoal, China: Spatial distribution, source apportionment and ecological risk. Chemosphere 2019, 223, 211–222. [Google Scholar] [CrossRef]
- Long, E.R.; Macdonald, D.D.; Smith, S.L.; Calder, F.D. Incidence of adverse biological effects within ranges of chemical concentrations in marine and estuarine sediments. Environ. Manag. 1995, 19, 81–97. [Google Scholar] [CrossRef]
- Jacques, D.; Šimůnek, J.; Mallants, D.; van Genuchten, M.T. Modelling coupled water flow, solute transport and geochemical reactions affecting heavy metal migration in a podzol soil. Geoderma 2008, 145, 449–461. [Google Scholar] [CrossRef]
- Zeng, H.; Wu, J. Sedimentary records of heavy metal pollution in fuxian lake, yunnan Province, China: Intensity, history, and sources. Pedosphere 2009, 5, 562–569. [Google Scholar] [CrossRef]
- Li, J.; Pu, L.; Liao, Q.; Zhu, M.; Dai, X.; Xu, Y.; Zhang, L.; Hua, M.; Jin, Y. How anthropogenic activities affect soil heavy metal concentration on a broad scale: A geochemistry survey in Yangtze River Delta, Eastern China. Environ. Earth Sci. 2014, 73, 1823–1835. [Google Scholar] [CrossRef]
- Lysenko, A.P.; Giris, D.A.; Zubovskij, D.M.; Birman, B.Y. Modern problems of ecological and analytical monitoring of ecotoxicants of animal husbandry objects. Nat. Commun. 2005, 5, 5637. [Google Scholar]
- Zhang, T.; Yang, W.; Chen, S.; Shi, D.; Zhao, H.; Ding, Y.; Huang, Y.; Li, N.; Ren, Y.; Mai, B. Occurrence, sources, and ecological risks of PBDEs, PCBs, OCPs, and PAHs in surface sediments of the Yangtze River Delta city cluster, China. Environ. Monit. Assess. 2014, 186, 5285–5295. [Google Scholar] [CrossRef] [PubMed]
- CCSB. 2023 Changchun Statistical Yearbook; Changchun Statistics Press: Changchun, China, 2023. [Google Scholar]
- Montano, L.; Pironti, C.; Pinto, G.; Ricciardi, M.; Buono, A.; Brogna, C.; Venier, M.; Piscopo, M.; Amoresano, A.; Motta, O. Polychlorinated Biphenyls (PCBs) in the Environment: Occupational and Exposure Events, Effects on Human Health and Fertility. Toxics 2022, 10, 365. [Google Scholar] [CrossRef]
- Zhang, H.B.; Luo, Y.M.; Wong, M.H.; Zhao, Q.G.; Zhang, G.L. Concentrations and possible sources of polychlorinated biphenyls in the soils of Hong Kong. Geoderma 2007, 138, 244–251. [Google Scholar] [CrossRef]
- Yurdakul, S.; Çelik, I.; Çelen, M.; Öztürk, F.; Cetin, B. Levels, temporal/spatial variations and sources of PAHs and PCBs in soil of a highly industrialized area. Atmos. Pollut. Res. 2019, 10, 1227–1238. [Google Scholar] [CrossRef]
- Devi, N.L.; Yadav, I.C.; Chakraborty, P.; Shihua, Q. Polychlorinated Biphenyls in Surface Soil from North-East India: Implication for Sources Apportionment and Health-Risk Assessment. Arch. Environ. Contam. Toxicol. 2018, 75, 377–389. [Google Scholar] [CrossRef]
- Ossai, C.J.; Iwegbue, C.M.A.; Tesi, G.O.; Olisah, C.; Egobueze, F.E.; Nwajei, G.E.; Martincigh, B.S. Spatial characteristics, sources and exposure risk of polychlorinated biphenyls in dusts and soils from an urban environment in the Niger Delta of Nigeria. Sci. Total Environ. 2023, 883, 163513. [Google Scholar] [CrossRef]
- Yadav, I.C.; Devi, N.L.; Li, J.; Zhang, G. Polychlorinated biphenyls in Nepalese surface soils: Spatial distribution, air-soil exchange, and soil-air partitioning. Ecotoxicol. Environ. Saf. 2017, 144, 498–506. [Google Scholar] [CrossRef]
- Barchi, J.J.; Ge, J.; Woodward, L.A.; Li, Q.X.; Wang, J. Distribution, Sources and Risk Assessment of Polychlorinated Biphenyls in Soils from the Midway Atoll, North Pacific Ocean. PLoS ONE 2013, 8, e71521. [Google Scholar] [CrossRef]
- Niu, L.; Mao, S.; Zhou, J.; Zhao, L.; Zhu, Y.; Xu, C.; Sun, X.; Sun, J.; Liu, W. Polychlorinated biphenyls (PCBs) in soils from typical paddy fields of China: Occurrence, influencing factors and human health risks. Environ. Pollut. 2022, 307, 119567. [Google Scholar] [CrossRef] [PubMed]
- Ren, J.; Wang, X.; Gong, P.; Wang, C. Characterization of Tibetan Soil As a Source or Sink of Atmospheric Persistent Organic Pollutants: Seasonal Shift and Impact of Global Warming. Environ. Sci. Technol. 2019, 53, 3589–3598. [Google Scholar] [CrossRef] [PubMed]
- Xu, C.; Niu, L.; Zou, D.; Zhu, S.; Liu, W. Congener-specific composition of polychlorinated biphenyls (PCBs) in soil-air partitioning and the associated health risks. Sci. Total Environ. 2019, 684, 486–495. [Google Scholar] [CrossRef] [PubMed]
- Zhao, Q.; Bai, J.; Lu, Q.; Gao, Z.; Jia, J.; Cui, B.; Liu, X. Polychlorinated biphenyls (PCBs) in sediments/soils of different wetlands along 100-year coastal reclamation chronosequence in the Pearl River Estuary, China. Environ. Pollut. 2016, 213, 860–869. [Google Scholar] [CrossRef]
- Cachada, A.; Lopes, L.V.; Hursthouse, A.S.; Biasioli, M.; Grčman, H.; Otabbong, E.; Davidson, C.M.; Duarte, A.C. The variability of polychlorinated biphenyls levels in urban soils from five European cities. Environ. Pollut. 2009, 157, 511–518. [Google Scholar] [CrossRef]
- Jan, B.; Roman, G.; Juraj, K.; Milan, L.; Stellan, M.; Tomas, O.; Vladimõr, P.a.; Pribyl, J.; Vratislav, T.; Jan, V. The effect of oils on PAH, PCDD, PCDF, and PCB emissions from a spark engine fueled with leaded gasoline. Chemosphere 2000, 41, 1905–1911. [Google Scholar] [CrossRef]
- Shi, J.; Xiang, L.; Luan, H.; Wei, Y.; Ren, H.; Chen, P. The health concern of polychlorinated biphenyls (PCBs) in a notorious e-waste recycling site. Ecotoxicol. Environ. Saf. 2019, 186, 109817. [Google Scholar] [CrossRef]
- Chen, X.; Wang, Y.; Liu, Q.; Zhang, J.-J.; Yu, R.; Cui, Z.; Liu, J. Residual characteristics and health risk assessment of polychlorinated biphenyls in suburban vegetable soils in different industrial cities. Soils Crops 2016, 5, 14–23. [Google Scholar] [CrossRef]
- Tang, D.; Liu, X.; He, H.; Cui, Z.; Gan, H.; Xia, Z. Distribution, sources and ecological risks of organochlorine compounds (DDTs, HCHs and PCBs) in surface sediments from the Pearl River Estuary, China. Mar. Pollut. Bull. 2020, 152, 110942. [Google Scholar] [CrossRef]
- Kanzari, F.; Syakti, A.D.; Asia, L.; Malleret, L.; Piram, A.; Mille, G.; Doumenq, P. Distributions and sources of persistent organic pollutants (aliphatic hydrocarbons, PAHs, PCBs and pesticides) in surface sediments of an industrialized urban river (Huveaune), France. Sci. Total Environ. 2014, 478, 141–151. [Google Scholar] [CrossRef]
- Jilin Provincial Department of Ecology and Environment. The 2022 Communiqué on the Ecological Environment of Jilin Province; Jilin Provincial Department of Ecology and Environment: Baishan, China, 2022. [Google Scholar]


Disclaimer/Publisher’s Note: The statements, opinions and data contained in all publications are solely those of the individual author(s) and contributor(s) and not of MDPI and/or the editor(s). MDPI and/or the editor(s) disclaim responsibility for any injury to people or property resulting from any ideas, methods, instructions or products referred to in the content. |
© 2025 by the authors. Licensee MDPI, Basel, Switzerland. This article is an open access article distributed under the terms and conditions of the Creative Commons Attribution (CC BY) license (https://creativecommons.org/licenses/by/4.0/).