

Optimized Derivation of Predicted No-Effect Concentrations (PNECs) for Eight Polycyclic Aromatic Hydrocarbons (PAHs) Using HC10 Based on Acute Toxicity Data

Abstract

1. Introduction
2. Materials and Methods
2.1. Acquisition, Screening, and Processing of Toxicity Data
2.2. The Construction of SSD Curves
2.3. The Calculation of PNECs
3. Results and Discussion
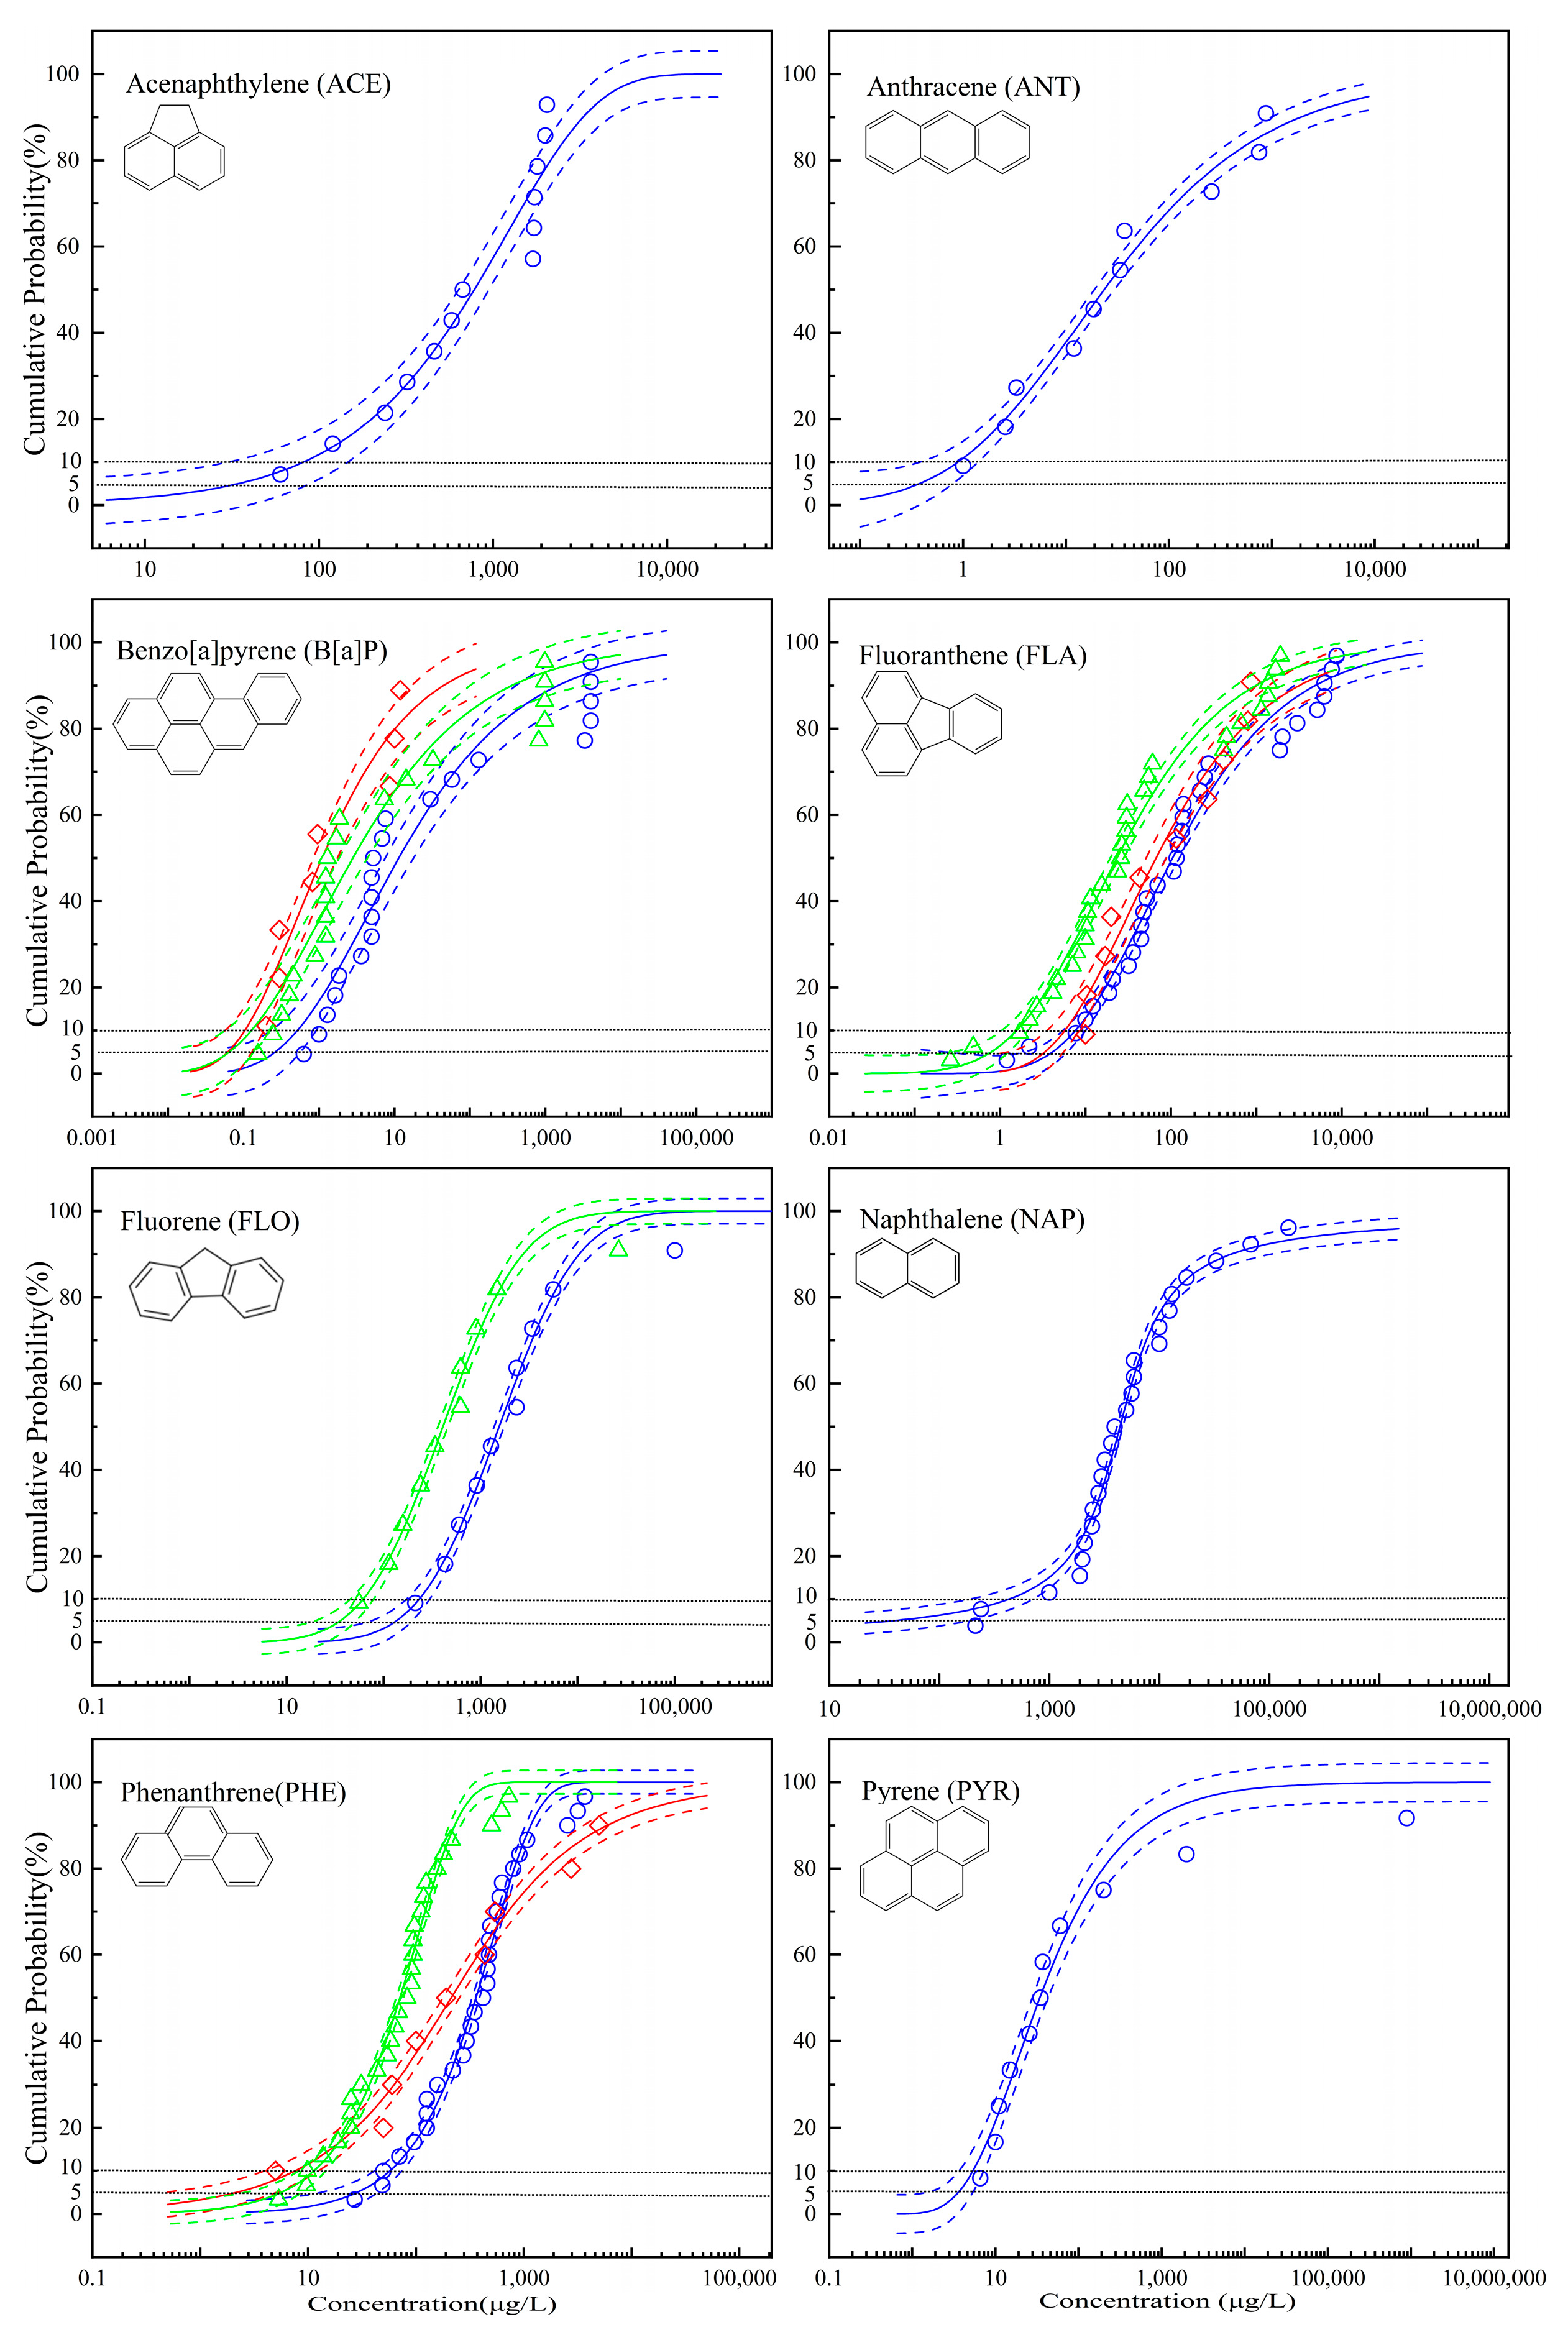
3.1. The Optimal Fitting of SSD Curves
3.2. The Feasibility of Using Acute Toxicity Data to Derive Chronic PNECs
3.3. Derivation of Chronic PNECs for Eight PAHs Using HC10 to Reduce Uncertainty
4. Conclusions
Supplementary Materials
Author Contributions
Funding
Institutional Review Board Statement
Informed Consent Statement
Data Availability Statement
Conflicts of Interest
References
- Jesus, F.; Pereira, J.L.; Campos, I.; Santos, M.; Re, A.; Keizer, J.; Nogueira, A.; Goncalves, F.J.M.; Abrantes, N.; Serpa, D. A review on polycyclic aromatic hydrocarbons distribution in freshwater ecosystems and their toxicity to benthic fauna. Sci. Total Environ. 2022, 820, 153282. [Google Scholar] [CrossRef] [PubMed]
- Li, Y.; Guo, N.; Yuan, K.; Chen, B.; Wang, J.; Hua, M.; Yu, J.; Hu, J.; Lu, R.; Zou, S.; et al. Variations in the concentration, source and flux of polycyclic aromatic hydrocarbons in sediments of the Pearl River Estuary: Implications for anthropogenic impacts. Sci. Total Environ. 2023, 862, 160870. [Google Scholar] [CrossRef] [PubMed]
- Reizer, E.; Viskolcz, B.; Fiser, B. Formation and growth mechanisms of polycyclic aromatic hydrocarbons: A mini-review. Chemosphere 2022, 291 Pt 1, 132793. [Google Scholar] [CrossRef]
- Givechev, I.; Tanev, D.; Danalev, D. Development and validation of GC/MS method for simultaneous determination of 16 polycyclic aromatic hydrocarbons (PAHs) in pork meat matrix. Acta Chromatogr. 2020, 33, 57–63. [Google Scholar] [CrossRef]
- Wang, W.; Xu, J.; Qu, X.; Lin, D.; Yang, K. An improved method to predict polycyclic aromatic hydrocarbons in surface freshwater by reducing the input parameters. Sci. Total Environ. 2022, 816, 151597. [Google Scholar] [CrossRef]
- Montuori, P.; De Rosa, E.; Di Duca, F.; Provvisiero, D.P.; Sarnacchiaro, P.; Nardone, A.; Triassi, M. Estimation of Polycyclic Aromatic Hydrocarbons Pollution in Mediterranean Sea from Volturno River, Southern Italy: Distribution, Risk Assessment and Loads. Int. J. Environ. Res. Public Health 2021, 18, 1383. [Google Scholar] [CrossRef]
- Yu, H.; Liu, Y.; Han, C.; Fang, H.; Weng, J.; Shu, X.; Pan, Y.; Ma, L. Polycyclic aromatic hydrocarbons in surface waters from the seven main river basins of China: Spatial distribution, source apportionment, and potential risk assessment. Sci. Total Environ. 2021, 752, 141764. [Google Scholar] [CrossRef]
- Apata, A.; Ololade, I.A.; Oladoja, N.A.; Alabi, B.A.; Ololade, O.O. Polycyclic aromatic hydrocarbons in selected rivers in southwestern Nigeria: Seasonal distribution, source apportionment and potential risk assessment. Reg. Stud. Mar. Sci. 2022, 52, 102318. [Google Scholar] [CrossRef]
- Mogashane, T.M.; Mujuru, M.; Ambushe, A.A. Determination and distribution of 16 polycyclic aromatic hydrocarbons in water samples from Blood and Mokolo Rivers in Limpopo Province, South Africa. Phys. Chem. Earth Parts A/B/C 2022, 127, 103165. [Google Scholar] [CrossRef]
- Teodora Ciucure, C.; Geana, E.I.; Lidia Chitescu, C.; Laurentiu Badea, S.; Elena Ionete, R. Distribution, sources and ecological risk assessment of polycyclic aromatic hydrocarbons in waters and sediments from Olt River dam reservoirs in Romania. Chemosphere 2022, 311 Pt 2, 137024. [Google Scholar] [CrossRef]
- Meng, Y.; Liu, X.; Lu, S.; Zhang, T.; Jin, B.; Wang, Q.; Tang, Z.; Liu, Y.; Guo, X.; Zhou, J.; et al. A review on occurrence and risk of polycyclic aromatic hydrocarbons (PAHs) in lakes of China. Sci. Total. Environ. 2019, 651, 2497–2506. [Google Scholar] [CrossRef]
- Vijayanand, M.; Ramakrishnan, A.; Subramanian, R.; Issac, P.K.; Nasr, M.; Khoo, K.S.; Rajagopal, R.; Greff, B.; Wan Azelee, N.I.; Jeon, B.H.; et al. Polyaromatic hydrocarbons (PAHs) in the water environment: A review on toxicity, microbial biodegradation, systematic biological advancements, and environmental fate. Environ. Res. 2023, 227, 115716. [Google Scholar] [CrossRef]
- Honda, M.; Suzuki, N. Toxicities of Polycyclic Aromatic Hydrocarbons for Aquatic Animals. Int. J. Environ. Res. Public Health 2020, 17, 1363. [Google Scholar] [CrossRef]
- Ben Othman, H.; Pick, F.R.; Sakka Hlaili, A.; Leboulanger, C. Effects of polycyclic aromatic hydrocarbons on marine and freshwater microalgae—A review. J. Hazard. Mater. 2023, 441, 129869. [Google Scholar] [CrossRef]
- Wenzl, T.; Simon, R.; Anklam, E.; Kleiner, J. Analytical methods for polycyclic aromatic hydrocarbons (PAHs) in food and the environment needed for new food legislation in the European Union. TrAC Trends Anal. Chem. 2006, 25, 716–725. [Google Scholar] [CrossRef]
- Sorgog, K.; Kamo, M. Quantifying the precision of ecological risk: Conventional assessment factor method vs. species sensitivity distribution method. Ecotoxicol. Environ. Saf. 2019, 183, 109494. [Google Scholar] [CrossRef]
- Gredelj, A.; Barausse, A.; Grechi, L.; Palmeri, L. Deriving predicted no-effect concentrations (PNECs) for emerging contaminants in the river Po, Italy, using three approaches: Assessment factor, species sensitivity distribution and AQUATOX ecosystem modelling. Environ. Int. 2018, 119, 66–78. [Google Scholar] [CrossRef]
- Chapman, P.M.; Fairbrother, A.; Brown, D. A critical evaluation of safety (uncertainty) factors for ecological risk assessment. Environ. Toxicol. Chem. 1998, 17, 99–108. [Google Scholar] [CrossRef]
- European Community. Technical Guidance Document on Risk Assessment; Institute for Health and Consumer Protection: Ispra, Italy, 2003. [Google Scholar]
- Belanger, S.; Barron, M.; Craig, P.; Dyer, S.; Galay-Burgos, M.; Hamer, M.; Marshall, S.; Posthuma, L.; Raimondo, S.; Whitehouse, P. Future needs and recommendations in the development of species sensitivity distributions: Estimating toxicity thresholds for aquatic ecological communities and assessing impacts of chemical exposures. Integr. Environ. Assess Manag. 2017, 13, 664–674. [Google Scholar] [CrossRef]
- Fox, D.R.; Dam, R.A.; Fisher, R.; Batley, G.E.; Tillmanns, A.R.; Thorley, J.; Schwarz, C.J.; Spry, D.J.; Mctavish, K. Recent Developments in Species Sensitivity Distribution Modeling. Environ. Toxicol. Chem. 2021, 40, 293–308. [Google Scholar] [CrossRef] [PubMed]
- Carl, S.; Angeline, T. Improving Statistical Methods for Modeling Species Sensitivity Distributions; Province of British Columbia, Victoria: Victoria, BC, Canada, 2019. [Google Scholar]
- Carr, G.J.; Belanger, S.E. SSDs Revisited: Part I-A Framework for Sample Size Guidance on Species Sensitivity Distribution Analysis. Environ. Toxicol. Chem. 2019, 38, 1514–1525. [Google Scholar] [CrossRef] [PubMed]
- Tian, Y.; Zeng, Y.; Li, C.; Wang, X.; Liu, Q.; Zhao, Y. Ecological risk assessment of petroleum hydrocarbons on aquatic organisms based on multisource data. Ecotoxicol. Environ. Saf. 2020, 192, 110262. [Google Scholar] [CrossRef] [PubMed]
- Iwasaki, Y.; Kotani, K.; Kashiwada, S.; Masunaga, S. Does the Choice of NOEC or EC10 Affect the Hazardous Concentration for 5% of the Species? Environ. Sci. Technol. 2015, 49, 9326–9330. [Google Scholar] [CrossRef] [PubMed]
- Xu, F.L.; Li, Y.L.; Wang, Y.; He, W.; Kong, X.Z.; Qin, N.; Liu, W.X.; Wu, W.J.; Jorgensen, S.E. Key issues for the development and application of the species sensitivity distribution (SSD) model for ecological risk assessment. Ecol. Indic. 2015, 54, 227–237. [Google Scholar] [CrossRef]
- Zheng, B.; Wang, L.; Lei, K.; Nan, B. Distribution and ecological risk assessment of polycyclic aromatic hydrocarbons in water, suspended particulate matter and sediment from Daliao River estuary and the adjacent area, China. Chemosphere 2016, 149, 91–100. [Google Scholar] [CrossRef]
- Wu, J.; Yan, Z.; Yi, X.; Lin, Y.; Ni, J.; Gao, X.; Liu, Z.; Shi, X. Comparison of species sensitivity distributions constructed with predicted acute toxicity data from interspecies correlation estimation models and measured acute data for benzo[a]pyrene. Chemosphere 2016, 144, 2183–2188. [Google Scholar] [CrossRef]
- Wu, J.Y.; Liu, Z.T.; Yan, Z.G.; Yi, X.L. Derivation of water quality criteria of phenanthrene using interspecies correlation estimation models for aquatic life in China. Environ. Sci. Pollut. Res. 2015, 22, 9457–9463. [Google Scholar] [CrossRef]
- Qin, N.; He, W.; Kong, X.Z.; Liu, W.X.; He, Q.S.; Yang, B.; Ouyang, H.L.; Wang, Q.M.; Xu, F.L. Ecological risk assessment of polycyclic aromatic hydrocarbons (PAHs) in the water from a large Chinese lake based on multiple indicators. Ecol. Indic. 2013, 24, 599–608. [Google Scholar] [CrossRef]
- Wang, Y.; Wang, J.; Mu, J.; Wang, Z.; Yao, Z.; Lin, Z. Aquatic predicted no-effect concentration for three polycyclic aromatic hydrocarbons and probabilistic ecological risk assessment in Liaodong Bay of the Bohai Sea, China. Environ. Sci. Pollut. R 2014, 21, 148–158. [Google Scholar] [CrossRef]
- Wang, Y.Y.L.; Xiong, J.; Ohore, O.E.; Cai, Y.E.; Fan, H.; Sanganyado, E.; Li, P.; You, J.; Liu, W.; Wang, Z. Deriving freshwater guideline values for neonicotinoid insecticides: Implications for water quality guidelines and ecological risk assessment. Sci. Total Environ. 2022, 828, 154569. [Google Scholar] [CrossRef]
- Charles, E.S.; Donald, I.M.; David, J.H.; John, R.G.; Gary, A.C.; William, A.B. Guidelines for Derivation Munerical National Water Quality Criterai for the Peotection of Auqatic Organisms and Their Uses; US Environmental Protection Agency: Washington, DC, USA, 1985; p. 98. [Google Scholar]
- Williams, E.S.; Panko, J.; Paustenbach, D.J. The European Union’s REACH regulation: A review of its history and requirements. Crit. Rev. Toxicol. 2009, 39, 553–575. [Google Scholar] [CrossRef]
- OECD. Guidance Document for Aquatic Effects Assessment; Organisation for Economic Co-Operation and Development, Environmental Monograph 92: Paris, France, 1995. [Google Scholar]
- Hiki, K.; Iwasaki, Y. Can We Reasonably Predict Chronic Species Sensitivity Distributions from Acute Species Sensitivity Distributions? Environ. Sci. Technol. 2020, 54, 13131–13136. [Google Scholar] [CrossRef]
- Lambert, F.N.; Raimondo, S.; Barron, M.G. Assessment of a new approach method for grouped chemical hazard estimation: The toxicity-normalized speciessensitivity distribution (SSDn). Environ. Sci. Technol. 2022, 56, 8278–8289. [Google Scholar] [CrossRef]
- Deforest, D.K.; Schlekat, C.E. Species sensitivity distribution evaluation for chronic nickel toxicity to marine organisms. Integr. Environ. Assess. Manag. 2013, 9, 580–589. [Google Scholar] [CrossRef]
- Lu, B.Q.; Liu, S.S.; Wang, Z.J.; Xu, Y.Q. Conlecs: A novel procedure for deriving the concentration limits of chemicals outside the criteria of human drinking water using existing criteria and species sensitivity distribution based on quantitative structure-activity relationship prediction. J. Hazard. Mater. 2020, 384, 121380. [Google Scholar] [CrossRef]
- Duran, I.; Beiras, R. Acute water quality criteria for polycyclic aromatic hydrocarbons, pesticides, plastic additives, and 4-Nonylphenol in seawater. Environ. Pollut. 2017, 224, 384–391. [Google Scholar] [CrossRef]
- Huang, P.; Liu, S.S.; Wang, Z.J.; Ding, T.T.; Xu, Y.Q. Deriving the predicted no effect concentrations of 35 pesticides by the QSAR-SSD method. Chemosphere 2022, 298, 134303. [Google Scholar] [CrossRef]
- Zhu, X.W.; Lui, S.S.; Ge, H.L.; Liu, Y. Comparision between two confidence intervals of dose-response relationships. China Environ. Sci. 2009, 29, 113–117. (In Chinese) [Google Scholar]
- Wang, Z.J.; Liu, S.S.; Huang, P.; Xu, Y.Q. Mixture predicted no-effect concentrations derived by independent action model vs concentration addition model based on different species sensitivity distribution models. Ecotoxicol. Environ. Saf. 2021, 227, 112898. [Google Scholar] [CrossRef]
- Chen, J.; Fan, B.; Li, J.; Wang, X.; Li, W.; Cui, L.; Liu, Z. Development of human health ambient water quality criteria of 12 polycyclic aromatic hydrocarbons (PAH) and risk assessment in China. Chemosphere 2020, 252, 126590. [Google Scholar] [CrossRef]
- ANZECC. Australian and New Zealand Guidelines for Fresh and Marine Water Quality; Australian and New Zealand Environment and Conservation Council and Agriculture and Resource Management Council of Australia and New Zealand: Auckland, New Zealand, 2000. Available online: https://www.waterquality.gov.au/sites/default/files/documents/anzecc-armcanz-2000-guidelines-vol1.pdf (accessed on 20 April 2023).
- CCME. Canadian Water Quality Guidelines for the Protection of Aquatic Life (PAHs); Canadian Council of Ministers of the Environment: Winnipeg, Canada, 2016; Available online: https://ccme.ca/en/summary-table (accessed on 20 April 2023).
- GB 3838-2002; Environmental Quality Standards for Surface Water. Ministry of Ecology and Environment of the People’s Republic of China: Beijing, China, 2002. Available online: http://english.mee.gov.cn/Resources/standards/water_environment/quality_standard/200710/t20071024_111792.shtml (accessed on 20 April 2023).
- EU. Directive 2013/39/EU of the Eurpoean Parliament and of the Council, UNION E, 2013. Available online: http://data.europa.eu/eli/dir/2013/39/oj (accessed on 20 April 2023).
- Agency, U.S.E.P. In-Depth Studies on Health and Environmental Impacts of Selected Water Pollutants. U.S.EPA Contract No.68-01-4646. Available online: https://hero.epa.gov/hero/index.cfm/reference/details/reference_id/75127 (accessed on 20 April 2023).
- Turner, L.W. Acute Toxicity of Selected Chemicals to Fathead Minnow, Water Flea and Mysid Shrimp Under Static and Flow-Through Test Conditions. Available online: https://cfpub.epa.gov/si/si_public_record_report.cfm?Lab=NHEERL&dirEntryId=43246 (accessed on 20 April 2023).
- Horne, J.D.; Swirsky, M.A.; Hollister, T.A.; Oblad, B.R.; Kennedy, J.H. Aquatic Toxicity Studies of Five Priority Pollutants. EPA Contract No. 68-01-6201. NUS Corporation. Houston Environmental Center, Houston, TX, USA, p. 196. Available online: https://hero.epa.gov/hero/index.cfm/reference/details/reference_id/3617731 (accessed on 20 April 2023).
- Holcombe, G.W.; Phipps, G.L.; Fiandt, J.T. Toxicity of selected priority pollutants to various aquatic organisms. Ecotoxicol. Environ. Saf. 1983, 7, 400–409. [Google Scholar] [CrossRef]
- Buccafusco, R.J.; Ells, S.J.; LeBlanc, G.A. Acute toxicity of priority pollutants to bluegill (Lepomis macrochirus). Bull. Environ. Contam. Toxicol. 1981, 26, 446–452. [Google Scholar] [CrossRef] [PubMed]
- Geiger, D.L.; Northcott, C.E.; Call, D.J.; Brooke, L.T. Acute Toxicities of Organic Chemicals to Fathead Minnows (Pimephales promelas), Volume II. Available online: https://minds.wisconsin.edu/handle/1793/81144 (accessed on 20 April 2023).
- Cairns, M.A.; Nebeker, A.V. Toxicity of acenaphthene and isophorone to early life stages of fathead minnows. Arch. Environ. Contam. Toxicol. 1982, 11, 703–707. [Google Scholar] [CrossRef] [PubMed]
- The Academy of Natural Sciences. Early Life Stage Studies Using the Fathead Minnow (Pimephales promelas) to Assess the Effects of Isophorone and Acenaphthene; Final Report; The Academy of Natural Sciences: Philadelphia, PA, USA, 1981. [Google Scholar]
- Marine Bioassay Laboratories. Flow-Through Early-Life Stage Toxicity Tests with Fathead Minnows (Pimephales promelas); Report Prepared for U.S. EPA, Contract No. 68-03-2947; Marine Bioassay Laboratories: Watsonville, CA, USA, 1981; 72p. [Google Scholar]
- Meier, P.G.; Choi, K.; I Sweet, L. Acute and chronic life cycle toxicity of acenaphthene and 2,4,6-trichlorophenol to the midge Paratanytarsus parthenogeneticus (Diptera: Chironomidae). Aquat. Toxicol. 2000, 51, 31–44. [Google Scholar] [CrossRef]
- Lemke, A.E.; Anderson, R.L. Insect Interlaboratory Toxicity Test Comparison Study for the Chironomid (Paratanytarsus sp.); Procedure EPA-600/3-84-054; U.S. EPA: Duluth, MN, USA, 1984; p. 15. [Google Scholar]
- Lemke, A.E. Round Robin Testing of the Midge (Tanytarsus): Acute and Chronic Toxicity Tests of 2,4,6-Trichlorophenol and Acenaphthene; Final Report, Contract No.68-03-3081; U.S. EPA: Duluth, MN, USA, 1982; p. 66. [Google Scholar]
- Grote, M.; Brack, W.; Walter, H.A.; Altenburger, R. Light as a confounding factor for toxicity assessment of complex contaminated sediments. Environ. Toxicol. Chem. 2005, 24, 3143–3152. [Google Scholar] [CrossRef] [PubMed]
- Gala, W.; Giesy, J. Photo-induced toxicity of anthracene to the green alga, Selenastrum capricornutum. Arch. Environ. Contam. Toxicol. 1992, 23, 316–323. [Google Scholar] [CrossRef]
- Abernethy, S.; Bobra, A.; Shiu, W.; Wells, P.; Mackay, D. Acute lethal toxicity of hydrocarbons and chlorinated hydrocarbons to two planktonic crustaceans: The key role of organism-water partitioning. Aquat. Toxicol. 1986, 8, 163–174. [Google Scholar] [CrossRef]
- Munoz, M.J.; Tarazona, J.V. Synergistic Effect of Two- and Four-Component Combinations of the Polycyclic Aromatic Hydrocarbons: Phenanthrene, Anthracene, Naphthalene and Acenaphthene on Daphnia magna. Bull. Environ. Contam. Toxicol. 1993, 50, 363–368. [Google Scholar] [CrossRef]
- Lampi, M.A.; Gurska, J.; McDonald, K.I.C.; Xie, F.; Huang, X.-D.; Dixon, D.G.; Greenberg, B.M. Photoinduced toxicity of polycyclic aromatic hydrocarbons to Daphnia magna: Ultraviolet-mediated effects and the toxicity of polycyclic aromatic hydrocarbon photoproducts. Environ. Toxicol. Chem. 2006, 25, 1079–1087. [Google Scholar] [CrossRef]
- Smith, S.B.; Savino, J.F.; Blouin, M.A. Acute Toxicity to Daphnia Pulex of Six Classes of Chemical Compounds Potentially Hazardous to Great Lakes Aquatic Biota. J. Great Lakes Res. 1988, 14, 394–404. [Google Scholar] [CrossRef]
- Isherwood, D.M. Photoinduced Toxicity of Metals and PAHs to Hyalella azteca: UV-Mediated Toxicity and the Effects of Their Photoproducts. M.S. Thesis, University of Waterloo, Ontario, Canada, May 2009; p. 266. [Google Scholar]
- Oris, J.T., Jr. Photoinduced Toxicity of Anthracene to Juvenile Bluegill Sunfish (Lepomis macrochirus Rafinesque): Photoperiod Effects and Predictive Hazard. Environ. Toxicol. Chem. 1986, 5, 761–768. [Google Scholar] [CrossRef]
- Oris, J.T.; Giesy, J.P. The photoenhanced toxicity of anthracene to juvenile sunfish (Lepomis spp.). Aquat. Toxicol. 1985, 6, 133–146. [Google Scholar] [CrossRef]
- McCloskey, J.T.; Oris, J.T. Effect of water temperature and dissolved oxygen concentration on the photo-induced toxicity of anthracene to juvenile bluegill sunfish (Lepomis macrochirus). Aquat. Toxicol. 1991, 21, 145–156. [Google Scholar] [CrossRef]
- Oris, J.; Giesy, J.; Allred, P.; Grant, D.; Landrum, P. Photoinduced Toxicity of Anthracene in Aquatic Organisms: An Environmental Perspective. Stud. Environ. Sci. 1984, 25, 639–658. [Google Scholar] [CrossRef]
- Borovsky, D.; Linley, J.R.; Kagan, J. Polycyclic aromatic compounds as phototoxic mosquito larvicides. J. Am. Mosq. Control. Assoc. 1987, 3, 246–250. [Google Scholar] [PubMed]
- Schoeny, R.; Cody, T.; Warshawsky, D.; Radike, M. Metabolism of mutagenic polycyclic aromatic hydrocarbons by photosynthetic algal species. Mutat. Res. Mol. Mech. Mutagen. 1988, 197, 289–302. [Google Scholar] [CrossRef] [PubMed]
- Kusk, K.O.; Christensen, A.M.; Nyholm, N. Algal growth inhibition test results of 425 organic chemical substances. Chemosphere 2018, 204, 405–412. [Google Scholar] [CrossRef] [PubMed]
- Saka, M. Developmental Toxicity of p,p′-Dichlorodiphenyltrichloroethane, 2,4,6-Trinitrotoluene, Their Metabolites, and Benzo(a)pyrene in Xenopus laevis Embryos. Environ. Toxicol. Chem. 2004, 23, 1065–1073. [Google Scholar] [CrossRef]
- Yan, Z.G.; Wu, J.Y.; Wang, X.N.; Zhang, Y.H. Toxic pollutants in China study of water quality criteria. In Toxic Pollutants in China; Yan, Z.G., Liu, Z.T., Eds.; Springer: New York, NY, USA, 2015; p. 147. [Google Scholar]
- Trucco, R.; Engelhardt, F.; Stacey, B. Toxicity, accumulation and clearance of aromatic hydrocarbons in Daphnia pulex. Environ. Pollut. Ser. A Ecol. Biol. 1983, 31, 191–202. [Google Scholar] [CrossRef]
- Jiang, R.L.; Xiao, B.C.; Yu, N.; Chen, L.Q. Research advance in toxic effects of PAHs on aquatic animals. Mar. Fish. 2014, 36, 372–384. (In Chinese) [Google Scholar] [CrossRef]
- Weigt, S.; Huebler, N.; Strecker, R.; Braunbeck, T.; Broschard, T.H. Zebrafish (Danio rerio) embryos as a model for testing proteratogens. Toxicology 2011, 281, 25–36. [Google Scholar] [CrossRef]
- Bruner, K.; Fisher, S.; Fry, D.; Lydy, M. Effects of Sediment and the Route of Exposure on the Toxicity and Accumulation of Neutral Lipophilic and Moderately Water-Soluble Metabolizable Compounds in the Midge; ASTM International: West Conshohocken, PE, USA, 2009; p. 140. [Google Scholar] [CrossRef]
- Forget-Leray, J.; Landriau, I.; Minier, C.; Leboulenger, F. Impact of endocrine toxicants on survival, development, and reproduction of the estuarine copepod Eurytemora affinis (Poppe). Ecotoxicol. Environ. Saf. 2005, 60, 288–294. [Google Scholar] [CrossRef]
- Hu, J.F.; Wang, P.W.; Zhang, C.L.; Yu, S.F.; Han, H.F.; Liu, G.Q. Effect of B(a)P on induction of NO and NOS in brain of carassius auratus. China Public Health 2005, 21, 62–63. (In Chinese) [Google Scholar]
- Palanikumar, L.; Kumaraguru, A.K.; Ramakritinan, C.M.; Anand, M. Toxicity, Feeding Rate and Growth Rate Response to Sub-lethal Concentrations of Anthracene and Benzo [a] Pyrene in Milkfish Chanos chanos (Forskkal). Bull. Environ. Contam. Toxicol. 2012, 90, 60–68. [Google Scholar] [CrossRef] [PubMed]
- Kim, W.-K.; Lee, S.-K.; Choi, K.; Jung, J. Integrative assessment of biomarker responses in pale chub (Zacco platypus) exposed to copper and benzo[a]pyrene. Ecotoxicol. Environ. Saf. 2013, 92, 71–78. [Google Scholar] [CrossRef]
- Sánchez-Argüello, P.; Aparicio, N.; Fernández, C. Linking embryo toxicity with genotoxic responses in the freshwater snail Physa acuta: Single exposure to benzo(a)pyrene, fluoxetine, bisphenol A, vinclozolin and exposure to binary mixtures with benzo(a)pyrene. Ecotoxicol. Environ. Saf. 2012, 80, 152–160. [Google Scholar] [CrossRef] [PubMed]
- Hatch, A.C., Jr. Effects of Photoinduced Toxicity of Fluoranthene on Amphibian Embryos and Larvae. Environ. Toxicol. Chem. 1998, 17, 1777–1785. [Google Scholar] [CrossRef]
- Oris, J.T.; Winner, R.W.; Moore, M.V. A Four-Day Survival And Reproduction Toxicity Test For Ceriodaphnia Dubia. Environ. Toxicol. Chem. 1991, 10, 217–224. [Google Scholar] [CrossRef]
- Brooke, L.T. Acute and Chronic Toxicity of Fluoranthene, with and without Additional Ultraviolet Light, to Twelve Species of Freshwater Organisms; U.S.EPA Contract No.68-C1-0034; U.S. EPA: Duluth, MN, USA, 1993; p. 51. [Google Scholar]
- Horne, J.D.; Oblad, B.R. Aquatic Toxicity Studies of Six Priority Pollutants; EPA Contract, No. 68-01-6201; NUS Corporation, Houston Environmental Center: Houston, TX, USA, 1983; p. 104. [Google Scholar]
- Spehar, R.L.; Poucher, S.; Brooke, L.T.; Hansen, D.J.; Champlin, D.; Cox, D.A. Comparative Toxicity of Fluoranthene to Freshwater and Saltwater Species Under Fluorescent and Ultraviolet Light. Arch. Environ. Contam. Toxicol. 1999, 37, 496–502. [Google Scholar] [CrossRef]
- Gendusa, A.C. Toxicity of Chromium and Fluoranthene from Aqueous and Sediment Sources to Selected Freshwater Fish. Ph.D. Thesis, University of North Texas, Denton, TX, USA, May 1990; p. 138. [Google Scholar]
- Cho, E.A. Bioturbation as a Novel Method to Characterize the Toxicity of Aquatic Sediment. Ph.D. Thesis, North Carolina State University, Raleigh, NC, USA, May 2005; p. 153. [Google Scholar]
- Suedel, B.C.; Rodgers, J.J.H. Toxicity of Fluoranthene to Daphnia magna, Hyalella azteca, Chironomus tentans, and Stylaria lacustris in Water-Only and Whole Sediment Exposures. Bull. Environ. Contam. Toxicol. 1996, 57, 132–138. [Google Scholar] [CrossRef]
- Kane Driscoll, S.; Landrum, P.F. A Comparison of Equilibrium Partitioning and Critical Body Residue Approaches for Predicting Toxicity of Sediment-Associated Fluoranthene to Freshwater Amphipods. Environ. Toxicol. Chem. 1997, 16, 2179–2186. [Google Scholar] [CrossRef]
- Stewart, K.M.; Thompson, R.S. Fluoranthene as a model toxicant in sediment studies with Chironomus riparius. J. Aquat. Ecosyst. Health 1995, 4, 231–238. [Google Scholar] [CrossRef]
- Weinstein, J.E. The Molecular, Subcellular, and Cellular Effects of Urban-Derived Polycyclic Aromatic Hydrocarbons on the American Oyster, Crassostrea virginica (Gmelin 1791). Ph.D. Thesis, University of South Carolina, Columbia, SC, USA, 1994; p. 176. [Google Scholar]
- Finger, S.E.; Little, E.F.; Henry, M.G.; Fairchild, J.F.; Boyle, T.P. Available online: https://www.semanticscholar.org/paper/Comparison-of-Laboratory-and-Field-Assessment-of-I%3A-Finger-Little/4d362ac8c1560e60fb461c7e16f6dbecb5525864 (accessed on 20 April 2023).
- Mayer, F.L., Jr.; Ellersieck, M.R. Manual of Acute Toxicity: Interpretation and Data Base for 410 Chemicals and 66 Species of Freshwater Animals. 1986. Available online: https://hero.epa.gov/hero/index.cfm/reference/details/reference_id/5348414 (accessed on 20 April 2023).
- Kauss, P.; Hutchinson, T. The effects of water-soluble petroleum components on the growth of Chlorella vulgaris Beijerinck. Environ. Pollut. 1975, 9, 157–174. [Google Scholar] [CrossRef]
- Edmisten, G.E.; Bantle, J.A. Use of Xenopus laevis larvae in 96-hour, flow-through toxicity tests with naphthalene. Bull. Environ. Contam. Toxicol. 1982, 29, 392–399. [Google Scholar] [CrossRef] [PubMed]
- Agency, U.S.E.P. Pesticide Ecotoxicity Database (Formerly: Environmental Effects Database (EEDB)); Environmental Fate and Effects Division, U.S. EPA: Washington, DC, USA, 1992. [Google Scholar]
- LeBlanc, G.A. Acute toxicity of priority pollutants to water flea (Daphnia magna). Bull. Environ. Contam. Toxicol. 1980, 24, 684–691. [Google Scholar] [CrossRef]
- MacLean, M.M.; Doe, K.G. The Comparative Toxicity of Crude and Refined Oils to Daphnia magna and Artemia; Environment Canada: Dartmouth, NS, Canada, 1989; p. 64. [Google Scholar]
- Eastmond, D.A.; Booth, G.M.; Lee, M.L. Toxicity, Accumulation, and Elimination of Polycyclic Aromatic Sulfur Heterocycles in Daphnia magna. Arch. Environ. Contam. Toxicol. 1984, 13, 105–111. [Google Scholar] [CrossRef]
- Crider, J.Y.; Wilhm, J.; Harmon, H.J. Effects of naphthalene on the hemoglobin concentration and oxygen uptake of Daphnia magna. Bull. Environ. Contam. Toxicol. 1982, 28, 52–57. [Google Scholar] [CrossRef] [PubMed]
- Millemann, R.E.; Birge, W.J.; Black, J.A.; Cushman, R.M.; Daniels, K.L.; Franco, P.J.; Giddings, J.M.; McCarthy, J.F.; Stewart, A.J. Comparative Acute Toxicity to Aquatic Organisms of Components of Coal-Derived Synthetic Fuels. Trans. Am. Fish. Soc. 1984, 113, 74–85. [Google Scholar] [CrossRef]
- BioDynamics Inc 91-20-3. Available online: https://www.chemicoco.env.go.jp/download/xls/91-20-3.xlsx (accessed on 20 April 2023).
- Brausch, J.M.; Smith, P.N. Development of resistance to cyfluthrin and naphthalene among Daphnia magna. Ecotoxicology 2009, 18, 600–609. [Google Scholar] [CrossRef] [PubMed]
- Saha, M.K.; Konar, S.K. Acute Toxicity of Some Petroleum Pollutants to Plankton and Fish. Environ. Ecol. 1983, 1, 117–119. [Google Scholar]
- Jaiswal, K.; Sarojini, R.; Nagabhushanam, R. Effects of Naphthalene on Freshwater Prawn, Macrobrachium kistnensis in Relation to Different Moult Stages. Geobios Jodhpur 1989, 16, 225–226. [Google Scholar]
- Wallen, I.E.; Greer, W.C.; Lasater, R. Toxicity to Gambusia affinis of Certain Pure Chemicals in Turbid Waters. Sewage Ind. Wastes 1957, 29, 695–711. [Google Scholar]
- Andersen, H.B.; Caldwell, R.S.; Toll, J.; Do, T.; Saban, L. Sensitivity of Lamprey Ammocoetes to Six Chemicals. Arch. Environ. Contam. Toxicol. 2010, 59, 622–631. [Google Scholar] [CrossRef] [PubMed]
- Pollino, C.A.; Holdway, D.A. Toxicity Testing of Crude Oil and Related Compounds Using Early Life Stages of the Crimson-Spotted Rainbowfish (Melanotaenia fluviatilis). Ecotoxicol. Environ. Saf. 2002, 52, 180–189. [Google Scholar] [CrossRef]
- Black, J.A.; Birge, W.J.; Westerman, A.G.; Francis, P.C. Comparative Aquatic Toxicology of Aromatic Hydrocarbons. Fundam. Appl. Toxicol. 1983, 3, 353–358. [Google Scholar] [CrossRef]
- Korn, S.; Rice, S. Sensitivity to, and Accumulation and Depuration of, Aromatic Petroleum Components by Early Life Stages of Coho Salmon (Oncorhynchus kisutch). 1981. Available online: https://www.degruyter.com/database/IBZ/entry/ibz.ID538081663/html (accessed on 20 April 2023).
- Moles, A.; Bates, S.; Rice, S.D.; Korn, S. Reduced Growth of Coho Salmon Fry Exposed to Two Petroleum Components, Toluene and Naphthalene, in Fresh Water. Trans. Am. Fish. Soc. 1981, 110, 430–436. [Google Scholar] [CrossRef]
- Moles, A. Sensitivity of Parasitized Coho Salmon Fry to Crude Oil, Toluene, and Naphthalene. Trans. Am. Fish. Soc. 1980, 109, 293–297. [Google Scholar] [CrossRef]
- Edsall, C.C. Acute toxicities to larval rainbow trout of representative compounds detected in Great Lakes fish. Bull. Environ. Contam. Toxicol. 1991, 46, 173–178. [Google Scholar] [CrossRef]
- DeGraeve, G.M.; Elder, R.G.; Woods, D.C.; Bergman, H.L. Effects of naphthalene and benzene on fathead minnows and rainbow trout. Arch. Environ. Contam. Toxicol. 1982, 11, 487–490. [Google Scholar] [CrossRef] [PubMed]
- Bergman, H.; Anderson, A. Effects of Aqueous Effluents from In Situ Fossil Fuel Processing Technologies on Aquatic Systems. Annual Progress Report. 1977. Available online: https://www.osti.gov/servlets/purl/6865459 (accessed on 20 April 2023).
- Broderius, S.J.; Kahl, M.D.; Hoglund, M.D. Use of Joint Toxic Response to Define the Primary Mode of Toxic Action for Diverse Industrial Organic Chemicals. Environ. Toxicol. Chem. 1995, 14, 1591–1605. [Google Scholar] [CrossRef]
- El-Sayed, N.K.; Salem, S.A.; Moursy, A.; Ibrahim, B.M. Acute and Chronic Toxicity of Some Aromatic Hydrocarbons on Tilapia zillii (Gerv.). Bull. Natl. Inst. Oceanogr. Fish. 1995, 21, 613–630. [Google Scholar]
- Darville, R.G.; Wilhm, J.L. The effect of naphthalene on oxygen consumption and hemoglobin concentration in Chironomus attenuatus and on oxygen consumption and life cycle of Tanytarsus dissimilis. Environ. Toxicol. Chem. 1984, 3, 180–189. [Google Scholar] [CrossRef]
- Darville, R.G. The Effects of Naphthalene on the Physiology and Life Cycle of Chironomus attenuatus and Tanytarsus dissimilis. Ph.D. Thesis, Oklahoma State University, Stillwater, OK, USA, July 1982; p. 85. [Google Scholar]
- Hailing-Sørensen, B.; Nyhohn, N.; Baun, A. Algal toxicity tests with volatile and hazardous compounds in air-tight test flasks with CO2 enriched headspace. Chemosphere 1996, 32, 1513–1526. [Google Scholar] [CrossRef]
- Wu, J.Y.; Xu, G.D.; Lin, Y.F.; Zheng, L.; Wang, X.N.; Tan, J.; Guo, Z.X.; Wang, G.S.; Zheng, Y.; Ren, X.Y. Development of freshwater aquatic life water quality criteria for phenanthrene in China. Acta Sci. Circumstantiae 2018, 38, 399–406. (In Chinese) [Google Scholar] [CrossRef]
- Holcombe, G.W.; Phipps, G.L.; Knuth, M.L.; Felhaber, T. The acute toxicity of selected substituted phenols, benzenes and benzoic acid esters to fathead minnows Pimephales promelas. Environ. Pollut. Ser. A Ecol. Biol. 1984, 35, 367–381. [Google Scholar] [CrossRef]
- Landrum, P.F.; Lotufo, G.R.; Gossiaux, D.C.; Gedeon, M.L.; Lee, J.-H. Bioaccumulation and critical body residue of PAHs in the amphipod, Diporeia spp.: Additional evidence to support toxicity additivity for PAH mixtures. Chemosphere 2003, 51, 481–489. [Google Scholar] [CrossRef]
- Call, D.J.; Brooke, L.T.; Harting, S.L.; Poirier, S.H.; McCauley, D.J. Toxicity of Phenanthrene to Several Freshwater Species. Available online: https://minds.wisconsin.edu/handle/1793/82321 (accessed on 20 April 2023).
- Mi, S.; Wang, L.; Wang, X. Acute Toxicity of Phenanthrene, Pyrene and Nonylphenol to Mysis Mysis. Hebei Fish. 2011, 8, 5–8. (In Chinese) [Google Scholar] [CrossRef]
- Yang, T.; Chen, H.G.; Cai, W.G.; JieFang, Q.; Jia, X.P. Acute and chronic toxicity effects of phenanthrene in seawater on crimson snapper (Lutjanus erythropterus). J. Fish. Sci. China 2011, 35, 298–304. (In Chinese) [Google Scholar]
- Xie, J.F.; Wu, T.; Pan, S.X.; Wang, J.F.; Li, C.Q. The estimation of median tolerance limit of polynuclear aromatic hydrocarbons by gas chromatography. China Environ. Sci. 2000, 1, 36–39. (In Chinese) [Google Scholar]
- Chen, H.H.; Tan, J.H.; Liu, H.C.; Zhang, X.M.; Ma, X.F. Acute toxicity of representative heavy metals, polycyclic aromatic hydrocarbons(PAHs)and pyrethroid pesticide to Tanichthys albonubes. J. Huazhong Agric. Univ. 2011, 30, 511–515. (In Chinese) [Google Scholar] [CrossRef]
- Aksmann, A.; Tukaj, Z. The Effect of Anthracene and Phenanthrene on the Growth, Photosynthesis, and SOD Activity of the Green Alga Scenedesmus armatus Depends on the PAR Irradiance and CO2 Level. Arch. Environ. Contam. Toxicol. 2004, 47, 177–184. [Google Scholar] [CrossRef] [PubMed]
- Djomo, J.; Dauta, A.; Ferrier, V.; Narbonne, J.; Monkiedje, A.; Njine, T.; Garrigues, P. Toxic effects of some major polyaromatic hydrocarbons found in crude oil and aquatic sediments on Scenedesmus subspicatus. Water Res. 2004, 38, 1817–1821. [Google Scholar] [CrossRef] [PubMed]
- Savino, J.F.; Tanabe, L.L. Sublethal Effects of Phenanthrene, Nicotine, and Pinane on Daphnia pulex. Bull. Environ. Contam. Toxicol. 1989, 42, 778–784. [Google Scholar] [CrossRef]
- Sun, Y.; Yu, H.; Zhang, J.; Yin, Y.; Shi, H.; Wang, X. Bioaccumulation, depuration and oxidative stress in fish Carassius auratus under phenanthrene exposure. Chemosphere 2005, 63, 1319–1327. [Google Scholar] [CrossRef]
- Rhodes, S.; Farwell, A.; Hewitt, L.M.; MacKinnon, M.; Dixon, D.G. The effects of dimethylated and alkylated polycyclic aromatic hydrocarbons on the embryonic development of the Japanese medaka. Ecotoxicol. Environ. Saf. 2005, 60, 247–258. [Google Scholar] [CrossRef] [PubMed]
- Grote, M.; Brack, W.; Walter, H.; Altenburger, R. Confirmation of cause-effect relationships using effect-directed analysis for complex environmental samples. Environ. Toxicol. Chem. 2005, 24, 1420–1427. [Google Scholar] [CrossRef]
- Altenburger, R.; Walter, H.; Grote, M. What Contributes to the Combined Effect of a Complex Mixture? Environ. Sci. Technol. 2004, 38, 6353–6362. [Google Scholar] [CrossRef]
- Pagnout, C.; Rast, C.; Veber, A.-M.; Poupin, P.; Férard, J.-F. Ecotoxicological assessment of PAHs and their dead-end metabolites after degradation by Mycobacterium sp. strain SNP11. Ecotoxicol. Environ. Saf. 2006, 65, 151–158. [Google Scholar] [CrossRef]
- Nikkilä, A.; Penttinen, S.; Kukkonen, J.V. UV-B-Induced Acute Toxicity of Pyrene to the Waterflea Daphnia magna in Natural Freshwaters. Ecotoxicol. Environ. Saf. 1999, 44, 271–279. [Google Scholar] [CrossRef]
- Kennedy, C.J. Toxicokinetic Studies of Chlorinated Phenols and Polycyclic Aromatic Hydrocarbons in Rainbow Trout (Oncorhynchus mykiss). Ph.D. Thesis, Simon Fraser University, Burnaby, Canada, February 1990; p. 188. [Google Scholar]


| Rank | Acenaphthene(ACE) | Anthracene(ANT) | Benzo[a]pyrene(B[a]P) | Fluoranthene(FLA) | ||||||||
| Species | AV | Species | AV | Species | AV | Species | CV | Species | AV | Species | CV | |
| 1 | Paratanytarsus sp. | 60 | Aedes aegypti | 1 | Chlorella fusca var. vacuolata | 0.6308 | Zacco platypus | 0.2 | Lumbriculus variegatus | 1.2 | Crassostrea virginica | 10 |
| 2 | Daphnia magna | 120 | Lepomis macrochirus | 2.578 | Palaemonetes pugio | 1 | Daphnia magna | 0.3 | Hydra americana | 2.2 | Pimephales promelas | 10.4 |
| 3 | Tallaperla maria | 240 | Raphidocelis subcapitata | 3.3 | Daphnia magna | 1.298 | Carassius auratus | 0.3 | Oncorhynchus mykiss | 7.7 | Daphnia magna | 17 |
| 4 | Raphidocelis subcapitata | 322 | Lepomis sp. | 11.92 | Limnodrilus hoffmeisteri | 1.642 | Chanos chanos | 0.82 | Aedes aegypti | 10 | Chironomus tentans | 20 |
| 5 | Gammarus minus | 460 | Chlorella fusca var. vacuolata | 18.54 | Chironomus plumosus | 1.851 | Cyprinus flammans | 0.96 | Pimephales promelas | 12.2 | Chironomus riparius | 43 |
| 6 | Salmo trutta | 580 | Daphnia magna | 33.59 | Cyprinus flammans | 3.626 | Misgurnus anguillicaudatus | 8.681 | Physella virgata | 18.87 | Stylaria lacustris | 115 |
| 7 | Oncorhynchus mykiss | 670 | Culex quinquefasciatus | 37 | Scenedesmus acutus | 5 | Physella acuta | 10 | Lepomis macrochirus | 20.86 | Misgurnus anguillicaudatus | 269 |
| 8 | Lepomis macrochirus | 1700 | Aedes taeniorhynchus | 260 | Daphnia pulex | 5 | Eurytemora affinis | 12 | Gammarus minus | 32 | Hyalella azteca | 418.7 |
| 9 | Ictalurus punctatus | 1720 | Daphnia pulex | 754 | Rhodeus sinensis | 5 | Ictalurus punctatus | 36 | Pseudorasbora parva | 798 | ||
| 10 | Pimephales promelas | 1732 | Hyalella azteca | 873.70 | Chironomus riparius | 5 | Culex quinquefasciatus | 45 | Diporeia sp. | 861.6 | ||
| 11 | Paratanytarsus parthenogeneticus | 1800 | Rana limnocharis | 5.264 | Ceriodaphnia dubia | 45 | ||||||
| 12 | Tanytarsus dissimilis | 2000 | Raphidocelis subcapitata | 6.9 | Aedes taeniorhynchus | 48 | ||||||
| 13 | Aplexa hypnorum | 2040 | Macrobrachium nipponense | 7.632 | Xenopus laevis | 52 | ||||||
| 14 | Misgurnus anguillicaudatus | 29.98 | Eohaustorius estuarus | 70 | ||||||||
| 15 | Eurytemora affinis | 58 | Gammarus pseudolimnaeus | 108 | ||||||||
| 16 | Danio rerio | 131.2 | Daphnia magna | 117 | ||||||||
| 17 | Xenopus laevis | 3331 | Homarus americanus | 120 | ||||||||
| 18 | Anabaena flosaquae | 4000 | Tallaperla maria | 135 | ||||||||
| 19 | Chlamydomonas reinhardtii | 4000 | Physa heterostropha | 137 | ||||||||
| 20 | Euglena gracilis | 4000 | Ophiogomphus sp. | 139.9 | ||||||||
| 21 | Poteriochromonas malhamensis | 4000 | Stylaria lacustris | 220 | ||||||||
| 22 | Chironomus tentans | 250 | ||||||||||
| 23 | Lithobates pipiens | 276 | ||||||||||
| 24 | Misgurnus anguillicaudatus, | 1887 | ||||||||||
| 25 | Hydra sp. | 2032 | ||||||||||
| 26 | Macrobrachium nipponense | 3011 | ||||||||||
| 27 | Pseudorasbora parva | 5177 | ||||||||||
| 28 | Rhodeus sinensis | 6251 | ||||||||||
| 29 | Limnodrilus hofmeisteri | 6313 | ||||||||||
| 30 | Chironomus plumosus | 7628 | ||||||||||
| 31 | Rana limnocharis | 8695 | ||||||||||
| Rank | Fluorene(FLO) | Naphthalene(NAP) | Phenanthrene(PHE) | Pyrene(PYR) | ||||||||
| Species | AV | Species | CV | Species | AV | Species | AV | Species | CV | Species | AV | |
| 1 | Daphnia pulex | 212 | Lepomis macrochirus | 125 | Melanotaenia fluviatilis | 213 | Coldwater Shrimp | 27 | Oncorhynchus mykiss | 5 | Daphnia magna | 6.579 |
| 2 | Daphnia magna | 430 | Daphnia magna | 125 | Micropterus salmoides | 240 | Lepomis macrochirus | 49 | Carassius auratus | 50 | Callinectes sapidus | 10 |
| 3 | Gammarus pseudolimnaeus | 600 | Chironomus riparius | 290 | Daphnia pulex | 1000 | Oncorhynchus mykiss | 50 | Daphnia pulex | 60 | Hyoplax formosensis | 11 |
| 4 | Lepomis macrochirus | 910 | Raphidocelis subcapitata | 3330 | Oncorhynchus mykiss | 1897.367 | Micropterus salmoides | 70 | Oryzias latipes | 100 | Neomysis awatschensis | 15 |
| 5 | Oncorhynchus mykiss | 1281 | Chara sp. | 35,000 | Macrobrachium kistnensis | 2000 | Hydra sp. | 96 | Daphnia magna | 191 | Chlorella fusca var. vacuolata | 25.71 |
| 6 | Chironomus plumosus | 2350 | Xenopus laevis | 2100 | Gammarus pseudolimnaeus | 126 | Rhodeus sinensis | 435 | Aedes aegypti | 35 | ||
| 7 | Chironomus riparius | 2350 | Callinectes sapidus | 2450 | Neomysis awatschensis | 126 | Misgurnus anguillicaudatus | 540 | Culex quinquefasciatus | 37 | ||
| 8 | Raphidocelis subcapitata | 3400 | Macrobrachium superbum | 2500 | Ptychocheilus lucius | 126 | Scenedesmus subspicatus | 2750 | Aedes taeniorhynchus | 60 | ||
| 9 | Pleuroceridae | 5600 | Chironomus tentans | 2810 | Eohaustorius estuarus | 158 | Scenedesmus armatus | 5000 | Pimephales promelas | 200 | ||
| 10 | Pimephales promelas | 100,000 | Oncorhynchus kisutch | 2986.212 | Pseudorasbora parva | 220 | Oncorhynchus mykiss | 2000 | ||||
| 11 | Lepomis macrochirus | 3200 | Daphnia magna | 275 | Raphidocelis subcapitata | 894,000 | ||||||
| 12 | Daphnia magna | 3672.187 | Diporeia sp. | 295 | ||||||||
| 13 | Gammarus minus | 3930 | Raphidocelis subcapitata | 324 | ||||||||
| 14 | Physa gyrina | 5020 | Daphnia pulex | 350 | ||||||||
| 15 | Pimephales promelas | 5612.078 | Lumbriculus variegatus | 419 | ||||||||
| 16 | Oreochromis niloticus | 5900 | Gammarus minus | 460 | ||||||||
| 17 | Tilapia zillii | 5900 | Chironomus plumosus | 462 | ||||||||
| 18 | Raphidocelis subcapitata | 10,000 | Cyprinodon variegatus | 478 | ||||||||
| 19 | Lampetra tridentata | 10,000 | Oncorhynchus tshawytscha | 478 | ||||||||
| 20 | Tanytarsus dissimilis | 12,398.39 | Chironomus tentans | 490 | ||||||||
| 21 | Chironomus attenuatus | 13,000 | Hyalella azteca | 564.5 | ||||||||
| 22 | Scylla serrata | 17,700 | Oreochromis mossambicus | 600 | ||||||||
| 23 | Chlorella vulgaris | 33,000 | Rana limnocharis | 631 | ||||||||
| 24 | Diaptomus forbesi | 67,800 | Limnodrilus hoffmeisteri | 799 | ||||||||
| 25 | Gambusia affinis | 150,000 | Tanichthys albonubes | 913 | ||||||||
| 26 | Macrobrachium nipponense | 1079 | ||||||||||
| 27 | Rhodeus sinensis | 2550 | ||||||||||
| 28 | Lutjanus erythropterus | 3170 | ||||||||||
| 29 | Misgurnus anguillicaudatus | 3684 | ||||||||||
| PAH | Abbr. | SSD Data * | SSD Model | a | b | R2 | RMSE50 |
|---|---|---|---|---|---|---|---|
| Acenaphthene | ACE | AV | Weibull | −5.92 | 1.92 | 0.9284 | 0.0105 |
| Anthracene | ANT | AV | Dagum | 0.45 | 3.20 | 0.9769 | 0.0377 |
| Benzo[a]pyrene | B[a]P | AV | Gompertz | 1.78 | 0.89 | 0.9301 | 0.0638 |
| CV | Gompertz | 0.73 | 1.17 | 0.9240 | 0.0814 | ||
| CVES | Gompertz | 1.04 | 0.89 | 0.9300 | 0.0638 | ||
| Fluoranthene | FLA | AV | Dagum | 0.50 | 7.46 | 0.9786 | 0.0288 |
| CV | Gompertz | 5.39 | 1.12 | 0.9563 | 0.0681 | ||
| CVES | Dagum | 0.52 | 3.95 | 0.9778 | 0.0280 | ||
| Fluorene | FLO | AV | Error | 1.10 | 3.51 | 0.9819 | 0.0103 |
| CVES | Error | 1.10 | 2.87 | 0.9819 | 0.0103 | ||
| Naphthalene | NAP | AV | Dagum | 0.98 | 2585.31 | 0.9872 | 0.0426 |
| Phenanthrene | PHE | AV | Weibull | −6.40 | 2.36 | 0.9827 | 0.0300 |
| CV | Gudermannian | 1.27 | 2.96 | 0.9818 | 0.0549 | ||
| CVES | Weibull | −4.74 | 2.36 | 0.9827 | 0.0300 | ||
| Pyrene | PYR | AV | Gompertz | 6.83 | 1.49 | 0.9607 | 0.0448 |
| PAH | Group | Species | AV * (μg/L) | CV * (μg/L) | SACR (AV/CV) | FACR |
|---|---|---|---|---|---|---|
| B[a]P | Crustaceans | Daphnia magna | 1.298 | 0.3 | 4.33 | 4.06 |
| Crustaceans | Eurytemora affinis | 58 | 12 | 4.83 | ||
| Fish | Misgurnus anguillicaudatus | 29.98 | 8.681 | 3.45 | ||
| Fish | Cyprinus flammans | 3.626 | 0.96 | 3.78 | ||
| FLA | Insect | Chironomus tentans | 250 | 20 | 12.50 | 4.54 |
| Crustaceans | Daphnia magna | 117 | 17 | 6.88 | ||
| Fish | Pimephales promelas | 12.2 | 10.4 | 1.17 | ||
| Worms | Stylaria lacustris | 220 | 115 | 1.91 | ||
| Fish | Pseudorasbora parva | 5177 | 798 | 6.49 | ||
| Fish | Misgurnus anguillicaudatus | 1887 | 269 | 7.01 | ||
| FLO | Insect | Chironomus riparius | 2350 | 290 | 8.10 | 3.79 |
| Crustaceans | Daphnia magna | 430 | 125 | 3.44 | ||
| Fish | Lepomis macrochirus | 910 | 125 | 7.28 | ||
| Algae | Raphidocelis subcapitata | 3400 | 3330 | 1.02 | ||
| PHE | Crustaceans | Daphnia magna | 275 | 191 | 1.44 | 5.07 |
| Crustaceans | Daphnia pulex | 350 | 60 | 5.83 | ||
| Fish | Misgurnus anguillicaudatus | 3684 | 540 | 6.82 | ||
| Fish | Oncorhynchus mykiss | 50 | 5 | 10.00 | ||
| Fish | Rhodeus sinensis | 2550 | 435 | 5.86 |
| PAH | Data ** | HC5 | HC10 | PNECacute,5 *** | PNECchronic,5 *** | PNECacute,10 **** | PNECchronic,10 **** |
|---|---|---|---|---|---|---|---|
| ACE | AV | 34.38 | 81.20 | 6.876 | 0.6876 | 8.120 | 0.8120 |
| ANT | AV | 0.3770 | 0.8925 | 0.07540 | 0.007540 | 0.08925 | 0.008925 |
| B[a]P | AV | 0.2629 | 0.5202 | 0.05258 | 0.005258 | 0.05202 | 0.005202 |
| CV | 0.06205 | 0.1042 | 0.01241 | 0.01042 | |||
| CVES | 0.06472 | 0.1285 | 0.01294 | 0.01285 | |||
| FLA | AV | 4.087 | 7.602 | 0.8175 | 0.08175 | 0.7602 | 0.07602 |
| CV | 3.333 | 5.704 | 0.6666 | 0.5704 | |||
| CVES | 0.7831 | 1.557 | 0.1566 | 0.1557 | |||
| FLO | AV | 135.8 | 232.8 | 27.16 | 2.716 | 23.28 | 2.328 |
| CVES | 35.83 | 61.23 | 7.166 | 6.123 | |||
| NAP | AV | 973.9 | 1275 | 194.8 | 19.48 | 127.5 | 12.75 |
| PHE | AV | 28.43 | 57.31 | 5.686 | 0.5686 | 5.731 | 0.5731 |
| CV | 2.144 | 7.460 | 0.4287 | 0.7460 | |||
| CVES | 5.607 | 11.30 | 1.121 | 1.130 | |||
| PYR | AV | 3.572 | 5.360 | 0.7143 | 0.07143 | 0.5360 | 0.05360 |
| Type | Source | ACE | ANT | B[a]P | FLA | FLO | NAP | PHE | PYR | Note a |
|---|---|---|---|---|---|---|---|---|---|---|
| This study b | 0.8120 | 0.008925 | 0.005202 | 0.07602 | 2.328 | 12.75 | 0.5731 | 0.05360 | LC50 or EC50; SSD | |
| Peer-reviewed literature | [31] c | 2.33 | 1.09 | 0.011 | NOEC; SSD | |||||
| [29] | 112.3 | LC50 or EC50; SSD | ||||||||
| [27] c | 11.408 | LC50 or EC50; SSD | ||||||||
| [40] c | 6.25 | 61.6 | 5.17 | 5.28 | EC10 or EC50/3 or LC50/3 or LOEC; SSD | |||||
| [24] c | 27.68 | 41.28 | ACR-transformed LC50 or EC50; SSD | |||||||
| [28] | 174.6 | ACR-transformed LC50 or EC50; SSD | ||||||||
| Government document | [45] d | 16 | SSD | |||||||
| [46] e | 5.8 | 0.015 | 0.04 | 3 | 1.1 | 0.4 | 0.025 | AF | ||
| [47] f | 0.0028 | — | ||||||||
| [48] g | 0.00017 | 0.0063 | 2 | — |
Disclaimer/Publisher’s Note: The statements, opinions and data contained in all publications are solely those of the individual author(s) and contributor(s) and not of MDPI and/or the editor(s). MDPI and/or the editor(s) disclaim responsibility for any injury to people or property resulting from any ideas, methods, instructions or products referred to in the content. |
© 2023 by the authors. Licensee MDPI, Basel, Switzerland. This article is an open access article distributed under the terms and conditions of the Creative Commons Attribution (CC BY) license (https://creativecommons.org/licenses/by/4.0/).
Share and Cite
Sun, X.; Ding, T.-T.; Wang, Z.-J.; Huang, P.; Liu, S.-S. Optimized Derivation of Predicted No-Effect Concentrations (PNECs) for Eight Polycyclic Aromatic Hydrocarbons (PAHs) Using HC10 Based on Acute Toxicity Data. Toxics 2023, 11, 563. https://doi.org/10.3390/toxics11070563
Sun X, Ding T-T, Wang Z-J, Huang P, Liu S-S. Optimized Derivation of Predicted No-Effect Concentrations (PNECs) for Eight Polycyclic Aromatic Hydrocarbons (PAHs) Using HC10 Based on Acute Toxicity Data. Toxics. 2023; 11(7):563. https://doi.org/10.3390/toxics11070563
Chicago/Turabian StyleSun, Xiao, Ting-Ting Ding, Ze-Jun Wang, Peng Huang, and Shu-Shen Liu. 2023. "Optimized Derivation of Predicted No-Effect Concentrations (PNECs) for Eight Polycyclic Aromatic Hydrocarbons (PAHs) Using HC10 Based on Acute Toxicity Data" Toxics 11, no. 7: 563. https://doi.org/10.3390/toxics11070563
APA StyleSun, X., Ding, T.-T., Wang, Z.-J., Huang, P., & Liu, S.-S. (2023). Optimized Derivation of Predicted No-Effect Concentrations (PNECs) for Eight Polycyclic Aromatic Hydrocarbons (PAHs) Using HC10 Based on Acute Toxicity Data. Toxics, 11(7), 563. https://doi.org/10.3390/toxics11070563