Abstract
Background: Globally, in the Fast-Moving Consumer Goods (FMCG) industry, excess inventory results from the bullwhip effect. Earlier, barcode-based two-bin systems were limited by manual scanning; hence, a more responsive system is needed to align the inventory with real-time demand. Prior studies have predominantly concentrated on mitigating demand fluctuations and employed comparatively low-efficiency systems, hindering excess inventory (EI) reduction. Methods: This study proposes identifying research gaps, considering the distributor-manufacturer relationship, and developing an RFID-based modified two-bin system and mathematical model to reduce EI and control over manufacturers’ excessive cost. Results: This study tested through Python-based simulation using historical data from an FMCG manufacturer, and the proposed model achieved a reduction in 67% EI and 73% month-wise holding costs. Moreover, the integration of the Artificial Bee Colony algorithm optimizes rework rates within budget, including reworking shop-floor and holding costs, contributing to a monthly excessive cost reduction of 34–48%, alongside a corresponding 41–44% cumulative excessive cost reduction. Conclusions: Bringing significant implications on digitalized SCM, this study offers a practical and scalable solution for perishable FMCG items facing demand variability and budget constraints. Collectively, this novel perspective bridges research gaps and motivates future research for embedding trend-aligned parameters, enhancing the model’s performance through diverse SCM contexts like safety stock and backorder cost optimization.
1. Introduction
Radio-frequency identification, which is known as RFID for short, is a technology that tracks and identifies objects using radio waves, creating a great impact on the supply chain by the traceability of goods utilized in inventory management [1]. Among the several inventory control systems, the two-bin system utilized during production to detect the consumption of goods after the first bin has been depleted and to replenish the inventory when the second bin has a sufficient number of goods or safety inventory, thereby maintaining safety stocks and the service level of inventory to avoid stock outs for both the upstream and downstream [2] supply chain [3].
Alarming issues relating to inventory management in the supply chain resulting from high inventory pressure have been identified as a major problem for growing Fast-Moving Consumer Goods firms. FMCG, or Fast-Moving Consumer Goods, are known as “fast-moving” since the products are quick to leave the shelves of the retail market because consumers use them on a regular basis. Particularly, the FMCG industry is vulnerable to excess inventory, which results from the Bullwhip effect, due to the information flow of forecasted demand creating an amplified demand variability in the upstream supply chain. Almost all of the FMCG companies rely on the demand forecasting method [4] to estimate the demand and are connected most of the time with the annual demand, with additional safety stock for each lead time period. In the previous study, highly ranked factors that create excess inventory and affect the bullwhip effect the most are demand signal processing [5], which relies on the quality of the information sharing system or technology in the statistical forecasting method of FMCG companies. Moreover, information-sharing systems have a 21.6% quality factor in the perishable supply chain of FMCG companies [6]. With 24.24% of operational causes, forecasting methods appear mostly and hold the highest percentage of causes to create excess inventory, affecting the bullwhip effect [7]. Thus, that creates the attention to shift from demand-driven to data-driven supply chain for better control and management of the information sharing system to ensure the reduction in disruption and demand fluctuations in the supply chain, which will lead to excess inventory reduction that can save millions of dollars in expenses of the FMCG industry.
As a major constraint of achieving a high fill rate of inventory, the FMCG industry wants to survive and become even more competitive, which often involves overproduction while maintaining the need for surplus inventory, which creates the bullwhip effect. Therefore, there is a need to optimize inventory pressure and specifically to find a solution to reduce excess inventory and control the excessive cost within the allocated budget of the FMCG company.
In response to the alarming outcome of excess inventory, which leads to the bullwhip effect, researchers found that RFID technology not only has the potential to alleviate the bullwhip effect [8], but also improves the information sharing system [9]. Additionally, RFID technology reduces the time and cost of inventory management associated with manual inventory tracking.
Earlier, the initiative was taken by applying RFID technology to improve the efficiency of the FMCG supply chain with a web-based system of intra-supply chain partners [10]. While several studies [11,12,13] proposed to add RFID tags at the retailer end in different strategies in FMCG supply chain to achieve more accurate results, it was later demonstrated as less profitable for the manufacturer to implement and establish the contract for implementing RFID tags among the wide range of retailers in another study [14]; it was also found that the advantages can be weakened for perishable products and was recommended only for non-perishable products. Though with several developments, including a lean concept, a barcode-based two-bin model was developed in another study [15] and was conducted for more accuracy and efficiency, with a barcode-based two-bin system introduced, but this specifically focused on the electronic company. Following that study, although FMCG companies were supposed to implement it, they later understood the low efficiency of the barcode for the warehousing and delivery system, and recommended RFID technology since RFID did not need manual scanning as compared to the barcode system [16]. Moreover, FMCG companies suffer from a barcode-based two-bin system, which is insufficient for fast-moving goods because these products are sold in bulk quantities, and data can be collected only by placing the scanner directly on the barcode sticker.
To the best of the knowledge from literature review of previous studies, little is known about the RFID traceability system as the recommendation of previous studies, but it was not clear whether how the overproduction can be controlled by a model that consists of a RFID traceability system to eliminate the excess inventory of FMCG products in a weekly basis, which is foremost for FMCG companies as the product shelf lives are short and are studied in this research as the key differentiator from previous studies. Previous research does not explain how the excess inventory can be eliminated for FMCG products while maintaining enough safety stock in the distribution center with an RFID system, since previous studies considered retailers as less profitable for ensuring the high fill rate of inventory from the distribution center to the retailer end for catering to the end-customer and keeping the FMCG companies competitive in the market.
Motivated by observing the above-mentioned research gap and to make a contribution to the domain of supply chain with a key differentiator compared to previous studies, the objective of this research study is to develop a model of an RFID-based modified two-bin system to reduce the excess inventory by controlling overproduction and eliminating the excess inventory in a weekly manner. Moreover, optimization of the total excessive cost, which consists of the cost of reworking and holding costs of excess inventory for each week, is allocated by the respective FMCG company according to their budget to obtain the delighter output from the model.
The novelty of this study makes the contribution as follows. Firstly, this study extends and fills the research gap on the limited research on reducing the excess inventory in the FMCG industry, and, for the first time, makes the first priority on focusing the controlling the overproduction and eliminating the excess inventory of short shelf-life products in a weekly manner with an RFID traceability system for reducing the bullwhip effect. This study clearly demonstrates a feasible system with an RFID-based modified two-bin system that maintains the safety stock in the distribution center for committing the high fill rate of inventory from the distributor to the retailer end, which makes the FMCG companies competitive in the market and prevents the excessive cost of holding huge inventory. Consequently, this proposed model reduces the excess inventory and creates a decline in the bullwhip effect of the FMCG supply chain, while maintaining a top-notch service level of inventory. Secondly, this research creates another contribution for the respective company to utilize their inventory space according to their allocated budget by controlling both the holding cost of excess inventory and reworking rate by using the ABC algorithm, with the proposed mathematical model of RFID-based two-bin system to optimize the excessive cost, which was not considered in parallel in previous studies to keep this under control for respective FMCG companies.
The remainder of this article is structured as follows. The related literature is demonstrated in Section 2. Section 3 describes and builds a mathematical model for an RFID-based modified two-bin system, with an integration of the Artificial Bee Colony Algorithm to reduce excess inventory, along with financial agility. Afterward, the analysis and results are outlined in Section 4, and a discussion of the results is conducted in Section 5. Finally, this paper concludes with recommendations for future research directions in Section 6.
2. Literature Review
The bullwhip effect was initially pointed out by Procter & Gamble (P&G) as the demand variation between suppliers, manufacturers, and wholesalers in the 1990s, which led to excess inventory in the FMCG industry. In a study, ref. [17] found that perishable items are impacted by the bullwhip effect five times more than other non-perishable FMCG products. In Indonesia, food loss and waste cause a huge economic loss ranging from 4 to 5% of the country’s GDP, which is addressed in a study [18].
The FMCG supply chain of perishable items is very sensitive. As those shorter shelf time items have a higher demand, but without proper facilities, methods, and coordination, a huge number of items are wasted. Therefore, the storage and distribution of perishable items requires good care to keep customer retention. In Indonesia, the installation of cold chain facilities increased by 9.46% in 2018 to meet the customers’ demands [19].
Early studies related to the bullwhip effect or excess inventory state that deviations occurred because of demand uncertainty and variance between the actual demand and the placed order quantity. As a result, each stakeholder of the supply chain must carry safety stock, especially the manufacturers. A study shows [20] that if the retailers share their point of sale (POS) data, it will help the manufacturers to minimize the variance from the orders they receive. The extension of this study also found that manufacturers’ safety inventory can be reduced by 16% by sharing retail demand [21]. With proper information sharing, a company can compare the received demand with the original demand, which helps understand whether the variance is caused by the bullwhip effect or the actual demand [22].
Later, several studies considered excess inventory to be a prevalent issue in supply chain management and is often attributed to the bullwhip effect, which amplifies from wholesalers to manufacturers [23], leading to overproduction and excess inventory. Paradoxically, excess inventory can also act as a buffer, helping to absorb demand fluctuations and reduce the need for abrupt changes in production and replenishment rates. Furthermore, the relationship between inventory management and demand uncertainty is particularly critical in the FMCG sector. Reference [24] found a significant correlation between inventory management and levels of demand uncertainty. Their study using surveys and descriptive statistics showed that reduced uncertainty leads to better-controlled inventory systems. Afterwards, an integrated location-inventory-pricing approach was studied [25], but real-life pricing feasibility was needed to appear with shortage or backorder costs and holding costs.
The impact of RFID on inventory management was illustrated in several studies by [9,26,27]. These studies demonstrate its effectiveness in reducing inventory inaccuracies by enabling real-time visibility and optimized multi-period inventory policies, and also utilize dynamic programming models to determine critical inventory levels. Afterwards, another study presented that sharing the POS data along with the inventory information could mitigate the bullwhip effect in a better way [28]. However, along with the help of cloud-based platforms, integration with RFID was studied [16]. Their studied approach found that RFID facilitates automated processes with cloud-integrated systems for real-time tracking and automated replenishment. Moreover, effective data management underpins several benefits in warehouse operations [29]. Thereafter, ref. [30] found that the transition to real-time inventory visibility with RFID and cloud platforms transforms retail operations by minimizing stockouts, and boosting efficiency and customer satisfaction. Though these approaches improved visibility in the supply chain, they did not initiate any approach focused specifically on excess inventory reduction generated through amplification and uncertain demands.
In addition to the limitations of traditional EOQ and EPQ models illustrated in previous studies, which analytically state not only backorder costs [31] but also overstocking issues attributed to holding costs on supply chain stakeholders [32], these operational challenges are further compounded in complex, multi-tier supply chains. Using a discrete-event simulation, ref. [33] investigated the bullwhip effect in a multi-product, multi-echelon supply chain specific to the FMCG industry. Their study demonstrated that while the excess inventory or bullwhip effect cannot be entirely eliminated, its impact can be significantly reduced through centralized information sharing.
Many real-world problems are efficiently solved by evolutionary algorithms. Among all of them, the Artificial Bee Colony (ABC) algorithm is a swarm intelligence-based optimization method inspired by the foraging behavior of honey bees. It operates with standard parameters such as colony size and maximum cycle number, with the help of three types of bees: employed bees, onlooker bees, and scout bees. Employed bees search for food sources based on memory, while onlooker bees choose food sources by evaluating shared information, and scout bees discover new sources when existing ones are exhausted. Balance in optimization is aided by this task division. Fundamentally superior performance and comparable effectiveness to other swarm intelligence algorithms were demonstrated by ABC in the previous study [34]. The proposed model’s optimization performance, driven by the Artificial Bee Colony (ABC) algorithm, is further supported by comparative evidence from prior studies. Although [35] studied and tried to create a production inventory model along with the Particle Swarm Optimization (PSO) algorithm that works in a real-world setting, another study [36] compared the ABC algorithm with PSO on five standard benchmark functions—Sphere, Rosenbrock, Rastrigin, Ackley, and Griewank—in dimensions 10, 20, and 30, and found the Artificial Bee Colony Algorithm (ABC) to be more effective for complex optimization problems, including inventory analysis. The reported performance gain of ABC over PSO ranges between 95.7% and 100.0%, underscoring its robustness and reliability for high-dimensional and nonlinear optimization problems. Moreover, another study [37] applied the ABC algorithm to minimize total inventory costs, particularly in scenarios requiring cost minimization and accurate demand forecasting. These studies indicate the ABC algorithm’s efficiency in real-world inventory management and find near-optimal solutions, making it a strong candidate for supply chain optimization.
Observing previous studies [15,37], a key objective of our work is to optimize inventory levels, specifically targeting excess inventory. Our research shares the objective of cost optimization with one of the earlier studies [37] by aiming to optimize the total cost of reworkable items and control holding costs. All the mentioned studies, including ours, focus on the FMCG industry, recognizing its unique challenges. Though our research paper shares the goal of reducing overproduction and optimizing inventory levels with the studies by [38,39], which focus on mitigating the bullwhip effect through technological interventions, our research study directly addresses the challenges posed by excess inventory in the FMCG industry, which needs to be removed in a periodic manner.
Before this study, the previous studies did not develop a mathematical model of optimum production quantity for manufacturers focusing on eliminating excess inventory on a weekly basis, controlling the holding cost of excess inventory and rate of reworked items, and better utilizing inventory space within the allocated inventory cost from the respective FMCG company in optimal manner; moreover, they did not eventually consider a flexible budget in parallel for the respective FMCG company.
As demonstrated in Table 1, this study is considered the first to fulfill the research gaps by removing excess inventory in a periodical manner, with the control of overproduction maintaining a top-notch service level and helping FMCG companies in competitiveness with minimum inventory cost, and also mitigating the chance of losing customer retention.

Table 1.
Comparison table of recent relevant studies along with the present study.
This study differentiates itself from its counterparts by replacing an inefficient barcode-based two-bin traceability system and introducing a mathematical model that focuses on a feasible system to remove excess inventory from the manufacturer’s end, with the help of the RFID-based modified two-bin system that prevents any stock out in DC by keeping a safety stock for ensuring a high inventory fill rate from the DC to the retail end. Additionally, the ABC algorithm is implemented with a mathematical model to enhance the financial efficiency of excess inventory.
3. Methodology
3.1. Research Approach
To improve inventory management and reduce inefficiencies in the FMCG supply chain, this research proposes a modified RFID-based OPQ. The model involves a two-stage FMCG supply chain, having a factory of manufacturers that produces the goods and a distribution center that receives goods and stores them. The model helps the manufacturer achieve better inventory visibility by using a radio-frequency identification (RFID)-based inventory tracking system that offers real-time information about inventory levels in the distribution center. As a result, this information helps them to reduce the overproduction rate and create an optimum production quantity, considering the weekly lead time period. One bin constantly monitors the stock with RFID and shows the demand rate with the perpetual inventory counting system, and the other one is considered the safety inventory. By using the RFID system, the manufacturer can monitor real-time consumption rates to better match production rates without overproducing and reducing surplus inventory in a periodic manner. Such a system yields the weekly optimum production quantity at the manufacturer, and thus reduces the excess inventory, which enhances the way supply chains work. The ABC algorithm has also been introduced to the model, which efficiently controls the cost of excess inventory by optimizing both rework and holding costs. The framework of the proposed research approach is demonstrated in Figure 1.
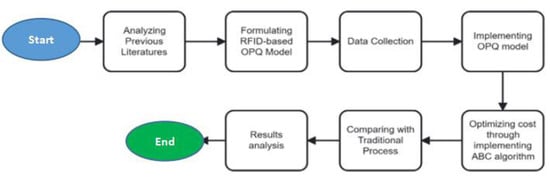
Figure 1.
Framework of research approach.
3.2. Data Collection
Data was collected from a top FMCG company in Bangladesh for this study for key metrics that are important to assess and apply a modified inventory optimization model. The data collected consists of a few key components, including weekly demand and supply figures, safety stock levels, and related cost data, including holding and reworking costs. First, according to actual sales of the distribution center, RFID tracking data was captured to track inventory movement to accurately calculate usage and optimum production rate for the week. By using this real-time data, we were able to gain insights into product flow to inform the optimum production quantity (OPQ) for every week, with exemplified utilization and demand costs.
Furthermore, the study also evaluated excess inventory, considering both reworked items and the deviations in defect items (deviations measured between the maximum allowable quantity of defects and actual defects). Excess inventory analysis was also critical to evaluate the likelihood of inventory accumulation and the related cost. The per-unit holding cost provided by the company was then used to convert the collected data into holding costs for excess inventory. The safety stock and its influence on the overall inventory system were also included in this data. The essence of the study was to leverage the ABC algorithm to optimize the total allocated cost related to the excess inventory by combining these different data points together. This strategy not only revealed inefficiencies in the existing system but also helped to control overproduction while reducing holding cost and reworking cost, leading to improved and cost-effective inventory management and enhanced performance of the supply chain when it comes to the FMCG sector.
To assess the optimal production quantity and demonstrate the robustness of the proposed model in reducing both holding and excessive costs, the analysis employs the sample sizes presented in Table 2, which were determined using the procedure outlined in the following subsection. All the sample sizes are determined on the basis of expert/executive opinion and the demand of different leading FMCG companies to cater to the needs of the industry, to contribute to the addressed research gap, which is the first and foremost priority of our study. Since this sample involves the datasets of all the weeks of a year and also considers the short shelf lives according to the product (which varies with product-to-product), it is ideal for easier adoption.
Table 2.
Summary of data sources and sample volumes used for model formulation and optimization analysis to achieve the research objectives.
3.3. RFID-Based Modified Bin System with a Developed OPQ Model Formulation
RFID-Based Modified Bin System with A Developed OPQ Model: This section describes the overall architecture of the proposed system, which consists of a combination of an RFID-based inventory tracking and a model for optimization with transformed data of inventory levels.
In this model, a two-stage FMCG supply chain is considered with a distribution center and a factory of manufacturers that produces goods and delivers them to the distribution center. In the distribution center, the proposed two-bin system, as demonstrated in Figure 2, is a bin system based on RFID that tracks inventory, with one bin tracking the consumption with a perpetual counting system (the product that goes out) and the other handling safety stock. The RFID readings from the distributor provide manufacturers with the weekly usage in real time. Manufacturers can use that data to indicate production rates for the supply end, minimizing overproduction and excess inventory while considering the lead time period.
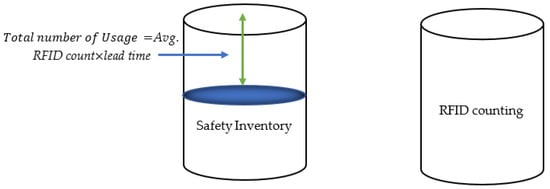
Figure 2.
RFID-based bin system.
This framework has been enhanced to include both traditional approaches and RFID-enabled modified two-bin system approaches, which are comparatively illustrated in Figure 3 to provide a better operational understanding of the proposed system. This modification eliminates the demand amplification, dependencies for demand forecasting with a better approach, reduces excessive cost, and minimizes the risk of overproduction or stockouts.
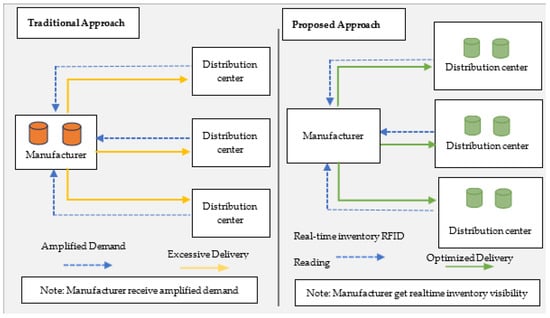
Figure 3.
Comparison of traditional and RFID-enabled two-bin systems, highlighting real-time RFID communication from distributor to manufacturer.
3.3.1. Model Assumptions, Parameters and Variables
Assumptions:
- The time period of RFID counting will be constant for each batch production.
- The maximum number of defect items is constant.
- Lead time is less than the RFID counting period.
- Only one type of product is involved at a time to determine production quantity.
| Parameters and Variables: | |
| Period of RFID counting. | |
| Lead time. | |
| Total days, . | |
| Average usage. | |
| RFID counting for counting the number of removed items, . | |
| Total RFID counting for all the distribution centers. | |
| Defect rate,. | |
| Target production for the nth week. | |
| Rework rate. | |
| Optimized reworked rates after ABC optimization. | |
| Production time. | |
| Total period of procurement time and the time period after the production period, . | |
| Usage rate for the nth week. | |
| Production rate for the nth week. | |
| Actual defect item for the nth week. | |
| Deviation from the defect item. | |
| Maximum defect item for the nth week. | |
| Demand for the nth week. | |
| Per unit holding cost. | |
| Deviation from defect items for the nth week. | |
| Reworked item for the nth week. | |
| Total allowed cost. | |
| Total remaining cost for reworking the item and the holding cost of the item. | |
| Per unit allowed remaining cost for reworking and holding cost of reworking item. | |
| Reduction in excess inventory. | |
| Number/population of bees in ABC optimization. | |
| Decision Variables: | |
| Traditional excess inventory for the nth week. | |
| Excess inventory for the nth week after OPQ model implementation. | |
| Excess inventory for the nth week after cost optimization by the Artificial Bee Colony Algorithm. | |
| Reduction in excess inventory after OPQ model implementation. | |
| Reduction in excess inventory after cost optimization. | |
3.3.2. Mathematical Formulation of Developed Model
First of all, to calculate the RFID counting for all distribution centers, the equations for evaluating several parameters, such as RFID counting for one distribution center (Rfj), Total RFID counting for the nth week (), Average usage (), Total number of Usage (), and Usage rate for nth week (), are defined as follows:
Rfj = Rand (Rfmax, Rfmin)
Here, to find the production days, it is needed to subtract the lead time ( from the Total period of Procurement time and the time period after the production period (
Maximum Defect Item for the nth week,
To calculate the Excess Inventory for the nth week (, count the Actual Defect Item ( and add the number of items that can be reworked (. Actual Defect item for the nth week ( and Deviation from defect item for the nth week ():
Objective Function:
The formulation of the proposed model is established on the practical and feasible consideration of the total usage quantity of the previous week from the RFID counting of all distribution centers. The addition of maximum defect units accordingly eliminates the potential of stock out and ensures on-time delivery as per RFID counting, since ( is logically approached and evaluated sequentially from Equation (1) to Equation (4). After that, the strategic novel approach of this study initiates to remove the excess inventory ( in a periodic manner. depends on the deviations in defect items ( and reworked units ( of the previous week or (n − 1) th week. The structure of Equation (13) ensures that the model removes excessive inventory in a periodic manner while maintaining a feasible production level within lead time and demand constraints.
Then, the Optimum Production Quantity Model:
Optimum Production quantity for th week,
Along with the constraints for optimum production quantity, the reduction in excess inventory of the nth week is defined as , which evaluates the difference in the excess inventory nth week between the traditional approaches and the proposed approach.
For Equation (13), the constraints are as follows:
when ,
EIn−1 = 0
The Objective function Equation (13) is to determine the optimum production quantity ( for a demand period. The prime objective function (14) is to determine the reduction in excess inventory for a year in the FMCG section by determining the deviations in excess inventory of the nth week between the traditional and proposed approaches. For the first batch of target production (when n = 1), constraint (14) states that the excess inventory of the (n − 1)th week will not be counted. When the portion of Equation (14) evaluates (), then it only counts the excess inventory of the nth week, since excess inventory of all previous weeks is eliminated in a periodic manner. Constraint (15) states that production quantity will be greater than or equal to the total of the usage rate and maximum Defect items. Constraint (17) states that total production quantity equates to the addition of total usage and maximum defect items, and then subtracting by for that nth batch of production.
Model Formulation for optimization with the ABC algorithm:
Total Allowable cost for Excess Inventory,
Let
for the nth week =
Here, to optimize
From Equation (19), the constraints are as follows:
Optimization with the ABC Algorithm:
= ,
=
R (Random number), If R < need to update the fitness function
= Trial, Limit
As this is an optimization function so the value of the employed bee will be updated if the fitness value of th bee is lower than the present value of th bee. The position of the onlooker bee is updated when the probability corresponding to the th fitness value () exceeds the randomly generated number (R), indicating that the new candidate solution offers a better fitness. The scout bee is only activated when the trial is greater than a given limit, at which point the bee abandons its current solution and generates a new random position within the search space.
The objective function of ABC optimization is to control the FMCG manufacturers’ excessive cost,
The cost-optimized reworking item for the nth week () and cost-optimized excess inventory for the nth week () are defined as follows:
The optimized quantity of reworking items depends on the optimized reworking rates and actual defect items . Thus, evaluates from the optimized deviation of defect items ( and cost-optimized reworking items (
Intuitively, the integration of the ABC algorithm helps to provide a balanced configuration that defines the optimum production quantity with optimized that achieves optimized total cost within the FMCG manufacturers’ budget under the proposed RFID-enabled two-bin replenishment system.
Reduction in Excess Inventory after cost optimization for the nth week,
The mathematical model was compared against the widely used traditional production approach of the FMCG industry, which has a short shelf life. Identical parameters were utilized for both approaches to verify that the proposed model could replicate baseline practices before integration of the ABC Algorithmic optimization. Among them, the most commonly used evolutionary algorithms were the ABC and PSO algorithms. But, this study refers to the influence of [36], where ABC outperforms the PSO algorithm, including inventory analysis. Additionally, the application in the study of [37] applied the ABC algorithm specifically for minimizing total inventory costs. With the integration of the ABC algorithm, this research optimizes the total cost of reworking items and controls the holding cost of excess inventory for each week of production, and by dint of the p-best and g-best position, this study gains the most appropriate data for the FMCG company with the respective allocation of budget.
To measure the robustness and stability of the proposed model, a sensitivity analysis was conducted by varying key parameters while keeping the remaining variables constant. In the baseline analysis, the holding cost was taken as 0.2 BDT per unit and the maximum defect rate as 0.25. For the sensitivity analysis, each parameter was varied within a reasonable range—one value lower and one value higher than its baseline—to validate the model’s consistency under both situations of variation in different companies. In this section for sensitivity analysis, the holding cost was adjusted to 0.15 BDT (−25%) and 0.30 BDT (+50%) per unit, while the maximum defect rate was deviated to 0.2 (−20%) and 0.3 (+20%). This valuation approach ensures a balanced evaluation of the model’s robustness across
Quantitative results in Section 4 demonstrate the validation of both the proposed model and the ABC-integrated model along with real-life supply chain parameters. Though this study evaluates the optimum production quantity and reduces excess inventory in a weekly manner to equally distribute the week across all the months of a year, this paper considers 4 weeks in a month for demonstration purposes, which enables visualization of data on a monthly basis instead of weekly.
Therefore, through joint collaboration between the manufacturer and DC under this developed model, the manufacturer will obtain a novel approach to remove the excess inventory in a weekly manner, with the reduction in excess inventory illustrating the financial benefit for the FMCG company for a year. In addition, the distributor will ensure a top-notch service level with more concise inventory visibility.
4. Results
This section presents the empirical results of the computational experiment and visualization with the proposed model in Section 3. The model has been coded in the Python language (python version 3.10) and performed on a computer with a 2.50 GHz 10th Gen Intel Core i5 processor and 16 GB RAM. The effectiveness of the proposed model, a set of weekly usage data from the company, was utilized as a novel approach to removing the excess inventory. Simulations are conducted according to both the proposed OPQ model and the ABC-integrated OPQ model. In the simulation setup, considering the manufacturer’s allocated of 14,000 BDT/week for reworking and holding cost of excess inventory, the per-unit holding cost is 0.2 BDT/per day, and the per-unit reworking cost is in the range of [1,2] BDT, and the data value of reworking rate were [0.30, 0.45].
Milk, Laban, Yogurt, and frozen snacks were considered as perishable products, which were mostly affected by excessive cost from overproduction. Among them, this simulation is conducted by using data from Laban, which has a short shelf life of (10–13) days, from a leading Bangladeshi FMCG company. Their maximum defect rate is considered 0.25%, with lead time considered as [3,4] days, and considered as [1,2] days, after subtracting from the procurement time and delivery time (which is always set as the maximum of 2 days by the FMCG factory) to maintain the fill rate and service level before the shelf life expires for the product.
4.1. Performance of Developed OPQ Model
In the first step, this research study validates and evaluates by benchmarking parameters between the proposed OPQ model and the traditional production approach. Along with input data, identical parameters were used in this step to evaluate the OPQ model before the utilization of ABC optimization.
Firstly, this study collected and analyzed the total RFID count from the actual sales and determined the total usage for the week to evaluate the production item needed for the week. In the Results section, excess inventory includes the number of reworked items and the number of deviations from the maximum defect items. The computational results were summarized in month-wise data and OPQ model implementation compared with the traditional approach in Table 3.
Table 3.
Performance comparison between traditional and proposed OPQ models across key metrics.
Upon investigating the comparison results between the proposed model and the traditional approach, it was clearly demonstrated that the excess inventory was greatly reduced by 49%, 67%, and 65% after the fourth month, eighth month, and twelfth month, respectively, compared to traditional approaches.
Thus, the developed model creates a major decline in inventory levels, leading to a decrease in month-wise holding costs in percentage of 50%, 73%, 69% for the fourth month, eighth month, and twelfth month, respectively. This is coupled with a noteworthy reduction in cumulative holding costs in percentages of 57%, 63%, 64% after the fourth month, eighth month, and twelfth month, respectively. Furthermore, Figure 4b depicts a comparison of quarter-wise analysis of inventory holding costs with the help of a clustered bar chart, where each cluster distinctly represents the quarterly holding cost of excess inventory, highlighting the divergence in cost performance across the two strategies. These findings substantiate the effectiveness of the OPQ model in reducing expenditures and streamlining inventory management practices. Moreover, Figure 4a demonstrates a comparative area chart of excess inventory level across a 12-month horizon under both traditional and proposed. In contrast, the proposed model performed with a sustained reduction in excess inventory. This decline indicates the strategy’s effectiveness in utilizing the usage rate by leveraging improved inventory visibility through an RFID-based modified two-bin system. This reduction contributes directly to lower holding costs and improved supply chain efficiency. Therefore, the developed OPQ model for the reduction in excess inventory achieved its objective and helped the FMCG manufacturer save on excessive costs, which will also result in an increased profit margin.
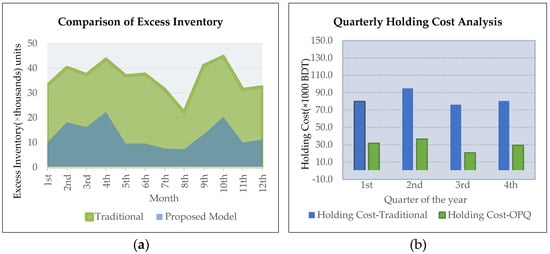
Figure 4.
(a) Inventory performance visualization: traditional vs. proposed approach. (b) Quarterly performance analysis of inventory holding costs.
4.2. Integration of the ABC Algorithm for Cost Optimization
To enable the FMCG company with budget constraints, the ABC algorithm was introduced to better manage both reworking expenses and excess inventory holding costs. Considering three different situations, this study implemented the ABC Algorithm to optimize the reworking rate, which helped the FMCG company to take control over reworking costs and holding costs of excess inventory. With a value of reworking cost of [1,2] BDT, the reworking rate is calculated and optimized according to the allocated budget of BDT 14,000 for the FMCG company.
The summarized Table 4 and Figure 5a clearly illustrate that the effective outcome of optimizing the excessive cost within the allocated cost for one month is BDT 56000. With a reduction in the excess inventory ( after the fourth, eighth, and twelfth months were about 52%, 72% and 66%, respectively. A substantial cumulative cost savings is illustrated in Table 4 in percentages of 41%, 44%, 44% after the fourth month, eighth month, and twelfth month, respectively.
Table 4.
Performance evaluation of the traditional approach vs. the ABC-integrated proposed OPQ model.
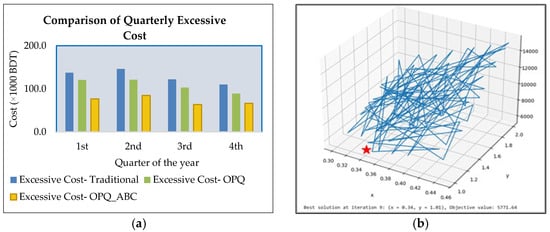
Figure 5.
(a) Quarterly comparison of excessive inventory costs obtained from the Traditional, OPQ, and OPQ–ABC optimization models. (b) ABC optimization trajectory for minimizing the total remaining cost of () (the red star denotes the best fitness value (x = 0.34, y = 1.01) achieved at iteration 9).
Subsequently, Figure 5b exhibits the investigation of the collective impact of the bees on optimizing the reworking rate and shows the results of according to the allowable reworking cost from the allocated budget. This research study further compared the traditional approach, OPQ model implementation, and ABC algorithm optimization in Figure 5a, which portrays the result, clearly visualizing the reduction in excessive cost with the help of a quarter-wise cost analysis across three approaches. Moreover, the month-wise analytical output from Figure 6 suggested that when an RFID-based two-bin system helps to reduce the excess inventory on a weekly basis while controlling the overproduction, it ensures the service level. The corresponding value of excessive cost illustrates the optimization within the allocated excessive cost. Thus, sharing the information in an ameliorated way with the utilization of the OPQ model ensures the reduction in excess inventory (, and integration of the ABC with the OPQ model gives the opportunity to the FMCG company to control the excessive cost within the allocated budget. The findings in Table 5 with data-driven results also indicate the performance of the model.
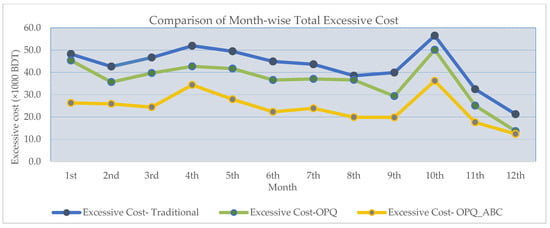
Figure 6.
Comparison of excessive cost among the Traditional, OPQ implementation, and OPQ-ABC optimization models.
Table 5.
Month-wise comparison of key supply chain parameters: traditional vs. proposed model vs. algorithm-integrated approaches.
4.3. Results of Sensitivity Analysis
The sensitivity analysis was performed to examine how deviations in holding cost and defect rate influence the total performance and stability of the proposed model. As mentioned in the methodology section, each parameter is varied within a reasonable range—one value lower and one higher than its baseline—to validate the robustness of the model under different cost and quality conditions.
When the holding cost declined from its baseline value of 0.2 BDT/unit to 0.15 BDT/unit, the total system cost showed a noticeable reduction, as expected. Conversely, raising the holding cost to 0.30 BDT/unit resulted in higher overall costs and a slight shift in the optimal decision variables. Subsequently, changing the maximum defect rate from 0.25 to 0.2 indicates that a lower defect rate improved overall efficiency, while a higher rate of 0.3 led to performance deterioration due to an increase in the overall rework costs related to the excessive cost.
Despite these variations, the model maintained its structural consistency and produced stable decision outcomes across all situations, demonstrating a greater degree of robustness. The comparative results are summarized in Table 6 and graphically illustrated in Figure 7, highlighting that the model’s performance and robustness remain reliable within a realistic range of parameter fluctuations in different companies in the FMCG industry.
Table 6.
Comparative results of the sensitivity analysis showing the effect of varying holding cost (0.15,0.30 BDT/unit) and maximum defect rate (0.2,0.3) on total system performance and decision variables.
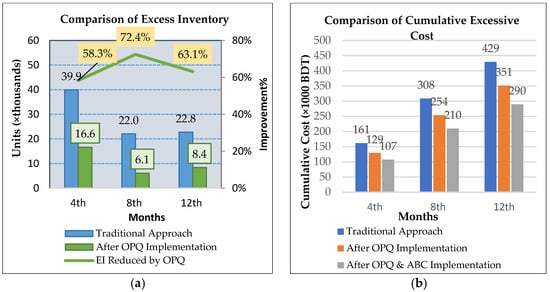
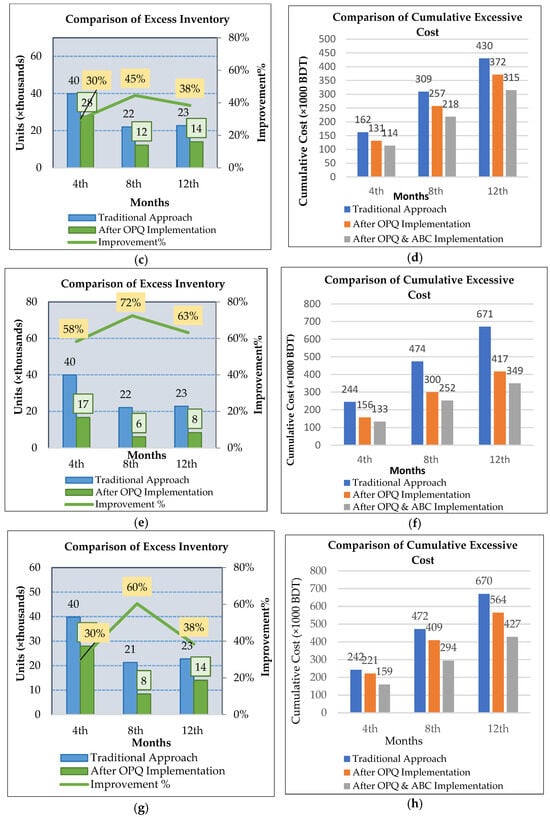
Figure 7.
Comparative sensitivity results for different combinations of holding cost and maximum defect rate. Each pair of bar charts represents system performance metrics under specific parameter settings. (a,b): Condition-1 (Maximum Defect rate 0.2, Holding cost 0.15 BDT/Unit); (c,d): condition-2 (Maximum Defect rate 0.3, Holding cost 0.15 BDT/Unit); (e,f): condition-3 (Maximum Defect rate 0.2, Holding cost 0.3 BDT/Unit); (g,h): condition-3 (Maximum Defect rate 0.3, Holding cost 0.3 BDT/Unit).
5. Discussion
This study confirmed the role of the OPQ model to determine the optimum production quantity to directly challenge the excess inventory reduction and improve the financial situation of an FMCG company. Stronger long-term collaboration with the distributor enables the necessary resources and capabilities to address the problem arising from improper inventory visibility and lack of control on production quantity, and achieve the objective of excess inventory reduction advocated by the OPQ model. In turn, the additional implementation of the developed OPQ model brings positive consequences in terms of the excess inventory reduction, manufacturer lead time flexibility, and top-notch service level, and the integration of the ABC algorithm enables the FMCG company to control the excessive cost in a better way.
The previous study [15] suggested a barcode-based bin system, which was later found to be a low-efficiency one compared to RFID technology [16]. Thus, this study considered and developed not only the RFID-based bin system, but also the eliminates the scarce shortage possibility due to average usage visibility, which helps control excess inventory and reduces the holding costs by up to 79% with the developed model, whereas previous holding costs (without shortage cost) were reduced by up to 33% by [40]. Though the novelty of this study is already broadly indicated in the Introduction section, elaborating on the findings compared with previous initiatives clearly illustrates that it is among the first to implement an RFID-based modified two-bin system, providing a developed way with measurable efficiency gains.
As highlighted in the literature review, previous comparative studies have demonstrated that the Artificial Bee Colony (ABC) algorithm consistently outperforms the Particle Swarm Optimization (PSO) in complex optimization environments, achieving a performance gain of 95.7–100% across multiple benchmark functions [36]. Building on these insights, this study leverages the ABC algorithm’s superior global search capability, adaptive exploration–exploitation balance, and convergence stability to optimize production and inventory parameters within the proposed RFID-enabled two-bin framework. The comparative advantage established in earlier works reinforces the methodological justification for employing the ABC algorithm in this study, underscoring its robustness, reliability, and suitability for real-world supply chain decision environments.
Academically or theoretically, this study contributes to the more efficient applicability of excess inventory reduction, which was previously underexplored. Practically, it offers control on overproduction and financial budgets, along with the better utilization of real-time RFID counting from the distributor. However, this study has several acknowledged limitations. This study utilizes the data from the FMCG industry, which is specifically considered for perishable products, but the scope of the analysis assumptions in real-world scenarios may limit the applicability of this model to other sectors, such as healthcare, education, hospitality, and public administration. The effectiveness of the proposed model integrated with the ABC algorithm is not equal in all situations for all types of FMCG products. Since the safety bin is positioned at the distributor end, it helps prevent potential stockouts and supports real-time demand fulfillment rather than relying on forecasted or amplified demand. However, a further limitation of the present framework is the absence of explicit stochastic demand and supply components, which may limit to fully represent uncertainty and long-term variability. The model currently operates under a deterministic structure, where uncertainty is indirectly mitigated through real-time inventory visibility enabled by RFID data and the inclusion of a safety bin to buffer short-term fluctuations. Since the proposed RFID-enabled framework eliminates the need for traditional forecasting, the future inclusion of trend-related parameters may reintroduce the requirement to model random demand and supply variations. Future research could therefore incorporate probabilistic or simulation-based representations of demand and supply variability, along with trend-aligned parameters, to further enhance the model’s adaptability under dynamically changing FMCG conditions.
Although the model was validated using a single perishable product (Laban), this model’s framework is adaptable to a broader range of perishable product types within the FMCG industry. As demonstrated through the sensitivity analysis, the model maintains consistent performance and decision robustness under parameter variations. The parameters that govern production and replenishment decisions, such as holding cost, shelf life, lead time, and defect rate, can be customized according to specific product characteristics or market dynamics without altering the fundamental structure. This adaptability allows its application to short-shelf-life products, where production frequency and cost trade-offs vary. However, the limitation of single-product validation has been acknowledged. On the other hand, along with the demonstrated robustness from the sensitivity analysis, this study provides a foundation for future research to explore multi-product and cross-market validations to further strengthen the model’s scalability and wider range of industrial applicability.
While the framework is product-generic in design, each execution of the model operates on a single product at a time to ensure analytical precision and parameter accuracy. The results of the sensitivity analysis further confirm the model’s adaptability and robustness, as variations in defect rate and holding cost led to measurable changes in magnitude but not in overall decision patterns or optimal configurations. From previous studies, it is observed that forecasting inaccuracies contribute to approximately 24.24% of the bullwhip effect [7]. The proposed model specifically abstracts from stochastic supply chain conditions to enhance tractability and parameter calibration. However, these simplifying assumptions—such as short lead time ranges (due to short shelf-life products), single-product execution, and deterministic parameters—may limit direct applicability in highly volatile and multi-product environments in other industries, except perishable products. Nevertheless, the demonstrated robustness of the proposed approach provides a solid foundation for further exploration. Future research is encouraged to extend this model by testing alternative optimization algorithms, incorporating stochastic demand and supply variables, and validating multi-echelon configurations to develop a more adaptive and scalable solution for the FMCG industry.
The results of the sensitivity analysis reassure the adaptability and robustness of the proposed model. Although deviations in defect rate and holding cost produced measurable changes in the magnitude of the output indicators, the overall decision patterns and optimal configurations remained consistent. This consistency implies that the model is not overly sensitive to moderate parameter fluctuations, thereby reinforcing its credibility for use in uncertain or dynamically changing operational environments.
The symmetrical selection of higher and lower parameter values around the baseline ensures a comprehensive validation of model behavior under both optimistic and pessimistic conditions. Such results highlight the model’s capability to maintain decision stability across a broad range of operational conditions, thereby supporting its applicability in real-world manufacturing and planning contexts.
Furthermore, the consistent behavior observed here substantiates the proposed model’s reliability and enhances its potential for deployment in real-world decision-making environments where parameter variability is inevitable.
This study offers a demonstration with findings on the impact of the traditional approach and the developed OPQ model. In the RFID-based modified two-bin system, the manufacturer has better control over production quantity, and reducing the excess inventory in a developed way results in excessive cost reduction relating to both holding cost and reworking cost. Finally, the approach of this study is appreciated for its benefits to the FMCG industry. The majority of the reviewed literature, which had less focus on specifically reducing the excess inventory, indicated this in their research approaches.
6. Conclusions
This excess inventory reduction has been a source of motivation for the FMCG companies, as products have a short shelf life, particularly in the food and perishable goods category. This necessitates frequent replenishment and adds urgency to the supply chain. For instance, a sudden increase in consumer demand might lead to exaggerated orders and production increases at each stage of the supply chain, from retailers to distributors to manufacturers. In the prior study, the direct challenges of both excess inventory and total excessive cost could scarcely be identified. Considering the comprehensive investigation of those previous studies [15,16,38,40] as a basis, this study fills the research gap of underexplored excess inventory reduction along with the financial control flexibility of the FMCG company. This study aimed to develop and validate an RFID-based modified two-bin system model designed to reduce excess inventory, holding costs, and excessive costs. Furthermore, the model formulation integrated the Artificial Bee Colony algorithm to optimize the reworking rate to create a control over excessive cost. This methodological framework directly aligns with the study’s core objective of reducing excess inventory and excessive cost of perishable products in the FMCG Industry.
The results indicate that the proposed model effectively outperforms traditional approaches by significantly reducing excess inventory and excessive costs. The model demonstrated strong performance across sensitivity analysis involving changes in holding cost and non-performing item rate, demonstrating robustness and adaptability for real-world manufacturing operations.
Through the findings of this study, it is observed that there is a revolutionary impact on the FMCG to optimize the excess inventory, which illustrates the following:
- Proposed OPQ implementation indicates a pronounced reduction in excess inventory in percentages of 49%, 67%, 65% after the fourth month, eighth month, and twelfth month, respectively. As a result, tangible cost–benefit from a managerial point of view results in a reduction in cumulative holding costs in percentage of 57%, 63%, 64%, respectively.
- After the integration of the ABC algorithm into the proposed model, considerable cost–benefit was obtained on both reworking cost and holding cost, which leads to the overall cumulative excessive cost reduction in percentage of 41%, 44%, 44% after the fourth month, eighth month, and twelfth month, respectively.
From a theoretical point of view, this study replaces the conventional two-bin framework—traditionally implemented only at the manufacturer’s end—by introducing an RFID-enabled and distributor-level two-bin system that integrates real-time visibility and consumption feedback into production and inventory management. This modification not only shifts the replenishment control point closer to the market but also advances inventory theory by linking information transparency directly to excess inventory reduction, replenishment accuracy, and cost efficiency. Furthermore, by embedding the Artificial Bee Colony (ABC) algorithm within a deterministic control structure, the study extends inventory theory toward a more dynamic and self-regulating framework applicable to a broad range of FMCG companies according to their operational needs and budget constraints without potential risk of surplus inventory, enabling timely and data-driven responses to real-time consumption feedback from distribution centers. Methodologically, it contributes an integrated optimization-monitoring framework that synchronizes data acquisition with decision parameters. Practically, this proposed model shares with manufacturing and supply chain managers a viable strategy to reduce excessive inventory and excessive cost, avoiding stockouts, enhancing production scheduling accuracy, and improving operational transparency across supply chain nodes.
Thus, this approach provides leverage in the decision of optimum production quantity to strategically reduce the excess inventory along with cost performance. The approach developed in the study not only strengthens theoretical understanding but also provides actionable scopes for practitioners, motivating them to reduce excess inventory, even in market uncertainty.
Although the proposed model achieved notable improvements, its application currently only focuses on short shelf-life products in the FMCG industry. Though the proposed model can be applied to different product categories in short shelf-life products, each execution of this model focuses on a single product at a time. The framework is therefore product-generic in design but single product in operation, allowing its parameters to be customized for different product types while maintaining analytical precision for each case. Future researchers could extend this model to multi-echelon supply chain networks to capture coordination among suppliers, manufacturers, and distributors, and could even expand with stochastic factors. Moreover, authors appreciate investigating those practical challenges and barriers faced during the implementation of excess inventory optimization strategies, which can further enhance the model’s robustness, predictive accuracy, and practical adaptability in complex manufacturing systems in FMCG supply chains. To conclude, in the upcoming days, from this novel perspective, FMCG companies can not only reduce their excess inventory, but also have control over the total excessive cost according to the total allocated cost.
Author Contributions
Conceptualization, S.D., G.M.M.A.R., and G.S.; methodology, S.D., G.M.M.A.R.; software, S.D. and G.M.M.A.R.; resources, M.N.H.S., M.M.U., and G.S.; writing—original draft preparation, S.D. and G.M.M.A.R.; writing—review and editing, M.M.U. and G.S.; visualization, S.D. and G.M.M.A.R.; supervision, E.S.; project administration, E.S. All authors have read and agreed to the published version of the manuscript.
Funding
This research received no external funding.
Institutional Review Board Statement
Not applicable.
Informed Consent Statement
Not applicable.
Data Availability Statement
The original contributions presented in this study are included in the article. Further inquiries can be directed to the corresponding author.
Conflicts of Interest
The authors declare no conflicts of interest.
Abbreviations
The following abbreviations are used in this manuscript:
| FMCG | Fast-Moving Consumer Goods |
| RFID | Radio-Frequency Identification |
| ABC | Artificial Bee Colony |
| EI | Excess Inventory |
| OPQ | Optimal Production Quantity |
| Notations: | |
| The following notations are introduced for formulation: | |
| Indices: | |
| Number of distribution centers. | |
| Total days, t [d1, d1 + d2]. | |
| No. of weeks. | |
| Minimum. | |
| Maximum. | |
| Random number. | |
| Cost. | |
| Cost optimization of a specific variable. | |
References
- Grunow, M.; Piramuthu, S. RFID in Highly Perishable Food Supply Chains—Remaining Shelf Life to Supplant Expiry Date? Int. J. Prod. Economics 2013, 146, 717–727. [Google Scholar] [CrossRef]
- John, K.; Rajendran, C.; Ziegler, H. A Comparative Study on Allocation/Rationing Mechanisms Operational with/without Backorder Clearing in Divergent Supply Chains. Sādhanā 2019, 44, 231. [Google Scholar] [CrossRef]
- Chen, L.-M.; Yang, S.-J.S. Designing an Optimal Two-Bin Strategy for Selling Perishable Produce to Responsible and Mainstream Buyers. IEEE Trans. Eng. Manag. 2024, 71, 2089–2102. [Google Scholar] [CrossRef]
- Guo, J.; Liu, X. Research on the Supply Chain of Fast Moving Consumer Goods Industry. Front. Bus. Econ. Manag. 2023, 8, 73–76. [Google Scholar] [CrossRef]
- Khan, M.H.; Ahmad, S. Ranking Operational Causes of Bullwhip Effect in Supply Chain Using AHP: Perception of Managers in FMCG Sector. Metamorph. A J. Manag. Res. 2017, 15, 79–90. [Google Scholar] [CrossRef]
- Durán Peña, J.A.; Ortiz Bas, Á.; Reyes Maldonado, N.M. Impact of Bullwhip Effect in Quality and Waste in Perishable Supply Chain. Processes 2021, 9, 1232. [Google Scholar] [CrossRef]
- Derbel, M.; Hachicha, W.; Masmoudi, F. A literature survey of bullwhip effect (2010–2013) according to its causes and evaluation methods. In Proceedings of the 2014 International Conference on Advanced Logistics and Transport (ICALT), Hammamet, Tunisia, 1–3 May 2014; pp. 173–178. [Google Scholar]
- Musa, A.; Dabo, A.-A.A. A Review of RFID in Supply Chain Management: 2000–2015. Glob. J. Flex. Syst. Manag. 2016, 17, 189–228. [Google Scholar] [CrossRef]
- Tao, F.; Fan, T.; Lai, K.K.; Li, L. Impact of RFID Technology on Inventory Control Policy. J. Oper. Res. Soc. 2017, 68, 207–220. [Google Scholar] [CrossRef]
- Zhigang, Z. Applying RFID to Reduce Bullwhip Effect in a FMCG Supply Chain. In Proceedings of the 2011 International Conference on E-Business and E-Government (ICEE), Shanghai, China, 6–8 May 2011; pp. 1–4. [Google Scholar]
- Abdulmalek, F.; Wang, L.; Norman, B.A.; Rajgopal, J. Retail Shelf Replenishment with Item-Level RFID Tagging. Int. J. Ind. Syst. Eng. 2011, 8, 19–37. [Google Scholar] [CrossRef]
- Piramuthu, S.; Wochner, S.; Grunow, M. Should Retail Stores Also RFID-Tag ‘Cheap’ Items? Eur. J. Oper. Res. 2014, 233, 281–291. [Google Scholar] [CrossRef]
- Piramuthu, S.; Zhou, W. RFID and Perishable Inventory Management with Shelf-Space and Freshness Dependent Demand. Int. J. Prod. Econ. 2013, 144, 635–640. [Google Scholar]
- Fan, T.; Tao, F.; Deng, S.; Li, S. Impact of RFID Technology on Supply Chain Decisions with Inventory Inaccuracies. Int. J. Prod. Econ. 2015, 159, 117–125. [Google Scholar]
- Wanitwattanakosol, J.; Attakomal, W.; Suriwan, T. Redesigning the Inventory Management with Barcode-Based Two-Bin System. Procedia Manuf. 2015, 2, 113–117. [Google Scholar] [CrossRef]
- Pawłowicz, B.; Salach, M.; Trybus, B. The Infrastructure of RFID-Based Fast Moving Consumer Goods System Using Cloud. In Automation 2020: Towards Industry of the Future; Szewczyk, R., Zieliński, C., Kaliczyńska, M., Eds.; Advances in Intelligent Systems and Computing; Springer International Publishing: Cham, Switzerland, 2020; Volume 1140, pp. 216–226. [Google Scholar]
- Wang, X.; Disney, S.M. The Bullwhip Effect: Progress, Trends and Directions. Eur. J. Oper. Res. 2016, 250, 691–701. [Google Scholar]
- Leuveano, R.A.C.; Asih, H.M.; Ridho, M.I.; Darmawan, D.A. Balancing Inventory Management: Genetic Algorithm Optimization for A Novel Dynamic Lot Sizing Model in Perishable Product Manufacturing. J Robot. Control. 2023, 4, 878–895. [Google Scholar]
- Satiti, D.; Rusdiansyah, A.; Dewi, R.S. Shelf-Space Allocation and Product Arrangement for Fruits Considering Facility’s Temperature Distribution. In Proceedings of the 2020 IEEE 7th International Conference on Industrial Engineering and Applications (ICIEA), Bangkok, Thailand, 16–21 April 2020; pp. 409–413. [Google Scholar]
- Raghunathan, S. Information Sharing in a Supply Chain: A Note on Its Value When Demand Is Nonstationary. Manag. Sci. 2001, 47, 605–610. [Google Scholar]
- Gaur, V.; Giloni, A.; Seshadri, S. Information Sharing in a Supply Chain Under ARMA Demand. Manag. Sci. 2005, 51, 961–969. [Google Scholar]
- Moyaux, T.; Chaib-draa, B.; D’Amours, S. Information Sharing as a Coordination Mechanism for Reducing the Bullwhip Effect in a Supply Chain. IEEE Trans. Syst. Man. Cybern. Part C 2007, 37, 396–409. [Google Scholar] [CrossRef]
- Buchmeister, B.; Friscic, D.; Palcic, I. Bullwhip Effect Study in a Constrained Supply Chain. Procedia Eng. 2014, 69, 63–71. [Google Scholar] [CrossRef]
- Nemtajela, N.; Mbohwa, C. Relationship between Inventory Management and Uncertain Demand for Fast Moving Consumer Goods Organisations. Procedia Manuf. 2017, 8, 699–706. [Google Scholar]
- Nasiri, G.R.; Kalantari, M.; Karimi, B. Fast-Moving Consumer Goods Network Design with Pricing Policy in an Uncertain Environment with Correlated Demands. Comput. Ind. Eng. 2021, 153, 106997. [Google Scholar] [CrossRef]
- Bottani, E.; Montanari, R.; Volpi, A. The Impact of RFID and EPC Network on the Bullwhip Effect in the Italian FMCG Supply Chain. Int. J. Prod. Econ. 2010, 124, 426–432. [Google Scholar] [CrossRef]
- Ghelichi, A.; Abdelgawad, A. A Study on RFID-Based Kanban System in Inventory Management. In Proceedings of the 2014 IEEE International Conference on Industrial Engineering and Engineering Management, Selangor Darul Ehsan, Malaysia, 9–12 December 2014; pp. 1357–1361. [Google Scholar]
- Matharage, S.T.; Hewage, U.; Perera, H.N. Impact of Sharing Point of Sales Data and Inventory Information on Bullwhip Effect. In Proceedings of the 2020 IEEE International Conference on Industrial Engineering and Engineering Management (IEEM), Singapore, Singapore, 14–17 December 14 2020; pp. 857–861. [Google Scholar]
- Putrevu, V.L.P.K. Study on the Impact of Data and Information Quality on Warehouse Management of Raw Materials on the Supply Chain in an Enterprise of the Consumer Goods Branch. Duisburg Essen Publ. Online 2022. [Google Scholar] [CrossRef]
- Mattegunta, V.K.P. Retail-Time Inventory Visibility: Transforming Retail Operations Through Real-Time Data Integration. J. Comput. Sci. Technol. Stud. 2025, 7, 58–64. [Google Scholar] [CrossRef]
- Chung, K.-J.; Cárdenas-Barrón, L.E. The Complete Solution Procedure for the EOQ and EPQ Inventory Models with Linear and Fixed Backorder Costs. Math. Comput. Model. 2012, 55, 2151–2156. [Google Scholar] [CrossRef]
- Chiu, S.W.; Lin, H.-D.; Song, M.-S.; Chen, H.-M.; Chiu, Y.-S.P. An Extended EPQ-Based Problem with a Discontinuous Delivery Policy, Scrap Rate, and Random Breakdown. Sci. World J. 2015, 2015, 621978. [Google Scholar] [CrossRef]
- Ali, R.; Khalid, R.; Qaiser, S. A Discrete Event Simulation Analysis of the Bullwhip Effect in a Multi-Product and Multi-Echelon Supply Chain of Fast Moving Consumer Goods. Pak. J. Stat. Oper. Res. 2020, 16, 561–576. [Google Scholar] [CrossRef]
- Xu, Y.; Fan, P.; Yuan, L. A Simple and Efficient Artificial Bee Colony Algorithm. Math. Probl. Eng. 2013, 2013, 526315. [Google Scholar] [CrossRef]
- Ruidas, S.; Seikh, M.R.; Nayak, P.K. An EPQ Model with Stock and Selling Price Dependent Demand and Variable Production Rate in Interval Environment. Int. J. Syst. Assur. Eng. Manag. 2020, 11, 385–399. [Google Scholar] [CrossRef]
- Dash, S.S.; Nayak, S.K.; Mishra, D. ABC Versus PSO: A Comparative Study and Analysis on Optimization Aptitude. In Advances in Intelligent Computing and Communication; Das, S., Mohanty, M.N., Eds.; Lecture Notes in Networks and Systems; Springer: Singapore, Singapore, 2021; Volume 202, pp. 527–544. [Google Scholar]
- Mohd Zin, N.S.; Jamaluddin, S.H.; Mahmud, N.; Muhammat Pazil, N.S. Minimizing the Total Cost of Inventory by Using Artificial Bee Colony Algorithm. Int. J. Acad. Res. Bus. Soc. Sci. 2021, 11, 1147–1154. [Google Scholar] [CrossRef]
- Zhigang, Z. Applying RFID to Reduce Bullwhip Effect in a FMCG Supply Chain. In Advances in Computational Environment Science; Lee, G., Ed.; Advances in Intelligent and Soft Computing; Springer: Berlin, Heidelberg, 2012; Volume 142, pp. 193–199. [Google Scholar]
- Sardar, S.K.; Sarkar, B.; Kim, B. Integrating Machine Learning, Radio Frequency Identification, and Consignment Policy for Reducing Unreliability in Smart Supply Chain Management. Processes 2021, 9, 247. [Google Scholar] [CrossRef]
- Sadeghi, A. Providing a Measure for Bullwhip Effect in a Two-Product Supply Chain with Exponential Smoothing Forecasts. Int. J. Prod. Econ. 2015, 169, 44–54. [Google Scholar] [CrossRef]
Disclaimer/Publisher’s Note: The statements, opinions and data contained in all publications are solely those of the individual author(s) and contributor(s) and not of MDPI and/or the editor(s). MDPI and/or the editor(s) disclaim responsibility for any injury to people or property resulting from any ideas, methods, instructions or products referred to in the content. |
© 2025 by the authors. Licensee MDPI, Basel, Switzerland. This article is an open access article distributed under the terms and conditions of the Creative Commons Attribution (CC BY) license (https://creativecommons.org/licenses/by/4.0/).