Abstract
Sorption isotherm is an essential property for the processing of biological materials. In this study, a component model for the prediction of the sorption isotherm was evaluated. In order to validate this component model, the moisture sorption isotherms for Chrysanthemum morifolium flowers and the orchid Anoectochilus formosanus Hayata were determined. The sorption isotherm was measured by using the equilibrium relative humidity technique for five temperatures. Seven sorption isotherm models were selected with four quantitative criteria and residual plots to evaluate fitting ability and prediction performance for these products. The results indicated that the sorption temperature did not significantly affect the adsorption isotherm. The Caurie and Henderson equations could be used for C. morifolium flowers and A. formosanus Hayata. The isotherm data of raw bamboo, elecampe and three varieties of corn kernels from the literature were adopted to validate the component model. Comparing with the predicted values of component values and actual isotherm moisture, the component model has good predictive ability at the aw range smaller than 0.7. Considering the practical application, the aw range below 0.7 is the main range for the processing of agricultural products, and the predictive values of this component model could be helpful for food engineering and for the food industry.
1. Introduction
Living plants need to be processed after harvesting. Processing operations include drying, packaging, handling, and storing. The physical, chemical and biological conditions such as microbial growth of plant materials are affected by moisture content, temperature and relative humidity (RH) of the ambient environment and treatment methods [1,2].
At fixed temperatures and pressures, the relationship between the relative humidity (RH) of ambient air and moisture content is called sorption isotherm. The definition of the water activity (aw) is the ratio between the partial vapor pressure of water in the biological materials and the partial vapor pressure of pure water at the same temperature. The equilibrium relative humidity is called water activity in food science field. The sorption isotherm dictates the corresponding water content at the same temperature for each humidity. Sorption isotherm properties include desorption and adsorption according to the adsorption or dehydration of moisture content. The sorption isotherm is essential information for the predicting drying and storage of materials. The design of packaging materials and the method are also related to these properties.
There are several methods to determine the sorption isotherms of biological materials [1]. For the gravimetric method, the RH is maintained with different saturated salt solutions or sulphuric acid dilutions at different concentrations. The samples are enclosed in this RH environment at content temperature until its weight is balanced with ambient RH [3,4,5]. This equilibrium moisture content (EMC) method is simple, inexpensive and can be performed in most laboratories. However, the equilibrium time is longer, especially at higher RH. These samples could be contaminated if the ambient RH value is higher than 75 %. The other method is called the hygrometric or equilibrium relative humidity method. The samples at a given moisture content and fixed temperature are placed in an enclosed container. The RH in the container is measured as the humidity environment reaches the equilibrate state [6,7,8]. The key points for this technique are the uniform moisture distribution of samples and the accuracy of the hygrometer.
Crapiste and Rotstein [9] predicted the sorption isotherms of potatoes based on the magnitude and sorption properties of individual constituents. By equating the chemical potential of water in each component and that of water in the surrounding air, equations were derived to calculate the moisture content occupied by each component. In this study, their model was modified to calculate the sorption isotherms of herbs.
Empirical models are useful to quantify the relationship between equilibrium moisture content and equilibrium relative humidity of biological materials. Basu et al. [1] and Al-Muhtaseb et al. [10] provided a detail review of widely used sorption models.
Literature on moisture sorption isotherm for agricultural and food products is abundant. Bonner and Kenney [11] reported the moisture sorption characteristics of energy sorghum, and Oyelade et al. [5] investigated maize flour. The EMC/aw properties of various plants with medical functions or industrial crops were reported. Argyropoulos et al. [12] introduced the sorption isotherms of leaves and stems of lemon balm (Melissa officinalis. L), Bahloul et al. [13] examined Tunisian olive leaves (Oleu europaea L.), Choudbury et al. [14] investigated raw bamboo (Dendrocalamus longispathus) shoots and Ait Mohamed et al. [3] determined sorption properties of Gelidium sesquipedale. The EMC/aw data of conidia of Beauveria bassiana (Balsam) Vuillemin was studied by Hong et al. [15].
The flower of C. morifolium, one of varieties for making chrysanthemum flower tea, is popularly used as a medicine and is a healthy beverage. The anti-oxidation and anti-ischemia-reperfusion injury action have been shown proved with animal tests and clinic studies [16]. A. formosanus Hayata is a folk medicine in Taiwan. According to studies by Shih et al. [17], this herb has anti-inflammation and liver protection effects and could be used to treat hypertension, diabetes mellitus and tuberculosis.
The objectives of this study were to (1) determine the moisture adsorption behavior for three biological products at five temperature by using the equilibrium relative humidity technique, and, (2) evaluate the fitting ability of six sorption isotherm models to describe the experimental data, (3) evaluate the predictive ability of the component model for two herbs and other agricultural products.
2. The Component Model
2.1. Development of the Component Model
There are six components are considered: protein, starch, fiber, oil, sugar, and ash. Sugars and ash were combined as the vacuole component. The effect of oil component on the sorption isotherms is omitted due to its insignificance.
The total moisture content is:
where Hi = the water content (g of water)
Ht = Hv + Xf × Xf + Xs × Hs + Xp × Hp
Xi = the weight content (decimal)
t, v, f, s and p denote the total materials, vacuole, fiber, starch, and protein.
2.2. The Isotherm Equation of Each Component
2.2.1. The Vacuolar Component
The aw (water activity) values of the vacuolar component was calculated by the Ross equation [18],
where aw g = the aw of glucose
aw v = aw g × aw s × aw a
aw s = the aw of sucrose
aw a = the aw of ashes
From the study of Crapiste and Rotstein [9],
where Xg, Xs and Xa are the water mole fractions of glucose, sucrose, and ashes.
aw g = Xg × 10^(−0.858*(1 − Xg)^2.0
aw s = Xs × 10^(−2.772*(1 − Xs))^2.0
aw a = Xa × 10^(−0.716*(1 − Xa)^2.0
The water mole fraction can be calculated by:
where Mw = The molecular mass (g/mol) of water
Ai = Mw/Mi
Mi = The molecular mass (g/mol) of component
Wi = The weight fraction of component
Therefore, Xg, Xs and Xa are calculated as follows:
aw and Xv can then be evaluated with Equations (2)–(10).
2.2.2. Fiber Component
The Kelsey correction equation [19] was used to express the relationship in the water-cellulose-moist air system.
The relationship for Xf and aw fber was computed by Equations (11) and (12).
2.2.3. Starch Component
Original isotherm data for starch have been presented by Chung and Pfost [20]. The Henderson equation was used to describe the relation of Xs and aw.
Xs = 18.19182 × (−ln(1 − aw)^0.41181
2.2.4. Protein Component
Two sets of protein isotherm data were calculated and proposed [21].
Xp = 0.090614 × (−1n(aw)^−0.62)
For a given aw value, the moisture content of each component can be obtained. The relationship between aw and moisture content of different herbs could be calculated.
3. Materials and Methods
3.1. Materials
The biological materials, used for this study was purchased at a local herb market, in Taichung, Taiwan. The initial moistures of C. Morifolium flower and A. formosanus Hayata were 2.05 % and 1.98 % (on dry basis), respectively.
The desired determination moisture content ranged from 2 % to 20 %, the moisture content for packaging, storing, handling and processing. The samples were rewetted by adding predetermining amount of the water to obtain the desire moisture content. The preparation followed the procedure of Shen and Chen [22]. Samples were mixed with water and stored in plastic containers. After mixing, samples were stored at 5 °C for two weeks to ensure uniform distribution of moisture content. Because of the lower storage temperature, no microbial growth was found during the two weeks’ storage.
3.2. Temperature and RH Sensors
The temperature and RH probes of the Shinyei THT-V2-112-73-A2 transmitter (Shinyei Technology, Kobe, Japan) was used. The specifications of this sensor are in Table 1.

Table 1.
Specifications of the Shinyei THT-V2-112-73-A2 transmitter.
3.3. Calibration of Sensors
The temperature and RH transmitter was calibrated. The temperature sensing element was calibrated by the TC-2000 temperature calibrator (Instutek AS, Scan-Sense AS, Bekkeveien 163, N-3173 Vear, Norway) and the humidity sensing element was calibrated by several saturated salt solutions. The detail method included the saturated salts that were used, solution volume to air volume ratio and the stable of the temperature were according to the requirement of Organization Internationale De Metrologie Legale (OMIL) [23].
3.4. The Equilibrium Relative Humidity Method
The moisture sorption isotherms of C. Morifolium C. flower, and A. formosanus Hayata at five temperatures (i.e., 5 °C, 15 °C, 25 °C, 35 °C, and 45 °C) was determined by the equilibrium relative humidity method. Samples of known moisture content were placed in a 350 mL container. RH/temperature probes were inserted into the containers and surrounded with samples. These sensors and containers were placed in a temperature-controlled chamber. When the RH and temperature within the sample containers reached the equilibrate state, RH and temperature were recorded. The samples were taken out and the moisture content was determined again. Then new samples and containers were placed into a temperature-controlled chamber for the next temperature level. The reading of RH and temperature of these probes was transformed into actual values with pre-established equations to ensure measured accuracy. The set-up for the measurement is presented in Figure 1. This technique has been used to determinate sorption isotherm for peanuts [6], sweet potato slices [24], pea seeds [25], Oolong tea [7] and autoclaved aerated concrete [8].
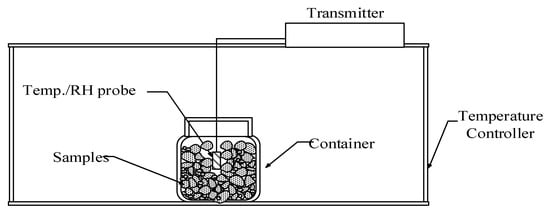
Figure 1.
Sketch of experimental set-up.
The moisture content of the samples was determined by using a drying oven at 105 °C for 24 h.
3.5. Moisture Sorption Isotherm Models
Seven sorption isotherm equations were used to evaluate the fitting ability and prediction performance of sorption isotherms of C. Morifolium flower and A. formosanus Hayata at five temperatures. These models are in Table 2. The statistical analysis involved linear and nonlinear regression. The parameters were estimated with use of SigmaPlot v12.2 (SPSS Inc., Chicago, IL, USA).
Table 2.
Moisture sorption isotherms models fitted to the sorption data.
3.6. Comparison Criteria for Sorption Models
Four quantitative criteria were used.
a. The coefficient of determination (R2)
b. The standard error of the model (s)
where is the measured value, is the predicted value from model, and n is the number of data.
c. The mean relative error (MRE)
d. Predicted errors sum of square (PRESS)
The PRESS was used to evaluate the predictive performance of sorption models [31]. The criterion was derived from the predictive error, e-i. When a dataset was used to compare the predictive ability of a model, the i observation was withdrawn, and the remaining n-1 data were used to estimate the parameters of the model. The i data was substituted into this regression model to calculated the predicted value -i. The difference between the original yi value and y-i value was called the predictive error, e-i. The sum of the square e-i, is called the PRESS.
Residual plots were used as the criterion to evaluate the adequacy of the models. If the residual plots presented a clean pattern, the model was considered inadequate. If the residual plots exhibited a uniform distribution, the model was considered adequate for these sorption data.
4. Results and Discussion
4.1. Sorption Isotherm of C. Morifolium Flowers
The adsorption data for C. morifolium flowers at three temperatures is shown in Figure 2.
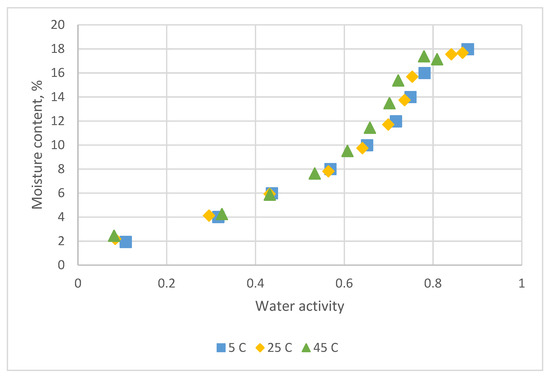
Figure 2.
Sorption data for C. morifolium flowers obtained at 5 °C, 25 °C and 45 °C by the equilibrium relative humidity method.
The equilibrium time for each equilibrium relative humidity test was 12 h. The required time to reach the weight balance of the EMC method was 40–60 days for withered leaves, black and green tea [32] and 60–80 days for persimmon leaves [33]. The equilibrium relative humidity method could save the required experimental time.
The sorption isotherms of C. morifolium flower was a sigmoid form and reflected a type II BET classification [1,10].
The sorption temperature had a marginal effect on the adsorption isotherm (Figure 2). The reason may be explained by its rewetting history from fried samples [1].
Table 3 lists the estimated parameters and comparison statistics for seven models. The residual plots are shown in Figure 3. The Caurie equation had higher value for R2 and lower value for s, MRE and PRESS. The residual plots at five temperatures all showed a uniform distribution with the Henderson and Caurie equations. The Chung-Pfost, Halsey, Oswin, White & Eirig and GAB equations gave lower R2 and higher value for s, MRE and PRESS. The residual plots all showed a systematic pattern. These five equations could not be served as adequate equations for adsorption data of C. morifolium flowers.
Table 3.
Estimated parameters and evaluating criteria of six models used for adsorption data at five temperatures for C. morifolium flowers.
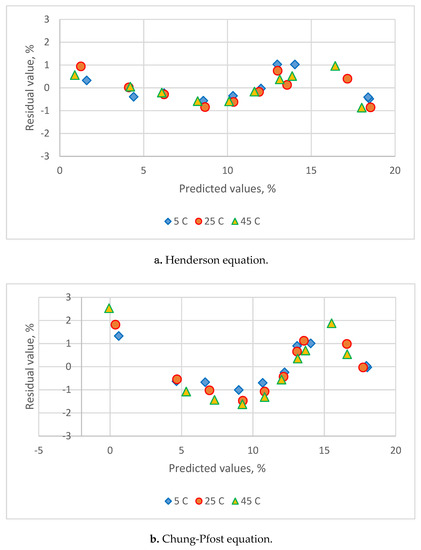
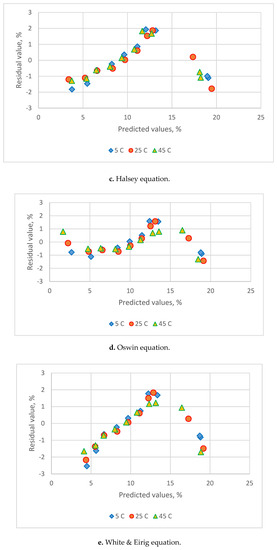
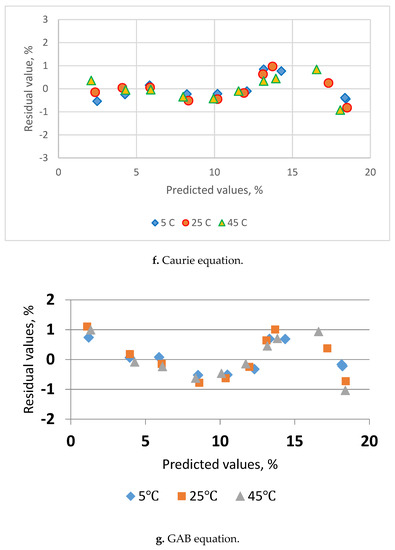
Figure 3.
Residual plots for the sorption isotherm equations for sorption data of C. morifolium flowers obtained at three temperatures. (a) Henderson eq., (b) Chung-Pfost eq., (c) Halsey eq., (d) Oswin eq., (e) White & Eirig eq., (f) Caurie eq., (g) GAB eq.
4.2. Sorption Isotherm of A. Formosanus HAYATA
Figure 4 displays the adsorption EMC data for A. formosanus Hayata at three temperatures. The sorption isotherms of this product have a sigmoid form and display the type II on BET classification [1,10].
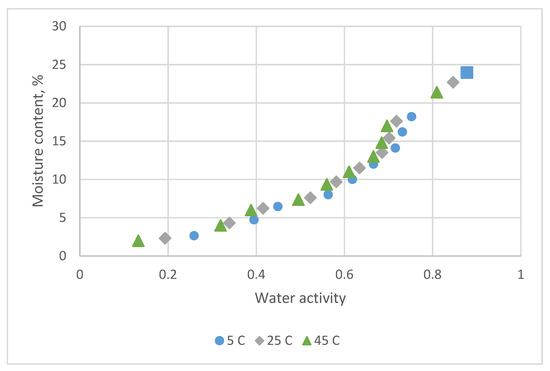
Figure 4.
Sorption data for A. formosanus Hayata obtained at 5 °C, 25 °C and 45 °C by the equilibrium relative humidity method.
The sorption temperature only had a little effect on the adsorption data. Table 4 indicates the estimated parameters and comparison statistics for seven models. The results are similar to those of C. morifolium flowers. The Chung-Pfost, Halsey, Oswin, White & Eirig and GAB equations had lower R2 and higher value for s, MRE and PRESS. The residual plots all presented a systematic pattern.
Table 4.
Estimated parameters and evaluating criteria of six models used for adsorption data at five temperatures for A. formosanus Hayata.
The Henderson and Caurie equations all conferred a uniform distribution of residual plots. However, the quantitative criteria were not consistent. For example, for the adsorption data at 5 °C, 15 °C and 25 °C, the Caurie equation had larger values of R2 and smaller value of s and PRESS. The Henderson equation, on the other hand, had a smaller value for MRE. Both equations could describe well the adsorption data for A. formosanus Hayata.
4.3. Predictive Ability of Component Model for Two Herbs
The chemical composition of C. morifolium flower and A. formosanus Hayata is listed in Table 5. The prediction curves calculated from equation (8–13) and the fitting curves of actual measurement values are shown in Figure 5 and Figure 6.
Table 5.
Chemical composition of C. morifolium flower and A. formosamus Hayata.
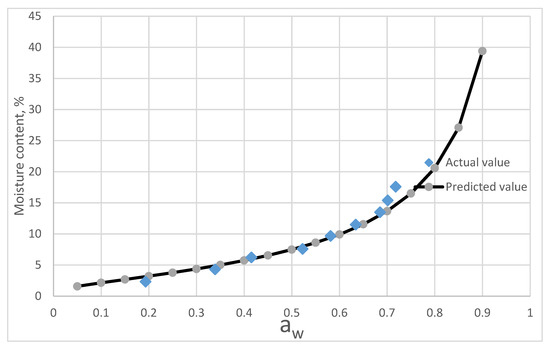
Figure 5.
Comparing of the predictive values from the component model and the actual isotherm moisture of A. formosanus Hayata.
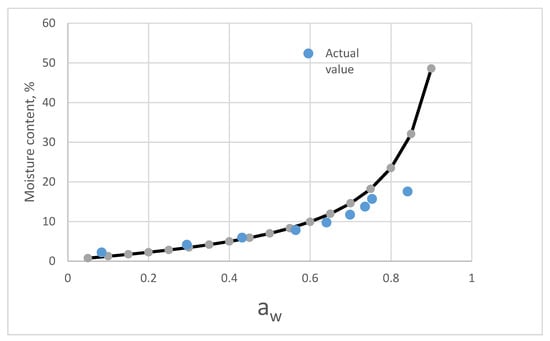
Figure 6.
Comparing of the predictive values from the component model and the actual isotherm moisture of C. Morifolium flower.
Figure 5 shows that component model exhibits a good agreement with the sorption isotherms of A. formusanus Hayata below 0.7 aw. Above 0.7 aw, the predicted values by component model was lower than that of measurement values.
A comparison of predictive values of component model and actual sorption isotherm of C. morifolium flower is shown in Figure 6. Below 0.65 aw, both values were close. However, the predictive values of component model increase rapidly due to the high moisture value of the vacuolar component.
4.4. Predictive Ability of Component Model for Other Products
The chemical composition of five agricultural products is listed in Table 6. These ratios of chemical compositions were taken from the literature, as was the sorption isotherm of these products.
Table 6.
Chemical composition of several agricultural products.
The predictive values and actual isotherm of raw bamboo are shown in Figure 7. Below 60 % RH, the predictive value and sorption isotherm is closed. As the RH increases, the discrepancy of the moisture content between the predictive values increased.
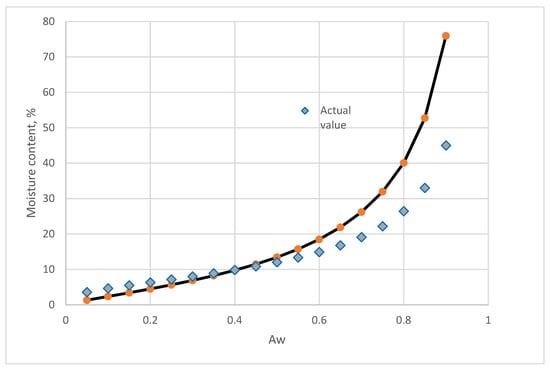
Figure 7.
Comparing of the predictive values from the component model and the actual isotherm moisture of raw bamboo.
The comparison results of the predictive values and actual isotherm of elecampe (Inula helenium L.) [34] are given in Figure 8. Below 0.65 aw, the predictive value and actual values of sorption isotherm are closed. In the higher aw range, the discrepancy of the moisture content between predictive values increased.
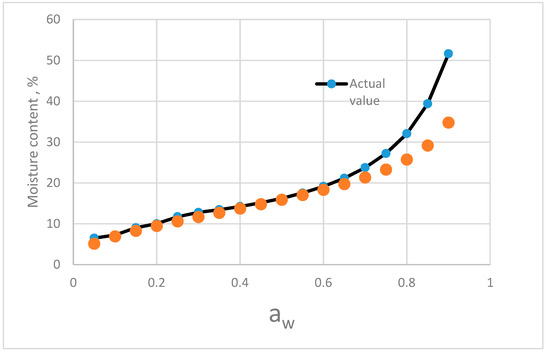
Figure 8.
Comparing of the predictive values from the component model and the actual isotherm moisture of elecampe (Inula helenium L.).
The results of comparison for three corn varieties is presented in Figure 9. Below 0.7 aw, predictive values of component model were close to the sorption isotherms [34]. The moisture of predictive value increased rapidly for three corn varieties.
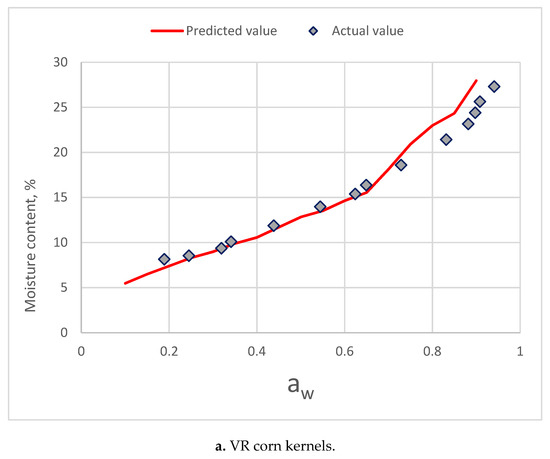
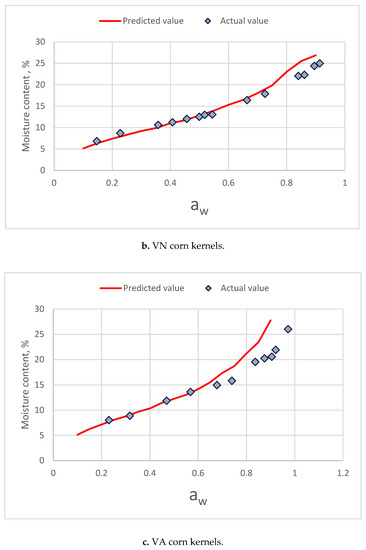
Figure 9.
Comparing of the predictive values from the component model and the actual isotherm moisture of three varieties of corn kernel. (a. VR corn kernels; b. VN corn kernels; c. VA corn kernels).
The results of the comparison between predictive values of component model and sorption isotherm of two herbs and five products were similar. As aw higher than 0.7, the component model showed a good predictive ability. When aw was higher than 0.7, the predictive moisture content increased rapidly with an increase of aw.
Crapiste and Rotstein [9] proposed a starchy-component model to predict isotherms from components. They suggested that their model could be applied over the entire range of moisture content. However, the results of this study indicated that this component model was valid in the aw range below 0.7. The failure is the higher aw range of this component model might be due to the interaction of these components is the higher aw range.
From the viewpoint of practical application, the aw range below 0.7 is the main range for the processing of agricultural products and food stuffs. Pathogenic microorganisms cannot develop at aw smaller than 0.6. With aw at 0.3, the products is in stable with respect to non-enzymatic browning, lipid oxidation, enzyme activity and other microbial parameters [10], so the good predictive ability of component model at the aw range smaller than 0.7 could be helpful for food engineering and for the food industry.
5. Conclusions
A component model was proposed to predict the moisture sorption isotherm data. The moisture sorption isotherm of C. morifolium flowers and A. formosanus Hayata was determined using an equilibrium relative humidity method at five temperatures. Seven sorption isotherm models were selected to evaluate the fitting ability and prediction performance for these products. Sorption temperature did not have a significant effect on the adsorption isotherms for the three samples. The Caurie and Henderson equations could be used for C. morifolium flowers. Considering the quantitative criteria, the Caurie equation is the best. The Henderson and Caurie equations were adequate for sorption isotherms of A. formosanus Hayata, but the quantitative criteria were not consistent. The isotherm data of raw bamboo, elecampe and three varieties of corn kernels from the literature were adopted to validate the component model. The component model showed a good predictive ability within an aw range smaller than 0.7. Considering the practical application, the aw range below 0.7 is the main range for the processing of agricultural products, so the predictive values of this component model could be helpful for food engineering and for the food industry.
Author Contributions
C.C. drafted the proposal, executed some experiments, interpreted some results and write the manuscript critically and interpreted the results.
Funding
This research received no external funding.
Acknowledgments
The authors would like to thank the Ministry of Science and Technology of the Republic of China for financially supporting this research under Contract No. MOST-104-2313-B-005-031.
Conflicts of Interest
The authors declare no conflict of interest.
References
- Basu, S.; Shivhare, U.S.; Mujumdar, A.S. Models for sorption isotherms for foods: A review. Dry. Technol. 2006, 24, 917–930. [Google Scholar] [CrossRef]
- Fleurat-Lessard, F. Integrated management of the risks of stored grain spoilage by seed borne fungi and contamination by storage mould mycotoxins—An update. J. Stored Prod. Res. 2017, 71, 22–40. [Google Scholar] [CrossRef]
- Mohamed, L.A.; Kouhila, M.; Lahsasni, S.; Jamali, A.; Idlimam, A.; Rhazi, M.; Aghfir, M.; Mahrouz, M. Equilibrium moisture content and heat of sorption of Gelidium sesquipedale. J. Stored Prod. Res. 2005, 41, 199–209. [Google Scholar] [CrossRef]
- Barrozo, M.A.S.; Silva, A.A.M.; Oliveira, D.T. The use of curvature and bias measures to discriminate among equilibrium moisture equations for mustard seed. J. Stored Prod. Res. 2008, 44, 65–70. [Google Scholar] [CrossRef]
- Oyelade, O.J.; Tunde-Akintunde, T.Y.; Igbeka, J.C.; Oke, M.O.; Raji, O.Y. Modelling moisture sorption isotherms for maize flour. J. Stored Prod. Res. 2008, 44, 179–185. [Google Scholar] [CrossRef]
- Chen, C. A rapid method to determine the sorption isotherms of peanuts. J. Agric. Eng. Res. 2000, 75, 401–408. [Google Scholar] [CrossRef]
- Chen, C.; Weng, Y. Moisture Sorption isotherms of Oolong tea. Food Bioprocess Technol. 2010, 3, 226–233. [Google Scholar] [CrossRef]
- Chen, H.; Chen, C. Equilibrium relative humidity method used to determine the sorption isotherm of autoclaved aerated concrete. Build. Environ. 2014, 81, 427–435. [Google Scholar] [CrossRef]
- Crapiste, G.H.; Rostein, E. Predicting of sorptional equilibrium data for starch containing foodstuffs. J. Food Sci. 1982, 47, 1501–1507. [Google Scholar] [CrossRef]
- Al-Muhtaseb, A.H.; McMinn, W.A.M.; Magee, T.R.A. Moisture sorption isotherm characteristics of food products: A review. Food Bioprod. Process. 2002, 80, 118–128. [Google Scholar]
- Bonner, I.J.; Kenney, K.L. Moisture sorption characteristics and modeling of energy sorghum (Sorghum bicolor (L.) Moench). J. Stored Prod. Res. 2013, 52, 128–136. [Google Scholar] [CrossRef]
- Argyropoulos, D.; Alex, R.; Kohler, R.; Müller, J. Moisture sorption isotherms and isosteric heat of sorption of leaves and stems of lemon balm (Melissa officinalis L.) established by dynamic vapor sorption. LWT-Food Sci. Technol. 2012, 47, 324–331. [Google Scholar] [CrossRef]
- Bahloul, N.; Boudhrioua, N.; Kechaou, N. Moisture desorption–adsorption isotherms and isostericheats of sorption of Tunisian olive leaves (Olea europaea L.). Ind. Crops Prod. 2008, 28, 162–176. [Google Scholar] [CrossRef]
- Choudhury, D.; Sahu, J.K.; Sharma, G.D. Moisture sorption isotherms, heat of sorption and properties of sorbed water of raw bamboo (Dendrocalamus longispathus) shoots. Ind. Crops Prod. 2011, 33, 211–216. [Google Scholar] [CrossRef]
- Hong, T.D.; Ellis, R.H.; Gunn, J.; Moore, D. Relative humidity, temperature, and the equilibrium moisture content of conidia of Beauveria bassiana (Balsamo) Vuillemin: A quantitative approach. J. Stored Prod. Res. 2002, 38, 33–41. [Google Scholar] [CrossRef]
- Lee, J.S.; Kim, H.J.; Lee, Y.S. A new anti-HIV flavonoid glucuronide from Chrysanthemum morifolium. Planta Med. 2003, 69, 859–861. [Google Scholar] [PubMed]
- Shih, C.C.; Wu, Y.W.; Lin, W.C. Ameliorative effects of Anoectochilus formosanus extract on osteopenia in ovariectomized rats. J. Ethnopharmacol. 2001, 77, 233–238. [Google Scholar] [CrossRef]
- Ross, K.D. Estimation of water activity in intermediate moisture foods. Food Technol. 1975, 29, 26–34. [Google Scholar]
- Kelsey, K.E. The sorption of water vapour by wood. Aust. J. Appl. Sci. 1957, 8, 42–45. [Google Scholar]
- Chung, D.S.; Pfost, H.B. Adsorption and desorption of water vapour by cereal grains and their products. Part II. Hypothesis for explaining the hysteresis effect. Trans. ASAE 1967, 10, 552–555. [Google Scholar]
- Hermansson, A.M. Functional properties of proteins for foods—Water vapor sorption. J. Food Technol. 1977, 12, 177–187. [Google Scholar] [CrossRef]
- Shen, Y.; Chen, C. Preparation of reference materials for rice kernels. Biosyst. Eng. 2007, 97, 41–49. [Google Scholar] [CrossRef]
- Organization Internationale De Metrologie Legale (OMIL). The Scale of Relative Humidity of Air Certified Against Saturated Salt Solutions; OMIL R 121; OMIL: Paris, France, 1996. [Google Scholar]
- Chen, C. Sorption isotherms of sweet potato slices. Biosyst. Eng. 2002, 83, 85–95. [Google Scholar] [CrossRef]
- Chen, C. Moisture sorption isotherms of pea seeds. J. Food Eng. 2002, 58, 45–51. [Google Scholar] [CrossRef]
- Henderson, S.M. A basic concept of equilibrium moisture. Agri. Eng. 1952, 33, 29–32. [Google Scholar]
- Halsey, G. Physical adsorbtion in non-uniform surfaces. J. Chem. Phys. 1948, 16, 931–937. [Google Scholar] [CrossRef]
- Oswin, C.R. The kinetics of package life. III. The isotherm. J. Chem. Soc. 1946, 65, 419–421. [Google Scholar] [CrossRef]
- Castillo, M.D.; Martinez, E.J.; Gonzalez, H.H.L.; Pacin, A.M.; Resnik, S.L. Study of mathematical models applied to sorption isotherms of Argentinean black bean varieties. J. Food Eng. 2003, 60, 343–348. [Google Scholar] [CrossRef]
- Berg, C.; Bruin, S. Water activity and its estimation in food systems: Theoretical aspects. In Water Activity: Influences on Food Quality; Rockland, L.B., Stewart, G.F., Eds.; Academic Press: New York, NY, USA, 1981; pp. 1–61. [Google Scholar]
- Myers, R.H. Classical and Modern Regression with Applications, 2nd ed.; Duxbury Press: Pacific Grove, CA, USA, 2000. [Google Scholar]
- Ghodake, H.M.; Goswami, T.K.; Chakraverty, A. Moisture sorption isotherms, heat of sorption and vaporization of withered leaves, black and green tea. J. Food Eng. 2007, 78, 827–835. [Google Scholar] [CrossRef]
- Heras, R.M.-L.; Heredia, A.; Castelló, M.L.; Andrés, A. Moisture sorption isotherms and isosteric heat of sorption of dry persimmon leaves. Food Biosci. 2014, 7, 88–94. [Google Scholar] [CrossRef]
- Cervenka, L.; Kubinova, J.; Juszczak, L.; Witczak, M. Moisture sorption isotherms and glass transition temperature of elecampe (Inula helenium L.) and burdock (Arctium lappa L.) roots at 25 °C. Food Sci. Technol. Int. 2012, 18, 81–91. [Google Scholar] [CrossRef]
- Chen, C. A Study of Equilibrium Relative Humidity for Yellow-Dent Corn Kernels. Ph.D. Thesis, University of Minnesota, Minneapolis, MN, USA, 1988. [Google Scholar]
© 2019 by the author. Licensee MDPI, Basel, Switzerland. This article is an open access article distributed under the terms and conditions of the Creative Commons Attribution (CC BY) license (http://creativecommons.org/licenses/by/4.0/).