
AFB1 and OTA Promote Immune Toxicity in Human LymphoBlastic T Cells at Transcriptomic Level


Abstract
1. Introduction
2. Material and Methods
2.1. Chemicals
2.2. Cell Culture and Exposure Conditions
2.3. RNA Extraction and Next Generation Sequencing (NGS)
2.4. Data Processing
2.5. DEGs Analysis
2.6. Gene Selection and Primer Design
2.7. Reverse Transcription and qPCR
2.8. Statistical Analysis
3. Results
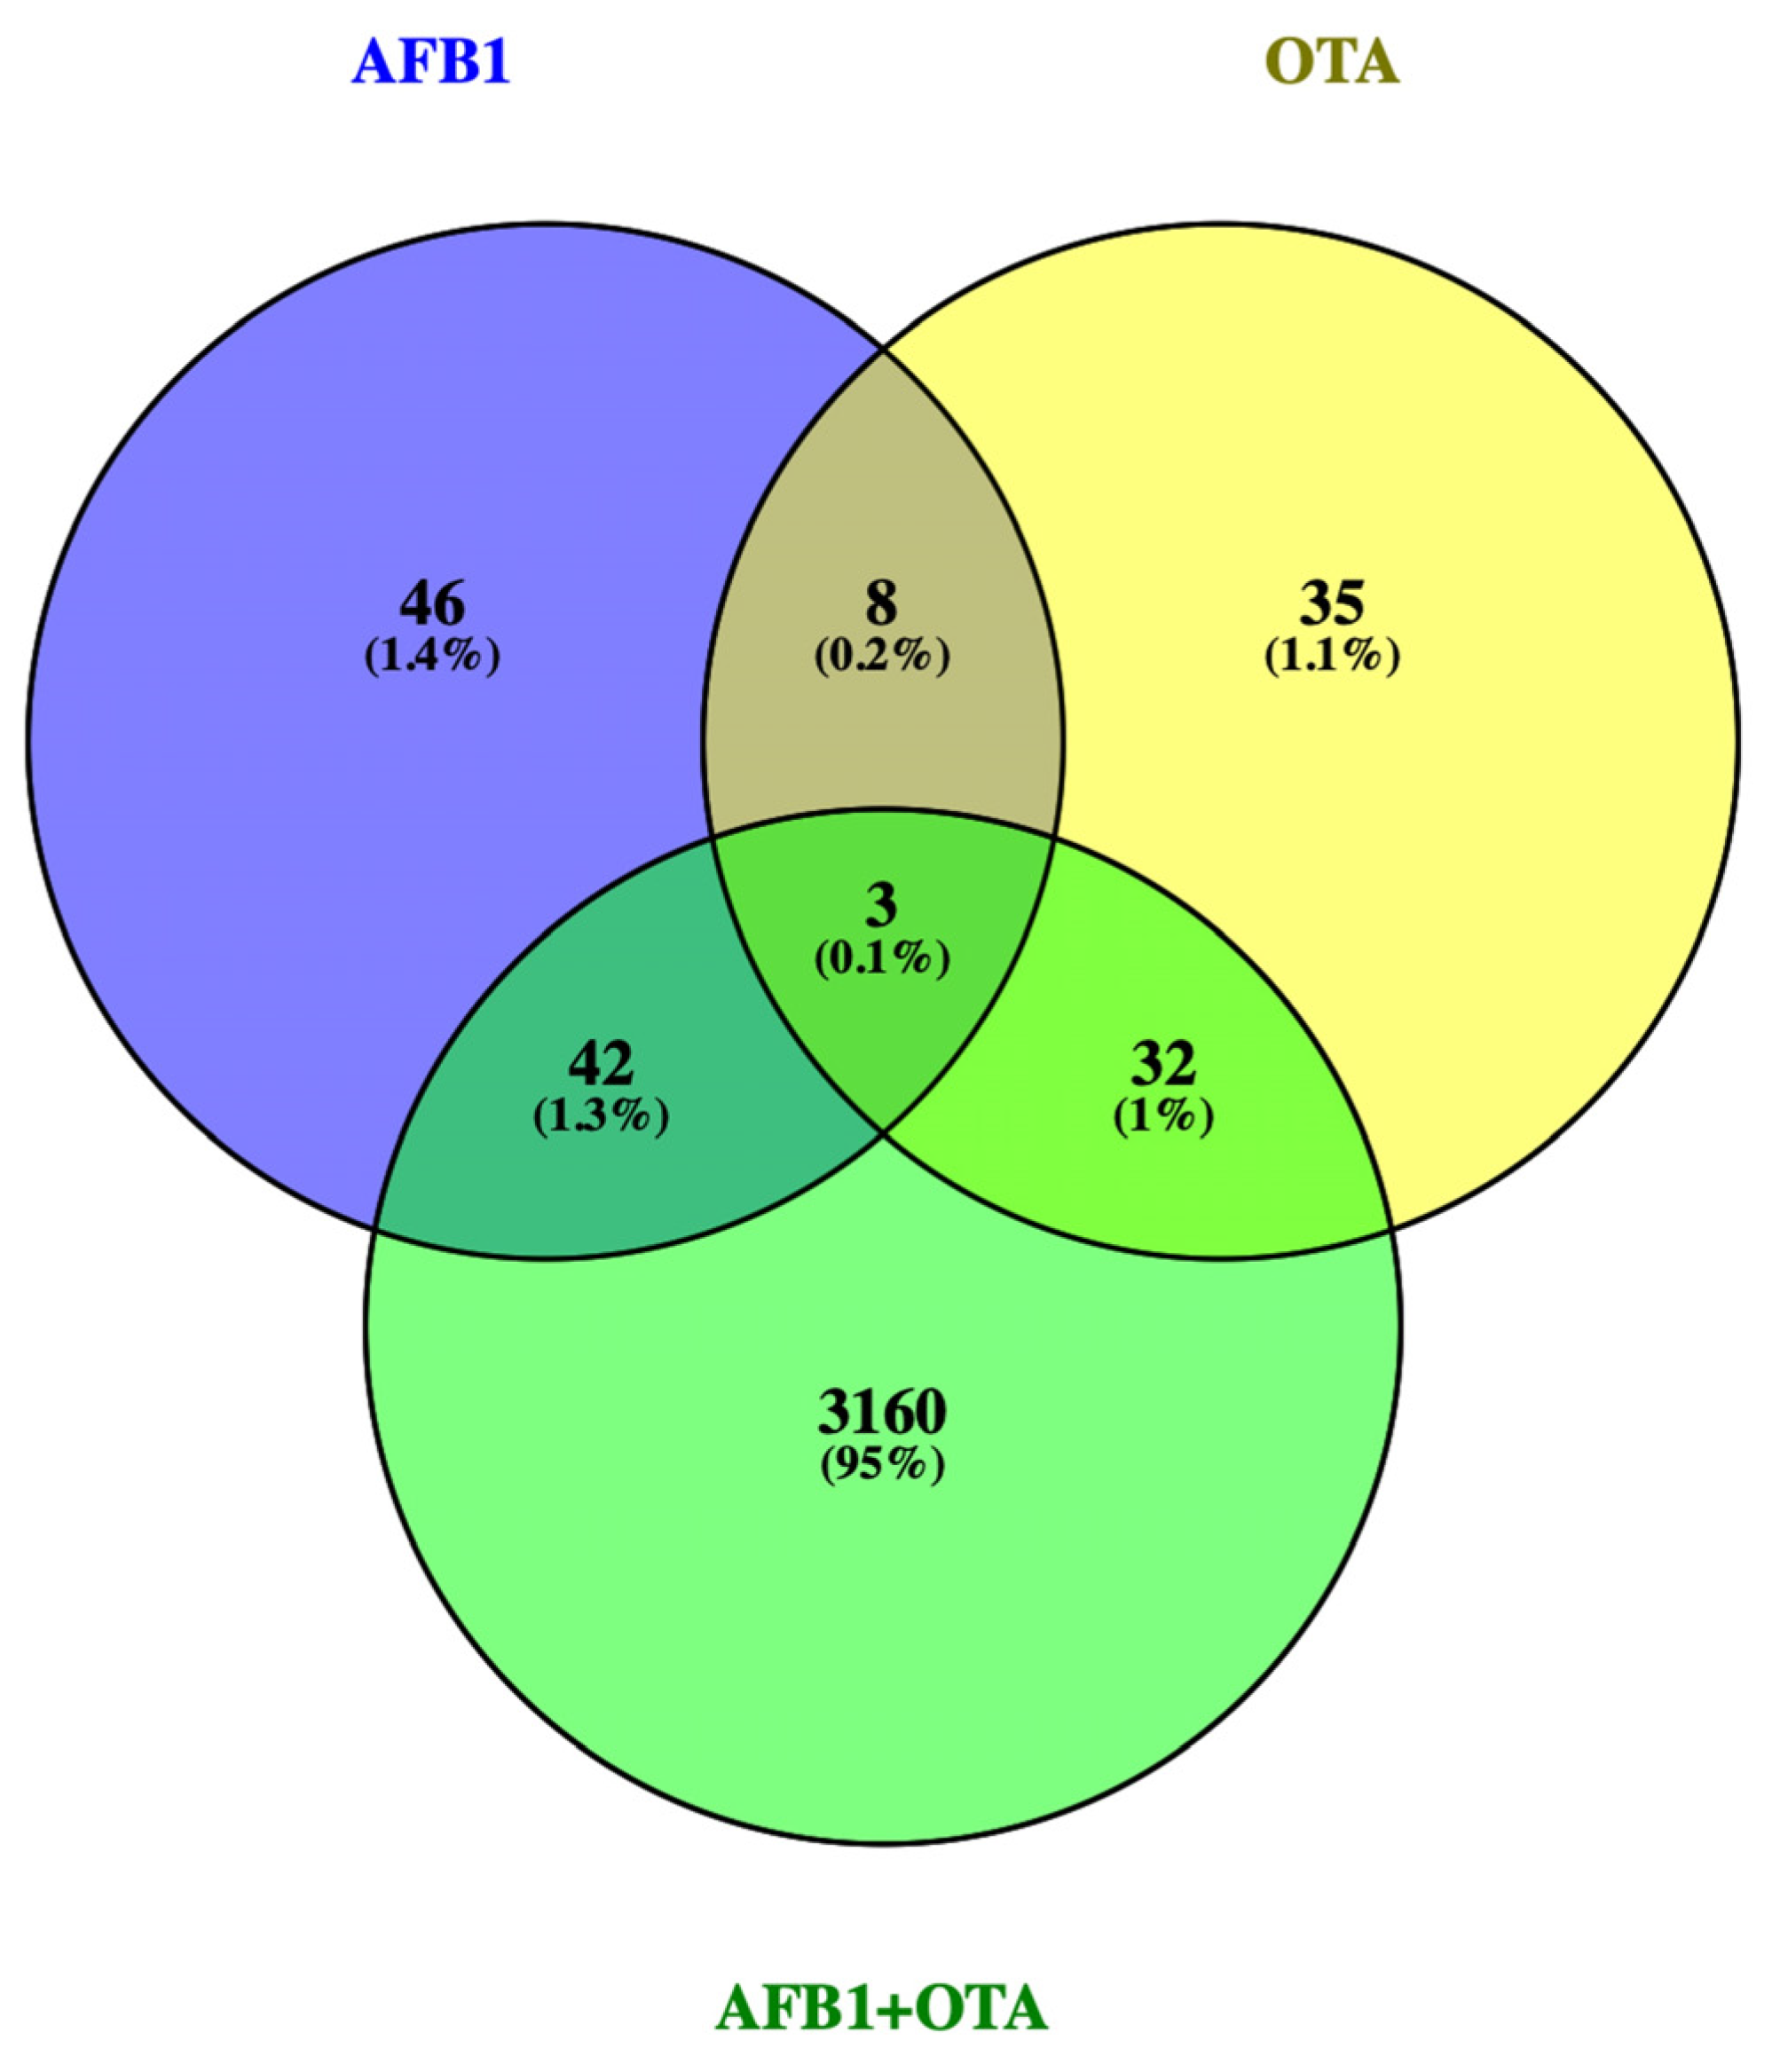
3.1. DEGs Profile
3.2. GO and Pathway Identification
3.2.1. AFB1-Exposure
3.2.2. OTA Exposure
3.2.3. AFB1-OTA Combined Exposure
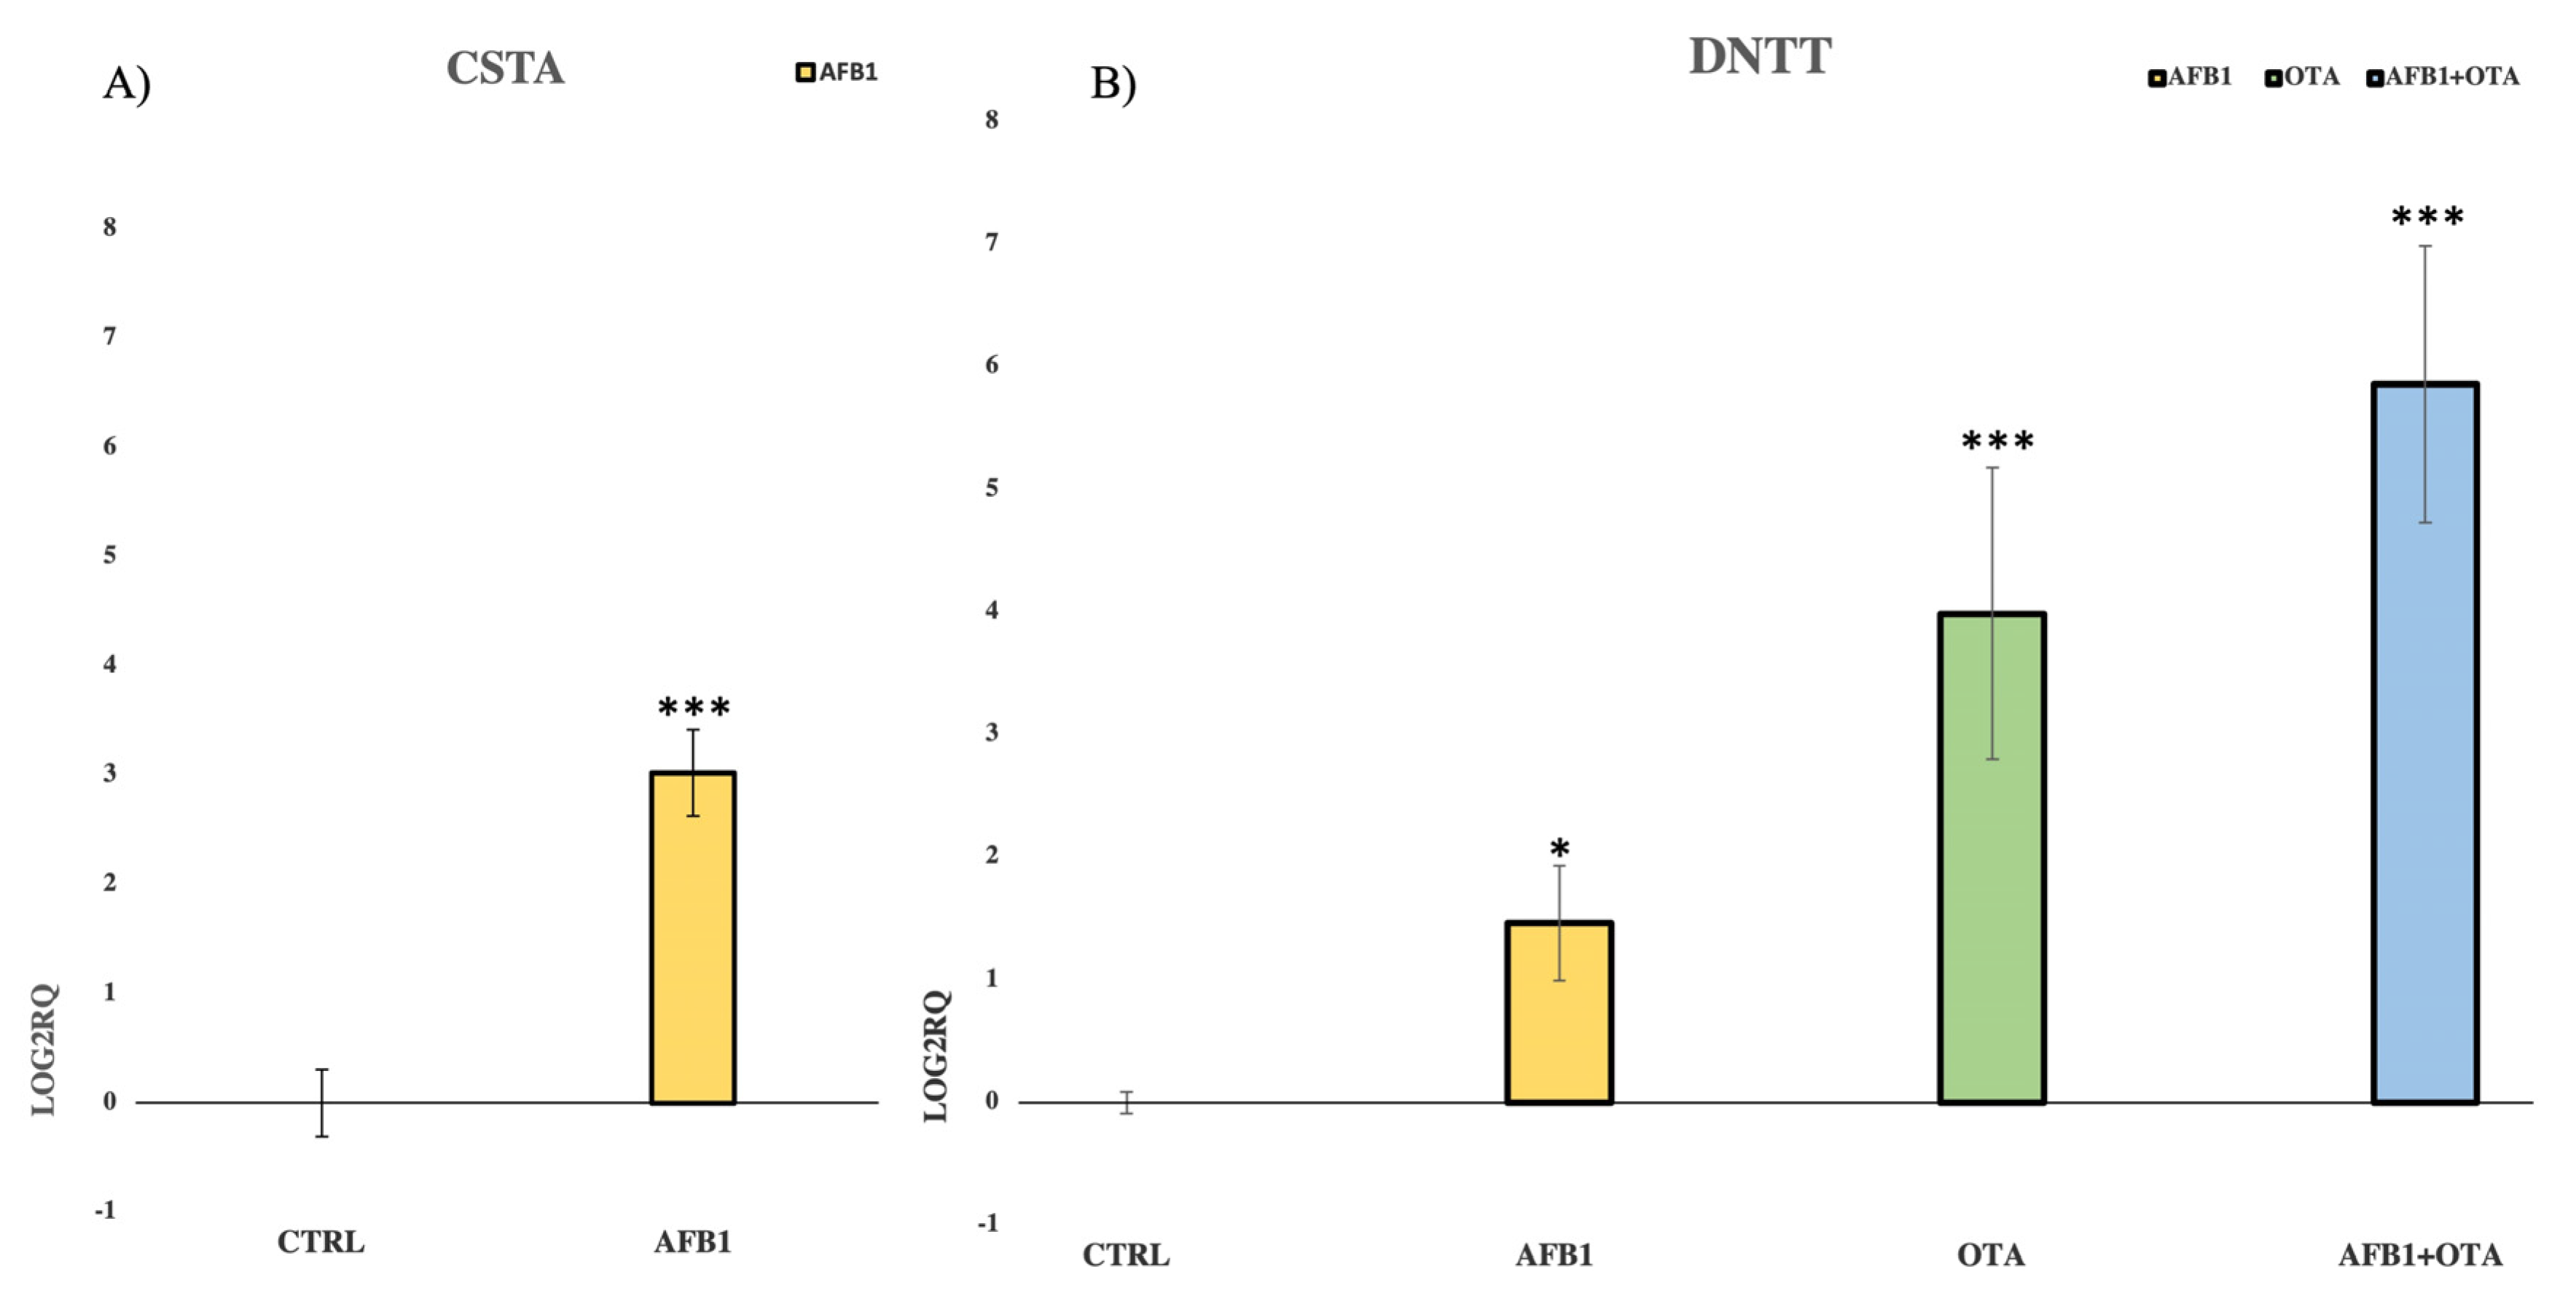
3.3. Validation of NGS Results by qPCR
4. Discussion
4.1. AFB1 Exposure
4.2. OTA Exposure
4.3. AFB1-OTA Combined Exposure
5. Conclusions
Author Contributions
Funding
Data Availability Statement
Conflicts of Interest
References
- Umesha, S.; Manukumar, H.M.G.; Chandrasekhar, B.; Shivakumara, P.; Shiva Kumar, J.; Raghava, S.; Prakash, H.S. Aflatoxins and food pathogens: Impact of biologically active aflatoxins and their control strategies. J. Sci. Food Agric. 2017, 97, 1698–1707. [Google Scholar] [CrossRef] [PubMed]
- Manyes, L.; Font, G. Mycotoxins: Toxicity, Occurrence, Risk Assessment and Prevention. In Encyclopedia of Human Nutrition, 4th ed.; Elsevier: New York, NY, USA, 2022. [Google Scholar] [CrossRef]
- Frangiamone, M.; Alonso-Garrido, M.; Font, G.; Cimbalo, A.; Manyes, L. Pumpkin extract and fermented whey individually and in combination alleviated AFB1-and OTA-induced alterations on neuronal differentiation in vitro. Food Chem. Toxicol. 2022, 164, 113011. [Google Scholar] [CrossRef] [PubMed]
- Rushing, B.R.; Selim, M.I. Aflatoxin B1: A review on metabolism, toxicity, occurrence in food, occupational exposure, and detoxification methods. Food Chem. Toxicol. 2019, 124, 81–100. [Google Scholar] [CrossRef] [PubMed]
- IARC Working Group on the Evaluation of Carcinogenic Risks to Humans. Chemical agents and related occupations. IARC Monogr. Eval. Carcinog. Risks Hum. 2012, 100(Pt. F), 9. [Google Scholar]
- Chen, W.; Li, C.; Zhang, B.; Zhou, Z.; Shen, Y.; Liao, X.; Yang, J.; Wang, Y.; Li, X.; Li, Y.; et al. Advances in biodetoxification of ochratoxin A: A review of the past five decades. Front. Microbiol. 2018, 9, 1386. [Google Scholar] [CrossRef]
- Zhu, L.; Zhang, B.; Dai, Y.; Li, H.; Xu, W. A review: Epigenetic mechanism in ochratoxin A toxicity studies. Toxins 2017, 9, 113. [Google Scholar] [CrossRef]
- Cimbalo, A.; Frangiamone, M.; Font, G.; Manyes, L. The importance of transcriptomics and proteomics for studying molecular mechanisms of mycotoxin exposure: A review. Food Chem. Toxicol. 2022, 169, 113396. [Google Scholar] [CrossRef]
- Tao, Y.; Xie, S.; Xu, F.; Liu, A.; Wang, Y.; Chen, D.; Pan, Y.; Huang, L.; Peng, D.; Wang, X.; et al. Ochratoxin A: Toxicity, oxidative stress and metabolism. Food Chem. Toxicol. 2018, 112, 320–331. [Google Scholar] [CrossRef]
- Cimbalo, A.; Frangiamone, M.; Lozano, M.; Escrivá, L.; Vila-Donat, P.; Manyes, L. Protective role of fermented whey and pumpkin extract against aflatoxin B1 and ochratoxin A toxicity in Jurkat T-cells. World Mycotoxin J. 2022, 1–14. [Google Scholar] [CrossRef]
- Frangiamone, M.; Cimbalo, A.; Alonso-Garrido, M.; Vila-Donat, P.; Manyes, L. In vitro and in vivo evaluation of AFB1 and OTA-toxicity through immunofluorescence and flow cytometry techniques: A systematic review. Food Chem. Toxicol. 2022, 160, 112798. [Google Scholar] [CrossRef]
- An, Y.; Shi, X.; Tang, X.; Wang, Y.; Shen, F.; Zhang, Q.; Yu, L. Aflatoxin B1 induces reactive oxygen species-mediated autophagy and extracellular trap formation in macrophages. Front. Cell Inf. Microbiol. 2017, 7, 53. [Google Scholar] [CrossRef]
- Sun, Y.; Liu, Z.; Liu, D.; Chen, J.; Gan, F.; Huang, K. Low-level aflatoxin B1 promotes influenza infection and modulates a switch in macrophage polarization from M1 to M2. Cell. Physiol. Biochem. 2018, 49, 1151–1167. [Google Scholar] [CrossRef]
- Bakheet, S.A.; Attia, S.M.; Alwetaid, M.Y.; Ansari, M.A.; Zoheir, K.M.; Nadeem, A.; Ahmad, S.F. β-1, 3-Glucan reverses aflatoxin B1-mediated suppression of immune responses in mice. Life Sci. 2016, 152, 1–13. [Google Scholar] [CrossRef]
- Ben Salah-Abbes, J.; Jebali, R.; Sharafi, H.; Akbari Noghabi, K.; Oueslati, R.; Abbès, S. Immuno-physiological alterations from AFB1 in rats counteracted by treatments with Lactobacillus paracasei BEJ01 and montmorillonite clay mixture. J. Immunotoxicol. 2016, 13, 628–637. [Google Scholar] [CrossRef]
- Guan, K.; Li, H.; Zuo, Z.; Wang, F.; Hu, P.; Peng, X.; Ouyang, P. The Molecular Mechanisms of Protective Role of Se on the G0/G1 Phase Arrest Caused by AFB1 in Broiler’s Thymocytes. Biol. Trace Elem. Res. 2019, 189, 556–566. [Google Scholar] [CrossRef]
- Han, Z.; Zhang, Y.; Wang, C.; Liu, X.; Jiang, A.; Liu, Z.; Wei, Z. Ochratoxin A-triggered chicken heterophil extracellular traps release through reactive oxygen species production dependent on activation of NADPH oxidase, ERK, and p38 MAPK signaling pathways. J. Agric. Food Chem. 2019, 67, 11230–11235. [Google Scholar] [CrossRef]
- Jahreis, S.; Kuhn, S.; Madaj, A.M.; Bauer, M.; Polte, T. Mold metabolites drive rheumatoid arthritis in mice via promotion of IFN-gamma-and IL-17-producing T cells. Food Chem. Toxicol. 2017, 109, 405–413. [Google Scholar] [CrossRef]
- Liu, D.; Su, J.; Lin, J.; Qian, G.; Chen, X.; Song, S.; Huang, K. Activation of AMPK-dependent SIRT-1 by astragalus polysaccharide protects against ochratoxin A-induced immune stress in vitro and in vivo. Int. J. Biol. Macromol. 2018, 120, 683–692. [Google Scholar] [CrossRef]
- Hou, L.; Gan, F.; Zhou, X.; Zhou, Y.; Qian, G.; Liu, Z.; Huang, K. Immunotoxicity of ochratoxin A and aflatoxin B1 in combination is associated with the nuclear factor kappa B signaling pathway in 3D4/21 cells. Chemosphere 2018, 199, 718–727. [Google Scholar] [CrossRef]
- Hernández, A.F.; Tsatsakis, A.M. Human exposure to chemical mixtures: Challenges for the integration of toxicology with epidemiology data in risk assessment. Food Chem. Toxicol. 2017, 103, 188–193. [Google Scholar] [CrossRef]
- Arce-López, B.; Lizarraga, E.; Vettorazzi, A.; González-Peñas, E. Human biomonitoring of mycotoxins in blood, plasma and serum in recent years: A review. Toxins 2020, 12, 147. [Google Scholar] [CrossRef] [PubMed]
- Kareem, S.A.; Hameed, R.M.; AL-Redha, S.A.; Al-Khatt, H. Aflatoxin B1 as a Threshold Concept of Uncertain Etiology of Chronic Kidney Diseases. Indian J. Forensic Med. Toxicol. 2021, 15, 737–744. [Google Scholar] [CrossRef]
- Leong, Y.H.; Latiff, A.A.; Ahmad, N.I.; Rosma, A. Exposure measurement of aflatoxins and aflatoxin metabolites in human body fluids. A short review. Mycotoxin Res. 2012, 28, 79–87. [Google Scholar] [CrossRef] [PubMed]
- Fan, K.; Xu, J.; Jiang, K.; Liu, X.; Meng, J.; Di Mavungu, J.D.; Han, Z. Determination of multiple mycotoxins in paired plasma and urine samples to assess human exposure in Nanjing, China. Environ. Pollut. 2019, 248, 865–873. [Google Scholar] [CrossRef] [PubMed]
- Ferrufino-Guardia, E.; Chavez-Rico, V.; Larondelle, Y. Ochratoxin a in human breast milk, maternal and placental blood from Cochabamba-Bolivia. Rev. Toxicol. 2019, 36, 116–125. [Google Scholar]
- Warensjö Lemming, E.; Montano Montes, A.; Schmidt, J.; Cramer, B.; Humpf, H.U.; Moraeus, L.; Olsen, M. Mycotoxins in blood and urine of Swedish adolescents—Possible associations to food intake and other background characteristics. Mycotoxin Res. 2020, 36, 193–206. [Google Scholar] [CrossRef]
- Ali, N.; Blaszkewicz, M.; Hossain, K.; Degen, G.H. Determination of aflatoxin M1 in urine samples indicates frequent dietary exposure to aflatoxin B1 in the Bangladeshi population. Int. J. Hyg. Environ. Health 2017, 220, 271–281. [Google Scholar] [CrossRef]
- Ali, N.; Manirujjaman, M.; Rana, S.; Degen, G.H. Determination of aflatoxin M1 and deoxynivalenol biomarkers in infants and children urines from Bangladesh. Arch. Toxicol. 2020, 94, 3775–3786. [Google Scholar] [CrossRef]
- De Cássia Romero, A.; Ferreira, T.R.B.; dos Santos Dias, C.T.; Calori-Domingues, M.A.; da Gloria, E.M. Occurrence of AFM1 in urine samples of a Brazilian population and association with food consumption. Food Control 2010, 21, 554–558. [Google Scholar] [CrossRef]
- EFSA Panel on Contaminants in the Food Chain (CONTAM); Schrenk, D.; Bodin, L.; Chipman, J.K.; del Mazo, J.; Grasl-Kraupp, B.; Bignami, M. Risk assessment of ochratoxin A in food. EFSA J. 2020, 18, e06113. [Google Scholar] [CrossRef]
- Ali, N.; Hossain, K.; Degen, G.H. Blood plasma biomarkers of citrinin and ochratoxin A exposure in young adults in Bangladesh. Mycotoxin Res. 2018, 34, 59–67. [Google Scholar] [CrossRef]
- Coronel, M.B.; Marin, S.; Tarragó, M.; Cano-Sancho, G.; Ramos, A.J.; Sanchis, V. Ochratoxin A and its metabolite ochratoxin alpha in urine and assessment of the exposure of inhabitants of Lleida, Spain. Food Chem. Toxicol. 2011, 49, 1436–1442. [Google Scholar] [CrossRef]
- Muñoz, K.; Blaszkewicz, M.; Degen, G.H. Simultaneous analysis of ochratoxin A and its major metabolite ochratoxin alpha in plasma and urine for an advanced biomonitoring of the mycotoxin. J. Chromatogr. B 2010, 878, 2623–2629. [Google Scholar] [CrossRef]
- Wu, Q.; Dohnal, V.; Huang, L.; Kuca, K.; Wang, X.; Chen, G.; Yuan, Z. Metabolic pathways of ochratoxin A. Curr. Drug Metab. 2011, 12, 1–10. [Google Scholar] [CrossRef]
- Andrews, S. FastQC: A Quality Control Tool for High Throughput Sequence Data. 2010. Available online: http://www.bioinformatics.babraham.ac.uk/projects/fastqc (accessed on 25 July 2021).
- Hannon, G.J. FASTX-Toolkit. 2010. Available online: http://hannonlab.cshl.edu/fastx_toolkit (accessed on 30 July 2021).
- Dobin, A.; Davis, C.A.; Schlesinger, F.; Drenkow, J.; Zaleski, C.; Jha, S.; Gingeras, T.R. STAR: Ultrafast universal RNA-seq aligner. Bioinformatics 2013, 29, 15–21. [Google Scholar] [CrossRef]
- Li, H.; Handsaker, B.; Wysoker, A.; Fennell, T.; Ruan, J.; Homer, N.; Durbin, R. The sequence alignment/map format and SAMtools. Bioinformatics 2009, 25, 2078–2079. [Google Scholar] [CrossRef]
- R Core Team. R: A Language and Environment for Statistical Computing, R Foundation for Statistical Computing: Vienna, Austria, 2018. Available online: https://www.R-project.org (accessed on 21 September 2021).
- Robinson, M.D.; McCarthy, D.J.; Smyth, G.K. edgeR: A Bioconductor package for differential expression analysis of digital gene expression data. Bioinformatics 2010, 26, 139–140. [Google Scholar] [CrossRef]
- Kolde, R. Pheatmap: Pretty Heatmaps, R package Version 1.0.12; CRAN R-Project: Vienna, Austria, 2019. Available online: https://cran.r-project.org/web/packages/pheatmap/index.html (accessed on 21 September 2021).
- Swinton, J. Vennerable Package. 2013. Available online: https://github.com/js229/Vennerable (accessed on 21 September 2021).
- Alonso-Garrido, M.; Escrivá, L.; Manyes, L.; Font, G. Enniatin B induces expression changes in the electron transport chain pathway related genes in lymphoblastic T-cell line. Food Chem. Toxicol. 2018, 121, 437–443. [Google Scholar] [CrossRef]
- Escrivá, L.; Jennen, D.; Caiment, F.; Manyes, L. Transcriptomic study of the toxic mechanism triggered by beauvericin in Jurkat cells. Toxicol. Lett. 2018, 284, 213–221. [Google Scholar] [CrossRef]
- Kamburov, A.; Herwig, R. ConsensusPathDB 2022: Molecular interactions update as a resource for network biology. Nucleic Acids Res. 2022, 50, D587–D595. [Google Scholar] [CrossRef]
- Kutmon, M.; van Iersel, M.P.; Bohler, A.; Kelder, T.; Nunes, N.; Pico, A.R.; Evelo, C.T. PathVisio 3: An extendable pathway analysis toolbox. PLoS Comput. Biol. 2015, 11, e1004085. [Google Scholar] [CrossRef] [PubMed]
- Martens, M.; Ammar, A.; Riutta, A.; Waagmeester, A.; Slenter, D.N.; Hanspers, K.; Kutmon, M. WikiPathways: Connecting communities. Nucleic Acids Res. 2021, 49, D613–D621. [Google Scholar] [CrossRef] [PubMed]
- Livak, K.J.; Schmittgen, T.D. Analysis of relative gene expression data using real-time quantitative PCR and the 2−ΔΔCT method. Methods 2001, 25, 402–408. [Google Scholar] [CrossRef] [PubMed]
- Bustin, S.A.; Benes, V.; Garson, J.A.; Hellemans, J.; Huggett, J.; Kubista, M.; Wittwer, C.T. The MIQE Guidelines: Minimum Information for Publication of Quantitative Real-Time PCR Experiments. Clin. Chem. 2009, 55, 611–622. [Google Scholar] [CrossRef]
- Alexeyenko, A.; Lee, W.; Pernemalm, M.; Guegan, J.; Dessen, P.; Lazar, V.; Pawitan, Y. Network enrichment analysis: Extension of gene-set enrichment analysis to gene networks. BMC Bioinform. 2012, 13, 226. [Google Scholar] [CrossRef]
- Conesa, A.; Madrigal, P.; Tarazona, S.; Gomez-Cabrero, D.; Cervera, A.; McPherson, A.; Mortazavi, A. A survey of best practices for RNA-seq data analysis. Genome Biol. 2016, 17, 13. [Google Scholar] [CrossRef]
- Badovinac, V.P.; Porter, B.B.; Harty, J.T. Programmed contraction of CD8+ T cells after infection. Nat. Immunol. 2002, 3, 619–626. [Google Scholar] [CrossRef]
- Lieberman, N.A.; Peddu, V.; Xie, H.; Shrestha, L.; Huang, M.L.; Mears, M.C.; Greninger, A.L. In vivo antiviral host transcriptional response to SARS-CoV-2 by viral load, sex, and age. PLoS Biol. 2020, 18, e3000849. [Google Scholar] [CrossRef]
- Corcuera, L.A.; Arbillaga, L.; Vettorazzi, A.; Azqueta, A.; De Cerain, A.L. Ochratoxin A reduces aflatoxin B1 induced DNA damage detected by the comet assay in Hep G2 cells. Food Chem. Toxicol. 2011, 49, 2883–2889. [Google Scholar] [CrossRef]
- Golli-Bennour, E.E.; Kouidhi, B.; Bouslimi, A.; Abid-Essefi, S.; Hassen, W.; Bacha, H. Cytotoxicity and genotoxicity induced by aflatoxin B1, ochratoxin A, and their combination in cultured Vero cells. J. Biochem. Mol. Toxicol. 2010, 24, 42–50. [Google Scholar] [CrossRef]
- Sedmikova, M.; Reisnerova, H.; Dufkova, Z.; Barta, I.; Jilek, F. Potential hazard of simultaneous occurrence of aflatoxin B~ 1 and ochratoxin A. Vet. Med. Praha 2001, 46, 169–174. [Google Scholar] [CrossRef]
- Choi, S.Y.; Kim, T.H.; Hong, M.W.; Park, T.S.; Lee, H.; Lee, S.J. Transcriptomic alterations induced by aflatoxin B1 and ochratoxin A in LMH cell line. Poult. Sci. 2020, 99, 5265–5274. [Google Scholar] [CrossRef]
- Zhang, T.; Penicud, K.; Bruhn, C.; Loizou, J.I.; Kanu, N.; Wang, Z.Q.; Behrens, A. Competition between NBS1 and ATMIN controls ATM signaling pathway choice. Cell Rep. 2012, 2, 1498–1504. [Google Scholar] [CrossRef][Green Version]
- Sancar, A.; Lindsey-Boltz, L.A.; Ünsal-Kaçmaz, K.; Linn, S. Molecular mechanisms of mammalian DNA repair and the DNA damage checkpoints. Annu. Rev. Biochem. 2004, 73, 39–85. [Google Scholar] [CrossRef]
- Stracker, T.H.; Roig, I.; Knobel, P.A.; Marjanovic, M. The ATM signaling network in development and disease. Front. Genet. 2013, 4, 37. [Google Scholar] [CrossRef]
- Yin, H.; Jiang, M.; Peng, X.; Cui, H.; Zhou, Y.; He, M.; Fang, J. The molecular mechanism of G2/M cell cycle arrest induced by AFB1 in the jejunum. Oncotarget 2016, 7, 35592. [Google Scholar] [CrossRef]
- Yang, X.; Zhang, Z.; Wang, X.; Wang, Y.; Zhang, X.; Lu, H.; Wang, S.L. Cytochrome P450 2A13 enhances the sensitivity of human bronchial epithelial cells to aflatoxin B1-induced DNA damage. Toxicol. Appl. Pharmacol. 2013, 270, 114–121. [Google Scholar] [CrossRef]
- Jin, M.H.; Oh, D.Y. ATM in DNA repair in cancer. Pharmacol. Ther. 2019, 203, 107391. [Google Scholar] [CrossRef]
- Moyal, L.; Lerenthal, Y.; Gana-Weisz, M.; Mass, G.; So, S.; Wang, S.Y.; Shiloh, Y. Requirement of ATM-dependent monoubiquitylation of histone H2B for timely repair of DNA double-strand breaks. Mol. Cell 2011, 41, 529–542. [Google Scholar] [CrossRef]
- Chernikova, S.B.; Razorenova, O.V.; Higgins, J.P.; Sishc, B.J.; Nicolau, M.; Dorth, J.A.; Brown, J.M. Deficiency in mammalian histone H2B ubiquitin ligase Bre1 (Rnf20/Rnf40) leads to replication stress and chromosomal instability. Cancer Res. 2012, 72, 2111–2119. [Google Scholar] [CrossRef]
- Kari, V.; Shchebet, A.; Neumann, H.; Johnsen, S.A. The H2B ubiquitin ligase RNF40 cooperates with SUPT16H to induce dynamic changes in chromatin structure during DNA double-strand break repair. Cell Cycle 2011, 10, 3495–3504. [Google Scholar] [CrossRef] [PubMed]
- Zhang, F.; Paramasivam, M.; Cai, Q.; Dai, X.; Wang, P.; Lin, K.; Wang, Y. Arsenite binds to the RING finger domains of RNF20-RNF40 histone E3 ubiquitin ligase and inhibits DNA double-strand break repair. J. Am. Chem. Soc. 2014, 136, 12884–12887. [Google Scholar] [CrossRef] [PubMed]
- Engin, A.B.; Engin, A. DNA damage checkpoint response to aflatoxin B1. Environ. Toxicol. Pharmacol. 2019, 65, 90–96. [Google Scholar] [CrossRef] [PubMed]
- Monson, M.S.; Cardona, C.J.; Coulombe, R.A.; Reed, K.M. Hepatic transcriptome responses of domesticated and wild turkey embryos to aflatoxin B1. Toxins 2016, 8, 16. [Google Scholar] [CrossRef] [PubMed]
- Lavin, M.F.; Kozlov, S. ATM activation and DNA damage response. Cell Cycle 2007, 6, 931–942. [Google Scholar] [CrossRef] [PubMed]
- Hu, P.; Zuo, Z.; Wang, F.; Peng, X.; Guan, K.; Li, H.; Zhou, Y. The protective role of selenium in AFB1-Induced tissue damage and cell cycle arrest in chicken’s bursa of fabricius. Biol. Trace Elem. Res. 2018, 185, 486–496. [Google Scholar] [CrossRef]
- Li, H.; Guan, K.; Zuo, Z.; Wang, F.; Peng, X.; Fang, J.; Chen, Z. Effects of aflatoxin B1 on the cell cycle distribution of splenocytes in chickens. J. Toxicol. Pathol. 2019, 32, 27–36. [Google Scholar] [CrossRef]
- Helmink, B.A.; Sleckman, B.P. The response to and repair of RAG-mediated DNA double-strand breaks. Annu. Rev. Immunol. 2012, 30, 175–202. [Google Scholar] [CrossRef]
- Nussenzweig, A.; Nussenzweig, M.C. Origin of chromosomal translocations in lymphoid cancer. Cell 2010, 141, 27–38. [Google Scholar] [CrossRef]
- Matei, I.R.; Guidos, C.J.; Danska, J.S. ATM-dependent DNA damage surveillance in T-cell development and leukemogenesis: The DSB connection. Immunol. Rev. 2006, 209, 142–158. [Google Scholar] [CrossRef]
- Jeggo, P.A.; Lobrich, M. Artemis links ATM to double strand break rejoining. Cell Cycle 2005, 4, 359–362. [Google Scholar] [CrossRef]
- Rivera-Munoz, P.; Abramowski, V.; Jacquot, S.; André, P.; Charrier, S.; Lipson-Ruffert, K.; De Villartay, J. Lymphopoiesis in transgenic mice over-expressing Artemis. Gene Ther. 2016, 23, 176–186. [Google Scholar] [CrossRef]
- Multhaup, M.; Karlen, A.D.; Swanson, D.L.; Wilber, A.; Somia, N.V.; Cowan, M.J.; McIvor, R.S. Cytotoxicity associated with artemis overexpression after lentiviral vector-mediated gene transfer. Hum. Gene Ther. 2010, 21, 865–875. [Google Scholar] [CrossRef]
- Sridharan, D.M.; Whalen, M.K.; Almendrala, D.; Cucinotta, F.A.; Kawahara, M.; Yannone, S.M.; Pluth, J.M. Increased Artemis levels confer radioresistance to both high and low LET radiation exposures. Radiat. Oncol. 2012, 7, 96. [Google Scholar] [CrossRef]
- Ulus-Senguloglu, G.; Arlett, C.F.; Plowman, P.N.; Parnell, J.; Patel, N.; Bourton, E.C.; Parris, C.N. Elevated expression of artemis in human fibroblast cells is associated with cellular radiosensitivity and increased apoptosis. Br. J. Cancer 2012, 107, 1506–1513. [Google Scholar] [CrossRef]
- Prusinkiewicz, M.A.; Mymryk, J.S. Metabolic reprogramming of the host cell by human adenovirus infection. Viruses 2019, 11, 141. [Google Scholar] [CrossRef]
- Wang, Y.; Zhao, M.; Cui, J.; Wu, X.; Li, Y.; Wu, W.; Zhang, X. Ochratoxin A induces reprogramming of glucose metabolism by switching energy metabolism from oxidative phosphorylation to glycolysis in human gastric epithelium GES-1 cells in vitro. Toxicol. Lett. 2020, 333, 232–241. [Google Scholar] [CrossRef]
- Zhao, M.; Wang, Y.; Jia, X.; Liu, W.; Zhang, X.; Cui, J. The effect of ochratoxin A on cytotoxicity and glucose metabolism in human esophageal epithelium Het-1A cells. Toxicon 2021, 198, 80–92. [Google Scholar] [CrossRef]
- Zhang, L.; Ye, Y.; An, Y.; Tian, Y.; Wang, Y.; Tang, H. Systems responses of rats to aflatoxin B1 exposure revealed with metabonomic changes in multiple biological matrices. J. Proteome Res. 2011, 10, 614–623. [Google Scholar] [CrossRef]
- Lai, P.S.; Cheah, P.Y.; Kadam, P.; Chua, C.L.M.; Lie, D.K.H.; Li, H.H.; Lee, A.S.G. Overexpression of RB1 transcript is significantly correlated with 13q14 allelic imbalance in colorectal carcinomas. Int. J. Cancer 2006, 119, 1061–1066. [Google Scholar] [CrossRef]
- Wu, Q.; Deblois, G.; Cruickshank, J.; Duan, S.; Lima-Fernandes, E.; Haight, J.; Arrowsmith, C.H. GLUT1 inhibition blocks growth of RB1-positive triple negative breast cancer. Nat. Commun. 2020, 11, 4205. [Google Scholar] [CrossRef] [PubMed]
- Poulain, L.; Sujobert, P.; Zylbersztejn, F.; Barreau, S.; Stuani, L.; Lambert, M.; Chapuis, N. High mTORC1 activity drives glycolysis addiction and sensitivity to G6PD inhibition in acute myeloid leukemia cells. Leukemia 2017, 31, 2326–2335. [Google Scholar] [CrossRef] [PubMed]
- Søderstrøm, S.; Lie, K.K.; Lundebye, A.K.; Søfteland, L. Beauvericin (BEA) and enniatin B (ENNB)-induced impairment of mitochondria and lysosomes-Potential sources of intracellular reactive iron triggering ferroptosis in Atlantic salmon primary hepatocytes. Food Chem. Toxicol. 2022, 161, 112819. [Google Scholar] [CrossRef] [PubMed]
- Hundhausen, C.; Boesch-Saadatmandi, C.; Matzner, N.; Lang, F.; Blank, R.; Wolffram, S.; Rimbach, G. Ochratoxin a lowers mRNA levels of genes encoding for key proteins of liver cell metabolism. Cancer Genom. Proteom. 2008, 5, 319–332. [Google Scholar]
- Ferguson, E.C.; Rathmell, J.C. New roles for pyruvate kinase M2: Working out the Warburg effect. Trends biochem. Sci. 2008, 33, 359–362. [Google Scholar] [CrossRef]
- Tristan, C.; Shahani, N.; Sedlak, T.W.; Sawa, A. The diverse functions of GAPDH: Views from different subcellular compartments. Cell Signal. 2011, 23, 317–323. [Google Scholar] [CrossRef]
- Karaman, E.F.; Ozden, S. Alterations in global DNA methylation and metabolism-related genes caused by zearalenone in MCF7 and MCF10F cells. Mycotoxin Res. 2019, 35, 309–320. [Google Scholar] [CrossRef]
- Xian, Z.Y.; Liu, J.M.; Chen, Q.K.; Chen, H.Z.; Ye, C.J.; Xue, J.; Kuang, S.J. Inhibition of LDHA suppresses tumor progression in prostate cancer. Tumor Biol. 2015, 36, 8093–8100. [Google Scholar] [CrossRef]
- Abdul, N.S.; Nagiah, S.; Chuturgoon, A.A. The neglected foodborne mycotoxin Fusaric acid induces bioenergetic adaptations by switching energy metabolism from mitochondrial processes to glycolysis in a human liver (HepG2) cell line. Toxicol. Lett. 2020, 318, 74–85. [Google Scholar] [CrossRef]
- Feng, J.; Dai, W.; Mao, Y.; Wu, L.; Li, J.; Chen, K.; Guo, C. Simvastatin re-sensitizes hepatocellular carcinoma cells to sorafenib by inhibiting HIF-1α/PPAR-γ/PKM2-mediated glycolysis. J. Exp. Clin. Cancer Res. 2020, 39, 24. [Google Scholar] [CrossRef]
- Prigione, A.; Rohwer, N.; Hoffmann, S.; Mlody, B.; Drews, K.; Bukowiecki, R.; Adjaye, J. HIF1 α Modulates Cell Fate Reprogramming Through Early Glycolytic Shift and Upregulation of PDK1–3 and PKM2. Stem Cells 2014, 32, 364–376. [Google Scholar] [CrossRef]
- Suhara, T.; Hishiki, T.; Kasahara, M.; Hayakawa, N.; Oyaizu, T.; Nakanishi, T.; Minamishima, Y.A. Inhibition of the oxygen sensor PHD2 in the liver improves survival in lactic acidosis by activating the Cori cycle. Proc. Natl. Acad. Sci. USA 2015, 112, 11642–11647. [Google Scholar] [CrossRef]
- Chen, X.; Kang, R.; Kroemer, G.; Tang, D. Ferroptosis in infection, inflammation, and immunity. J. Exp. Med. 2021, 218, e20210518. [Google Scholar] [CrossRef]
- Shi, Z.Z.; Fan, Z.W.; Chen, Y.X.; Xie, X.F.; Jiang, W.; Wang, W.J.; Bai, J. Ferroptosis in carcinoma: Regulatory mechanisms and new method for cancer therapy. OncoTargets Ther. 2019, 12, 11291. [Google Scholar] [CrossRef]
- Zhao, L.; Feng, Y.; Xu, Z.J.; Zhang, N.Y.; Zhang, W.P.; Zuo, G.; Sun, L.H. Selenium mitigated aflatoxin B1-induced cardiotoxicity with potential regulation of 4 selenoproteins and ferroptosis signaling in chicks. Food Chem. Toxicol. 2021, 154, 112320. [Google Scholar] [CrossRef]
- Ding, H.; Chen, S.; Pan, X.; Dai, X.; Pan, G.; Li, Z.; Xie, L. Transferrin receptor 1 ablation in satellite cells impedes skeletal muscle regeneration through activation of ferroptosis. J. Cachexia Sarcopenia Muscle 2021, 12, 746–768. [Google Scholar] [CrossRef]
- Lin, J.; Huang, F.; Liang, T.; Qin, Q.; Xu, Q.; Huang, X.; Liu, Y. EPA and DHA confer protection against deoxynivalenol-induced endoplasmic reticulum stress and iron imbalance in IPEC-1 cells. Br. J. Nutr. 2021, 128, 161–171. [Google Scholar] [CrossRef]
- Nishizawa, H.; Matsumoto, M.; Shindo, T.; Saigusa, D.; Kato, H.; Suzuki, K.; Igarashi, K. Ferroptosis is controlled by the coordinated transcriptional regulation of glutathione and labile iron metabolism by the transcription factor BACH1. J. Biol. Chem. 2020, 295, 69–82. [Google Scholar] [CrossRef]
- Xie, Y.; Hou, W.; Song, X.; Yu, Y.; Huang, J.; Sun, X.; Tang, D. Ferroptosis: Process and function. Cell Death Differ. 2016, 23, 369–379. [Google Scholar] [CrossRef]
- Au, C.; Benedetto, A.; Aschner, M. Manganese transport in eukaryotes: The role of DMT1. Neurotoxicology 2008, 29, 569–576. [Google Scholar] [CrossRef]
- He, Y.J.; Liu, X.Y.; Xing, L.; Wan, X.; Chang, X.; Jiang, H.L. Fenton reaction-independent ferroptosis therapy via glutathione and iron redox couple sequentially triggered lipid peroxide generator. Biomaterials 2020, 241, 119911. [Google Scholar] [CrossRef] [PubMed]
- Lee, J.Y.; Kim, W.K.; Bae, K.H.; Lee, S.C.; Lee, E.W. Lipid metabolism and ferroptosis. Biology 2021, 10, 184. [Google Scholar] [CrossRef] [PubMed]
- Magtanong, L.; Ko, P.J.; To, M.; Cao, J.Y.; Forcina, G.C.; Tarangelo, A.; Dixon, S.J. Exogenous monounsaturated fatty acids promote a ferroptosis-resistant cell state. Cell Chem. Biol. 2019, 26, 420–432. [Google Scholar] [CrossRef] [PubMed]
- Wang, G.; Qin, S.; Zheng, Y.; Xia, C.; Zhang, P.; Zhang, L.; Deng, L. T-2 Toxin Induces Ferroptosis by Increasing Lipid Reactive Oxygen Species (ROS) and Downregulating Solute Carrier Family 7 Member 11 (SLC7A11). J. Agric. Food Chem. 2021, 69, 15716–15727. [Google Scholar] [CrossRef] [PubMed]
- Ubellacker, J.M.; Tasdogan, A.; Ramesh, V.; Shen, B.; Mitchell, E.C.; Martin-Sandoval, M.S.; Morrison, S.J. Lymph protects metastasizing melanoma cells from ferroptosis. Nature 2020, 585, 113–118. [Google Scholar] [CrossRef]
- Dixon, S.J.; Stockwell, B.R. The hallmarks of ferroptosis. Annu. Rev. Cancer Biol. 2019, 3, 35–54. [Google Scholar] [CrossRef]
- Matsushita, M.; Freigang, S.; Schneider, C.; Conrad, M.; Bornkamm, G.W.; Kopf, M. T cell lipid peroxidation induces ferroptosis and prevents immunity to infection. J. Exp. Med. 2015, 212, 555–568. [Google Scholar] [CrossRef]
- Gan, F.; Xue, H.; Huang, Y.; Pan, C.; Huang, K. Selenium alleviates porcine nephrotoxicity of ochratoxin A by improving selenoenzyme expression in vitro. PLoS ONE 2015, 10, e0119808. [Google Scholar] [CrossRef]
- Vettorazzi, A.; Pastor, L.; Guruceaga, E.; de Cerain, A.L. Sex-dependent gene expression after ochratoxin A insult in F344 rat kidney. Food Chem. Toxicol. 2019, 123, 337–348. [Google Scholar] [CrossRef]
- Ren, Z.; He, H.; Fan, Y.; Chen, C.; Zuo, Z.; Deng, J. Research progress on the toxic antagonism of selenium against mycotoxins. Biol. Trace Elem. Res. 2019, 190, 273–280. [Google Scholar] [CrossRef]
- Venkatesh, D.; O’Brien, N.A.; Zandkarimi, F.; Tong, D.R.; Stokes, M.E.; Dunn, D.E.; Stockwell, B.R. MDM2 and MDMX promote ferroptosis by PPARα-mediated lipid remodeling. Genes Dev. 2020, 34, 526–543. [Google Scholar] [CrossRef]
- Wernicke, C.M.; Richter, G.H.; Beinvogl, B.C.; Plehm, S.; Schlitter, A.M.; Bandapalli, O.R.; Grunewald, T.G. MondoA is highly overexpressed in acute lymphoblastic leukemia cells and modulates their metabolism, differentiation and survival. Leuk. Res. 2012, 36, 1185–1192. [Google Scholar] [CrossRef]
- Martinez Jimenez, L.A.; Organista Nava, J.; Illades_Aguiar, B.; Leyva Vazquez, M.A.; Gomez Gomez, Y. Terminal Deoxynucleotidyl Transferase in type B Acute Lymphoblastic Leukemia. J. Hum. Anat. Physiol. 2019, 4, 4. [Google Scholar]
- Ülger, T.G.; Uçar, A.; Çakıroğlu, F.P.; Yilmaz, S. Genotoxic effects of mycotoxins. Toxicon 2020, 185, 104–113. [Google Scholar] [CrossRef]
- Yasmineh, W.G.; Smith, B.M.; Bloomfield, C.D. DNA nucleotidylexotransferase of normal persons and leukemic patients. Clin. Chem. 1980, 26, 891–895. [Google Scholar] [CrossRef]


| Gene | FS | RS | E% | R2 |
|---|---|---|---|---|
| 18S rRNA | CGGCTACCACATCCAAGGAA | GCTGGAATTACCGCGGCT | 105 | 0.990 |
| CSTA | AAACCCGCCACTCCAGAAAT | GCACAGCTTCCAATTTTCCGT | 107 | 0.991 |
| DNTT | GCCTCGTCAAAGAGTGGACA | GTCTCTCTCAAACCGGGAGC | 109 | 0.991 |
| Gene Ontology Term | Categories | Set Size | Genes Candidates | p-Value |
|---|---|---|---|---|
| AFB1 exposure | ||||
| GO:0098609 Cell-cell adhesion | BP 3 | 871 | 7 (0.8%) | <0.05 |
| GO:0048731 System development | BP 3 | 4796 | 25 (0.5%) | <0.01 |
| GO:0002684 Regulation of immune system process | BP 4 | 1238 | 9 (0.7%) | <0.05 |
| GO:0004896 Cytokine receptor activity | MF 4 | 97 | 3 (3.1%) | <0.01 |
| GO:0043169 Cation binding | MF 3 | 4346 | 22 (0.5%) | <0.05 |
| GO:0051020 GTPase binding | MF 4 | 388 | 4 (1.0%) | <0.05 |
| GO:0000981 DNA and RNA transcription activity | MF 3 | 1401 | 9 (0.6%) | <0.05 |
| GO:0005496 Steroid binding | MF 3 | 100 | 2 (2.0%) | <0.05 |
| GO:0035579 Plasma membrane | CC 4 | 91 | 2 (2.2%) | <0.05 |
| OTA exposure | ||||
| GO:0046903 Secretion | BP 4 | 1469 | 12 (0.8%) | <0.001 |
| GO:0007596 Blood coagulation | BP 3 | 344 | 5 (1.5%) | <0.01 |
| GO:0007599 Hemostasis | BP 4 | 348 | 5 (1.4%) | <0.01 |
| GO:0006954 Inflammatory response | BP 4 | 842 | 7 (0.8%) | <0.05 |
| GO:0002683 Regulation of immune system process | BP 4 | 468 | 5 (1.1%) | <0.05 |
| GO:0001666 Response to hypoxia | BP 3 | 338 | 4 (1.2%) | <0.05 |
| GO:0051213 Dioxygenase activity | MF 3 | 90 | 2 (2.2%) | <0.05 |
| GO:0004842 Ubiquitin-protein transferase activity | MF 4 | 431 | 4 (0.9%) | <0.05 |
| GO:0016323 Basolateral plasma membrane | CC 3 | 242 | 3 (1.2%) | <0.05 |
| GO:0016021 Integral component of membrane | CC 3 | 5401 | 22 (0.4%) | <0.05 |
| AFB1-OTA exposure | ||||
| GO:0007155 Cell adhesion | BP 2 | 1457 | 48 (3.3%) | <0.001 |
| GO:0001816 Cytokine production | BP 2 | 746 | 20 (2.7%) | <0.01 |
| GO:0030098 Lymphocyte differentiation | BP 4 | 355 | 12 (3.4%) | <0.01 |
| GO:0002684 Regulation of immune system process | BP 4 | 1238 | 30 (2.4%) | <0.01 |
| GO:0001913 T cell cytotoxicity | BP 3 | 50 | 4 (8.0%) | <0.01 |
| GO:0008528 G-protein-coupled peptide receptor activity | MF 4 | 150 | 8 (5.3%) | <0.01 |
| GO:0004896 Cytokine receptor activity | MF 4 | 97 | 9 (9.3%) | <0.001 |
| GO:0019957 C-C chemokine binding | MF 5 | 24 | 3 (12.5%) | <0.01 |
| GO:0042612 MHC class I protein complex | CC 5 | 10 | 2 (20.0%) | <0.01 |
| GO:0072562 Blood microparticle | CC 2 | 148 | 7 (4.7%) | <0.01 |
| GO:0005938 Cell cortex | CC 5 | 304 | 11 (3.6%) | <0.01 |
| GO:0000785 Chromatin | CC 4 | 1231 | 30 (2.4%) | <0.01 |
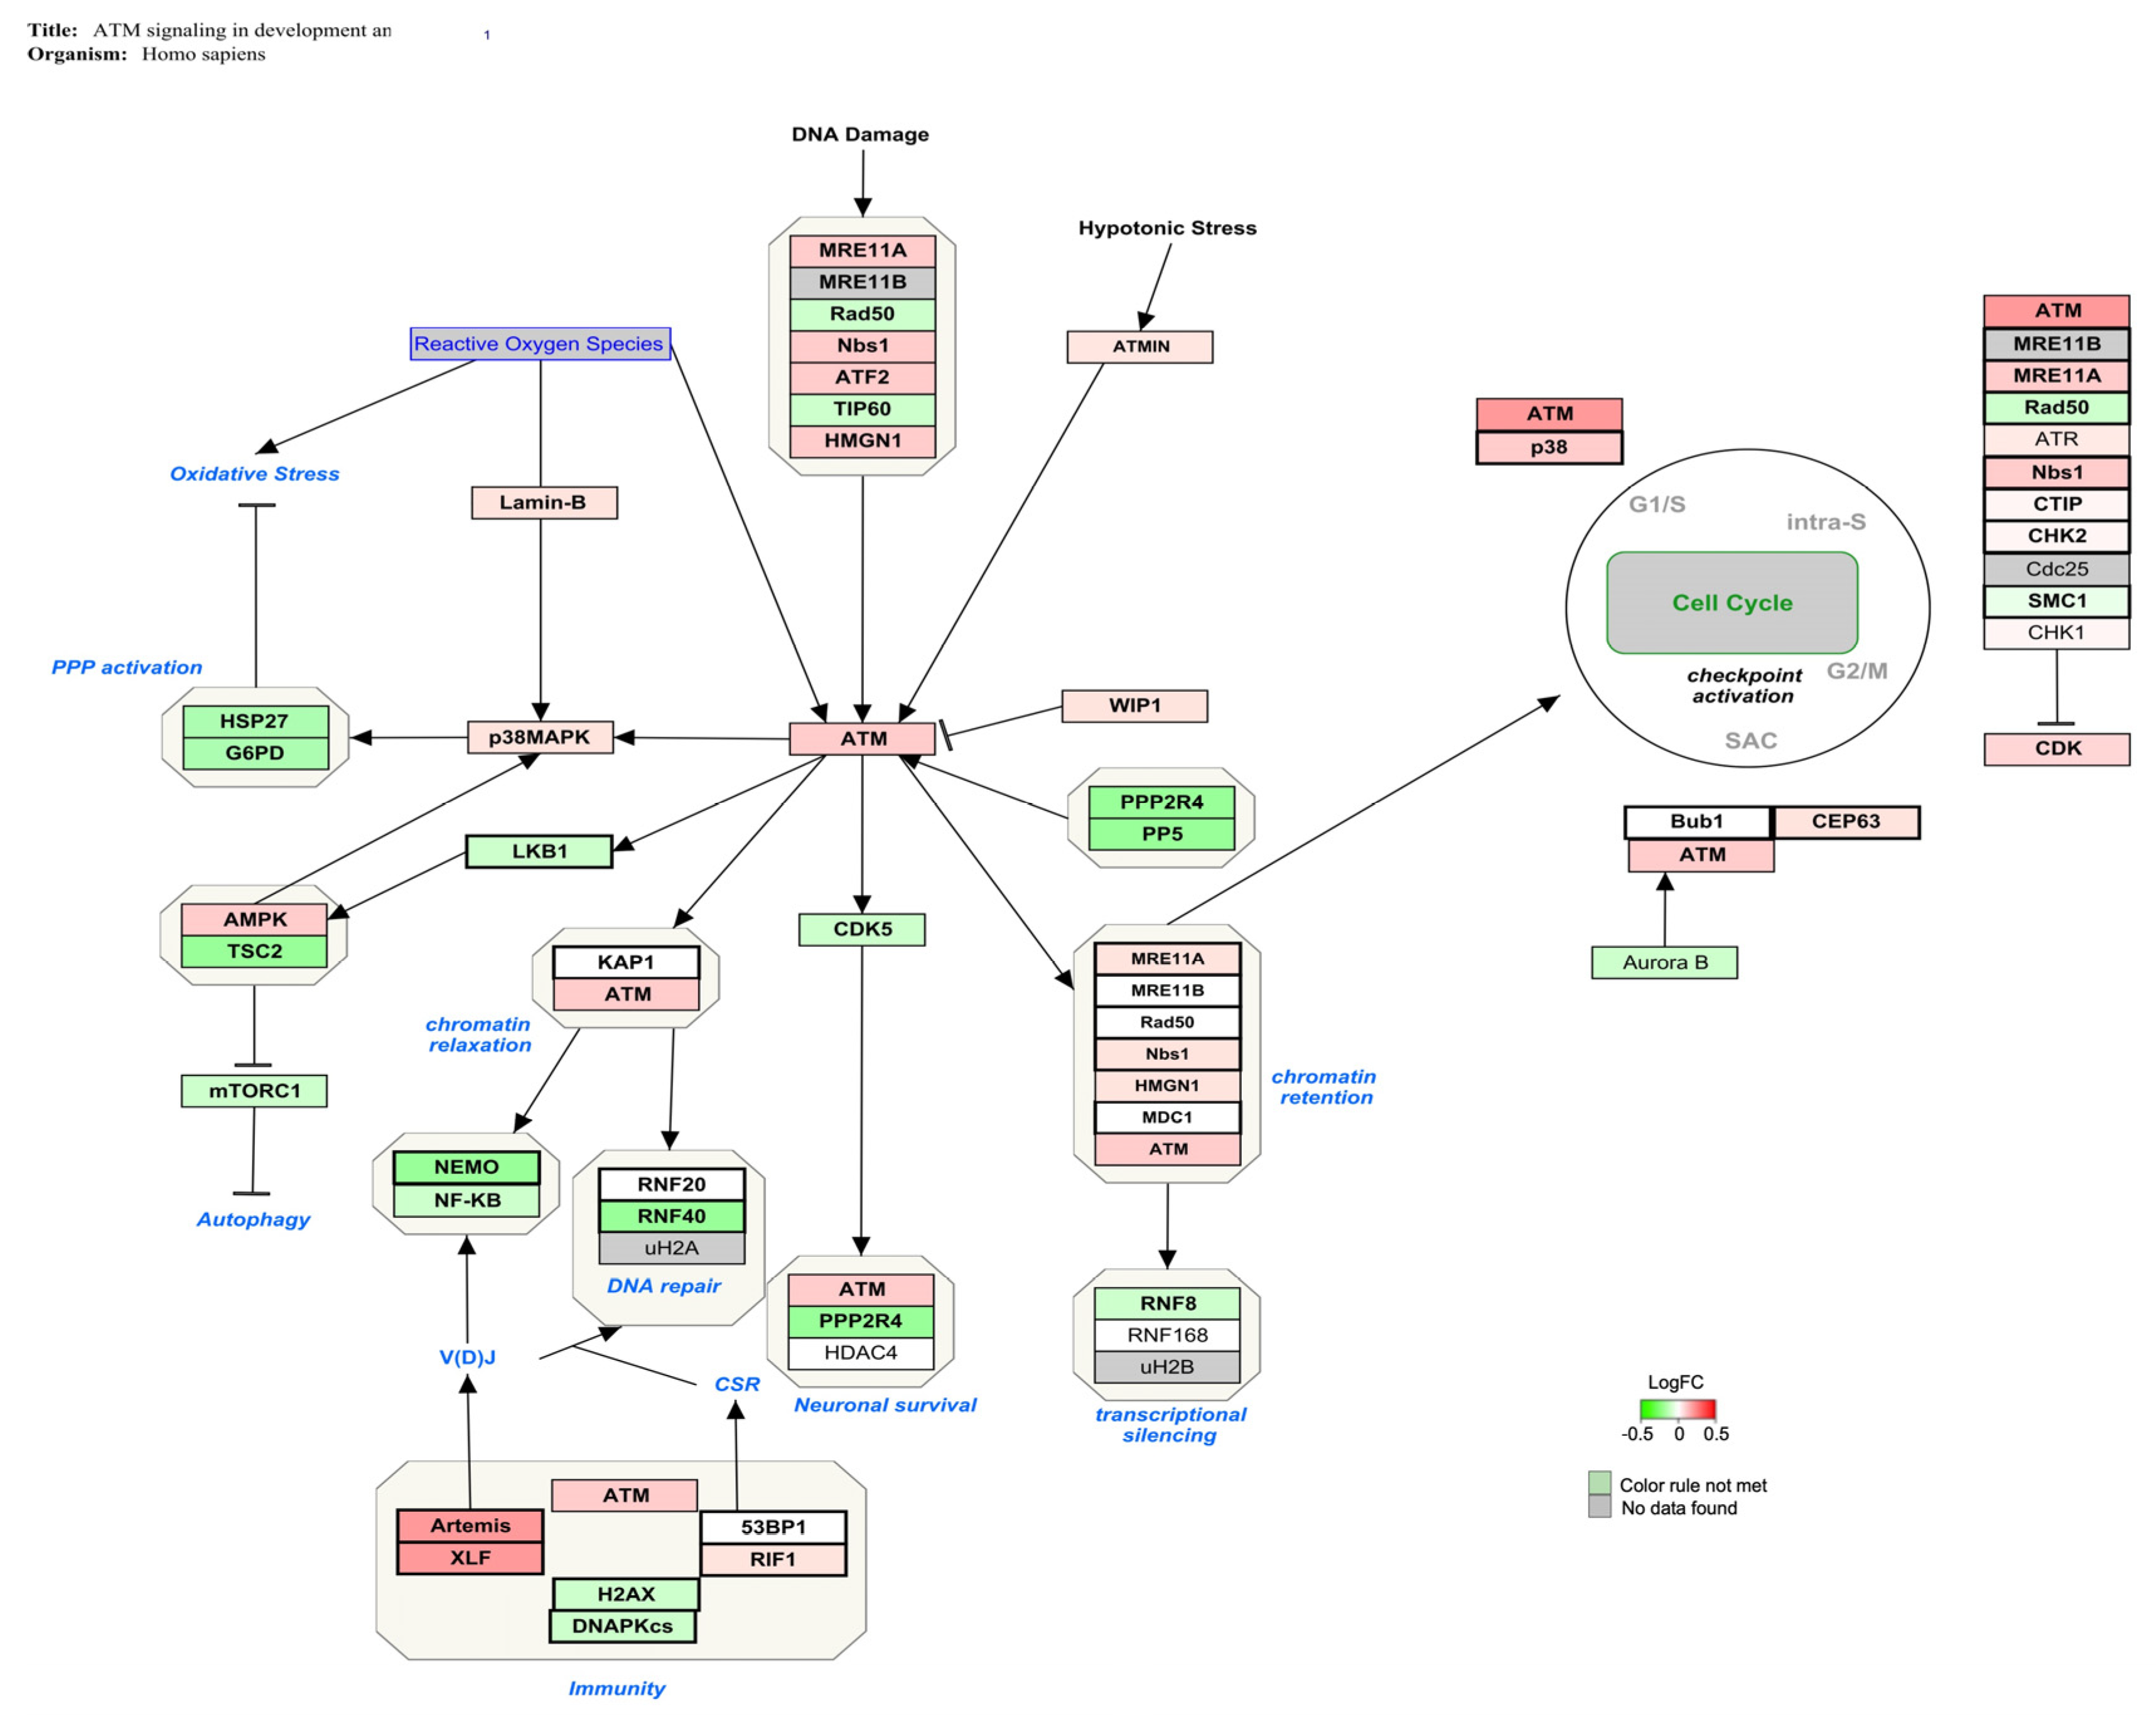
| Pathway | Positive (r) | Measured (n) | Total | % | Z Score | Adj. p-Value |
|---|---|---|---|---|---|---|
| ATM signaling in development and disease | 20 | 44 | 49 | 45 | 4.15 | <0.01 |
| ApoE and miR-146 in inflammation and atherosclerosis | 4 | 5 | 13 | 80 | 3.31 | <0.01 |
| SARS-CoV-2 antagonizes innate immune activation | 5 | 8 | 15 | 62 | 2.96 | <0.01 |
| Mir-124 predicts cell cycle and differentiation | 4 | 6 | 8 | 67 | 2.81 | <0.01 |
| Mitochondrial immune response to SARS-CoV-2 | 8 | 18 | 62 | 44 | 2.54 | <0.05 |
| Activation of NLRP3 inflammasome by SARS-CoV-2 | 2 | 3 | 10 | 67 | 1.99 | <0.05 |
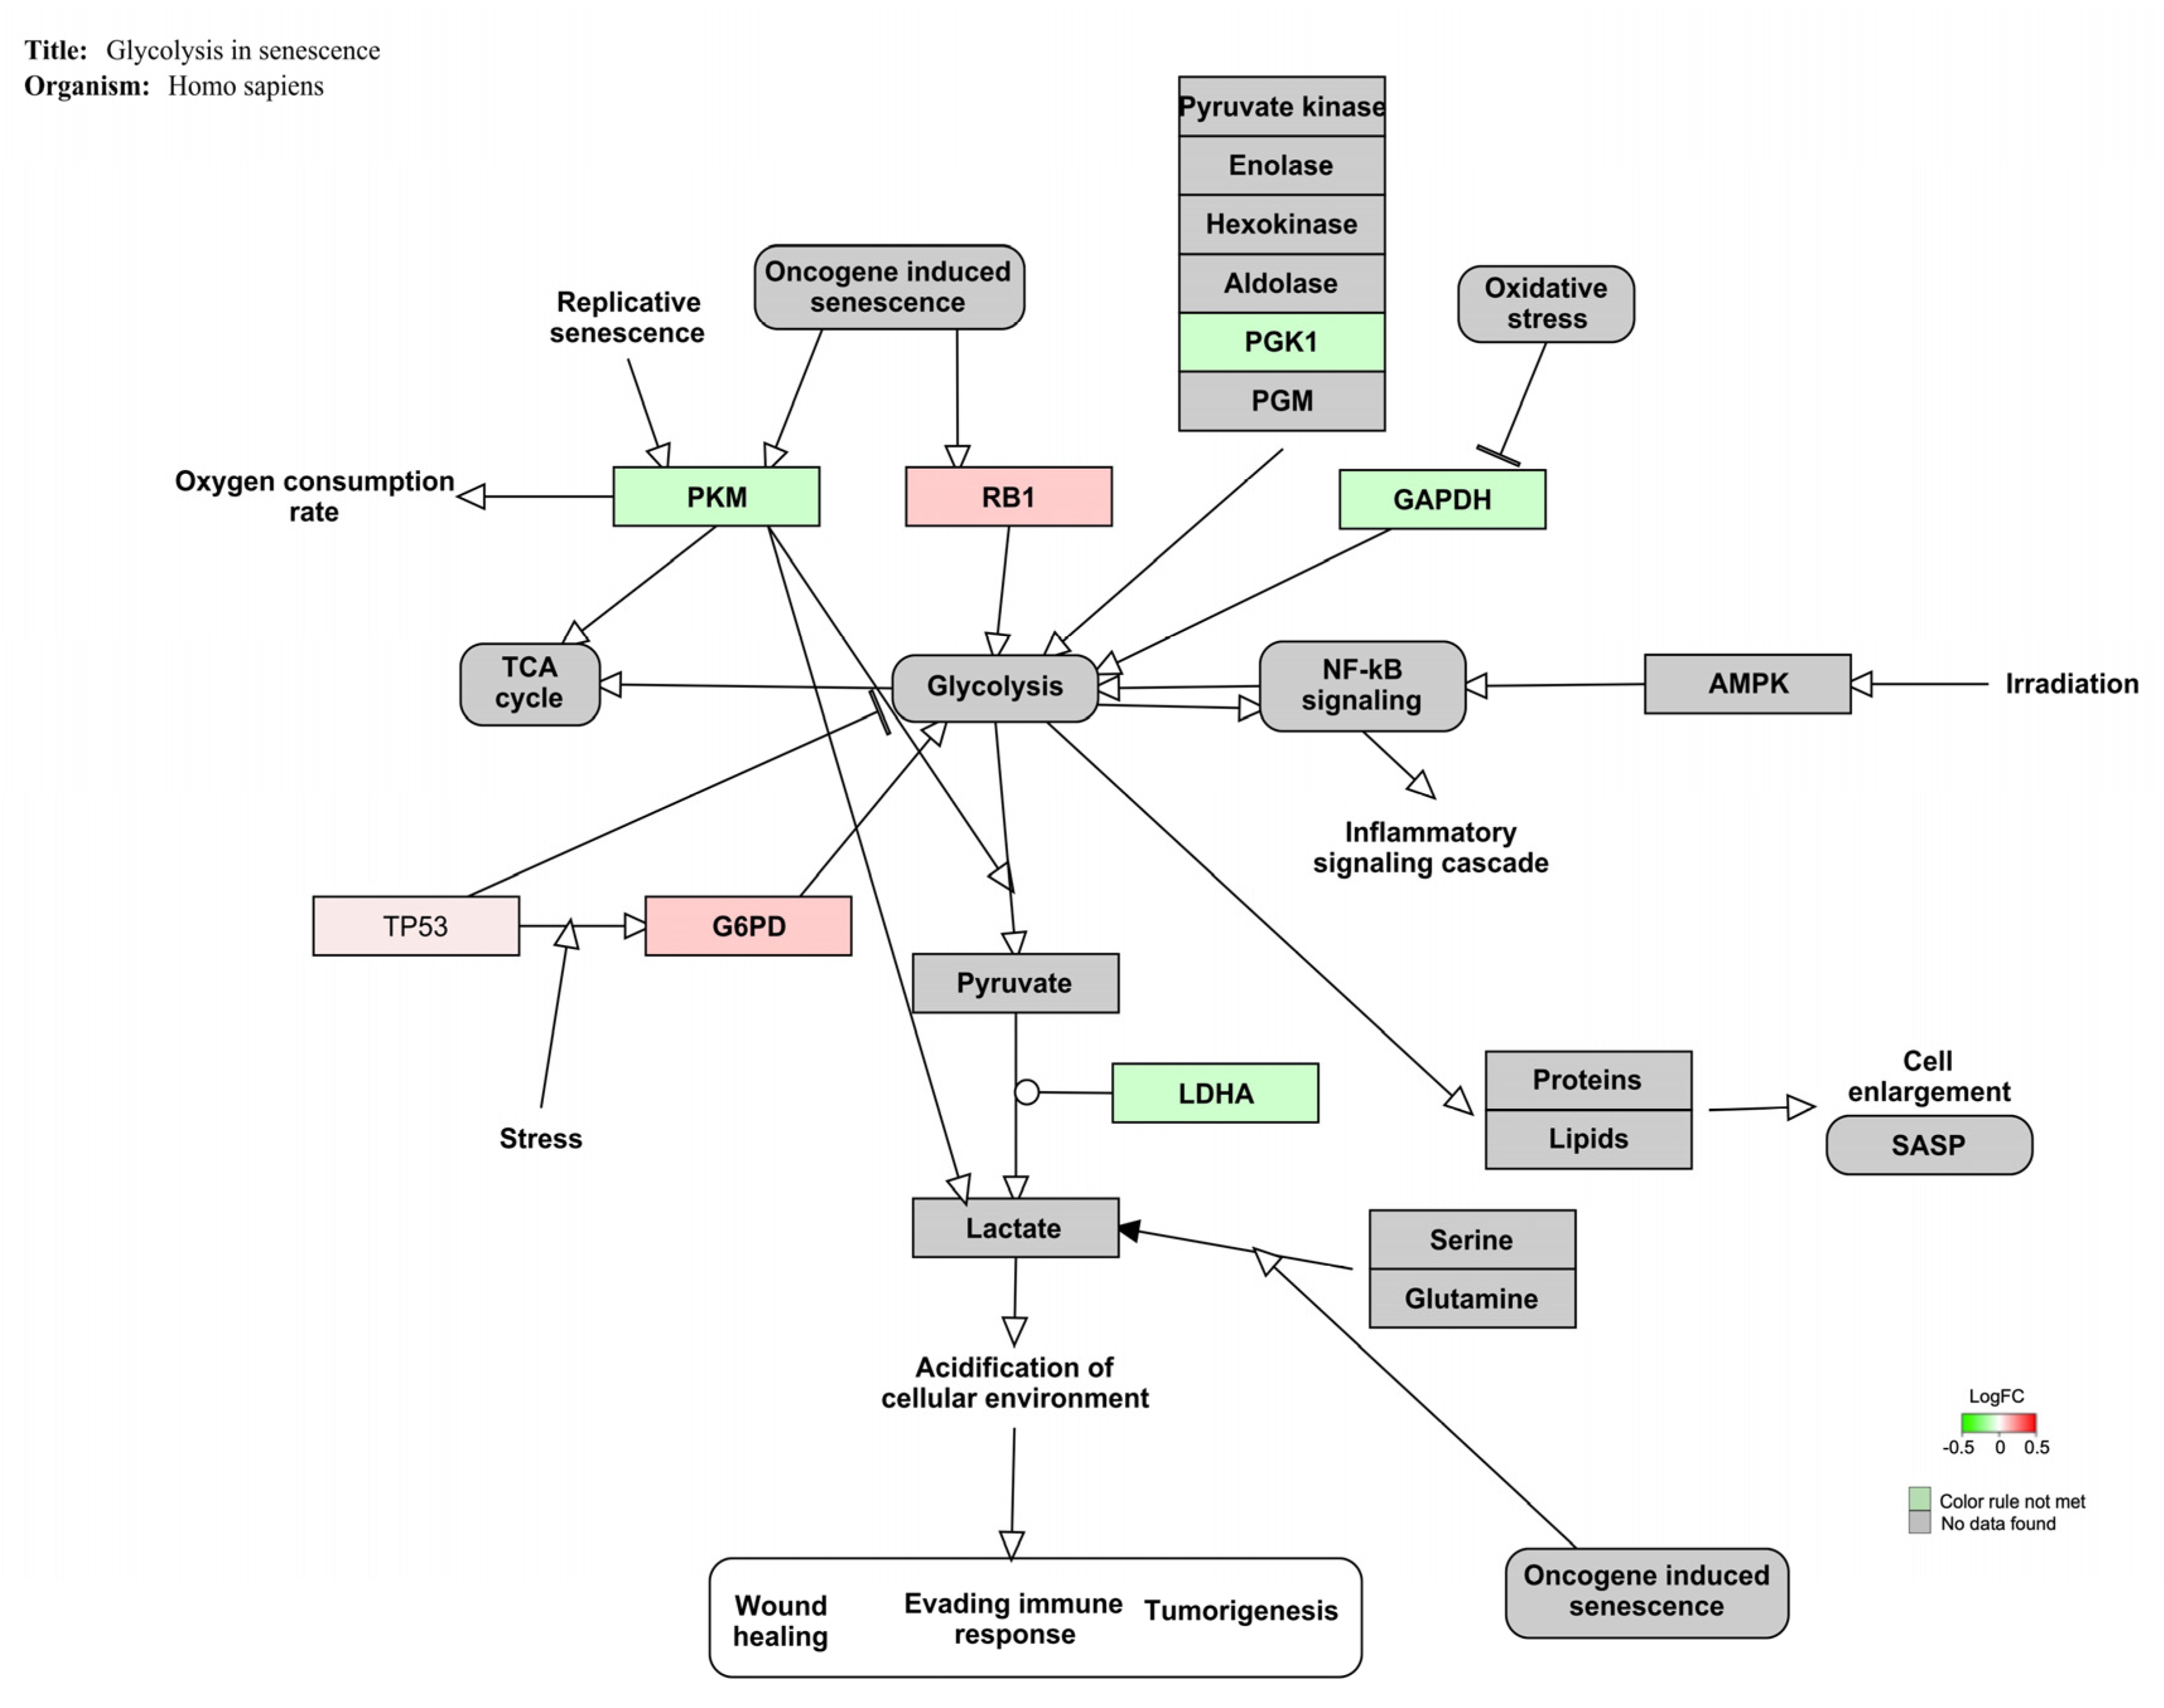
| Pathway | Positive (r) | Measured (n) | Total | % | Z Score | Adj. p-Value |
|---|---|---|---|---|---|---|
| Glycolysis in senescence | 3 | 7 | 26 | 43 | 4.45 | <0.01 |
| Cori cycle | 4 | 12 | 53 | 33 | 4.36 | <0.01 |
| Metabolic reprogramming | 7 | 40 | 80 | 17 | 3.48 | <0.01 |
| HIF1α and PPAR-γ regulation of glycolysis | 2 | 7 | 19 | 29 | 2.76 | <0.05 |
| SARS-CoV-2 antagonizes innate immune activation | 2 | 8 | 15 | 25 | 2.5 | <0.05 |
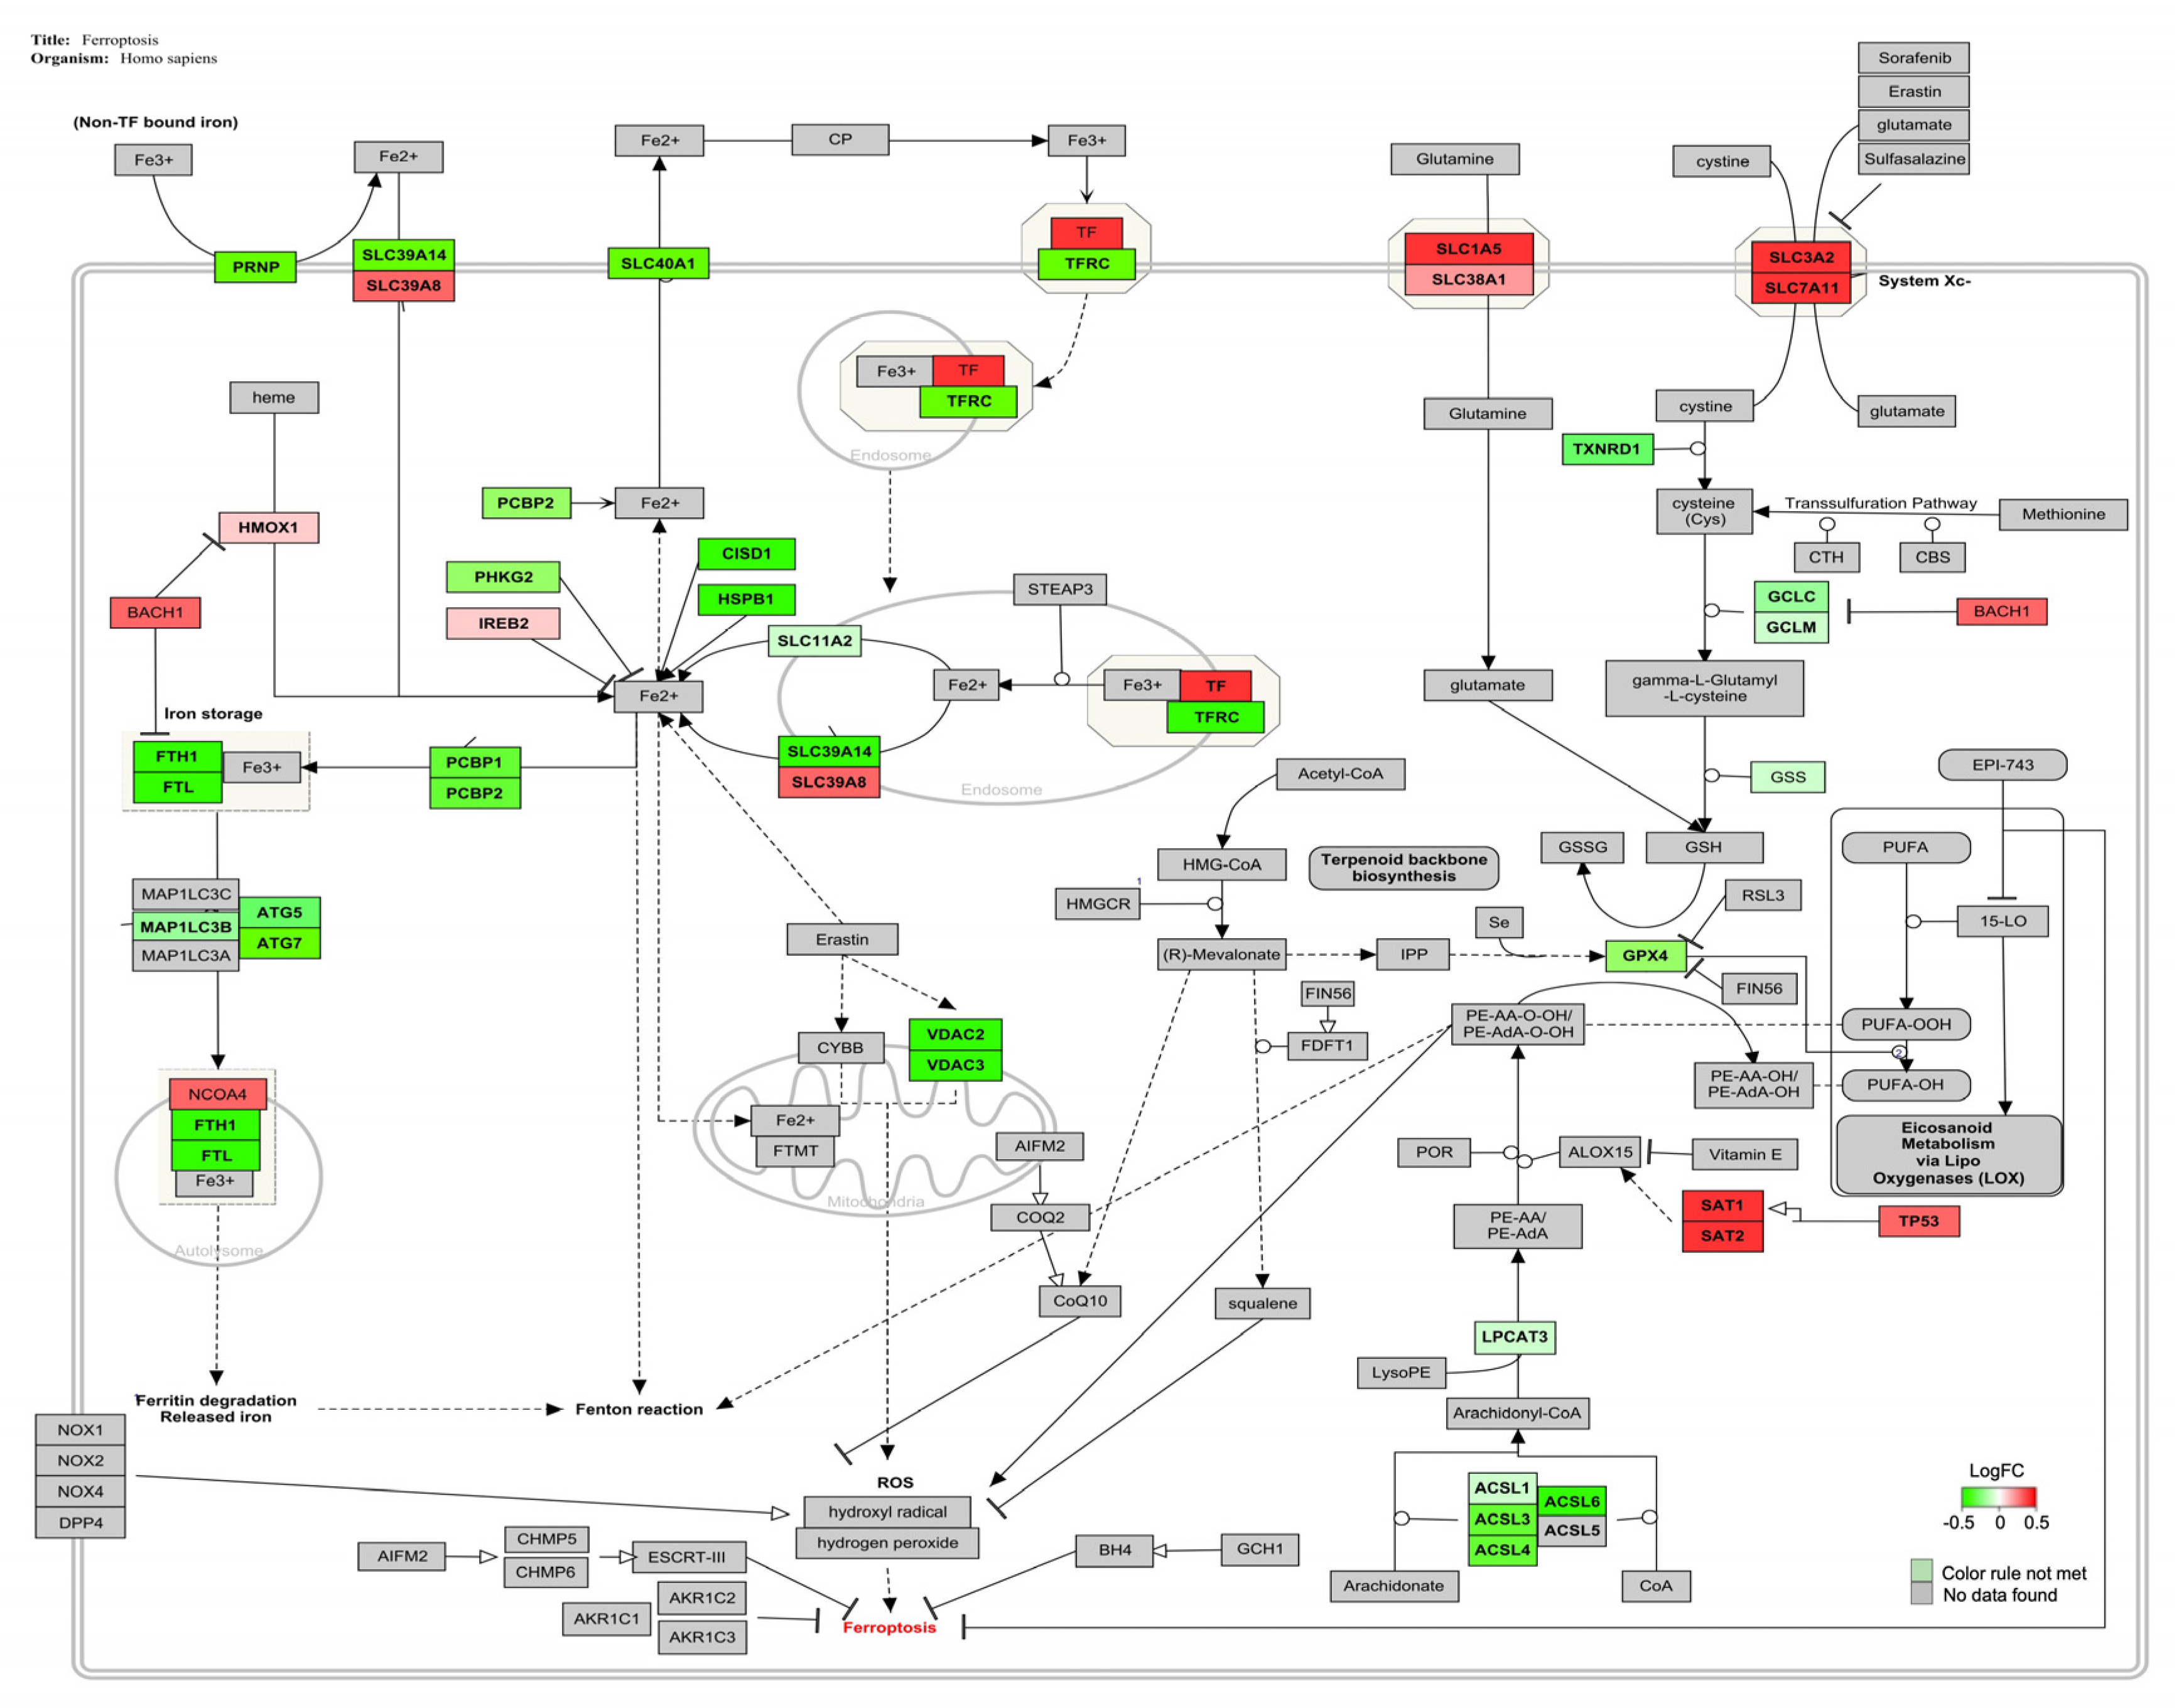
| Pathway | Positive (r) | Measured (n) | Total | % | Z Score | Adj. p-Value |
|---|---|---|---|---|---|---|
| Ferroptosis | 33 | 39 | 88 | 84 | 2.41 | <0.05 |
| PPAR-α pathway | 14 | 15 | 28 | 93 | 2.21 | <0.05 |
| TCA cycle in senescence | 9 | 9 | 30 | 100 | 2.13 | <0.05 |
| Dual hijack model of HIV infection | 8 | 8 | 10 | 100 | 2.01 | <0.01 |
| Familial hyperlipidemia type 1 | 8 | 8 | 35 | 100 | 2.01 | <0.05 |
Disclaimer/Publisher’s Note: The statements, opinions and data contained in all publications are solely those of the individual author(s) and contributor(s) and not of MDPI and/or the editor(s). MDPI and/or the editor(s) disclaim responsibility for any injury to people or property resulting from any ideas, methods, instructions or products referred to in the content. |
© 2023 by the authors. Licensee MDPI, Basel, Switzerland. This article is an open access article distributed under the terms and conditions of the Creative Commons Attribution (CC BY) license (https://creativecommons.org/licenses/by/4.0/).
Share and Cite
Frangiamone, M.; Lozano, M.; Cimbalo, A.; Font, G.; Manyes, L. AFB1 and OTA Promote Immune Toxicity in Human LymphoBlastic T Cells at Transcriptomic Level. Foods 2023, 12, 259. https://doi.org/10.3390/foods12020259
Frangiamone M, Lozano M, Cimbalo A, Font G, Manyes L. AFB1 and OTA Promote Immune Toxicity in Human LymphoBlastic T Cells at Transcriptomic Level. Foods. 2023; 12(2):259. https://doi.org/10.3390/foods12020259
Chicago/Turabian StyleFrangiamone, Massimo, Manuel Lozano, Alessandra Cimbalo, Guillermina Font, and Lara Manyes. 2023. "AFB1 and OTA Promote Immune Toxicity in Human LymphoBlastic T Cells at Transcriptomic Level" Foods 12, no. 2: 259. https://doi.org/10.3390/foods12020259
APA StyleFrangiamone, M., Lozano, M., Cimbalo, A., Font, G., & Manyes, L. (2023). AFB1 and OTA Promote Immune Toxicity in Human LymphoBlastic T Cells at Transcriptomic Level. Foods, 12(2), 259. https://doi.org/10.3390/foods12020259