
Recovery of Functional Proteins from Pig Brain Using pH-Shift Processes


Abstract
:1. Introduction
2. Materials and Methods
2.1. Chemicals
2.2. Collection and Preparation of Pig Brains
2.3. Profiles of Zeta-Potential, Solubility, Colour, and Total Haem Protein Content of Pig Brain Proteins as Affected by pH Adjustment
2.4. Acid and Alkaline pH-Shift Procedures
2.5. Determination of Moisture Content and Dry Matter Yield
2.6. Determination of Total Lipid, Phospholipid, and Haem Protein Contents
2.7. Determination of Colour
2.8. Determination of Hydrophobicity (HBP)
2.9. Determination of Rheological Properties
2.10. Determination of Gelling Properties
2.11. Analyses of Interfacial Properties
2.12. Statistical Analysis
3. Results and Discussion
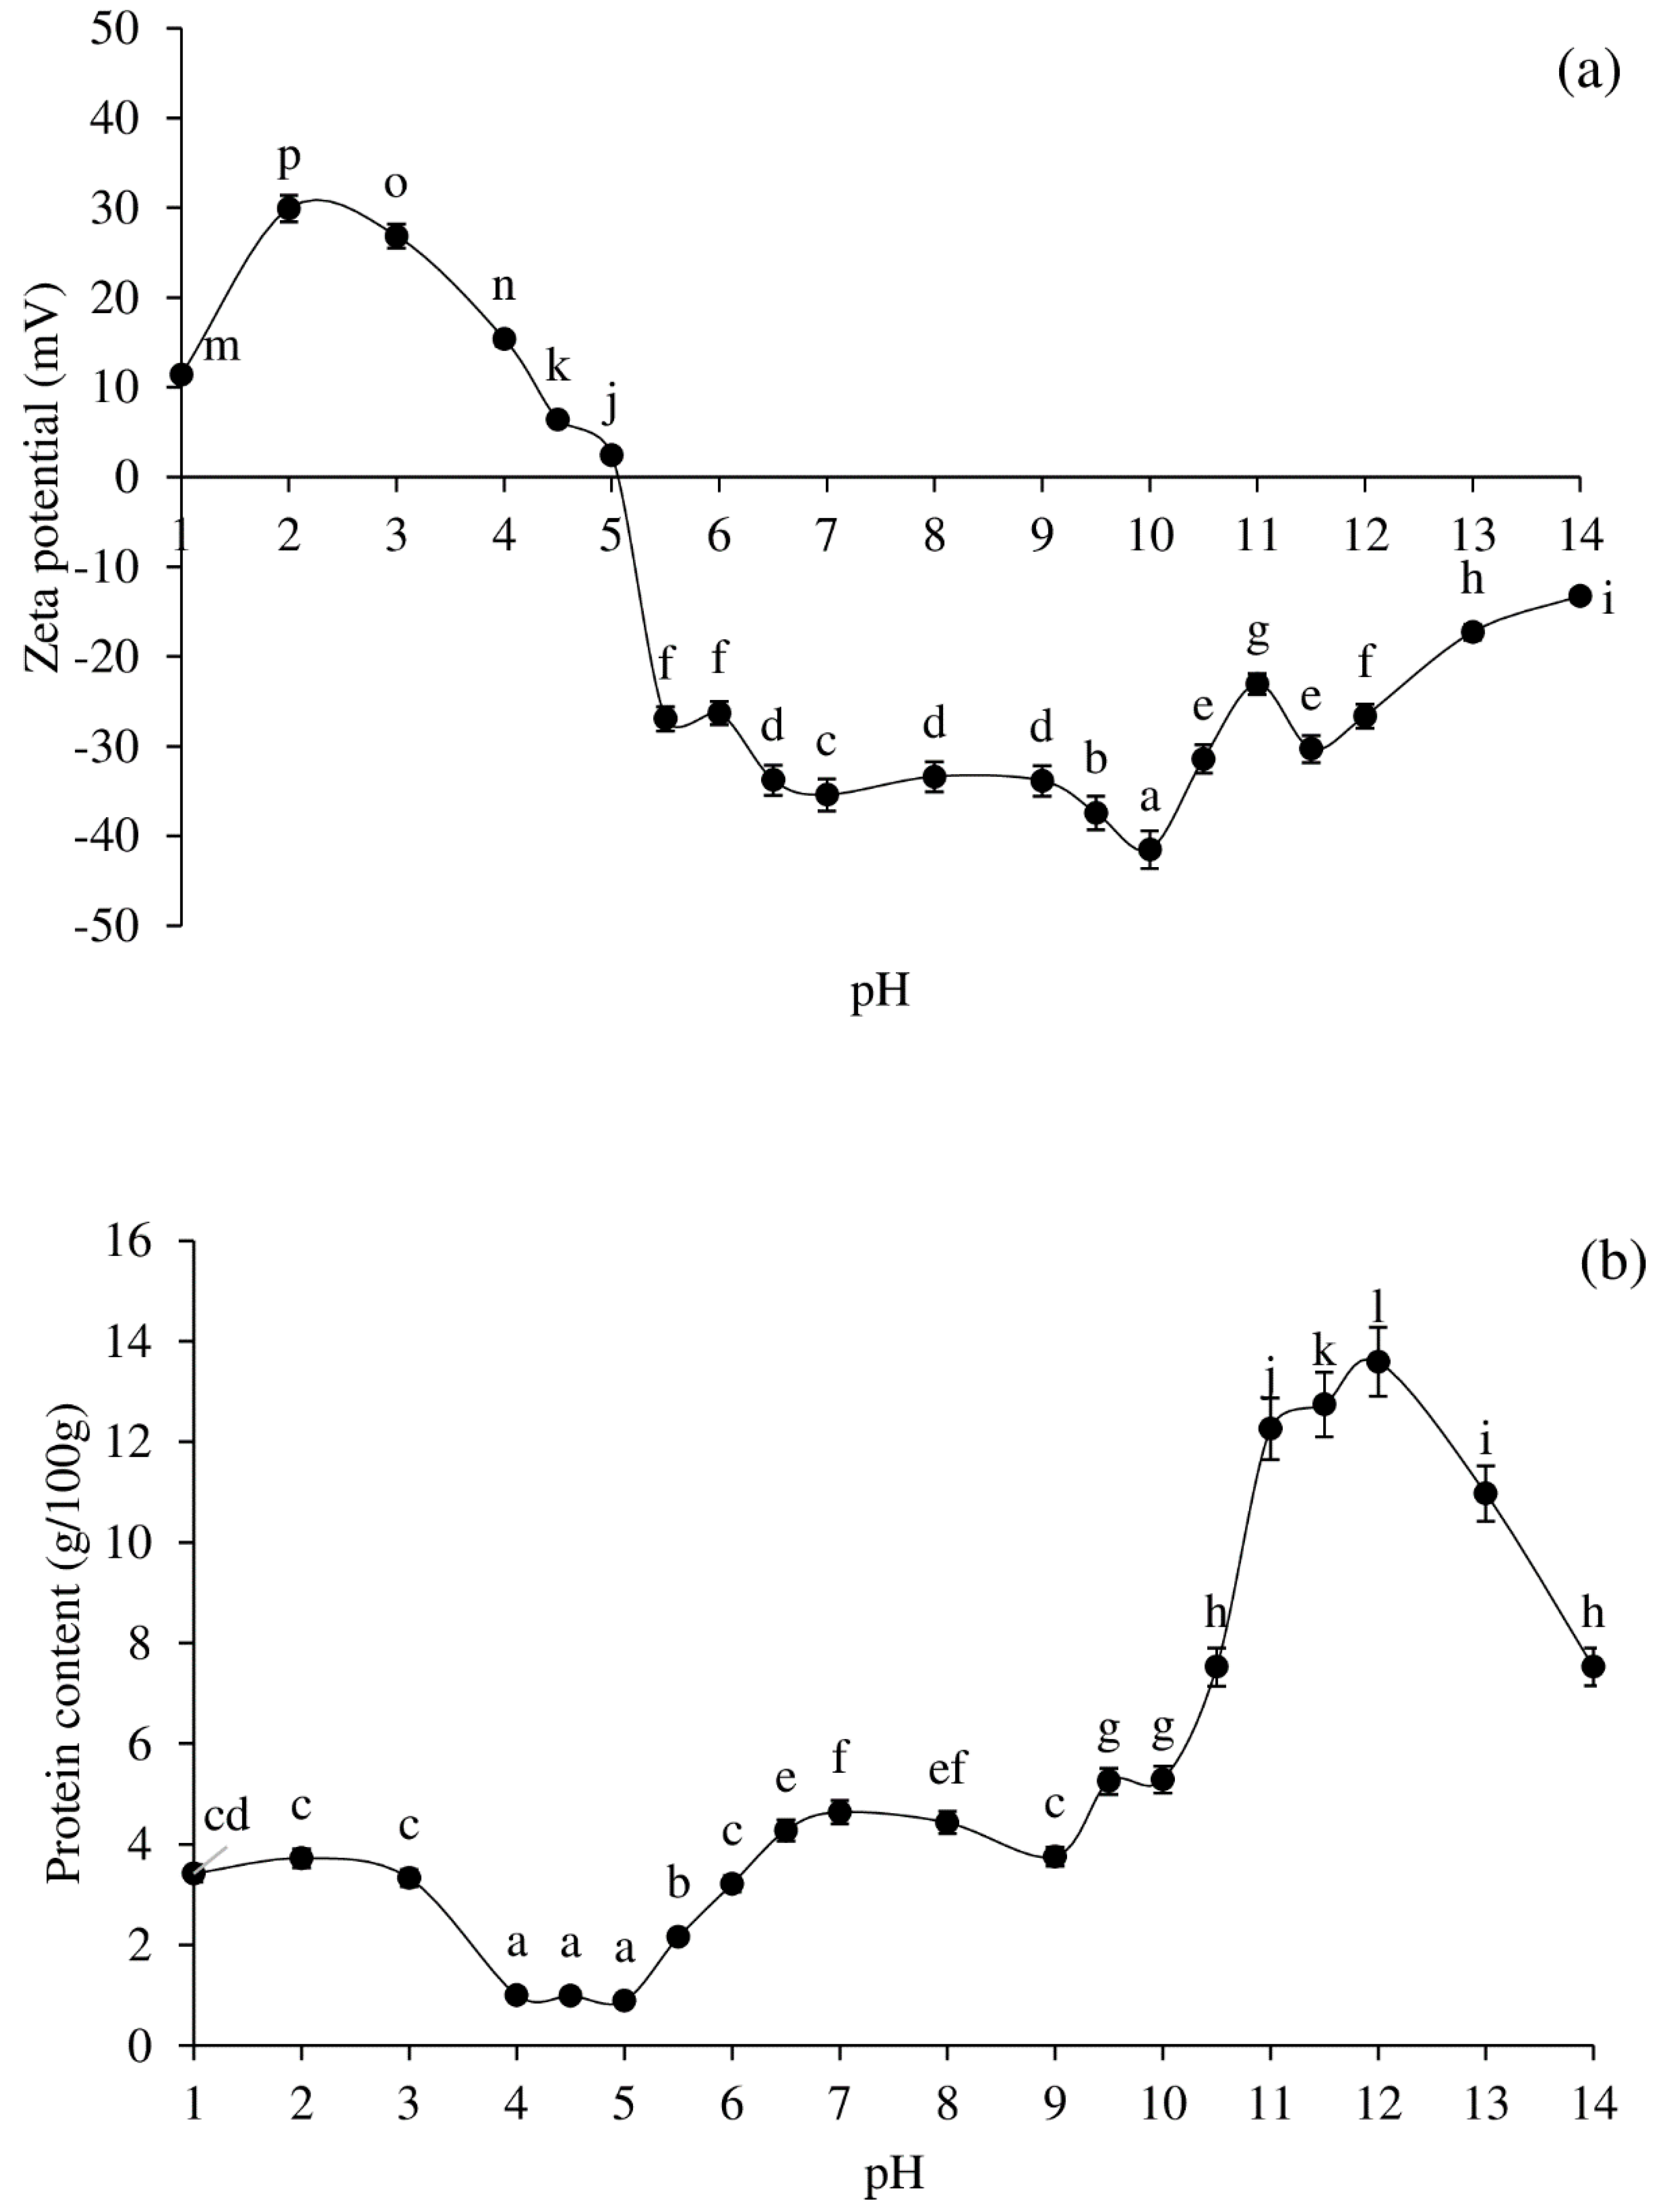
3.1. Zeta-Potential, Solubility, and Colour Profiles of Pig Brain Proteins at Various pHs
3.2. Moisture Content, Dry Matter Yield, and Residual Lipid Content
3.3. Total Haem Protein Content and Colour
3.4. Surface HPB
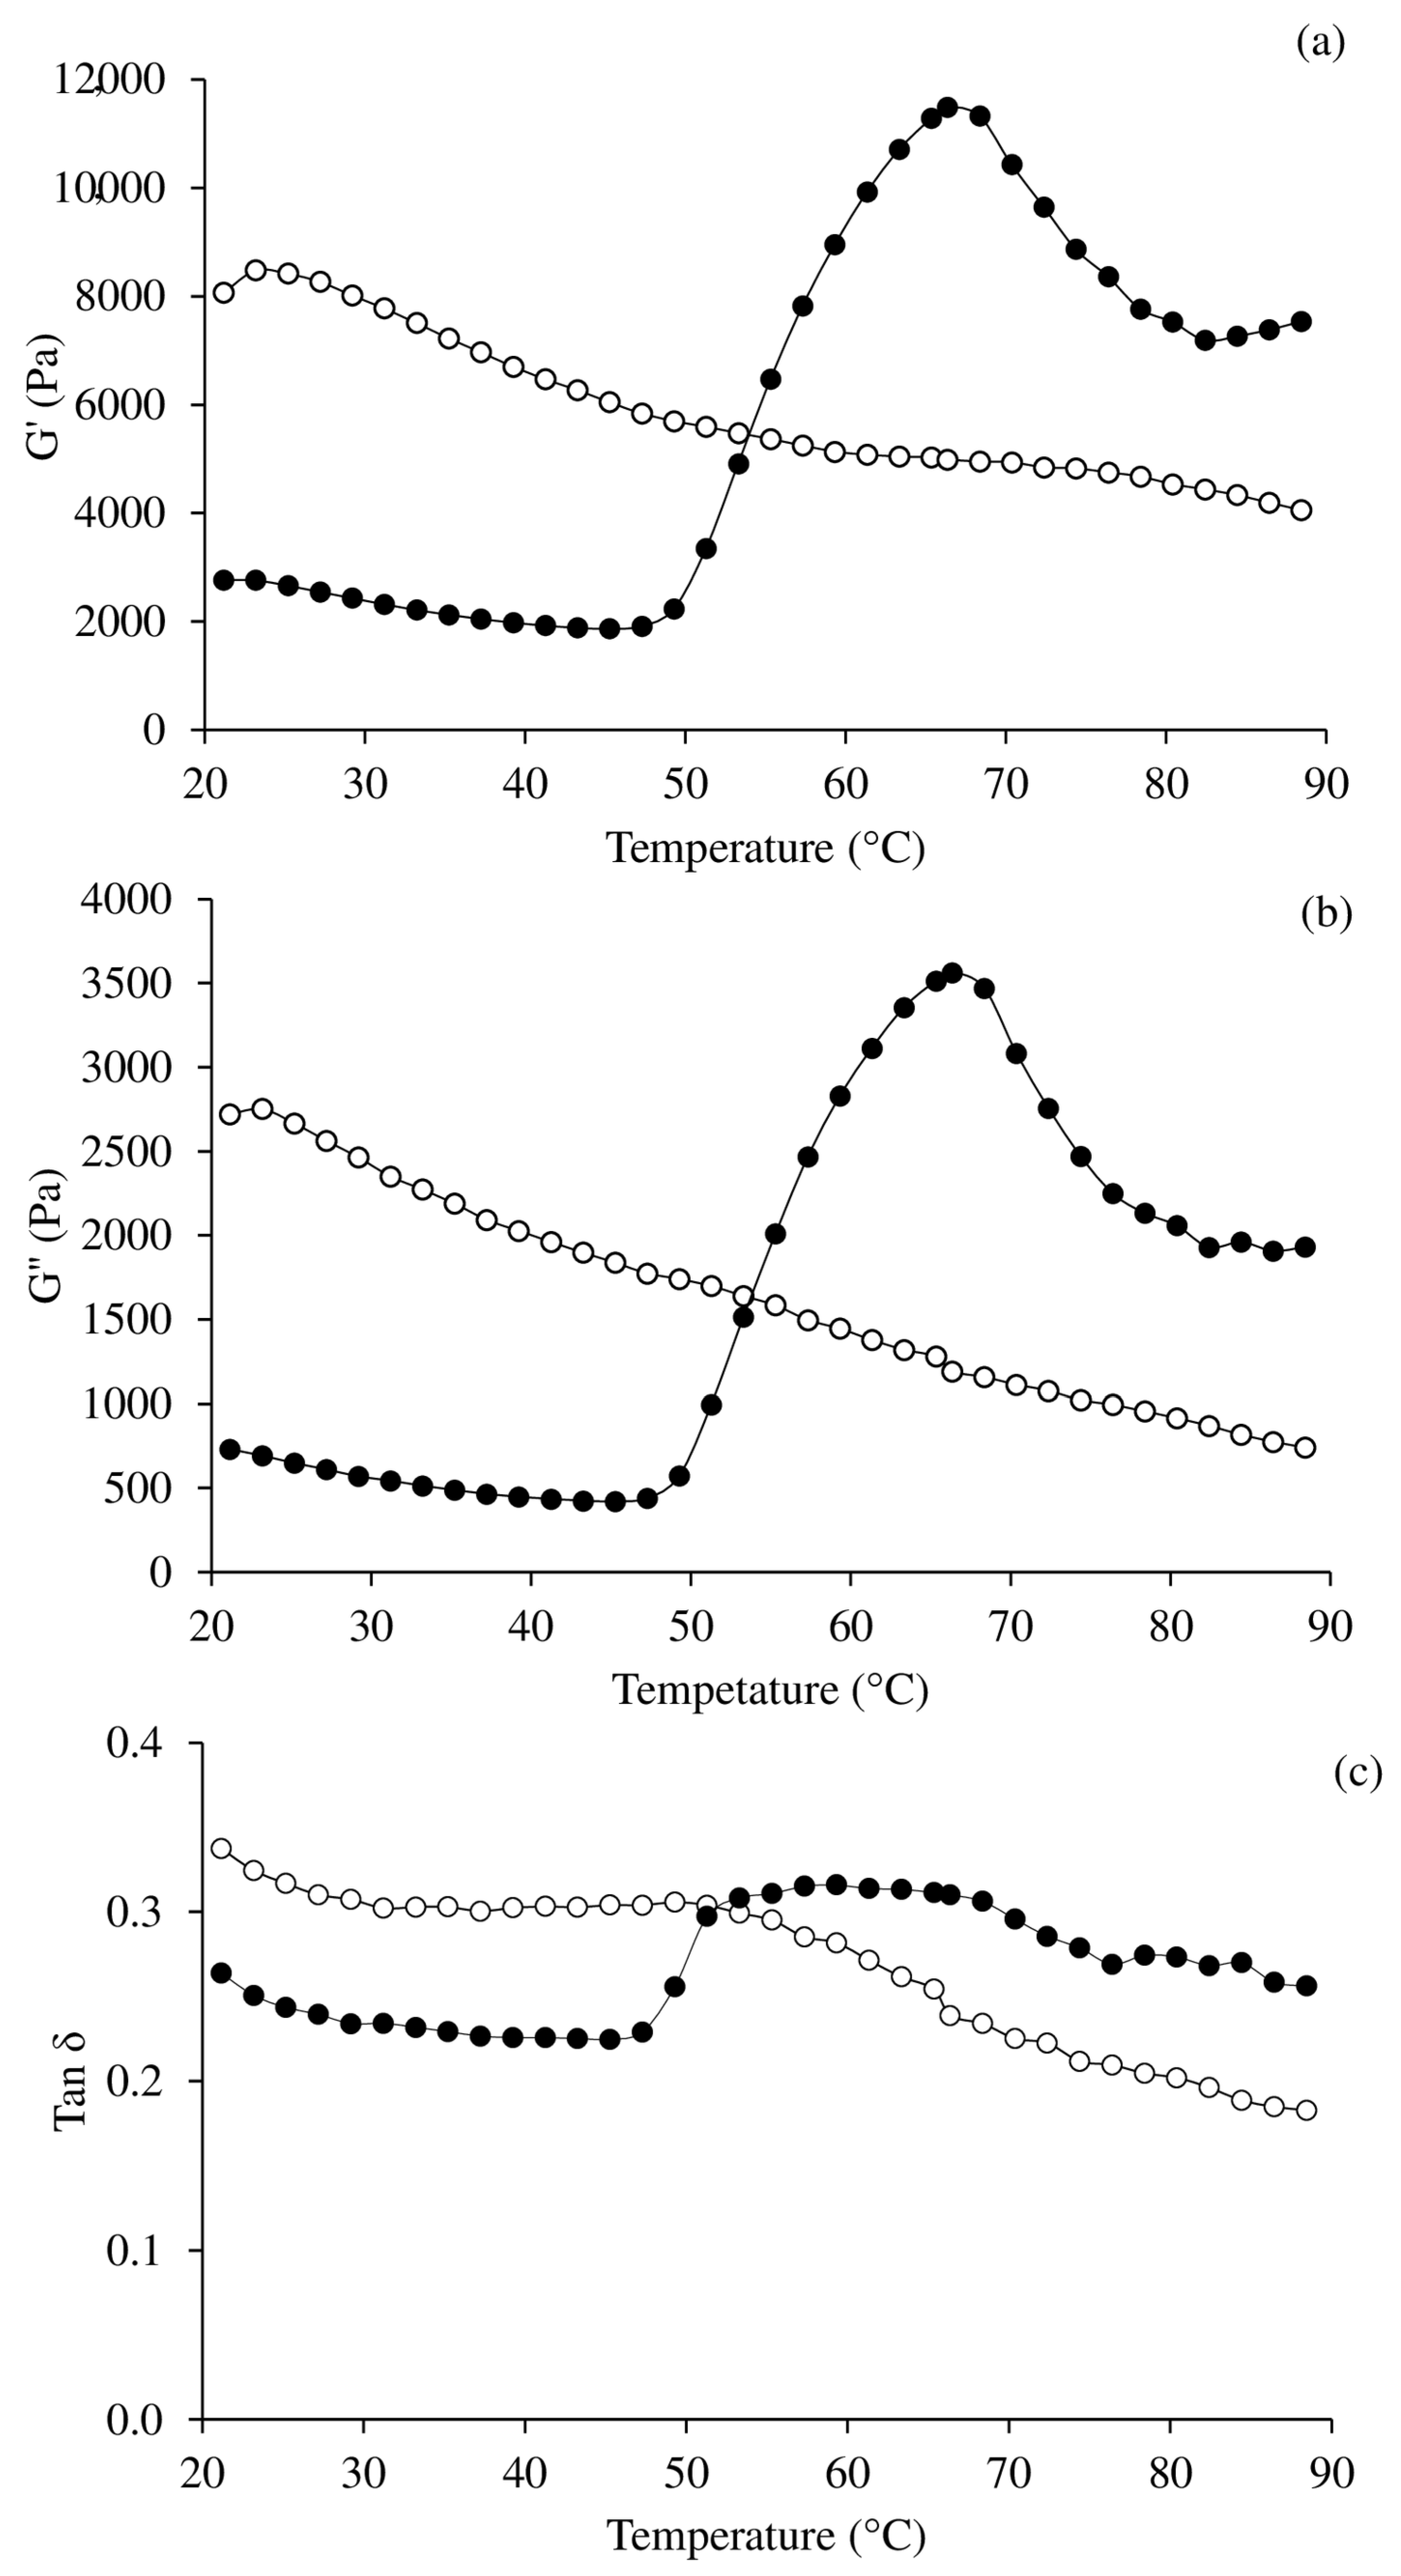
3.5. Oscillatory Dynamic Rheology
3.6. Gelling Properties
3.6.1. Breaking Force, Deformation, Expressible Drip, and Whiteness
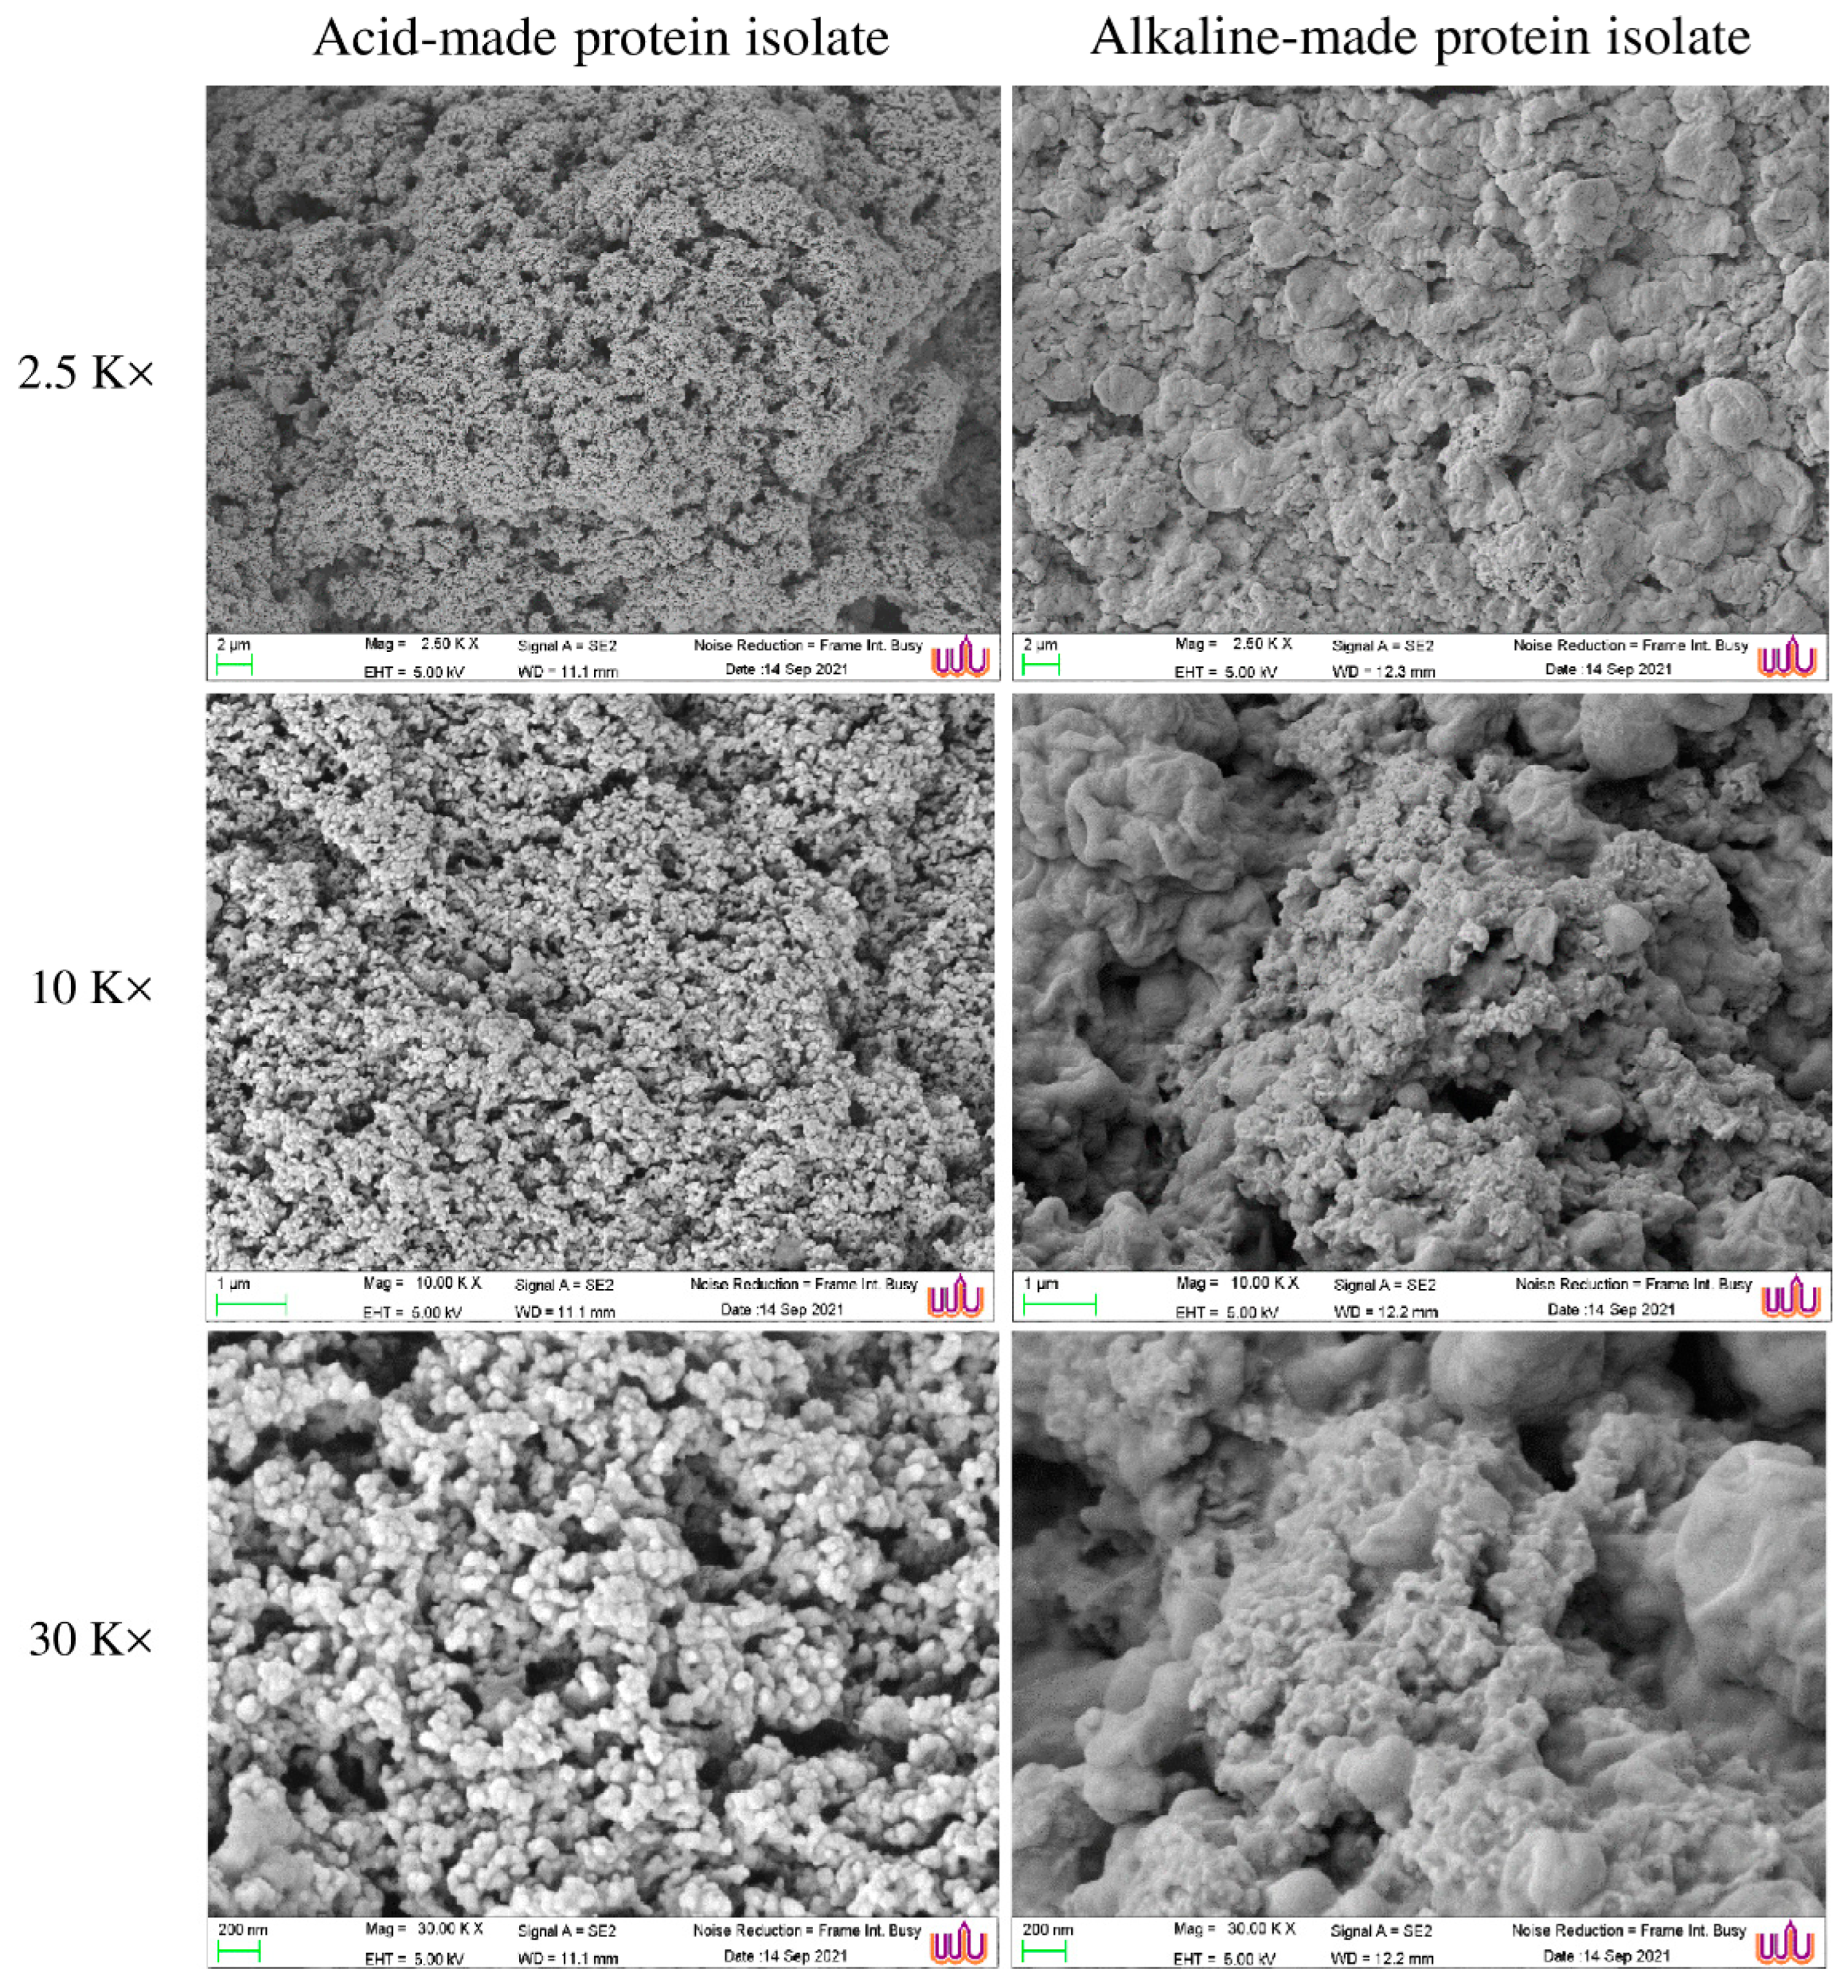
3.6.2. TPA and Microstructures
3.6.3. Lipid Oxidation
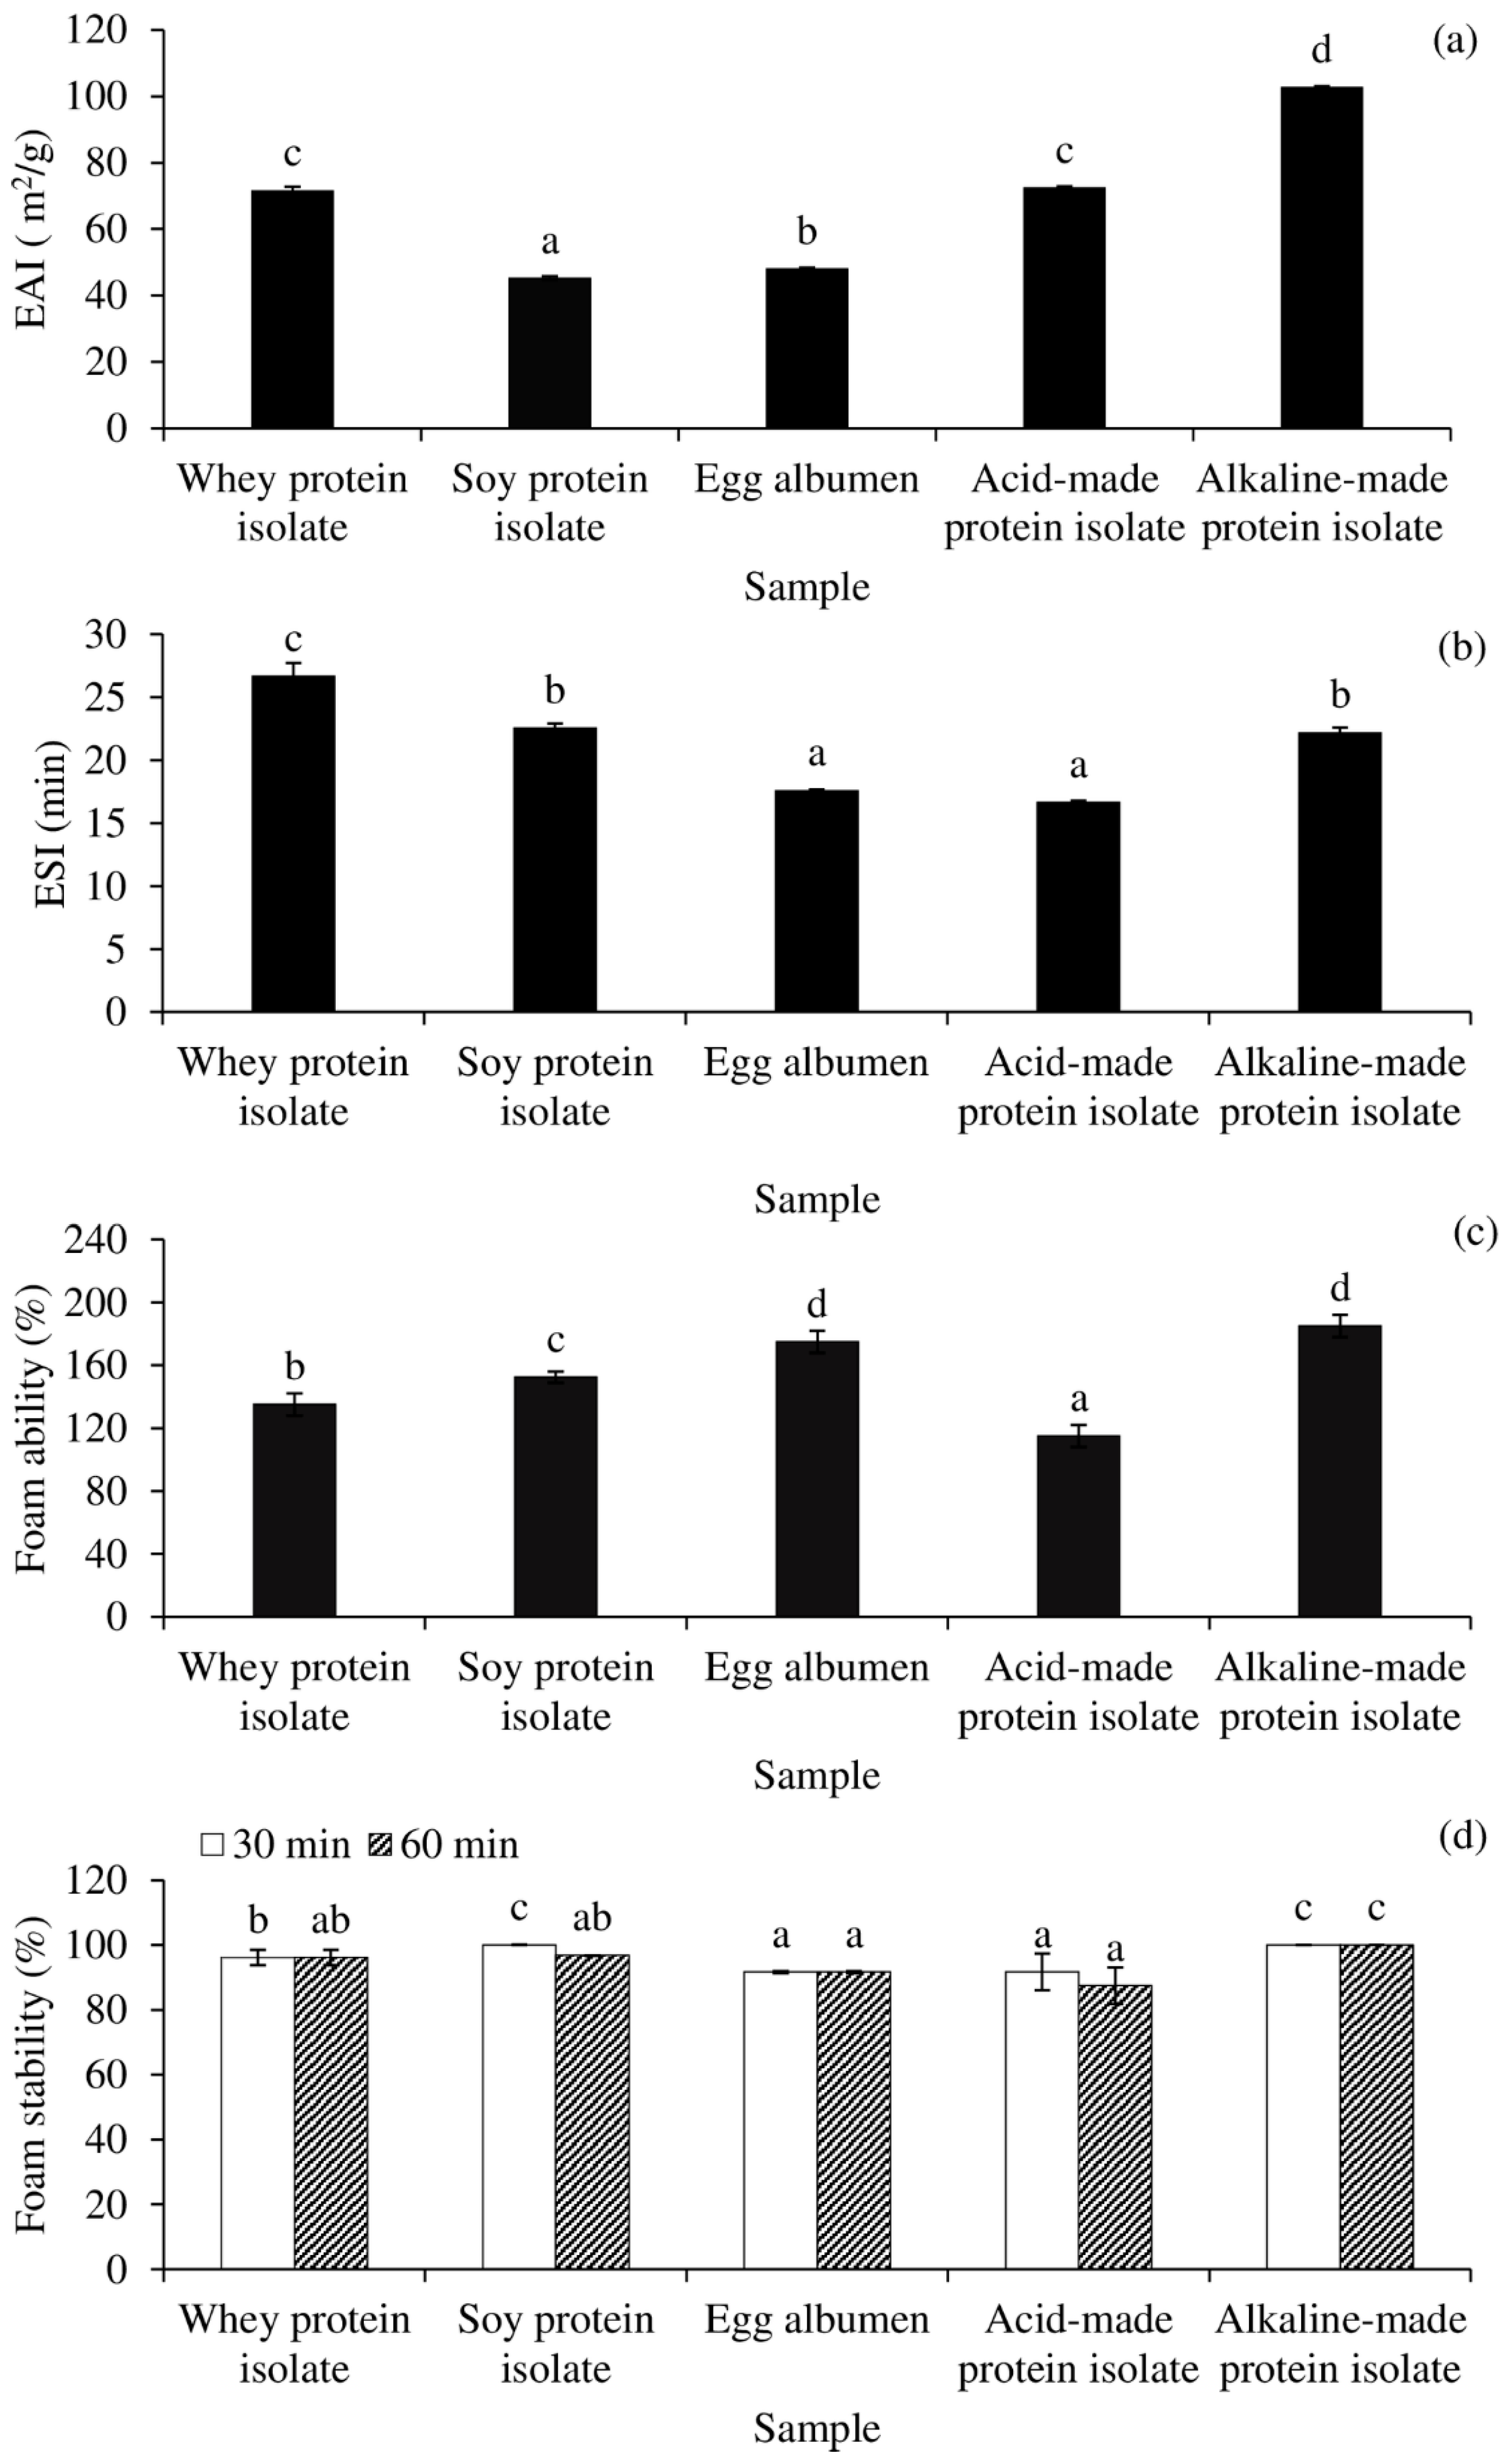
3.7. Interfacial Properties
4. Conclusions
Author Contributions
Funding
Institutional Review Board Statement
Informed Consent Statement
Data Availability Statement
Acknowledgments
Conflicts of Interest
References
- Chaijan, M.; Chumthong, K.; Kongchoosi, N.; Chinarak, K.; Panya, A.; Phonsatta, N.; Cheong, L.Z.; Panpipat, W. Characterisation of pH-shift-produced protein isolates from sago palm weevil (Rhynchophorus ferrugineus) larvae. J. Insects Food Feed. 2021, 1–12, in press. [Google Scholar] [CrossRef]
- Harrysson, H.; Hayes, M.; Eimer, F.; Carlsson, N.G.; Toth, G.B.; Undeland, I. Production of protein extracts from Swedish red, green, and brown seaweeds, Porphyra umbilicalis Kützing, Ulva lactuca Linnaeus, and Saccharina latissima (Linnaeus) JV Lamouroux using three different methods. J. Appl. Phycol. 2018, 30, 3565–3580. [Google Scholar] [CrossRef] [Green Version]
- Aiking, H. Protein production: Planet, profit, plus people? Am. J. Clin. Nutr. 2014, 100, 483S–489S. [Google Scholar] [CrossRef] [Green Version]
- Department of Livestock Development. Statistics Livestock in Thailand; Bureau of Livestock Development and Development, Ministry of Agriculture and Cooperatives: Bangkok, Thailand, 2020. [Google Scholar]
- Ockerman, H.W.; Basu, L. By-products. In Encyclopedia of Meat Sciences, 1st ed.; Jensen, W.K., Devine, C., Dikeman, M., Eds.; Elsevier Academic Press: Amsterdam, The Netherlands, 2004; pp. 104–112. [Google Scholar]
- Toldrá, F.; Aristoy, M.C.; Mora, L.; Reig, M. Innovations in value-addition of edible meat by-products. Meat Sci. 2012, 92, 290–296. [Google Scholar] [CrossRef]
- Campbell, R.E.; Kenney, P.B. Edible by-products from the production and processing of muscle foods. In Muscle Foods, 1st ed.; Campbell, R.E., Kenney, P.B., Eds.; Springer: Boston, MA, USA, 1994; pp. 79–105. [Google Scholar]
- Nollet, L.M.L.; Toldrá, F. Introduction of offal meat: Definitions, regions, cultures, generalities. In Handbook of Analysis of Edible Animal By-Products, 1st ed.; Nollet, L.M.L., Toldrá, F., Eds.; CRC Press: Boca Raton, FL, USA, 2011; pp. 3–11. [Google Scholar]
- Estévez, M.; Ventanas, J.; Cava, R.; Puolanne, E. Characterisation of a traditional Finnish liver sausage and different types of Spanish liver pâtés: A comparative study. Meat Sci. 2005, 71, 657–669. [Google Scholar] [CrossRef]
- Chanted, J.; Panpipat, W.; Panya, A.; Phonsatta, N.; Cheong, L.Z.; Chaijan, M. Compositional features and nutritional value of pig brain: Potential and challenges as a sustainable source of nutrients. Foods 2021, 10, 2943. [Google Scholar] [CrossRef] [PubMed]
- Nolsøe, H.; Undeland, I. The acid and alkaline solubilisation process for the isolation of muscle proteins: State of the art. Food Bioproc. Technol. 2009, 2, 1–27. [Google Scholar] [CrossRef]
- Abdollahi, M.; Marmon, S.; Chaijan, M.; Undeland, I. Tuning the pH-shift protein-isolation method for maximum hemoglobin-removal from blood rich fish muscle. Food Chem. 2016, 212, 213–224. [Google Scholar] [CrossRef] [PubMed]
- Panpipat, W.; Chaijan, M. Functional properties of pH-shifted protein isolates from bigeye snapper (Priacanthus tayenus) head by-product. Int. J. Food Prop. 2017, 20, 596–610. [Google Scholar] [CrossRef] [Green Version]
- Tang, Z.X.; Ying, R.F.; Shi, L.E. Physicochemical and functional characteristics of proteins treated by a pH-shift process: A review. Int. J. Food Sci. Technol. 2021, 56, 515–529. [Google Scholar] [CrossRef]
- Phetsang, H.; Panpipat, W.; Undeland, I.; Panya, A.; Phonsatta, N.; Chaijan, M. Comparative quality and volatilomic characterisation of unwashed mince, surimi, and pH-shift-processed protein isolates from farm-raised hybrid catfish (Clarias macrocephalus × Clarias gariepinus). Food Chem. 2021, 364, 130365. [Google Scholar] [CrossRef]
- Panpipat, W.; Chaijan, M. Physicochemical and techno-functional properties of acid-aided pH-shifted protein isolate from over-salted duck egg (Anas platyrhucus) albumen. Int. J. Food Sci. Technol. 2020, 55, 2619–2629. [Google Scholar] [CrossRef]
- Robinson, H.W.; Hodgen, C.G. Protein estimation with the biuret method. J. Biol. Chem. 1940, 135, 707–725. [Google Scholar] [CrossRef]
- Chaijan, M.; Undeland, I. Development of a new method for determination of total haem protein in fish muscle. Food Chem. 2015, 173, 1133–1141. [Google Scholar] [CrossRef]
- AOAC. Official Methods of Analysis, 16th ed.; Association of Official Analytical Chemists: Washington, DC, USA, 2000. [Google Scholar]
- Bligh, E.G.; Dyer, W.J. A rapid method of total lipid extraction and purification. Can. J. Biochem. Physiol. 1959, 37, 911–917. [Google Scholar] [CrossRef]
- Stewart, J.C.M. Colorimetric determination of phospholipids with ammonium ferrothiocyanate. Anal. Biochem. 1980, 104, 10–14. [Google Scholar] [CrossRef]
- Somjid, P.; Panpipat, W.; Cheong, L.Z.; Chaijan, M. Reduced washing cycle for sustainable mackerel (Rastrelliger kanagurta) surimi production: Evaluation of bio-physico-chemical, rheological, and gel-forming properties. Foods 2021, 10, 2717. [Google Scholar] [CrossRef]
- Panpipat, W.; Cheong, L.Z.; Chaijan, M. Impact of lecithin incorporation on gel properties of bigeye snapper (Priacanthus tayenus) surimi. Int. J. Food Sci. Technol. 2021, 56, 2481–2491. [Google Scholar] [CrossRef]
- Buege, J.A.; Aust, S.D. Microsomal lipid peroxidation. Meth. Enzymol. 1978, 52, 302–310. [Google Scholar]
- Chaijan, M.; Panpipat, W.; Benjakul, S. Physicochemical and gelling properties of short-bodied mackerel (Rastrelliger brachysoma) protein isolate prepared using alkali-aided process. Food Bioprod. Process. 2010, 88, 174–180. [Google Scholar] [CrossRef]
- Panpipat, W.; Chaijan, M. Biochemical and physicochemical characteristics of protein isolates from bigeye snapper (Priacanthus tayenus) head by-product using pH shift method. Turk. J. Fish. Aquat. Sci. 2016, 16, 41–50. [Google Scholar]
- Huang, J.; Ye, B.; Wang, W.; Li, J.; Yi, S.; Li, X.; Mi, H. Incorporation effect of inulin and microbial transglutaminase on the gel properties of silver carp (Hypophthalmichthys molitrix) surimi. J. Food Meas. Charact. 2021, 15, 1–11. [Google Scholar] [CrossRef]
- Tabilo-Munizaga, G.; Barbosa-Canovas, G. Rheology for the food industry. J. Food Eng. 2005, 67, 147–156. [Google Scholar] [CrossRef]
- Buamard, N.; Benjakul, S. Improvement of gel properties of sardine (Sardinella albella) surimi using coconut husk extracts. Food Hydrocoll. 2015, 51, 146–155. [Google Scholar] [CrossRef]
- Zhang, T.; Xue, Y.; Li, Z.; Wang, Y.; Yang, W.; Xue, C. Effects of ozone-induced oxidation on the physicochemical properties of myofibrillar proteins recovered from bighead carp (Hypophthalmichthys nobilis). Food Bioprocess Technol. 2015, 8, 181–190. [Google Scholar] [CrossRef]
- Yongsawatdigul, J.; Park, J.W. Thermal denaturation and aggregation of threadfin bream actomyosin. Food Chem. 2003, 83, 409–416. [Google Scholar] [CrossRef]
- Choi, Y.; Park, J.W. Acid-aided protein recovery from enzyme-rich Pacific whiting. J. Food Sci. 2002, 67, 2962–2967. [Google Scholar] [CrossRef]
- Zhou, X.; Lin, H.; Zhu, S.; Xu, X.; Lyu, F.; Ding, Y. Textural, rheological and chemical properties of surimi nutritionally-enhanced with lecithin. LWT 2020, 122, 108984. [Google Scholar] [CrossRef]
- Kristinsson, H.G.; Hultin, H.O. Effect of low and high pH treatment on the functional properties of cod muscle proteins. J. Agric. Food Chem. 2003, 51, 5103–5110. [Google Scholar] [CrossRef]
- Undeland, I.; Kelleher, S.D.; Hultin, H.O. Recovery of functional proteins from herring (Clupea harengus) light muscle by an acid or alkali solubilisation process. J. Agric. Food Chem. 2002, 50, 7371–7379. [Google Scholar] [CrossRef]
- Park, J.W.; Graves, D.; Draves, R.; Yongsawatdigul, J. Manufacture of surimi: Harvest to frozen block. In Surimi and Surimi Seafood, 2nd ed.; Park, J.W., Ed.; CRC Press: Boca Raton, FL, USA, 2013; pp. 55–97. [Google Scholar]
- Chaijan, M.; Panpipat, W. Mechanism of oxidation in foods of animal origin. In Natural Antioxidants, 1st ed.; Banerjee, R., Verma, A.K., Siddiqui, M.W., Eds.; Apple Academic Press: Palm Bay, FL, USA, 2017; pp. 1–37. [Google Scholar]
- Li Zhai, J.; Day, L.; Aguilar, M.I.; Wooster, T.J. Protein folding at emulsion oil/water interfaces. Curr. Opin. Colloid Interface Sci. 2013, 18, 257–271. [Google Scholar] [CrossRef]
- Mitropoulos, V.; Mütze, A.; Fischer, P. Mechanical properties of protein adsorption layers at the air/water and oil/water interface: A comparison in light of the thermodynamical stability of proteins. Adv. Colloid Interface Sci. 2014, 206, 195–206. [Google Scholar] [CrossRef] [PubMed]
- Nagarajan, M.; Benjakul, S.; Prodpran, T.; Songtipya, P.; Kishimura, H. Characteristics and functional properties of gelatin from splendid squid (Loligo formosana) skin as affected by extraction temperatures. Food Hydrocoll. 2012, 29, 389–397. [Google Scholar] [CrossRef]


| pH | Colour | Haem Protein (g/100 g) | Appearance | ||
|---|---|---|---|---|---|
| L* | a* | b* | |||
| 1 | 23.19 ± 0.08 e | −0.34 ± 0.30 de | −2.04 ± 0.34 b | 0.01 ± 0.00 a |  |
| 2 | 18.96 ± 0.53 a | −0.05 ± 0.23 e | −1.94 ± 0.24 b | 0.01 ± 0.00 a |  |
| 3 | 21.28 ± 0.65 b | −0.25 ± 0.23 de | −1.89 ± 0.10 b | 0.01 ± 0.00 a |  |
| 4 | 22.82 ± 0.17 de | −0.18 ± 0.15 de | −2.14 ± 0.12 b | 0.01 ± 0.00 a |  |
| 4.5 | 22.31 ± 0.55 cd | −0.30 ± 0.12 de | −2.31 ± 0.29 b | 0.01 ± 0.00 a |  |
| 5 | 22.46 ± 0.49 | −0.05 ± 0.13 e | −2.19 ± 0.15 b | 0.01 ± 0.00 a |  |
| 5.5 | 21.85 ± 0.32 c | −0.28 ± 0.11 de | −2.92 ± 0.04 a | 0.15 ± 0.01 c |  |
| 6 | 26.92 ± 0.27 ki | −1.35 ± 0.18 c | −1.50 ± 0.05 b | 0.22 ± 0.01 d |  |
| 6.5 | 27.30 ± 0.07 m | −1.41 ± 0.55 bc | −0.66 ± 0.24 c | 0.26 ± 0.01 g |  |
| 7 | 25.44 ± 0.46 g | −1.32 ± 0.10 cd | −0.73 ± 0.31 c | 0.27 ± 0.01 g |  |
| 8 | 25.62 ± 0.41 gh | −1.62 ± 0.17 abc | 0.33 ± 0.14 d | 0.23 ± 0.00 de |  |
| 9 | 26.29 ± 0.18 ij | −1.60 ± 0.19 abc | 0.61 ± 0.21 d | 0.24 ± 0.01 ef |  |
| 9.5 | 26.51 ± 0.18 jk | −1.61 ± 0.07 abc | 0.99 ± 0.22 de | 0.27 ± 0.01 g |  |
| 10 | 25.87 ± 0.26 ghi | −0.56 ± 1.66 de | 0.51 ± 0.63 d | 0.24 ± 0.00 f |  |
| 10.5 | 26.30 ± 0.44 ij | −1.55 ± 0.26 abc | 1.85 ± 0.63 f | 0.31 ± 0.00 i |  |
| 11 | 26.06 ± 0.15 hij | −2.22 ± 0.08 a | 3.62 ± 0.43 h | 0.29 ± 0.01 h |  |
| 11.5 | 26.61 ± 0.18 jk | −2.16 ± 0.08 ab | 2.96 ± 0.36 g | 0.30 ± 0.00 hi |  |
| 12 | 27.02 ± 0.17 lm | −2.29 ± 0.06 a | 3.78 ± 0.23 h | 0.30 ± 0.00 hi |  |
| 13 | 29.45 ± 0.16 n | −2.22 ± 0.04 a | 1.28 ± 0.12 ef | 0.25 ± 0.00 f |  |
| 14 | 24.72 ± 0.12 f | −0.84 ± 0.13 cd | −2.89 ± 0.16 a | 0.13 ± 0.00 b |  |
| Parameters | Acid-Made Protein Isolate | Alkaline-Made Protein Isolate |
|---|---|---|
| Moisture content (g/100 g) | 83.84 ± 0.10 a | 91.12 ± 0.12 b |
| Dry matter yield (%) | 6.00 ± 0.48 a | 32.18 ± 1.14 b |
| Uncooked | ||
| Appearance |  |  |
| Residual lipid (g/100 g) | 0.88 ± 0.23 a | 4.56 ± 0.51 b |
| Residual phospholipid (mg/100 g) | 1.32 ± 0.16 a | 34.66 ± 0.04 b |
| Residual haem protein (mg/g) | 4.32 ± 0.35 | 10.89 ± 0.15 |
| Colour | ||
| L* | 76.70 ± 1.01 b | 66.31 ± 0.15 a |
| a* | −1.16 ± 0.03 a | −0.56 ± 0.16 b |
| b* | 6.82 ± 0.09 a | 10.85 ± 0.06 b |
| Whiteness | 75.69 ± 0.95 a | 64.60 ± 0.13 b |
| Hydrophobicity (BPB bound; μg) | 102.69 ± 1.03 b | 38.62 ± 0.27 a |
| Cooked | ||
| Appearance | 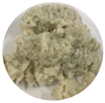 | 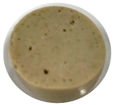 |
| Breaking force (g) | ND | 185.59 ± 1.01 |
| Deformation (mm) | ND | 1.48 ± 0.01 |
| Expressible drip (%) | 17.11 ± 1.69 a | 9.06 ± 0.71 b |
| Whiteness | 63.18 ± 1.36 b | 55.99 ± 0.54 a |
| Texture profile analysis | ||
| Hardness (N) | 7.30 ± 0.10 a | 8.03 ± 0.10 b |
| Springiness (cm) | 3.38 ± 0.01 a | 3.46 ± 0.01 b |
| Cohesiveness | 0.11 ± 0.01 a | 0.15 ± 0.01 b |
| Gumminess (N) | 0.81 ± 0.02 a | 1.21 ± 0.01 b |
| Chewiness (N.cm) | 2.74 ± 0.20 a | 4.22 ± 0.40 b |
| TBARS (mg MDA equivalent/kg) | 0.74 ± 0.02 b | 0.58 ± 0.01 a |
Publisher’s Note: MDPI stays neutral with regard to jurisdictional claims in published maps and institutional affiliations. |
© 2022 by the authors. Licensee MDPI, Basel, Switzerland. This article is an open access article distributed under the terms and conditions of the Creative Commons Attribution (CC BY) license (https://creativecommons.org/licenses/by/4.0/).
Share and Cite
Chanted, J.; Panpipat, W.; Cheong, L.-Z.; Chaijan, M. Recovery of Functional Proteins from Pig Brain Using pH-Shift Processes. Foods 2022, 11, 695. https://doi.org/10.3390/foods11050695
Chanted J, Panpipat W, Cheong L-Z, Chaijan M. Recovery of Functional Proteins from Pig Brain Using pH-Shift Processes. Foods. 2022; 11(5):695. https://doi.org/10.3390/foods11050695
Chicago/Turabian StyleChanted, Jaruwan, Worawan Panpipat, Ling-Zhi Cheong, and Manat Chaijan. 2022. "Recovery of Functional Proteins from Pig Brain Using pH-Shift Processes" Foods 11, no. 5: 695. https://doi.org/10.3390/foods11050695
APA StyleChanted, J., Panpipat, W., Cheong, L.-Z., & Chaijan, M. (2022). Recovery of Functional Proteins from Pig Brain Using pH-Shift Processes. Foods, 11(5), 695. https://doi.org/10.3390/foods11050695