
Extraction, Purification and In Vitro Antioxidant Activity Evaluation of Phenolic Compounds in California Olive Pomace


Abstract
:1. Introduction
2. Materials and Methods
2.1. Materials and Chemicals
2.1.1. Olive Material
- (1).
- Steam blanching. Fresh first oil extraction OP was steam-blanched for enzymatic inactivation to reduce phenolics losses. Blanching was conducted using a steam blancher at atmospheric pressure over 0.25” thick olive pomace to a final temperature of 80 °C after 3 min.
- (2).
- Pit and skin separation. The separation of skins and pits was conducted using a 150 Langsenkamp Laboratory Separator (Warner Bodies, Elwood, IN, USA). The pomace was passed through the separator in two stages. First using a 0.060 inch hole diameter S.S. screen and then using a 0.027 inch hole diameter S.S. screen.
- (3).
- Drum-drying. The pitted olive pomace was drum-dried on a Buflovaks Atmospheric Double Drum Dryer (Hebeler Process Solutions, Tonawanda, NY, USA), with a space of 9-10/1000” at 135 °C. Drum-drying treatments were differentiated by rotational drum speeds of 92 s/rev.
- (4).
- Milling. To obtain smaller particle sizes, drum-dried OP samples were milled for 6 s, with a KRUPS F203 (KRUPS, Parsippany, NJ, USA) coffee mill.
2.1.2. Chemicals
2.2. Basic Chemical Composition Analysis
2.2.1. Moisture Content
2.2.2. Crude Protein Content of Olive Pomace
2.2.3. Oil Content
2.2.4. Ash Content
2.2.5. Total Carbohydrates
2.2.6. Total Sugar Content
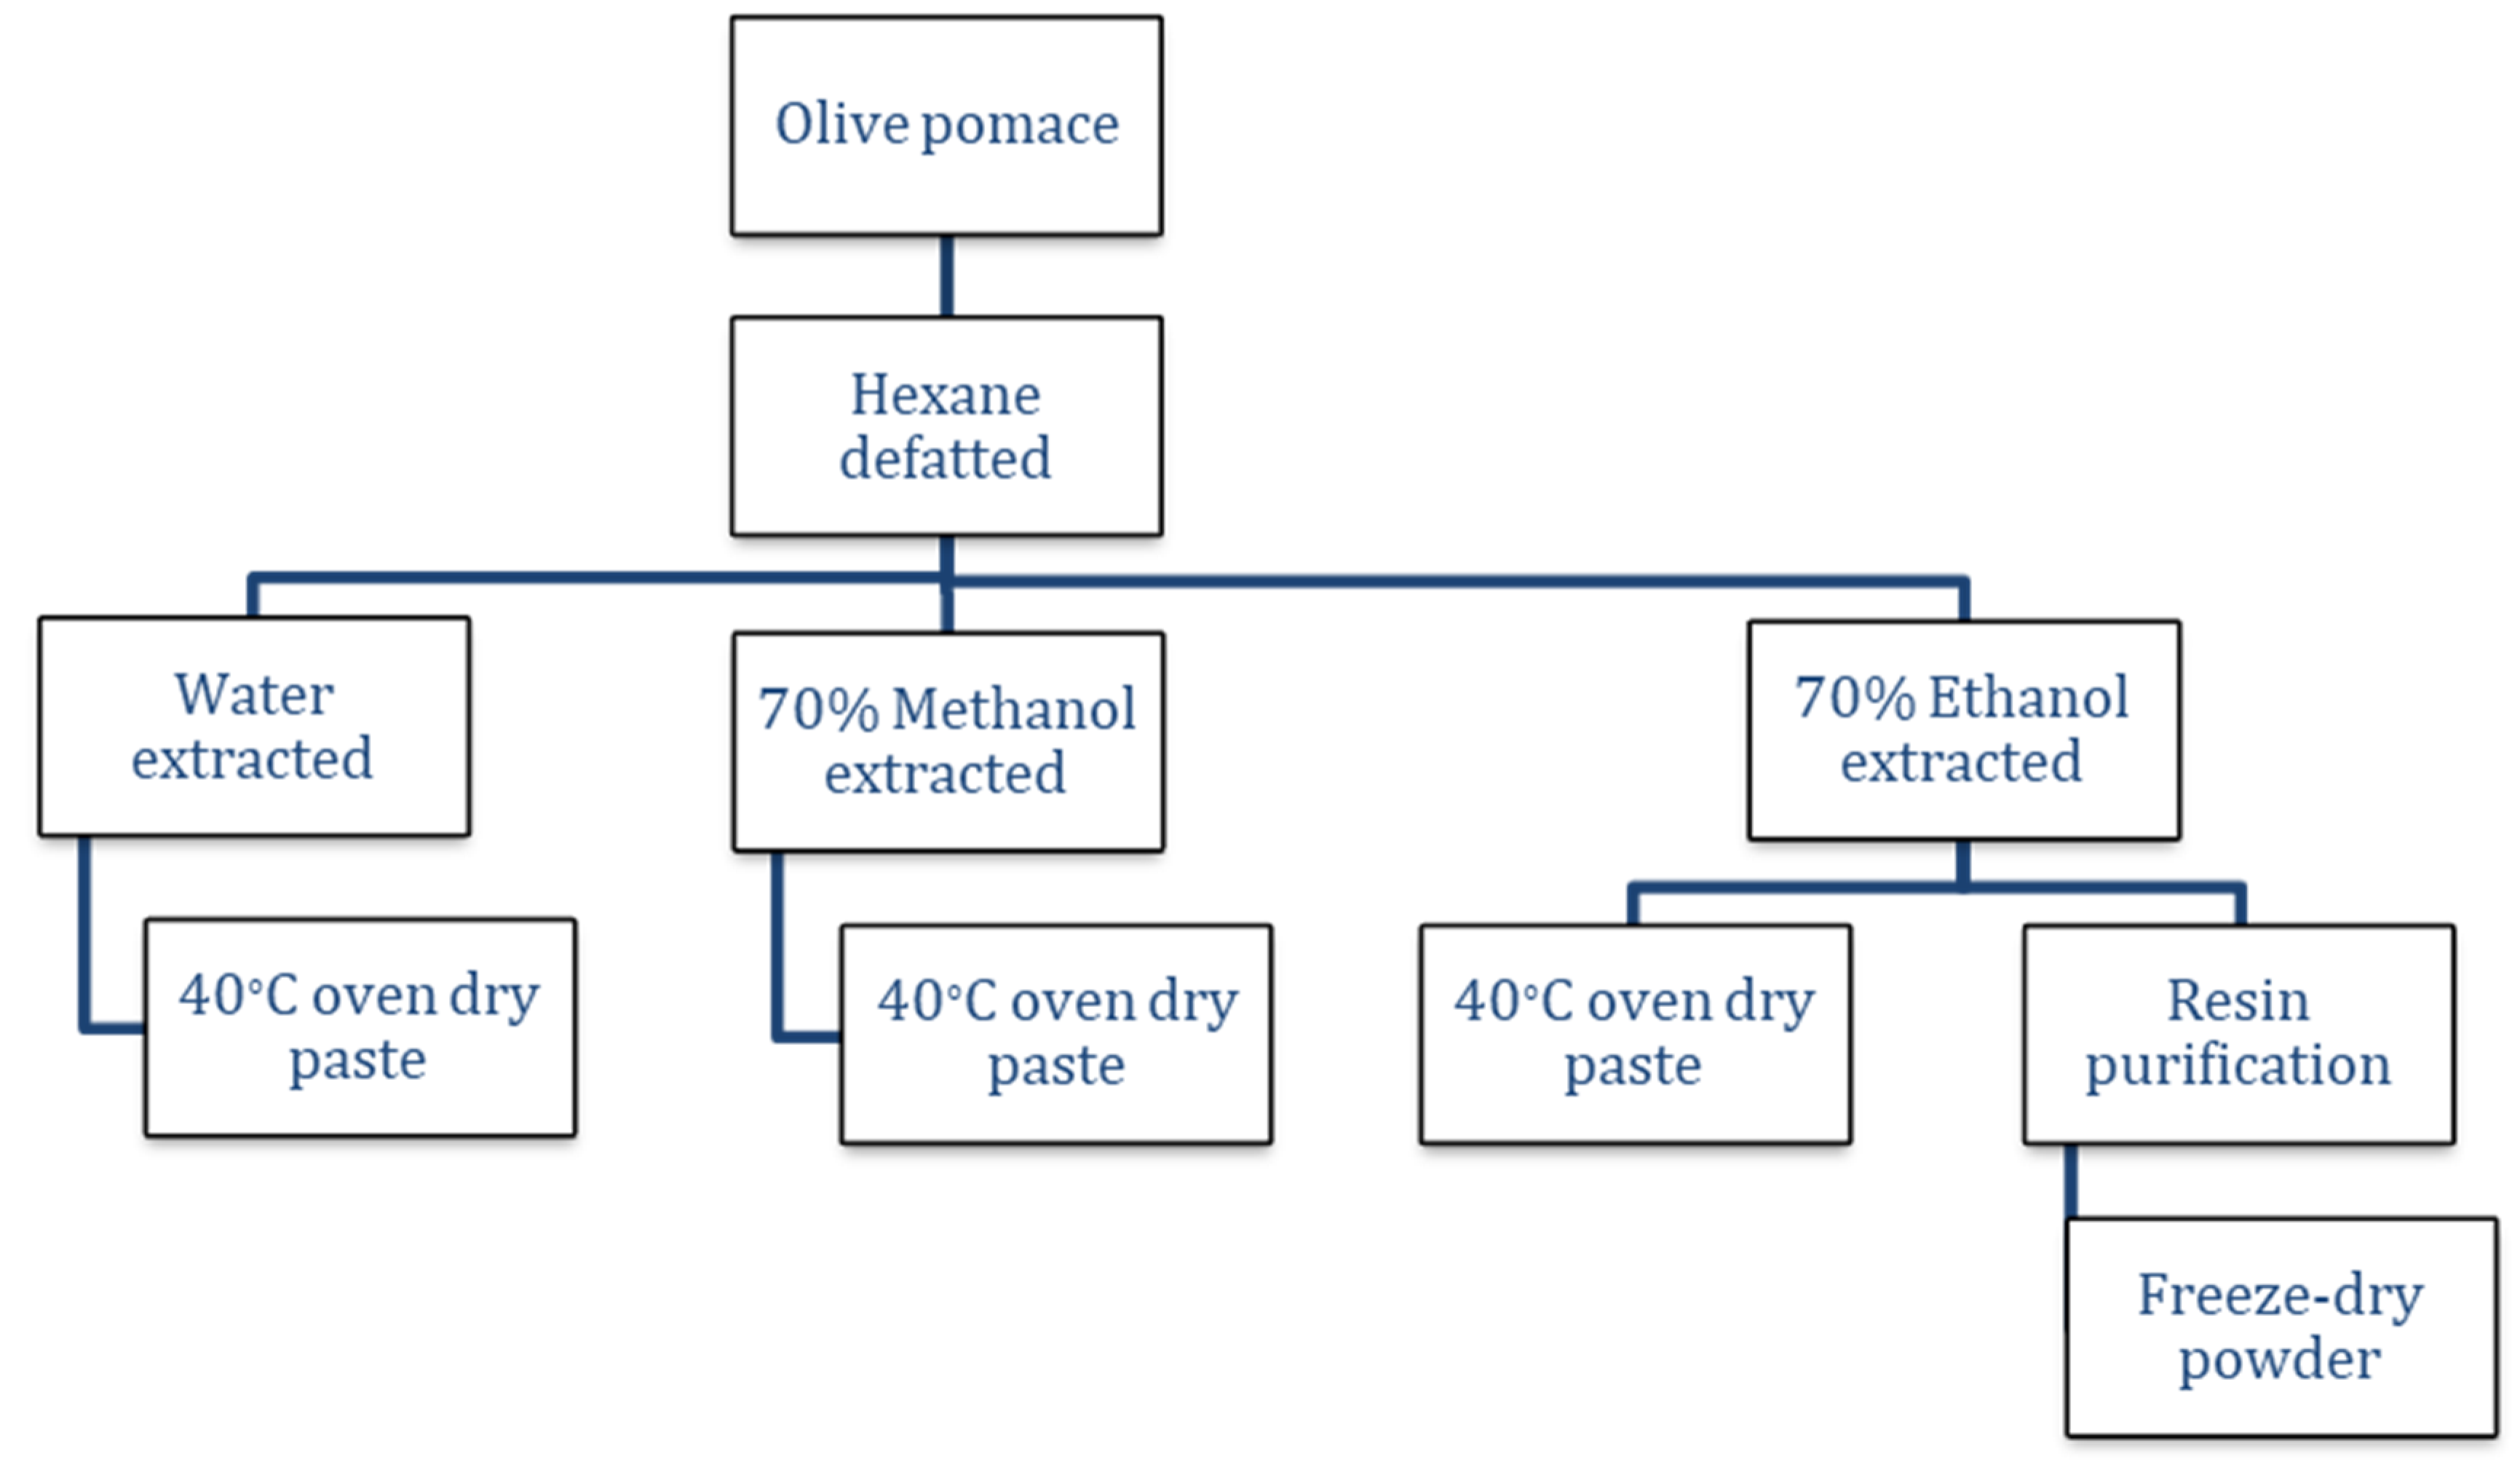
2.3. Extraction and Purification of Phenolic Compounds from OP
2.3.1. Extractable Phenols
2.3.2. Preparation of Dry Paste of Crude Extracts of OP
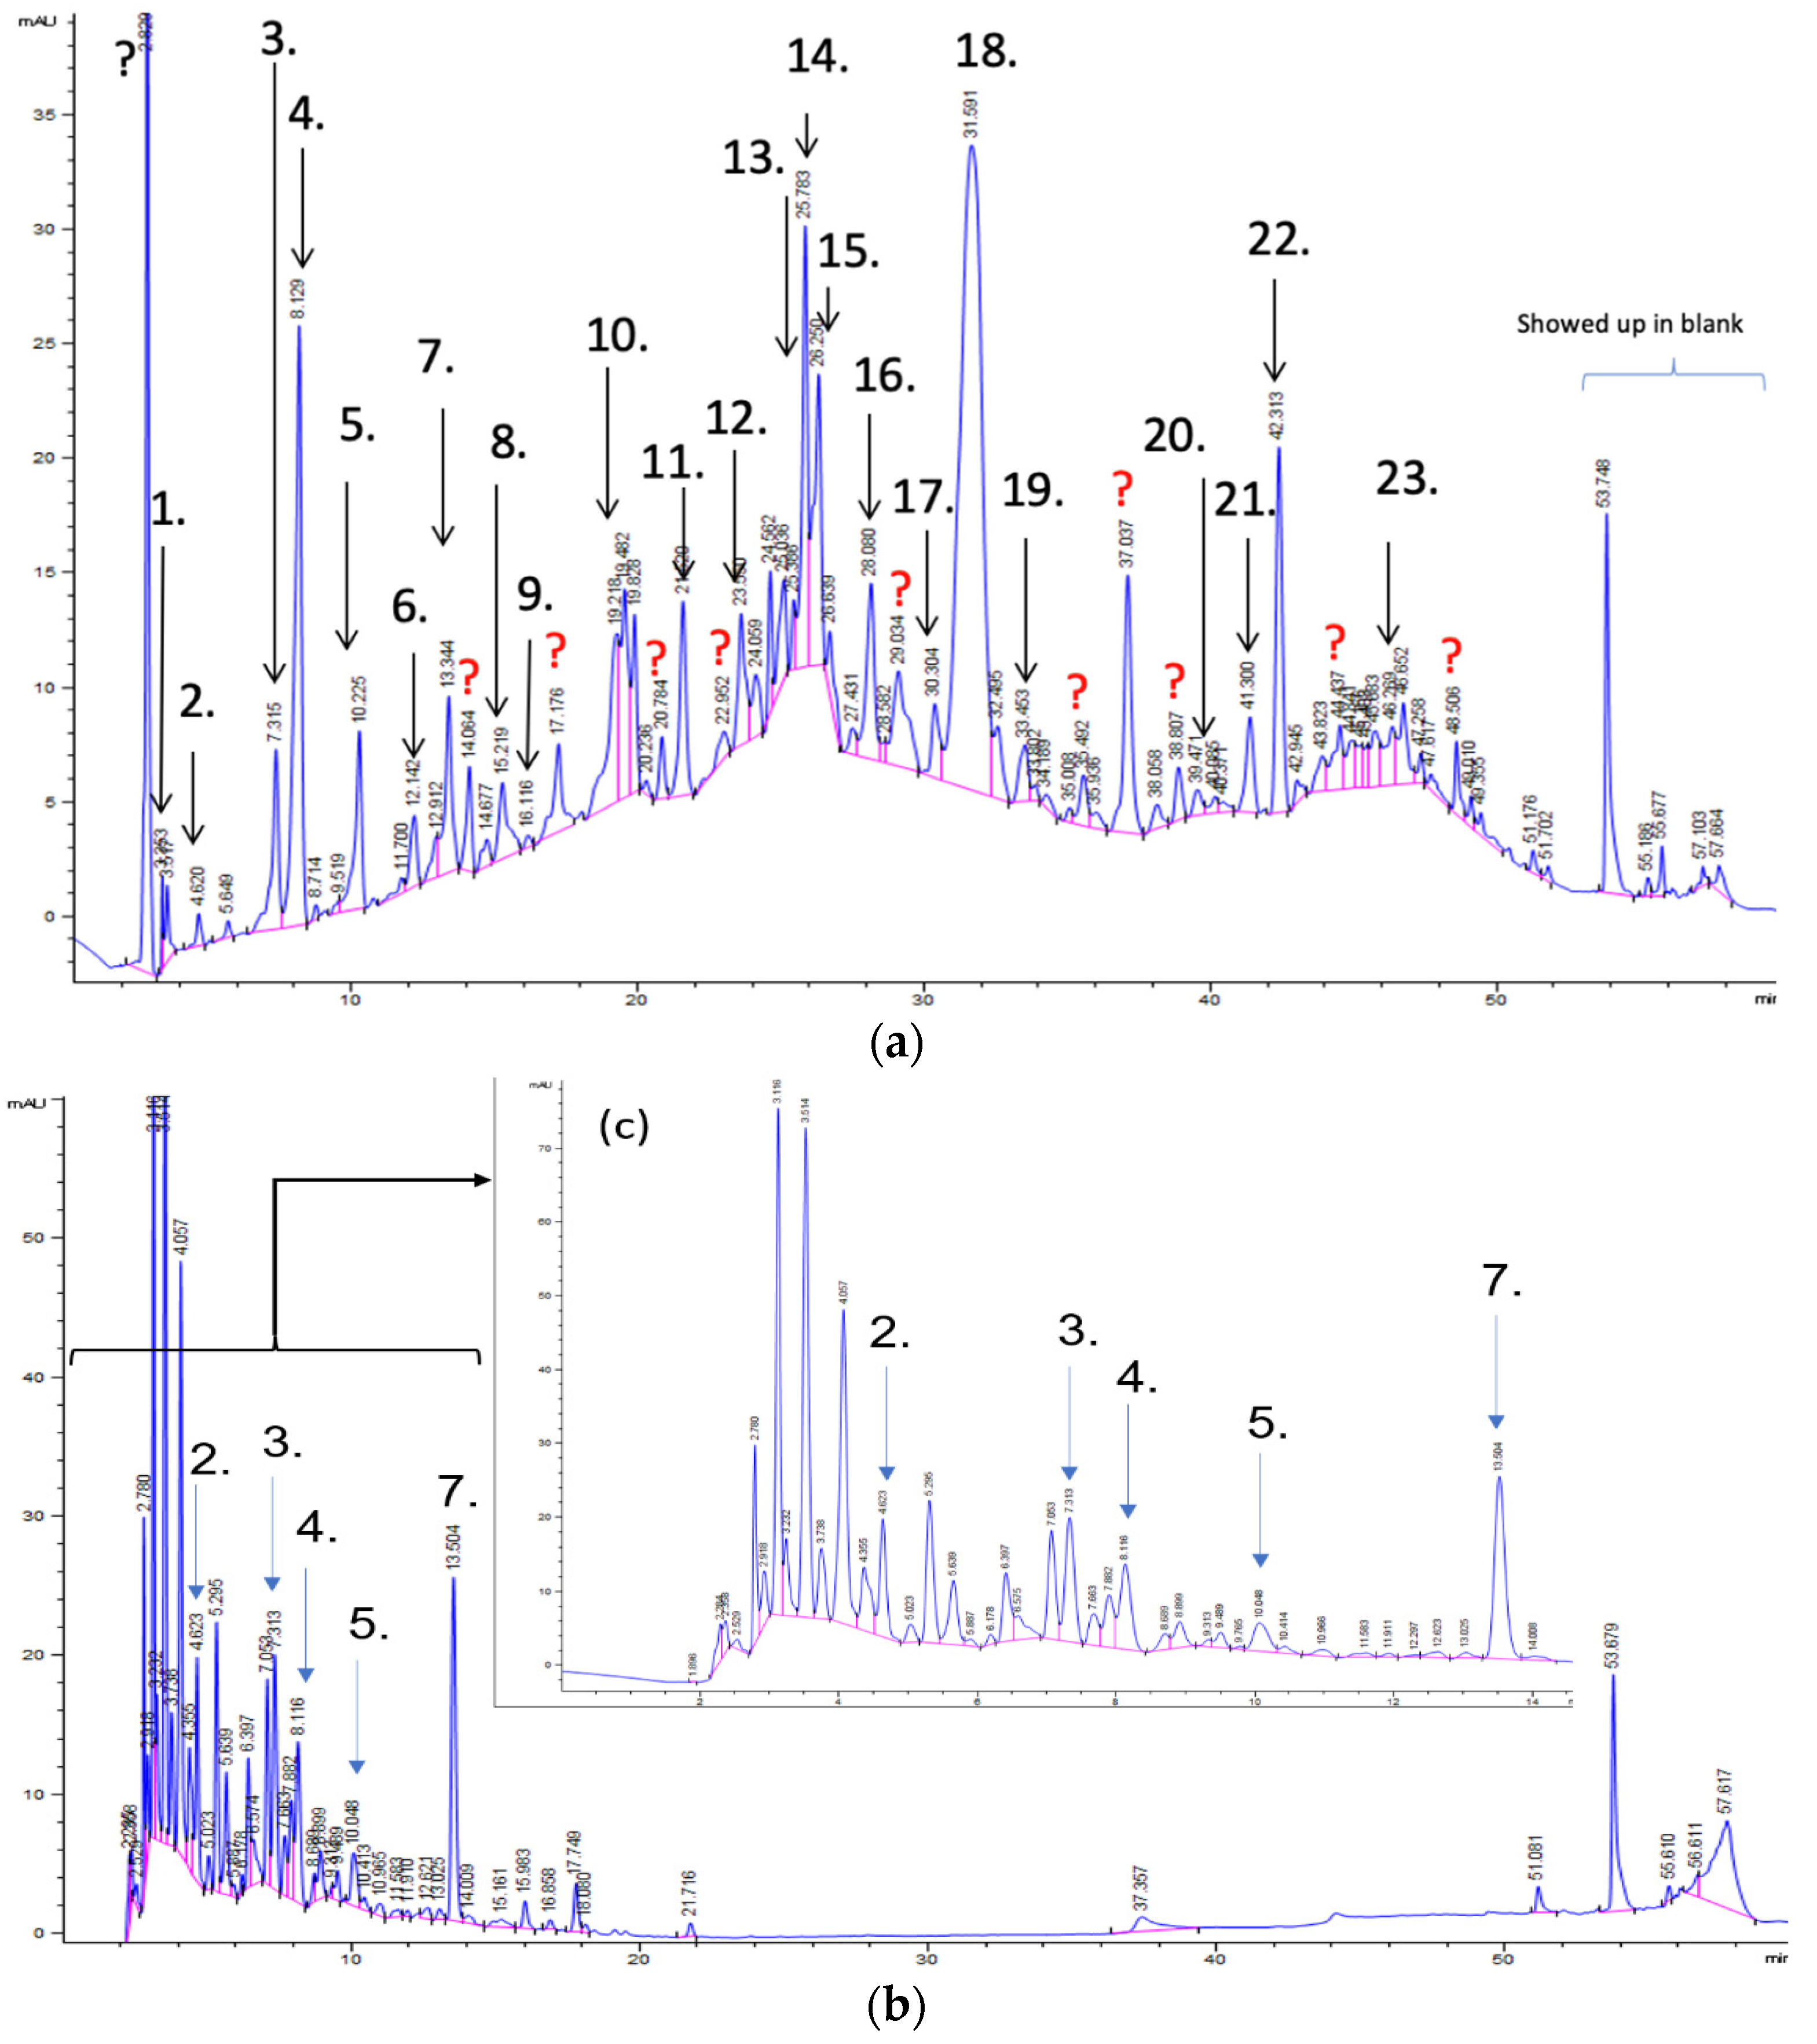
2.4. High-Performance-Liquid-Chromatography (HPLC)-Diode-Array Detector (DAD) and HPLC-Electrospray Ionization (ESI)-Quadrupole-Time of Flight-Mass Spectrometry (Q-ToF-MSn) Analysis
2.5. Total Phenol Content and Antioxidant Activities Analysis
2.5.1. Total Phenolic Content
2.5.2. 2,2′-Diphenyl-1-picrylhydrazyl Radical (DPPH) Assay
2.5.3. Ferric Reducing Antioxidant Power (FRAP)
2.6. Statistical Analysis
3. Results and Discussion
3.1. Chemical Composition in Olive Pomace
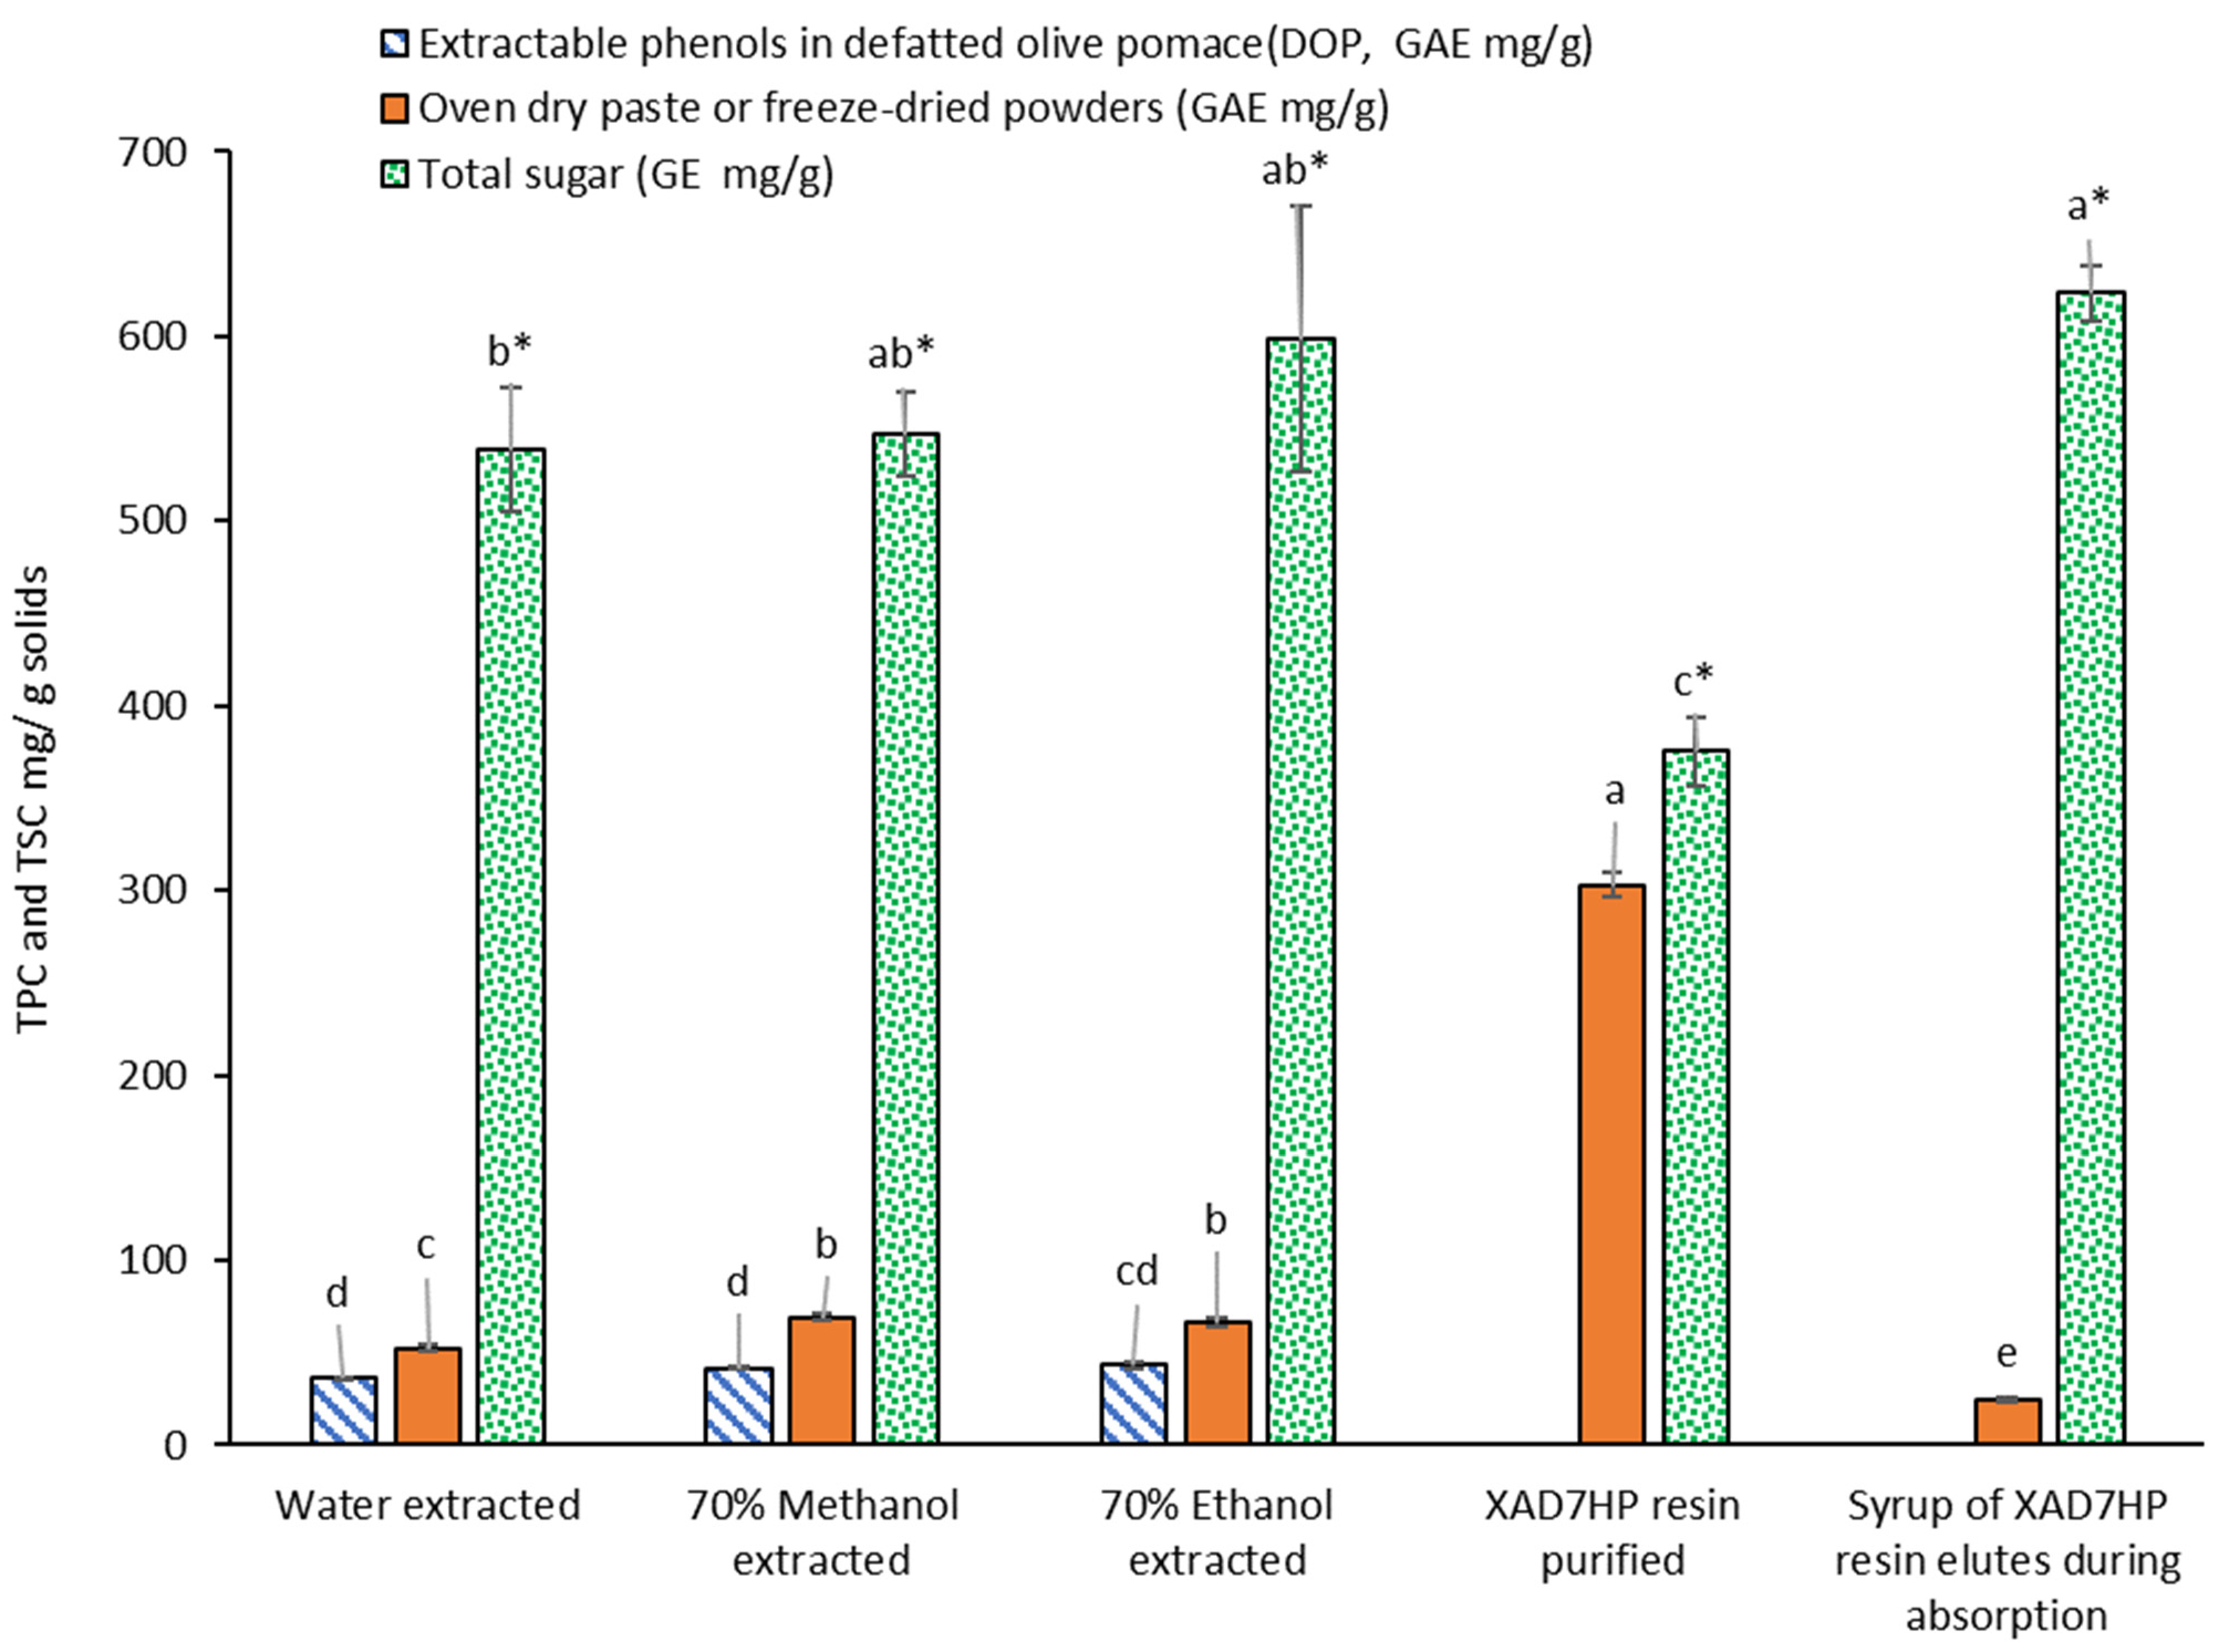
3.2. Total Phenolic Contents in Olive Pomace and Extracts
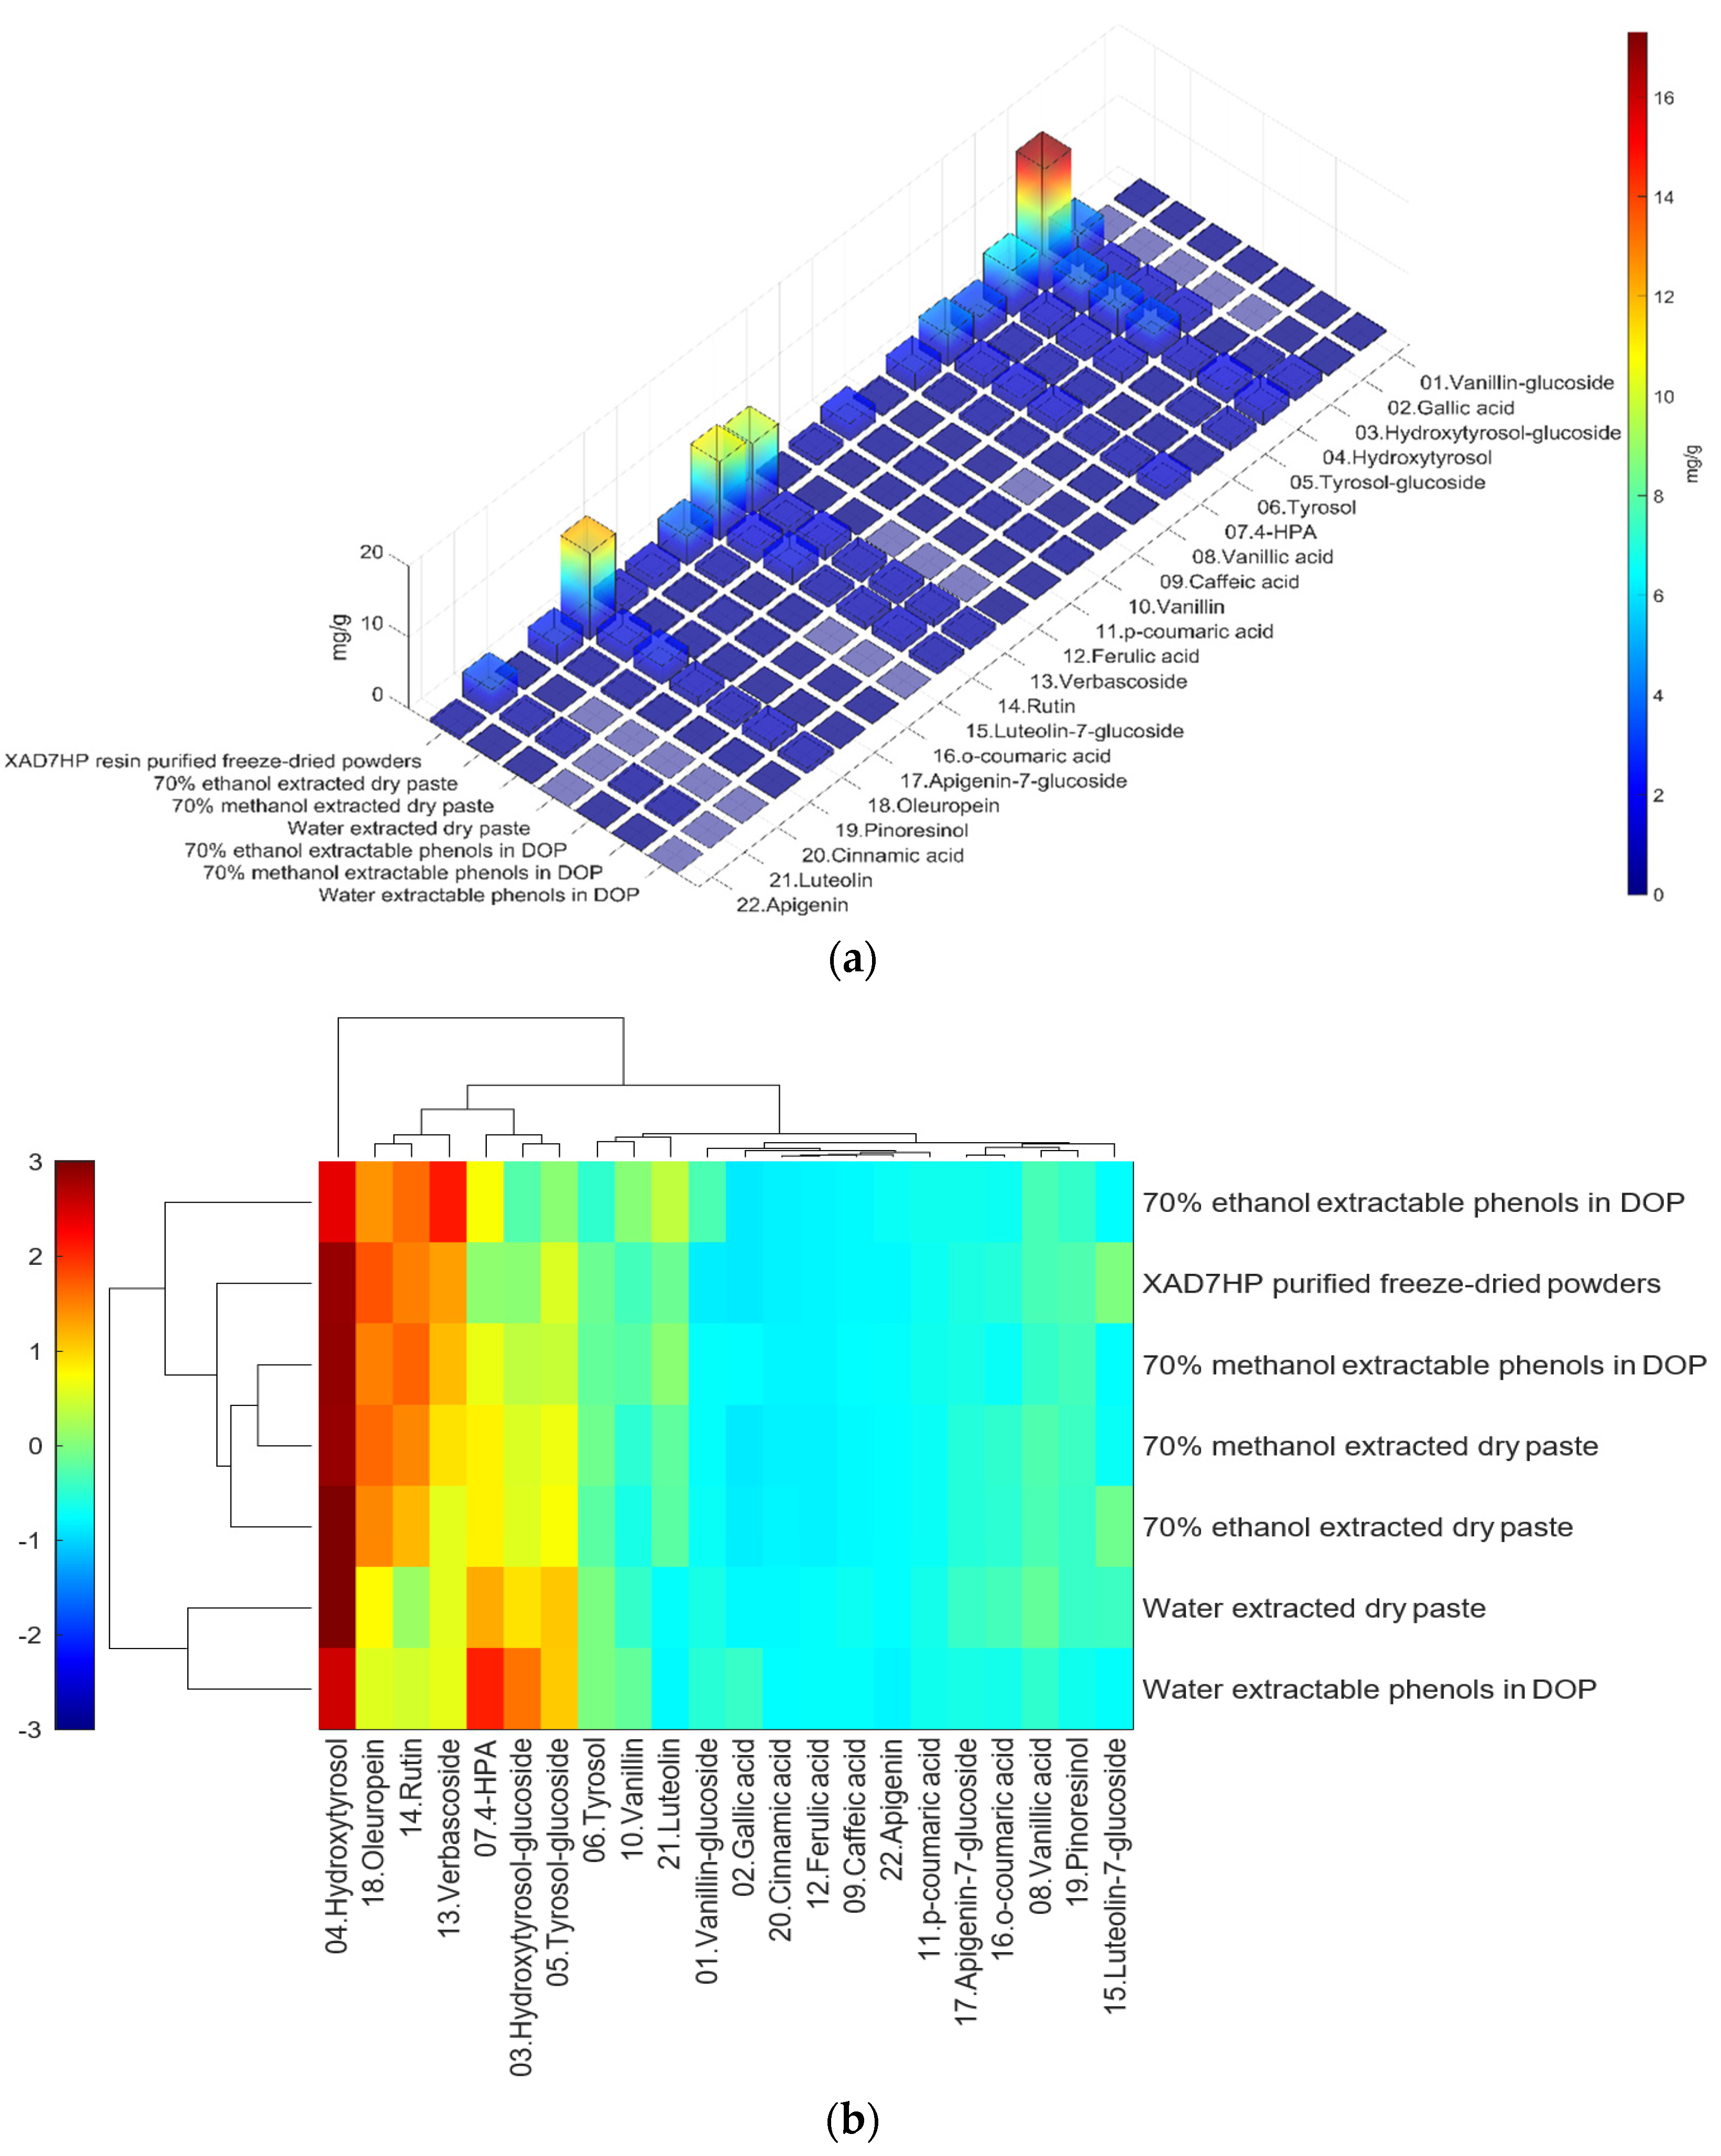
3.3. Individual Phenolic Contents in Olive Pomace and Extracts
3.4. Removal of Sugar Impurity
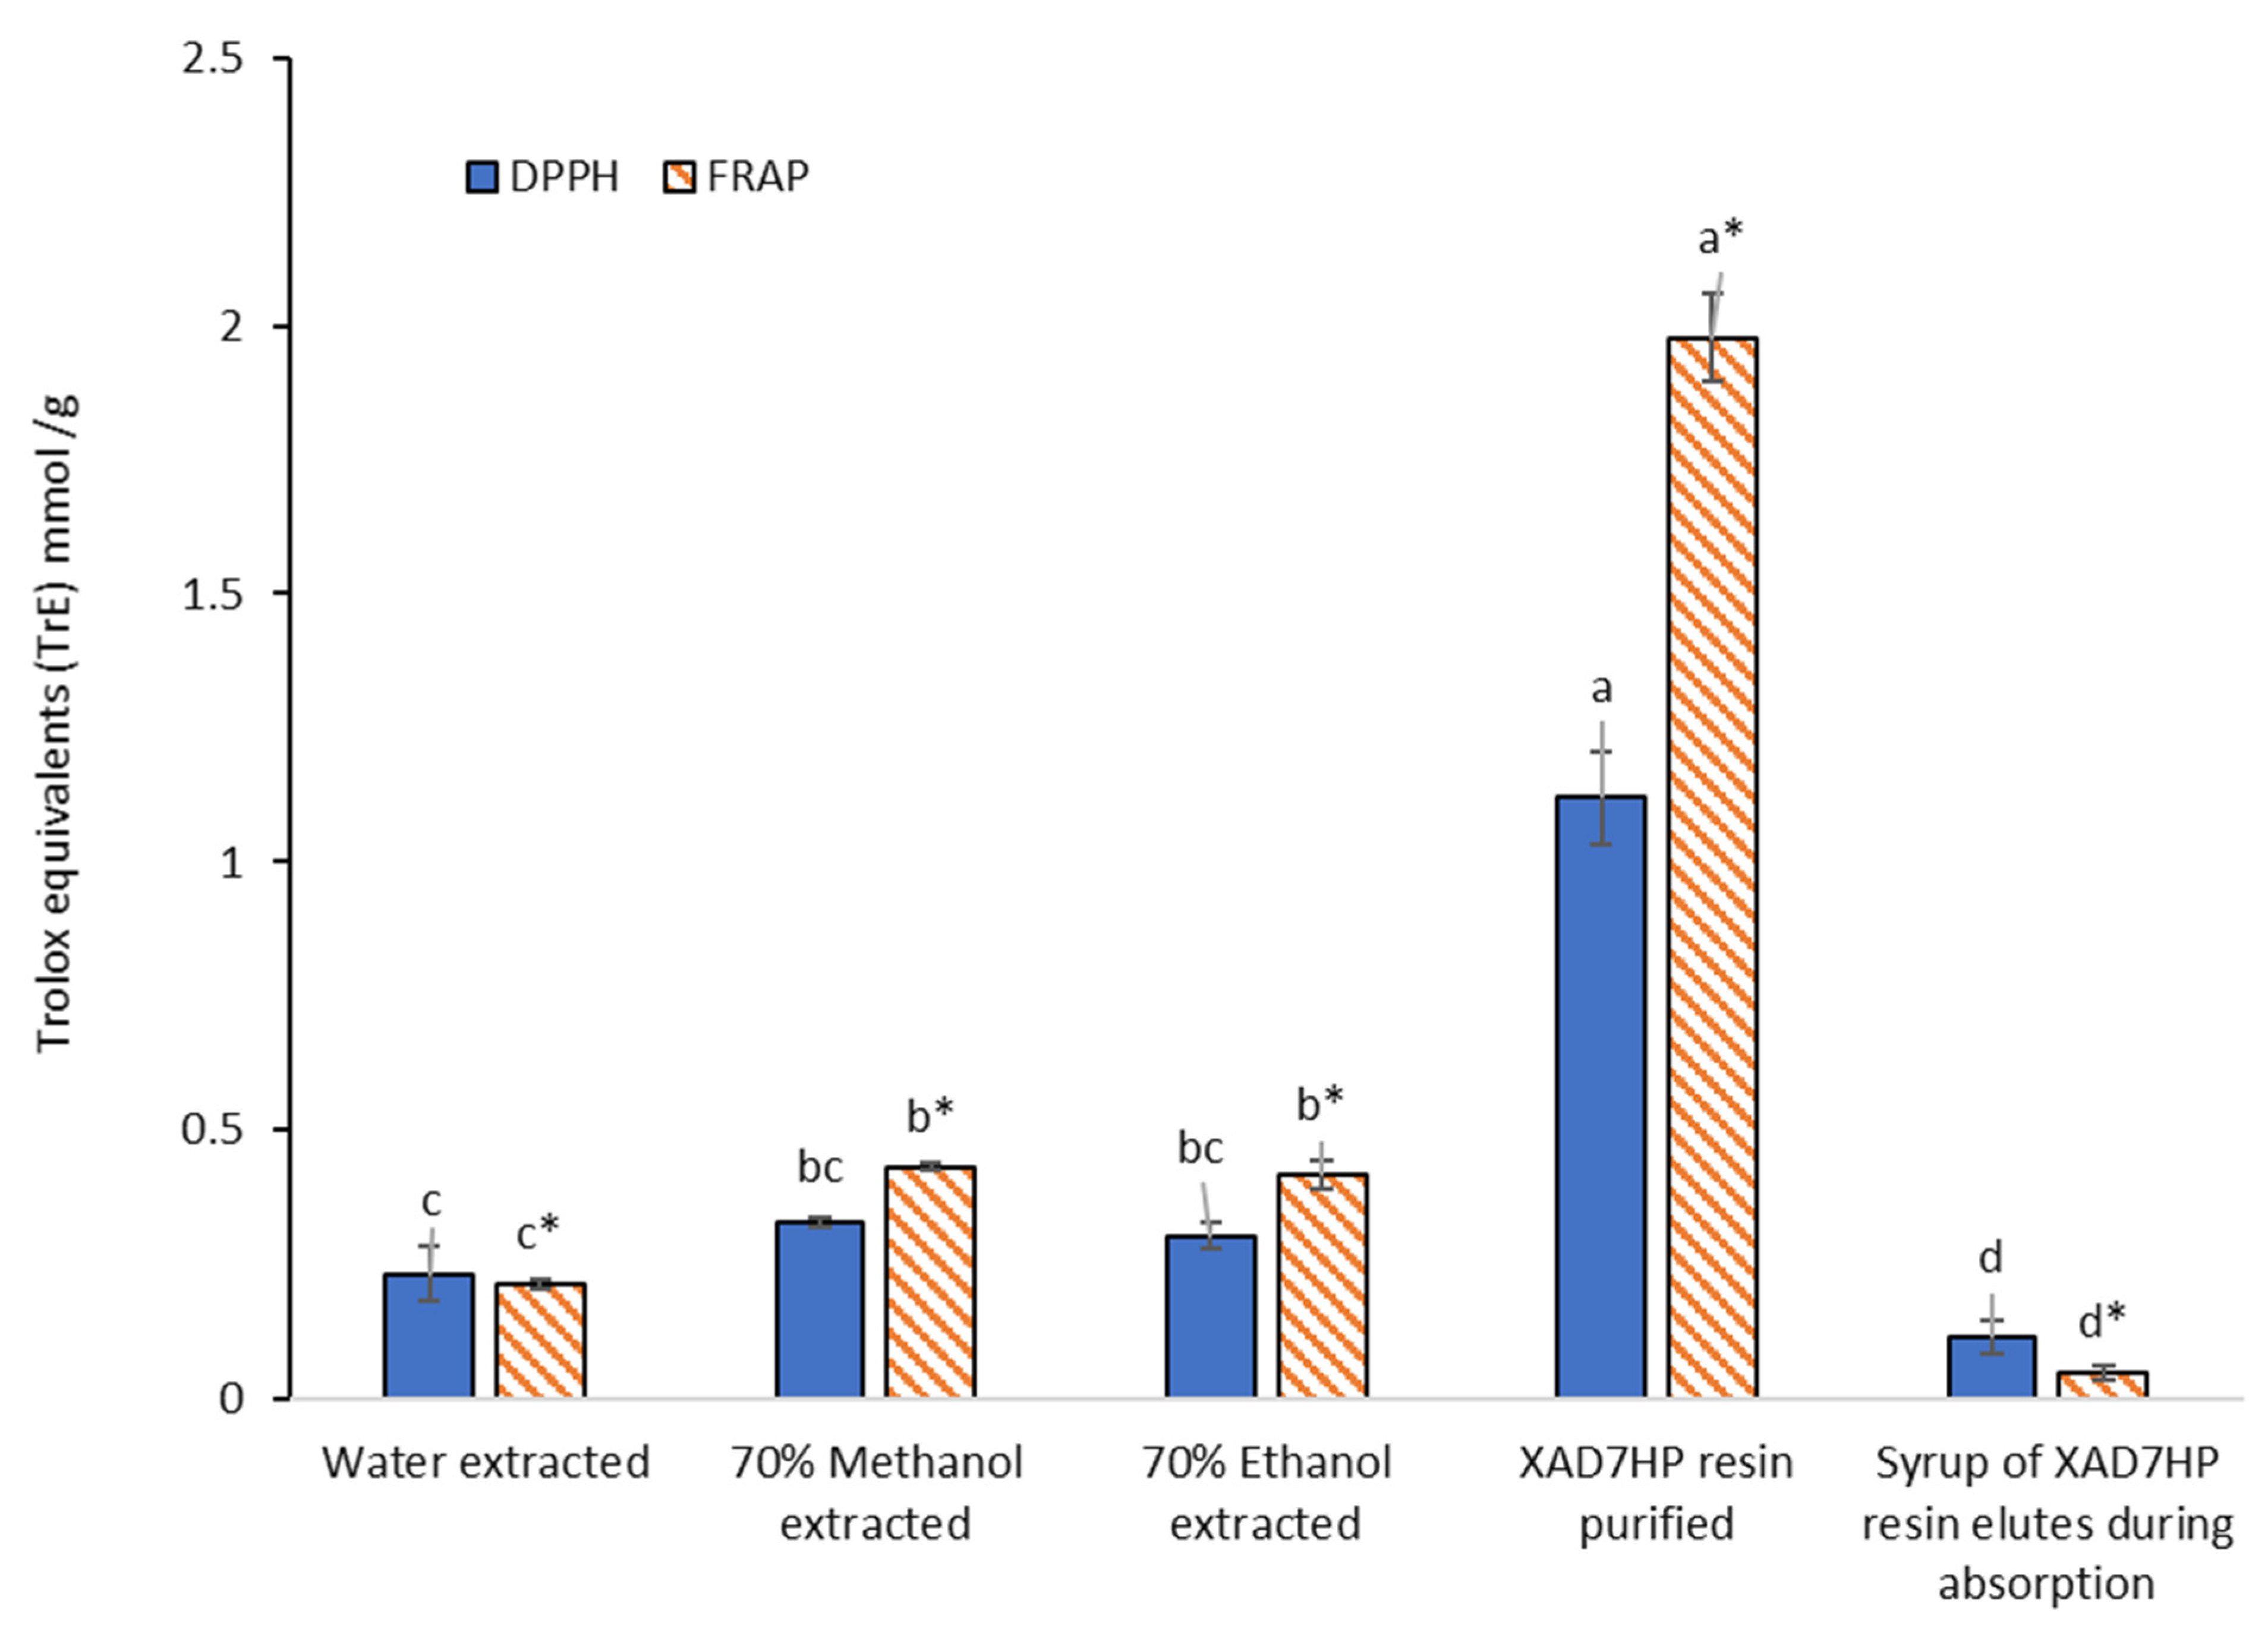
3.5. In Vitro Antioxidant Activities of Olive Pomace Extracts
4. Conclusions
Supplementary Materials
Author Contributions
Funding
Institutional Review Board Statement
Data Availability Statement
Conflicts of Interest
References
- Conte, P.; Fadda, C.; Del Caro, A.; Urgeghe, P.P.; Piga, A. Table Olives: An Overview on Effects of Processing on Nutritional and Sensory Quality. Foods 2020, 9, 514. [Google Scholar] [CrossRef] [PubMed] [Green Version]
- Gómez-Cruz, I.; Cara, C.; Romero, I.; Castro, E.; Gullón, B. Valorisation of Exhausted Olive Pomace by an Eco-Friendly Solvent Extraction Process of Natural Antioxidants. Antioxidants 2020, 9, 1010. [Google Scholar] [CrossRef]
- Antónia Nunes, M.; Pawlowski, S.; Costa, A.S.G.; Alves, R.C.; Oliveira, M.B.P.P.; Velizarov, S. Valorization of olive pomace by a green integrated approach applying sustainable extraction and membrane-assisted concentration. Sci. Total Environ. 2019, 652, 40–47. [Google Scholar] [CrossRef]
- Tundis, R.; Conidi, C.; Loizzo, M.R.; Sicari, V.; Cassano, A. Olive Mill Wastewater Polyphenol-Enriched Fractions by Integrated Membrane Process: A Promising Source of Antioxidant, Hypolipidemic and Hypoglycaemic Compounds. Antioxidants 2020, 9, 602. [Google Scholar] [CrossRef]
- Şahin, S.; Bilgin, M. Selective adsorption of oleuropein from olive (Olea europaea) leaf extract using macroporous resin. Chem. Eng. Commun. 2017, 204, 1391–1400. [Google Scholar] [CrossRef]
- Kammerer, D.R.; Carle, R.; Stanley, R.A.; Saleh, Z.S. Pilot-Scale Resin Adsorption as a Means To Recover and Fractionate Apple Polyphenols. J. Agric. Food Chem. 2010, 58, 6787–6796. [Google Scholar] [CrossRef]
- Tierney, M.; Gallagher, A.M.; Giotis, E.S.; Pentieva, K. An Online Survey on Consumer Knowledge and Understanding of Added Sugars. Nutrients 2017, 9, 37. [Google Scholar] [CrossRef] [PubMed] [Green Version]
- Sinrod, A.J.G.; Avena-Bustillos, R.J.; Olson, D.A.; Crawford, L.M.; Wang, S.C.; McHugh, T.H. Phenolics and Antioxidant Capacity of Pitted Olive Pomace Affected by Three Drying Technologies. J. Food Sci. 2019, 84, 412–420. [Google Scholar] [CrossRef] [PubMed]
- Zhao, H.; Shen, C.; Wu, Z.; Zhang, Z.; Xu, C. Comparison of wheat, soybean, rice, and pea protein properties for effective applications in food products. J. Food Biochem. 2020, 44, e13157. [Google Scholar] [CrossRef]
- Zhang, W.-H.; Wu, J.; Weng, L.; Zhang, H.; Zhang, J.; Wu, A. An improved phenol-sulfuric acid method for the determination of carbohydrates in the presence of persulfate. Carbohydr. Polym. 2020, 227, 115332. [Google Scholar] [CrossRef]
- De Bruno, A.; Romeo, R.; Fedele, F.L.; Sicari, A.; Piscopo, A.; Poiana, M. Antioxidant activity shown by olive pomace extracts. J. Environ. Sci. Health Part B 2018, 53, 526–533. [Google Scholar] [CrossRef]
- Xu, C.; Yagiz, Y.; Zhao, L.; Simonne, A.; Lu, J.; Marshall, M.R. Fruit quality, nutraceutical and antimicrobial properties of 58 muscadine grape varieties (Vitis rotundifolia Michx.) grown in United States. Food Chem. 2017, 215, 149–156. [Google Scholar] [CrossRef]
- Jiang, L.; Shen, X.; Shoji, T.; Kanda, T.; Zhou, J.; Zhao, L. Characterization and Activity of Anthocyanins in Zijuan Tea (Camellia sinensis var. kitamura). J. Agric. Food Chem. 2013, 61, 3306–3310. [Google Scholar] [CrossRef]
- Li, C.; Zheng, Y.; Wang, X.; Feng, S.; Di, D. Simultaneous separation and purification of flavonoids and oleuropein from Olea europaea L.(olive) leaves using macroporous resin. J. Sci. Food Agric. 2011, 91, 2826–2834. [Google Scholar] [CrossRef] [PubMed]
- Peralbo-Molina, Á.; Priego-Capote, F.; Luque de Castro, M.D. Tentative Identification of Phenolic Compounds in Olive Pomace Extracts Using Liquid Chromatography–Tandem Mass Spectrometry with a Quadrupole–Quadrupole-Time-of-Flight Mass Detector. J. Agric. Food Chem. 2012, 60, 11542–11550. [Google Scholar] [CrossRef]
- Zhao, H.; Xie, X.; Read, P.; Loseke, B.; Gamet, S.; Li, W.; Xu, C. Biofortification with selenium and lithium improves nutraceutical properties of major winery grapes in the Midwestern United States. Int. J. Food Sci. Technol. 2021, 56, 825–837. [Google Scholar] [CrossRef]
- D’Amato, R.; De Feudis, M.; Guiducci, M.; Businelli, D. Zea mays L. Grain: Increase in Nutraceutical and Antioxidant Properties Due to Se Fortification in Low and High Water Regimes. J. Agric. Food Chem. 2019, 67, 7050–7059. [Google Scholar] [CrossRef]
- Antónia Nunes, M.; Costa, A.S.G.; Bessada, S.; Santos, J.; Puga, H.; Alves, R.C.; Freitas, V.; Oliveira, M.B.P.P. Olive pomace as a valuable source of bioactive compounds: A study regarding its lipid- and water-soluble components. Sci. Total Environ. 2018, 644, 229–236. [Google Scholar] [CrossRef]
- Aliakbarian, B.; Sampaio, F.C.; de Faria, J.T.; Pitangui, C.G.; Lovaglio, F.; Casazza, A.A.; Converti, A.; Perego, P. Optimization of spray drying microencapsulation of olive pomace polyphenols using Response Surface Methodology and Artificial Neural Network. LWT 2018, 93, 220–228. [Google Scholar] [CrossRef]
- Baiano, A.; Gambacorta, G.; Terracone, C.; Previtali, M.A.; Lamacchia, C.; La Notte, E. Changes in Phenolic Content and Antioxidant Activity of Italian Extra-Virgin Olive Oils during Storage. J. Food Sci. 2009, 74, C177–C183. [Google Scholar] [CrossRef] [PubMed]
- Xu, C.; Yagiz, Y.; Hsu, W.-Y.; Simonne, A.; Lu, J.; Marshall, M.R. Antioxidant, Antibacterial, and Antibiofilm Properties of Polyphenols from Muscadine Grape (Vitis rotundifolia Michx.) Pomace against Selected Foodborne Pathogens. J. Agric. Food Chem. 2014, 62, 6640–6649. [Google Scholar] [CrossRef]
- Parniakov, O.; Apicella, E.; Koubaa, M.; Barba, F.J.; Grimi, N.; Lebovka, N.; Pataro, G.; Ferrari, G.; Vorobiev, E. Ultrasound-assisted green solvent extraction of high-added value compounds from microalgae Nannochloropsis spp. Bioresour. Technol. 2015, 198, 262–267. [Google Scholar] [CrossRef] [PubMed]
- Rodríguez-Rojo, S.; Visentin, A.; Maestri, D.; Cocero, M.J. Assisted extraction of rosemary antioxidants with green solvents. J. Food Eng. 2012, 109, 98–103. [Google Scholar] [CrossRef] [Green Version]
- Pinelli, D.; Molina Bacca, A.E.; Kaushik, A.; Basu, S.; Nocentini, M.; Bertin, L.; Frascari, D. Batch and Continuous Flow Adsorption of Phenolic Compounds from Olive Mill Wastewater: A Comparison between Nonionic and Ion Exchange Resins. Int. J. Chem. Eng. 2016, 2016, 9349627. [Google Scholar] [CrossRef] [Green Version]
- Niknam, S.M.; Kashaninejad, M.; Escudero, I.; Sanz, M.T.; Beltrán, S.; Benito, J.M. Valorization of olive mill solid residue through ultrasound-assisted extraction and phenolics recovery by adsorption process. J. Clean. Prod. 2021, 316, 128340. [Google Scholar] [CrossRef]
- Katsinas, N.; Bento da Silva, A.; Enríquez-de-Salamanca, A.; Fernández, N.; Bronze, M.R.; Rodríguez-Rojo, S. Pressurized Liquid Extraction Optimization from Supercritical Defatted Olive Pomace: A Green and Selective Phenolic Extraction Process. ACS Sustain. Chem. Eng. 2021, 9, 5590–5602. [Google Scholar] [CrossRef]
- Yuan, J.-J.; Wang, C.-Z.; Ye, J.-Z.; Tao, R.; Zhang, Y.-S. Enzymatic Hydrolysis of Oleuropein from Olea europea (Olive) Leaf Extract and Antioxidant Activities. Molecules 2015, 20, 2903–2921. [Google Scholar] [CrossRef] [PubMed] [Green Version]
- Heinonen, J.; Farahmandazad, H.; Vuorinen, A.; Kallio, H.; Yang, B.; Sainio, T. Extraction and purification of anthocyanins from purple-fleshed potato. Food Bioprod. Process. 2016, 99, 136–146. [Google Scholar] [CrossRef]
- Sandhu, A.K.; Gu, L. Adsorption/Desorption Characteristics and Separation of Anthocyanins from Muscadine (Vitis rotundifolia) Juice Pomace by Use of Macroporous Adsorbent Resins. J. Agric. Food Chem. 2013, 61, 1441–1448. [Google Scholar] [CrossRef]
- Vavouraki, A.I.; Dareioti, M.A.; Kornaros, M. Olive Mill Wastewater (OMW) polyphenols adsorption onto polymeric resins: Part i—batch anaerobic digestion of OMW. Waste Biomass Valorization 2021, 12, 2271–2281. [Google Scholar] [CrossRef]
- Li, G.; Zhan, J.; Hu, L.; Yuan, C.; Takaki, K.; Ying, X.; Hu, Y. Identification of a new antioxidant peptide from porcine plasma by in vitro digestion and its cytoprotective effect on H2O2 induced HepG2 model. J. Funct. Foods 2021, 86, 104679. [Google Scholar] [CrossRef]
- Lewoyehu, M.; Amare, M. Comparative evaluation of analytical methods for determining the antioxidant activities of honey: A review. Cogent Food Agric. 2019, 5, 1685059. [Google Scholar] [CrossRef]
- Bartella, L.; Mazzotti, F.; Talarico, I.R.; Santoro, I.; Di Donna, L. Hydroxytyrosol-Fortified Foods Obtained by Supercritical Fluid Extraction of Olive Oil. Antioxidants 2021, 10, 1619. [Google Scholar] [CrossRef] [PubMed]


| Nutritional Component | Contents % |
|---|---|
| Protein | 10.28 ± 0.11 |
| Moisture | 2.83 ± 0.08 |
| Fat | 11.72 ± 0.07 |
| Ash | 9.02 ± 0.04 |
| Total carbohydrates | 66.15 |
| No. | Tentatively Identified Compounds | Retention Time (min) | MW/Da | MS (m/z) [M-H]− | MS/MS (m/z) | Molecular Structure |
|---|---|---|---|---|---|---|
| 01 | Vanillin-glucoside | 3.25 | 448.15 | 447.15 | 447.15, 315.11, 169.05, 153.06, 123.05 | NA |
| 02 | Gallic acid | 4.62 | 170.05 | 169.05 | 141.02, 123.01 |  |
| 03 | Hydroxytyrosol-glucoside | 7.32 | 316.11 | 315.11 | 153.06, 123.05, 101.02 | NA |
| 04 | Hydroxytyrosol | 8.13 | 154.16 | 153.06 | 123.05, 109.03, 101.02 |  |
| 05 | Tyrosol-glucoside | 10.23 | 300.14 | 299.14 | 183.06, 139.07, 119.04, 101.02 | NA |
| 06 | Tyrosol | 12.14 | 138.16 | 137.16 | 119.04, 101.03 |  |
| 07 | 4-Hydroxyphenylacetate (4-HPA) | 13.34 | 152.15 | 151.04 | 163.04, 123.05 |  |
| 08 | Vanillic acid | 15.22 | 168.03 | 167.03 | ND |  |
| 09 | Caffeic acid | 16.12 | 180.06 | 179.06 | ND |  |
| 10 | Vanillin | 19.22 | 152.15 | 151.04 | 123.05, 139.00 |  |
| 11 | p-coumaric acid | 21.62 | 164.04 | 163.04 | 119.04, 101.02 |  |
| 12 | Ferulic acid | 23.38 | 195.06 | 194.06 | 151.04, 135.04 |  |
| 13 | Verbascoside | 25.78 | 624.59 | 623.20 | 458.20, 461.15, 151.04 |  |
| 14 | Rutin | 25.25 | 610.52 | 609.52 | 609.15, 301.03 | 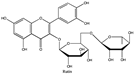 |
| 15 | Luteolin-7-glucoside | 26.25 | 448.09 | 447.09 | 285.04 | 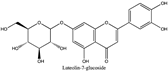 |
| 16 | o-coumaric acid | 28.08 | 165.05 | 164.05 | ND |  |
| 17 | Apigenin-7-glucoside | 30.30 | 432.38 | 431.38 | ND | 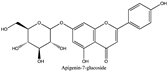 |
| 18 | 3,4-DHPEA-EDA | 31.59 | 320.12 | 319.12 | 139.08, 123.05 | NA |
| 19 | Oleuropein | 33.45 | 540.18 | 539.18 | 377.12, 307.08, 275.09 | 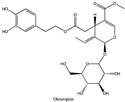 |
| 20 | Pinoresinol | 39.47 | 358.10 | 357.10 | 341.12, 151.04 |  |
| 21 | Cinnamic acid | 41.30 | 148.16 | 147.16 | ND |  |
| 22 | Luteolin | 42.31 | 286.04 | 285.04 | 217.00 |  |
| 23 | Apigenin | 46.27 | 270.04 | 269.04 | 241.07, 141.02 | 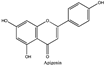 |
| Name | Water Extractable Phenols in DOP | 70% Methanol Extractable Phenols in DOP | 70% Ethanol Extractable Phenols in DOP | Water Extracted Dry Paste | 70% Methanol Extracted Dry Paste | 70% Ethanol Extracted Dry Paste | XAD7HP Resin Purified Freeze-Dried Powders |
|---|---|---|---|---|---|---|---|
| 01. Vanillin-glucoside | 0.165 ± 0.004 | 0.054 ± 0.002 | 0.225 ± 0.021 | 0.151 ± 0.001 | 0.155 ± 0.001 | 0.152 ± 0.000 | 0.187 ± 0.002 |
| 02. Gallic acid | 0.223 ± 0.006 | 0.045 ± 0.004 | 0.000 ± 0.009 | 0.007 ± 0.002 | 0.008 ± 0.011 | 0.010 ± 0.003 | −0.018 ± 0.026 |
| 03. Hydroxytyrosol-glucoside | 1.407 ± 0.034 | 0.657 ± 0.024 | 0.250 ± 0.006 | 1.423 ± 0.006 | 1.475 ± 0.034 | 1.480 ± 0.003 | 4.423 ± 0.278 |
| 04. Hydroxytyrosol | 1.978 ± 0.039 | 2.017 ± 0.089 | 1.356 ± 0.054 | 3.508 ± 0.500 | 3.880 ± 0.027 | 4.219 ± 0.459 | 17.298 ± 0.363 |
| 05. Tyrosol-glucoside | 1.096 ± 0.022 | 0.679 ± 0.026 | 0.384 ± 0.018 | 1.555 ± 0.031 | 1.581 ± 0.006 | 1.639 ± 0.085 | 6.519 ± 0.421 |
| 06. Tyrosol | 0.460 ± 0.008 | 0.365 ± 0.008 | 0.162 ± 0.012 | 0.624 ± 0.014 | 0.811 ± 0.091 | 0.666 ± 0.002 | 3.514 ± 0.060 |
| 07. 4-HPA | 1.700 ± 0.044 | 0.800 ± 0.027 | 0.660 ± 0.023 | 1.691 ± 0.005 | 1.755 ± 0.013 | 1.742 ± 0.010 | 4.450 ± 0.021 |
| 08. Vanillic acid | 0.203 ± 0.004 | 0.208 ± 0.007 | 0.223 ± 0.004 | 0.509 ± 0.044 | 0.609 ± 0.009 | 0.585 ± 0.001 | 2.530 ± 0.018 |
| 09. Caffeic acid | 0.050 ± 0.001 | 0.044 ± 0.002 | 0.039 ± 0.002 | 0.073 ± 0.011 | 0.102 ± 0.009 | 0.091 ± 0.001 | 0.420 ± 0.001 |
| 10. Vanillin | 0.371 ± 0.005 | 0.329 ± 0.014 | 0.375 ± 0.011 | 0.285 ± 0.044 | 0.385 ± 0.006 | 0.269 ± 0.001 | 2.439 ± 0.027 |
| 11. p-coumaric acid | 0.084 ± 0.006 | 0.097 ± 0.003 | 0.086 ± 0.004 | 0.131 ± 0.001 | 0.168 ± 0.001 | 0.157 ± 0.000 | 0.884 ± 0.002 |
| 12. Ferulic acid | 0.047 ± 0.001 | 0.023 ± 0.002 | 0.029 ± 0.001 | 0.043 ± 0.003 | 0.046 ± 0.000 | 0.047 ± 0.000 | 0.326 ± 0.012 |
| 13. Verbascoside | 0.833 ± 0.007 | 1.074 ± 0.035 | 1.232 ± 0.037 | 1.135 ± 0.003 | 1.858 ± 0.016 | 1.507 ± 0.000 | 10.159 ± 0.052 |
| 14. Rutin | 0.770 ± 0.011 | 1.360 ± 0.050 | 1.031 ± 0.035 | 0.791 ± 0.019 | 2.409 ± 0.216 | 2.108 ± 0.120 | 11.048 ± 0.003 |
| 15. Luteolin-7-glucoside | 0.042 ± 0.000 | 0.042 ± 0.000 | 0.042 ± 0.000 | 0.312 ± 0.236 | 0.175 ± 0.000 | 0.785 ± 0.529 | 4.086 ± 0.022 |
| 16. o-coumaric acid | 0.101 ± 0.000 | 0.070 ± 0.000 | 0.070 ± 0.000 | 0.352 ± 0.041 | 0.416 ± 0.004 | 0.369 ± 0.001 | 1.562 ± 0.005 |
| 17. Apigenin-7-glucoside | 0.055 ± 0.000 | 0.121 ± 0.003 | 0.088 ± 0.001 | 0.293 ± 0.012 | 0.341 ± 0.002 | 0.336 ± 0.001 | 1.345 ± 0.034 |
| 18. Oleuropein | 0.811 ± 0.012 | 1.270 ± 0.324 | 0.930 ± 0.093 | 1.298 ± 0.188 | 2.609 ± 0.073 | 2.393 ± 0.052 | 12.231 ± 0.066 |
| 19. Pinoresinol | 0.084 ± 0.001 | 0.257 ± 0.005 | 0.175 ± 0.012 | 0.300 ± 0.087 | 0.478 ± 0.136 | 0.461 ± 0.025 | 2.775 ± 0.495 |
| 20. Cinnamic acid | 0.027 ± 0.002 | 0.019 ± 0.000 | 0.013 ± 0.004 | 0.012 ± 0.000 | 0.043 ± 0.024 | 0.063 ± 0.004 | 0.205 ± 0.111 |
| 21. Luteolin | 0.010 ± 0.000 | 0.487 ± 0.016 | 0.515 ± 0.034 | 0.041 ± 0.000 | 0.714 ± 0.003 | 0.678 ± 0.001 | 3.515 ± 0.003 |
| 22. Apigenin | 0.007 ± 0.000 | 0.062 ± 0.004 | 0.066 ± 0.004 | 0.030 ± 0.000 | 0.111 ± 0.006 | 0.107 ± 0.007 | 0.469 ± 0.031 |
Publisher’s Note: MDPI stays neutral with regard to jurisdictional claims in published maps and institutional affiliations. |
© 2022 by the authors. Licensee MDPI, Basel, Switzerland. This article is an open access article distributed under the terms and conditions of the Creative Commons Attribution (CC BY) license (https://creativecommons.org/licenses/by/4.0/).
Share and Cite
Zhao, H.; Avena-Bustillos, R.J.; Wang, S.C. Extraction, Purification and In Vitro Antioxidant Activity Evaluation of Phenolic Compounds in California Olive Pomace. Foods 2022, 11, 174. https://doi.org/10.3390/foods11020174
Zhao H, Avena-Bustillos RJ, Wang SC. Extraction, Purification and In Vitro Antioxidant Activity Evaluation of Phenolic Compounds in California Olive Pomace. Foods. 2022; 11(2):174. https://doi.org/10.3390/foods11020174
Chicago/Turabian StyleZhao, Hefei, Roberto J. Avena-Bustillos, and Selina C. Wang. 2022. "Extraction, Purification and In Vitro Antioxidant Activity Evaluation of Phenolic Compounds in California Olive Pomace" Foods 11, no. 2: 174. https://doi.org/10.3390/foods11020174
APA StyleZhao, H., Avena-Bustillos, R. J., & Wang, S. C. (2022). Extraction, Purification and In Vitro Antioxidant Activity Evaluation of Phenolic Compounds in California Olive Pomace. Foods, 11(2), 174. https://doi.org/10.3390/foods11020174