Article

International Collaboration in Open Access Publications: How Income Shapes International Collaboration

1
Division of Resource Economics and Management, West Virginia University, Morgantown, WV 26506, USA
2
Department of English, West Virginia University, Morgantown, WV 26506, USA
*
Author to whom correspondence should be addressed.
Publications 2020, 8(1), 13; https://doi.org/10.3390/publications8010013
Submission received: 31 December 2019 / Revised: 3 February 2020 / Accepted: 26 February 2020 / Published: 28 February 2020

Abstract

:
Does the rise of open access journals change the way researchers collaborate? Specifically, since publishing in open access journals requires a publication fee, does income affect how researchers form international collaborations? To answer this question, we create a new data set by scraping bibliographic data from Multidisciplinary Digital Publishing Institute (MDPI) journals. Using the four income group classifications from the World Bank Analytical Classifications, we find that researchers from low-income nations are more likely to form international collaborations than researchers from wealthier nations. This result is verified to be significant using a series of pairwise Kolmogorov–Smirnov tests. We then study which nations most frequently form international collaborations with other nations and find that the USA, China, Germany, and France are the most preferred nations for forming international collaborations. While most nations prefer to form international collaborations with high-income nations, some exceptions exist, where a nation most often forms international collaborations with a nearby nation that is either an upper-middle-income or lower-middle-income nation. We further this analysis by showing that these results are apparent across the six different research categories established in the Frascati Manual. Finally, trends in publications in MDPI journals mirror trends seen in all journals, such as the continued increase in the percentage of published papers involving international collaboration.
JEL Classification:
D85; I23; L14; Y10

Graphical Abstract

1. Introduction

Open access journals offer authors greater visibility for their work in exchange for a fee. This deviation from the traditional, subscription-based model of academic publishing affects authors in a heterogeneous manner. Authors with less access to funding are relatively disadvantaged when attempting to publish in an open access journal [1]. Differences in income should incentivize different behavior by researchers when it comes to collaboration and publication compared to the traditional publishing model.
Due to the costs associated with publishing in an open access journal, researchers are concerned with more than the quality of their research. Finding funding to cover the costs of open access publishing represents an additional barrier to publishing beyond those of the research process itself. While some researchers may have access to funds for publishing their research in open access journals, this is certainly not the case for all researchers [1]. For researchers in low-income nations, forming international collaborations, especially with researchers from wealthier nations who are more likely to have the funds required to publish in open access journals, is a strategy that can help increase the visibility of their research and, consequentially, improve the trajectory of their careers.
In order to determine how researchers behave when publishing in open access journals, we created a brand new data set comprised of bibliographic data from articles published in Multidisciplinary Digital Publishing Institute (MDPI) journals. This data set allows for the identification of instances of specific international collaborations between scholars from different countries. This allows for researchers to see which nations collaborate, how often these collaborations occur, and how these frequencies change over time. The highlight of this data set is that it contains frequencies of international collaborations between specific countries by year for all pairs of countries from 1996 through 2018. This data set is available for free online along with all of the code used to create this data set in the “2018_Initial” directory within the repository https://github.com/cat-astrophic/MDPI. Using these data, we provide evidence that researchers from low-income nations form international collaborations more frequently than researchers from wealthier nations. In fact, most nations prefer to form international collaborations with high-income nations. These results provide evidence that the financial barrier to publishing in open access journals does indeed contribute to the process of publishing scholarly research.

2. Literature Review

From an economic perspective, the creation of scholarly works can be viewed as a production process. Inputs include human capital, physical capital, financial capital, and labor, and the outputs are scholarly publications. Researchers not only want to produce publications, but to do so as efficiently as possible. This means producing publications with minimized costs for each constraint (e.g., labor, financial, etc.). Collaborations allow researchers to increase available inputs and share the various costs of production, thereby limiting potential barriers to producing and publishing research. In fact, scholarly publications and citations thereof exhibit an economy of scale with respect to the number of different nations contributing to the work [2]. This means that as the number of different nations contributing to a research project increases, the impact of that project, as measured by citations, increases.
Collaboration in research and development (R&D) is known to ease the financial constraints involved [3]. In addition to the importance of funding, Katz and Martin [4] provided an extensive list of other contributing factors which included increasing scientific recognition and popularity, increasing specialization, increasing desires to work in interdisciplinary environments, and increasing labor constraints. In the context of publishing research in open access journals, this would also include easing the financial burden of paying publication fees. Collaboration offers the potential to ease all of these constraints, from labor to intellectual to financial.
In addition to funding from governments and non-governmental organizations (NGOs), grants and other funding from the private sector are becoming increasingly common in academia, especially in Organisation for Economic Co-operation and Development (OECD) member nations [5]. In addition to peer-reviewed publications in scholarly journals, funding from the private sector also leads to increases in patents and research that supports positions held by industry [6,7]. Even though there are a few cases of journals reverting from open access to subscription models [8], the importance of the financial constraint is only magnified when considering the rapid growth of the open access publishing model in the current century [9].
In the context of international collaboration, increased national R&D expenditures are known to lead to increases in international collaboration in scholarly publication [10,11]. However, increased national R&D expenditure is not the only important factor in forming international collaborations, especially in developing nations. While open access publications can be viewed freely, a sufficient level of infrastructure is necessary in order to reap this benefit. In an economic framework, this would be the physical capital component. Internet access in developing nations is critical to disseminating knowledge in general [12], and could prove critical in acquiring, preserving, and disseminating indigenous knowledge specifically [13]. This lack of infrastructure is partially responsible for the non-uniform collaboration tendencies across Africa [14].
In addition to the financial and physical capital constraints, human capital is also a crucial component which motivates the formation of international collaborations. This would include the sharing of ideas, which is fundamental to research and is a large motivation of the formation of collaborations, and, in many cases, the sharing of data and software. Open source software is a key component of open access and the reproducibility of research [15,16] and is widely viewed as a critical part of knowledge dissemination in developing nations [17]. Additionally, overcoming the bias against non-native English speakers that exists in the peer-review process is an additional possible motivator for non-native English speakers to form international collaborations [18]. Another motivation for developing international collaborations comes from what is known as the reverse brain drain, where students from developing countries graduate with their PhDs from universities in developed nations and return to their native countries. The effect of the reverse brain drain has been an increase in the formation of international collaborations [19]. Consequentially, these effects have been generalized into the notion of brain circulation, in which ideas circulate with researchers as they maximize their own welfare as individuals [20]. Throughout this paper, publications can be viewed as a proxy for the welfare of researchers, since career advancement is, in the current paradigm, inexorably linked to publications.
Studies discerning which nations form international collaborations have shown that international collaborations on scholarly publications are increasing rapidly [21]. Exemplarily, China has experienced exponential growth in papers coauthored with G7 nations [22]. Elsewhere in Asia, most other nations sought collaborations primarily with developed western nations, including the USA [23,24], with India in particular being no exception [25]. Several network analyses have also concluded that the relatively more developed western nations form the core of the international collaboration network [26,27,28]. There is evidence that the increase in international collaboration found its beginnings in the sciences [29,30,31,32], although more contemporary studies show that the patterns of growth in international collaborations are fairly similar across disciplines [33].
Far fewer studies of this nature that are constrained to strictly open access journals exist. This could partially be caused by the fact that open access journals are still not widely popular in developed nations [34]. A recent study which analyzed some 5208 open access publications found that publications were typified by having a single author [35]. While this result is no doubt accurate, the small sample size (5208) and the fact that more than half of the papers included had the first author from the USA combine to cast doubt as to whether this sample was truly representative of open access publications in general.

3. Data Collection Process

The raw data we obtained consist of bibliographic data from papers published in MDPI journals. In particular, we wanted to collect data consisting of the national affiliation (of the research institution) of each author. As a result, the data in their rawest form consist of the year that the paper was published, the journal in which it was published, and the complete affiliation data for all authors of the paper. These data were then used to create a data set consisting of the number of papers containing a collaboration between two countries. As an example, if a given paper was authored by at least one researcher from each of Canada, Mexico, and the United States, then we would acknowledge a collaboration between Canada and Mexico, a collaboration between Canada and the United States, and a collaboration between Mexico and the United States. This data set is available for each year as well as for the entire time period from 1996 to 2018. This data set was then analyzed in further detail to answer specific questions for this paper.
The process of creating this data set consisted of four major steps: (1) Locating all papers published in MDPI journals, (2) collecting the bibliographic data from each of these papers, (3) cleaning the raw data, and (4) organizing the data. Before describing the data collection process, we mention again that all of the software developed to create this data set, along with all of the data, is available under the “2018_Initial” directory of the repository located at https://github.com/cat-astrophic/MDPI. All scripts are freely available for consumption and may be modified to fulfill different research requirements.
The first step in the process of creating this data set, locating all papers published in MDPI journals, was achieved by using the script MDPI.py. This script parses each page of search results from a search query for all papers published in MDPI journals through the end of 2018 and returns the complete set of urls for all papers as a list. The search query returned 194,049 results, i.e., 194,049 papers published in MDPI journals as of the end of 2018, and the script MDPI.py did indeed return a list containing all 194,049 urls.
Once all of the urls were obtained, the next step was to scrape the bibliographic data from each paper. This was done using the script MDPI_scraper.py. This script goes to each url, identifies the year of publication, the journal in which the paper was published, and the affiliations of all authors, scrapes these data, and stores them in a single data frame. This data frame is then saved as a csv file (which is available in the aforementioned repository as papers_all.zip). Of the 194,049 papers published in MDPI journals through the end of 2018, MDPI_scraper.py returned consumable data for 190,602 of the 194,049 papers (a 98.22% success rate).
The third script, MDPI_annual_data.py, creates data frames for each year containing all data scraped by MDPI_scraper.py from that year. The purpose of doing this is to create smaller data files that are still easily used by personal computers that may have little RAM, especially considering that researchers may be interested in only a small subset of the years for which data were available (publications in MDPI journals date as far back as 1996). The data frames containing annual data are saved as csv files and are available in the repository collectively as papers_by_year.zip.
The fourth script, MDPI_interaction_matrix.py, creates a matrix indicating the number of collaborations between each pair of countries. In order to do this, the data from the 190,602 papers for which MDPI_scraper.py returned consumable data were cleaned and national affiliations were obtained. To ensure accuracy, this process relied heavily on manual inspection rather than using fuzzy matching methods or other matching techniques. Ultimately, bibliographic data for 190,186 papers were obtained. This reflects a 99.78% success rate for papers for which MDPI_scraper.py returned consumable data in step 2, and a 98.01% success rate for all papers published in MDPI journals as of the end of 2018.
Again, we mention that all code developed for the creation of this data set as well as all data files are available in the “2018_Initia” directory within the repository at https://github.com/cat-astrophic/MDPI.

4. Income and International Collaboration

In this section, we study how income affects the decision of authors to form international collaborations. To do this, we adopt the Analytical Classifications system used by the World Bank [36,37]. This classification scheme classifies nations into four income groups based on per capita gross national income (GNI), and thresholds increase over time. The income groups are: High Income, Upper Middle Income, Lower Middle Income, and Low Income. Since the data collected cover the time period from 1996 through 2018, and since the World Bank Analytical Classifications are very consistent over time for individual nations, the income group classifications we use for nations are from the World Bank Analytical Classification for the year 2008, a midpoint in the data set.
The primary benefit of studying how income affects the development of international collaboration in the context of open access publishing is to determine whether or not the behavior of researchers changes with respect to income as economics suggests it should. Specifically, given that both research and open access publication are costly, economics tells us that researchers from less wealthy nations would have the most to gain from forming international collaborations because, on average, we would expect that they would be the least likely to independently finance the costs of research or the publication fees associated with publishing in open access journals. In the context of journals using subscription-based publication models, previous studies have shown that lower-income nations are more likely to collaborate with higher-income nations [38]. Since the open access publication model only adds additional costs to the process of producing a peer-reviewed publication, we would expect that these results would, if anything, be strengthened in the context of open access publishing. In order to provide evidence that researchers from low-income nations form international collaborations more often than researchers from wealthier nations, we first study the frequency of the formation of collaborations by researchers in each income group.
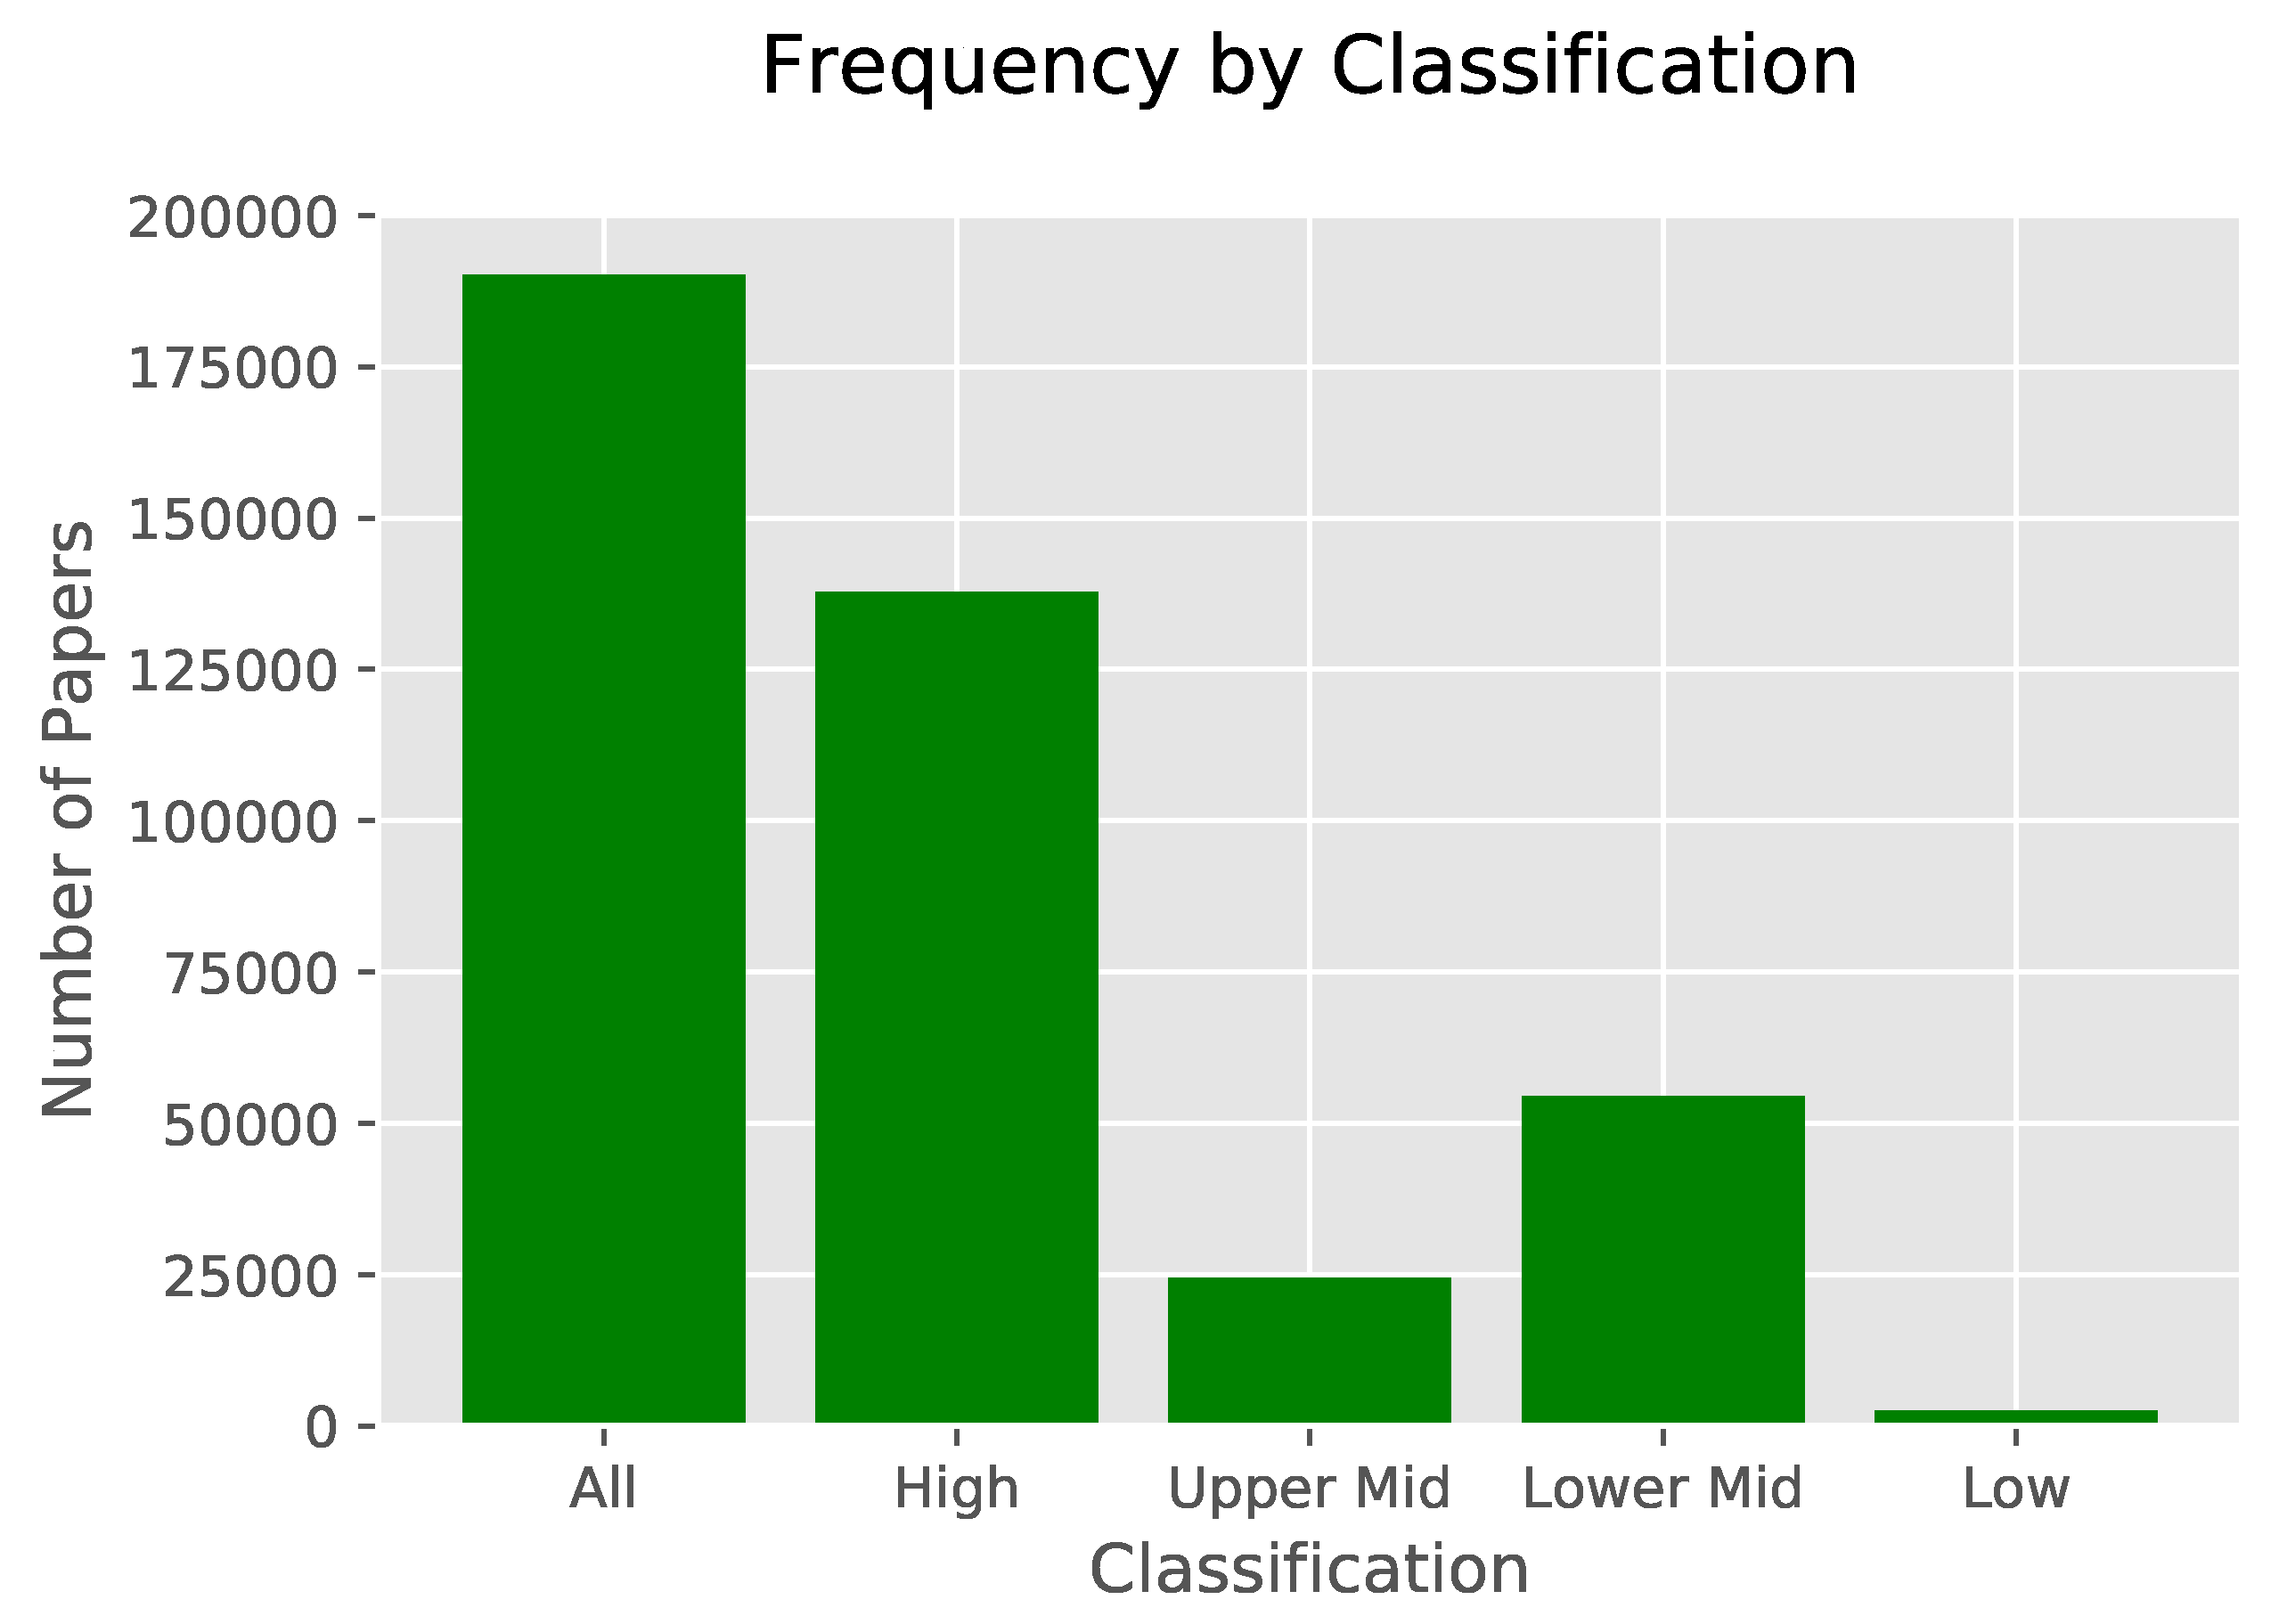
Of the 190,186 articles from which we acquired bibliographic data, 137,786 (72.45%) had an author from a high-income nation, 24,403 (12.83%) had an author from an upper-middle-income nation, 54,412 (28.61%) had an author from a middle-income nation, and 2,573 (1.35%) had an author from a low-income nation. Due to international collaborations which include nations from multiple income groups, these percentages exceed 100%. These observations are presented in Figure 1 with annual counts provided in Table 1.
When considering the financial constraint in open access publishing, we might expect that the upper-middle-income group would have contributed to more papers than the lower-middle-income group. This is not the case primarily due to the population difference between the two groups. In particular, China is labeled as a lower-middle-income nation by the World Bank Analytical Classifications system. This means that the collective population of the lower-middle-income group is much larger than that of the upper-middle-income group, as well as that the lower-middle-income group includes a nation (China) which has invested heavily in R&D. To help clarify the magnitude of contributions from each income group, we provide in Table 2 the collective population, total number of papers published in MDPI, and a per capita measure of MDPI publications by income group using 2018 population data from [39]. Table 3 provides a complete list of which countries belong to which income group as a reference for the reader. Once the massive population share of the lower-middle-income group is accounted for, we see that publications per capita decrease with decreases in income. However, largely due to the contributions by Chinese scholars, the gap in per capita publications between the high- and upper-middle-income groups is much greater than the per capita publications gap between the upper-middle- and lower-middle-income groups.
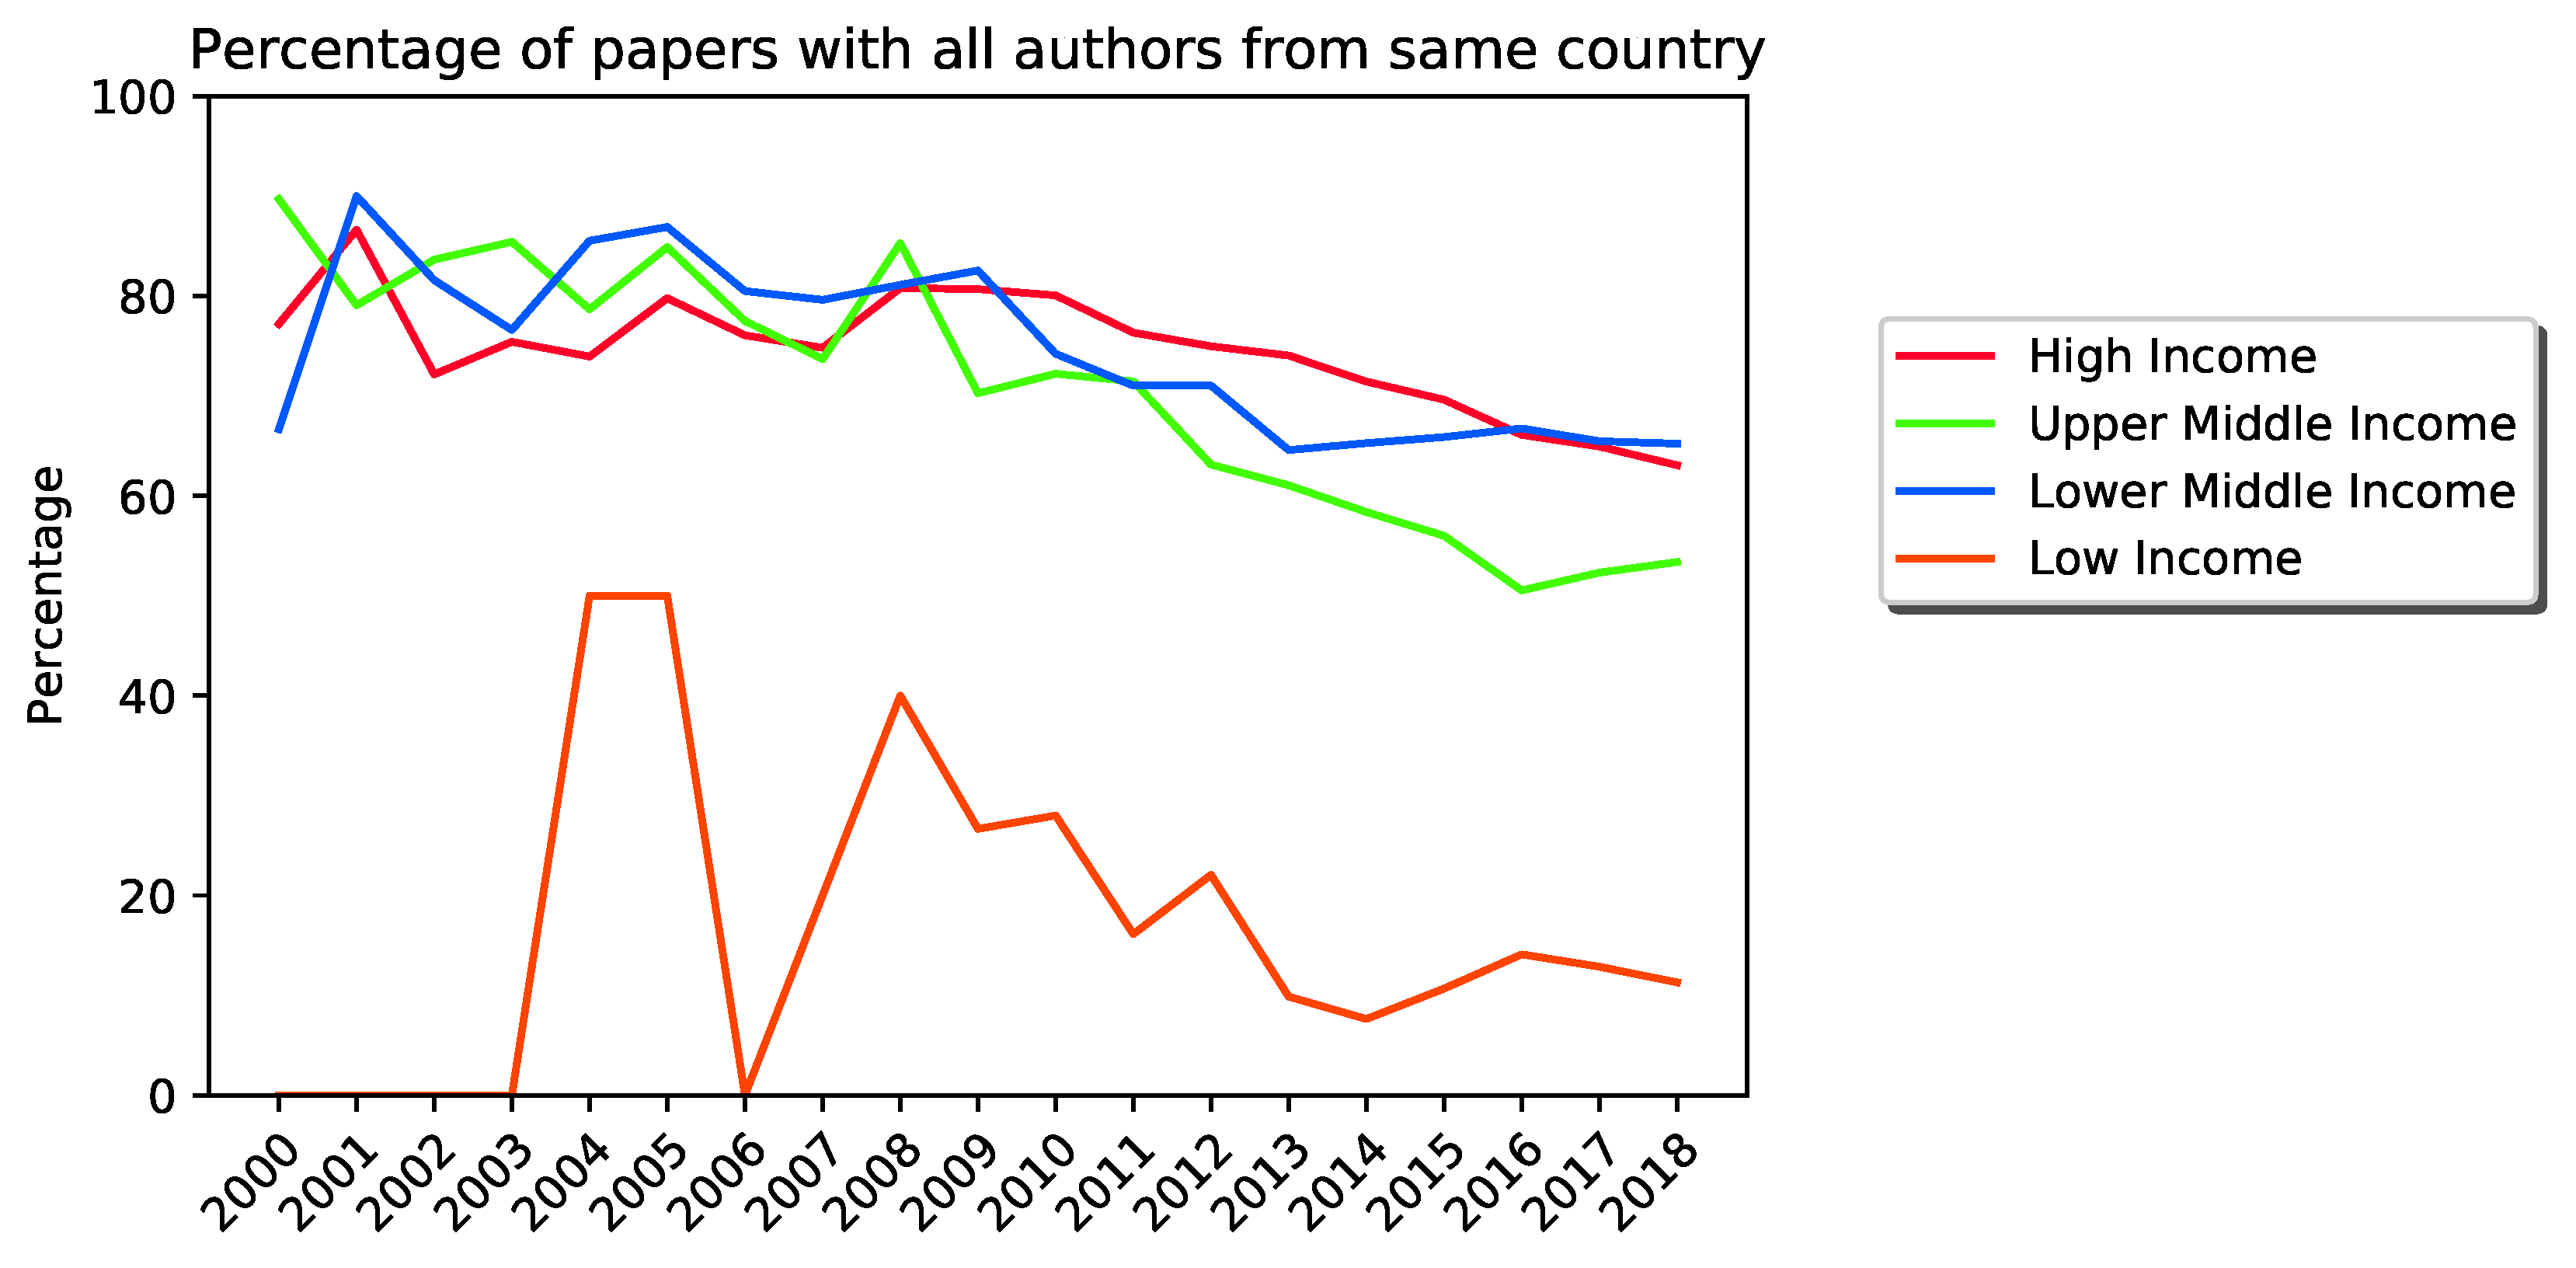
When analyzing the number of different nations represented in papers published in MDPI journals, we find that most papers (75.18%) have authors from only one country. This result confirms what was found with a small sample of papers published in open access by [35]. This behavior is also consistent with what is observed in journals with subscription-based publishing models. This provides strong evidence that researchers view open access journals generally, and MDPI journals specifically, as substitutes for journals using subscription-based publishing models. Additionally, the long-term trend of increasing international collaboration observed in journals with subscription-based publishing models is observed in all four income groups in this study, as seen in Figure 2.
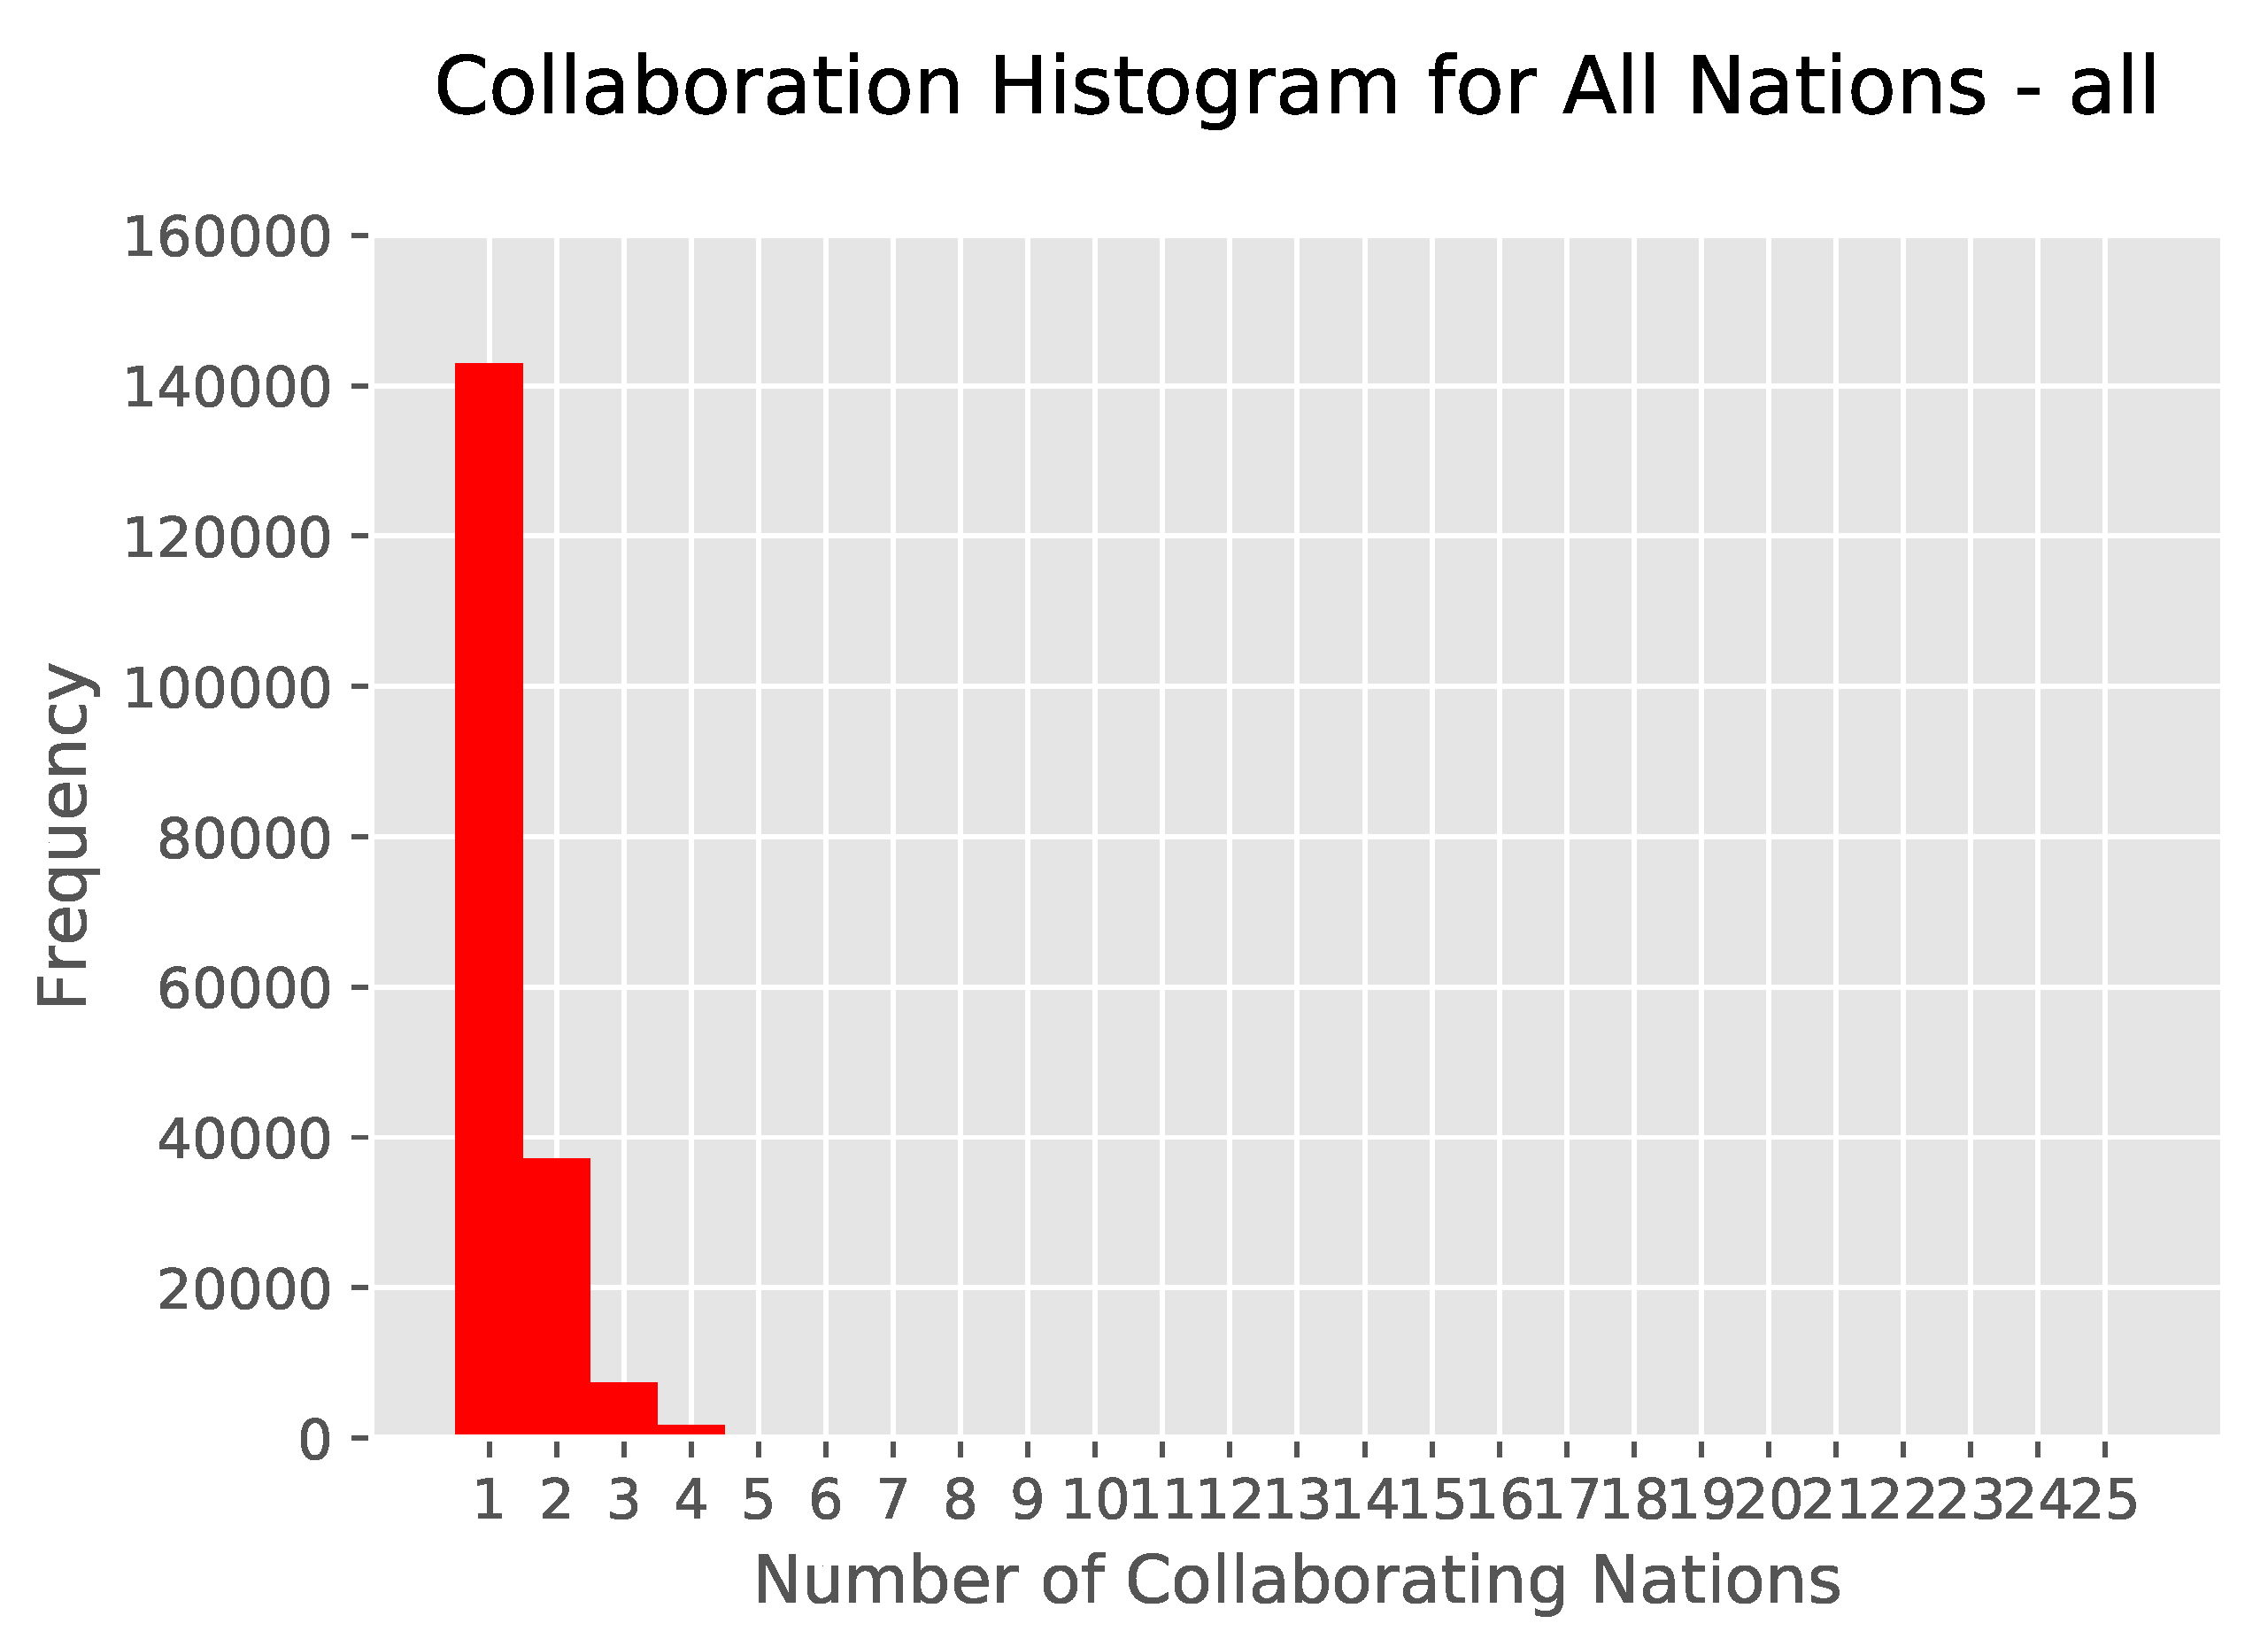
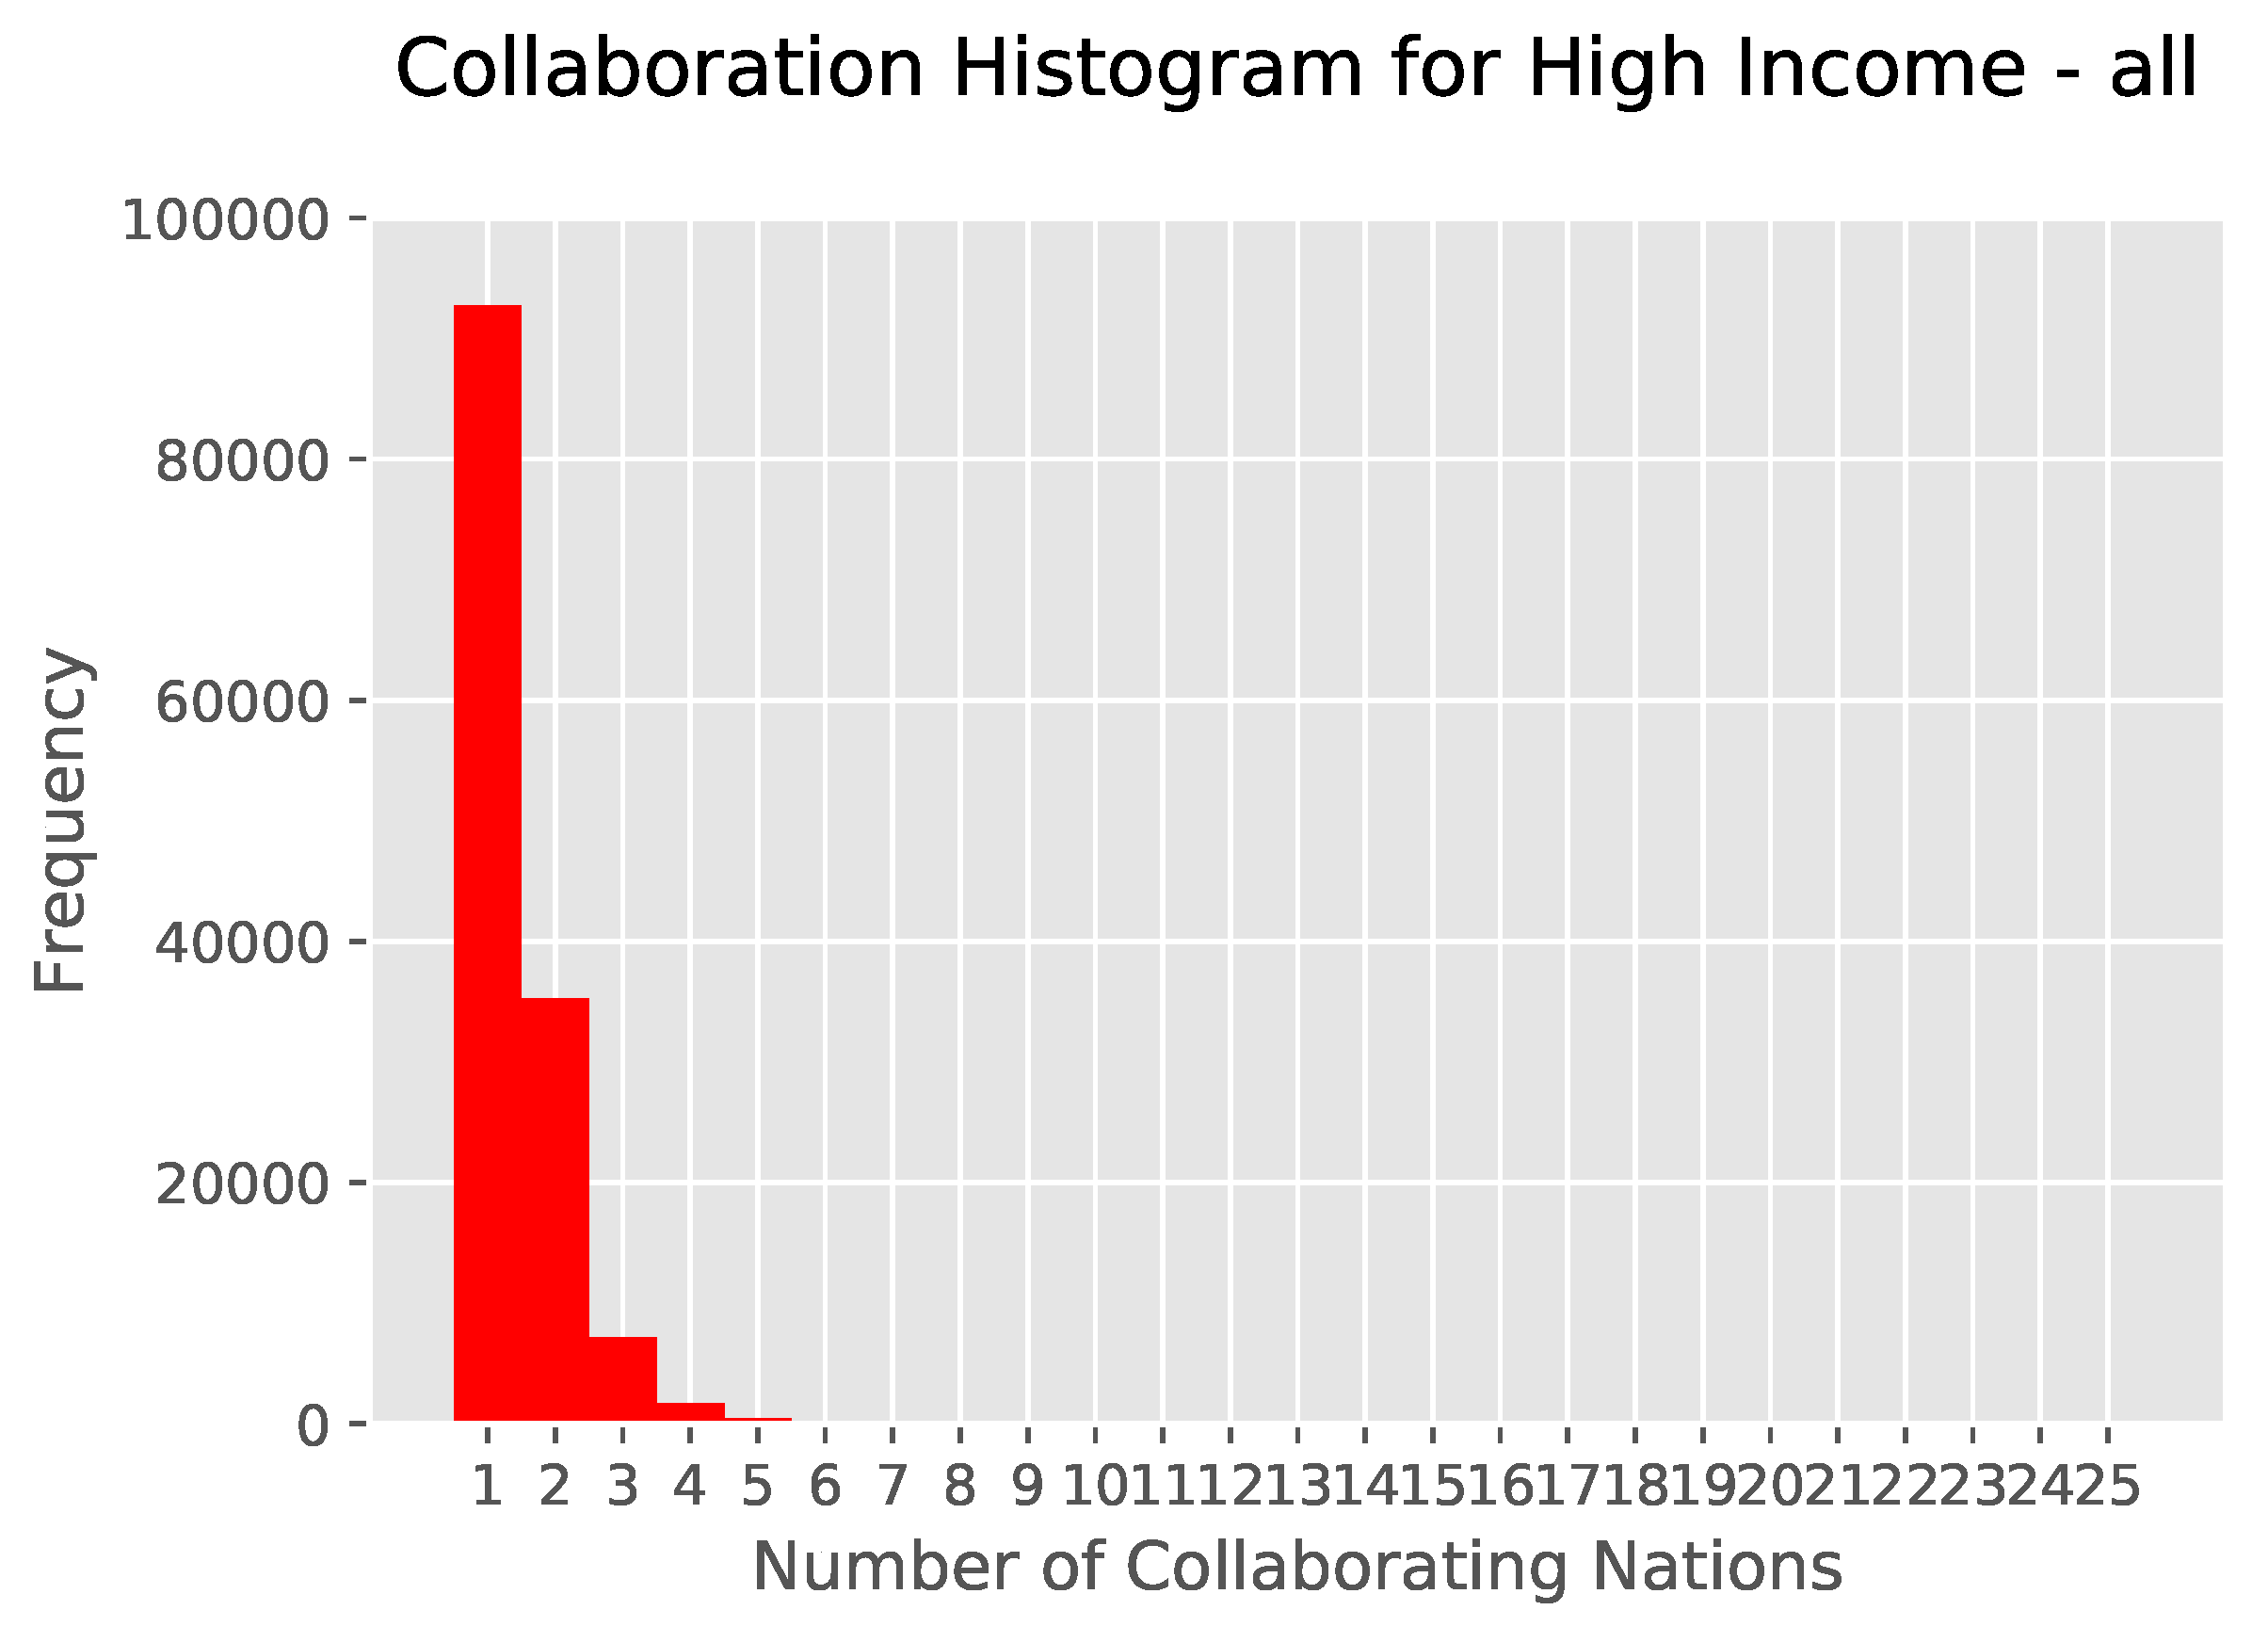
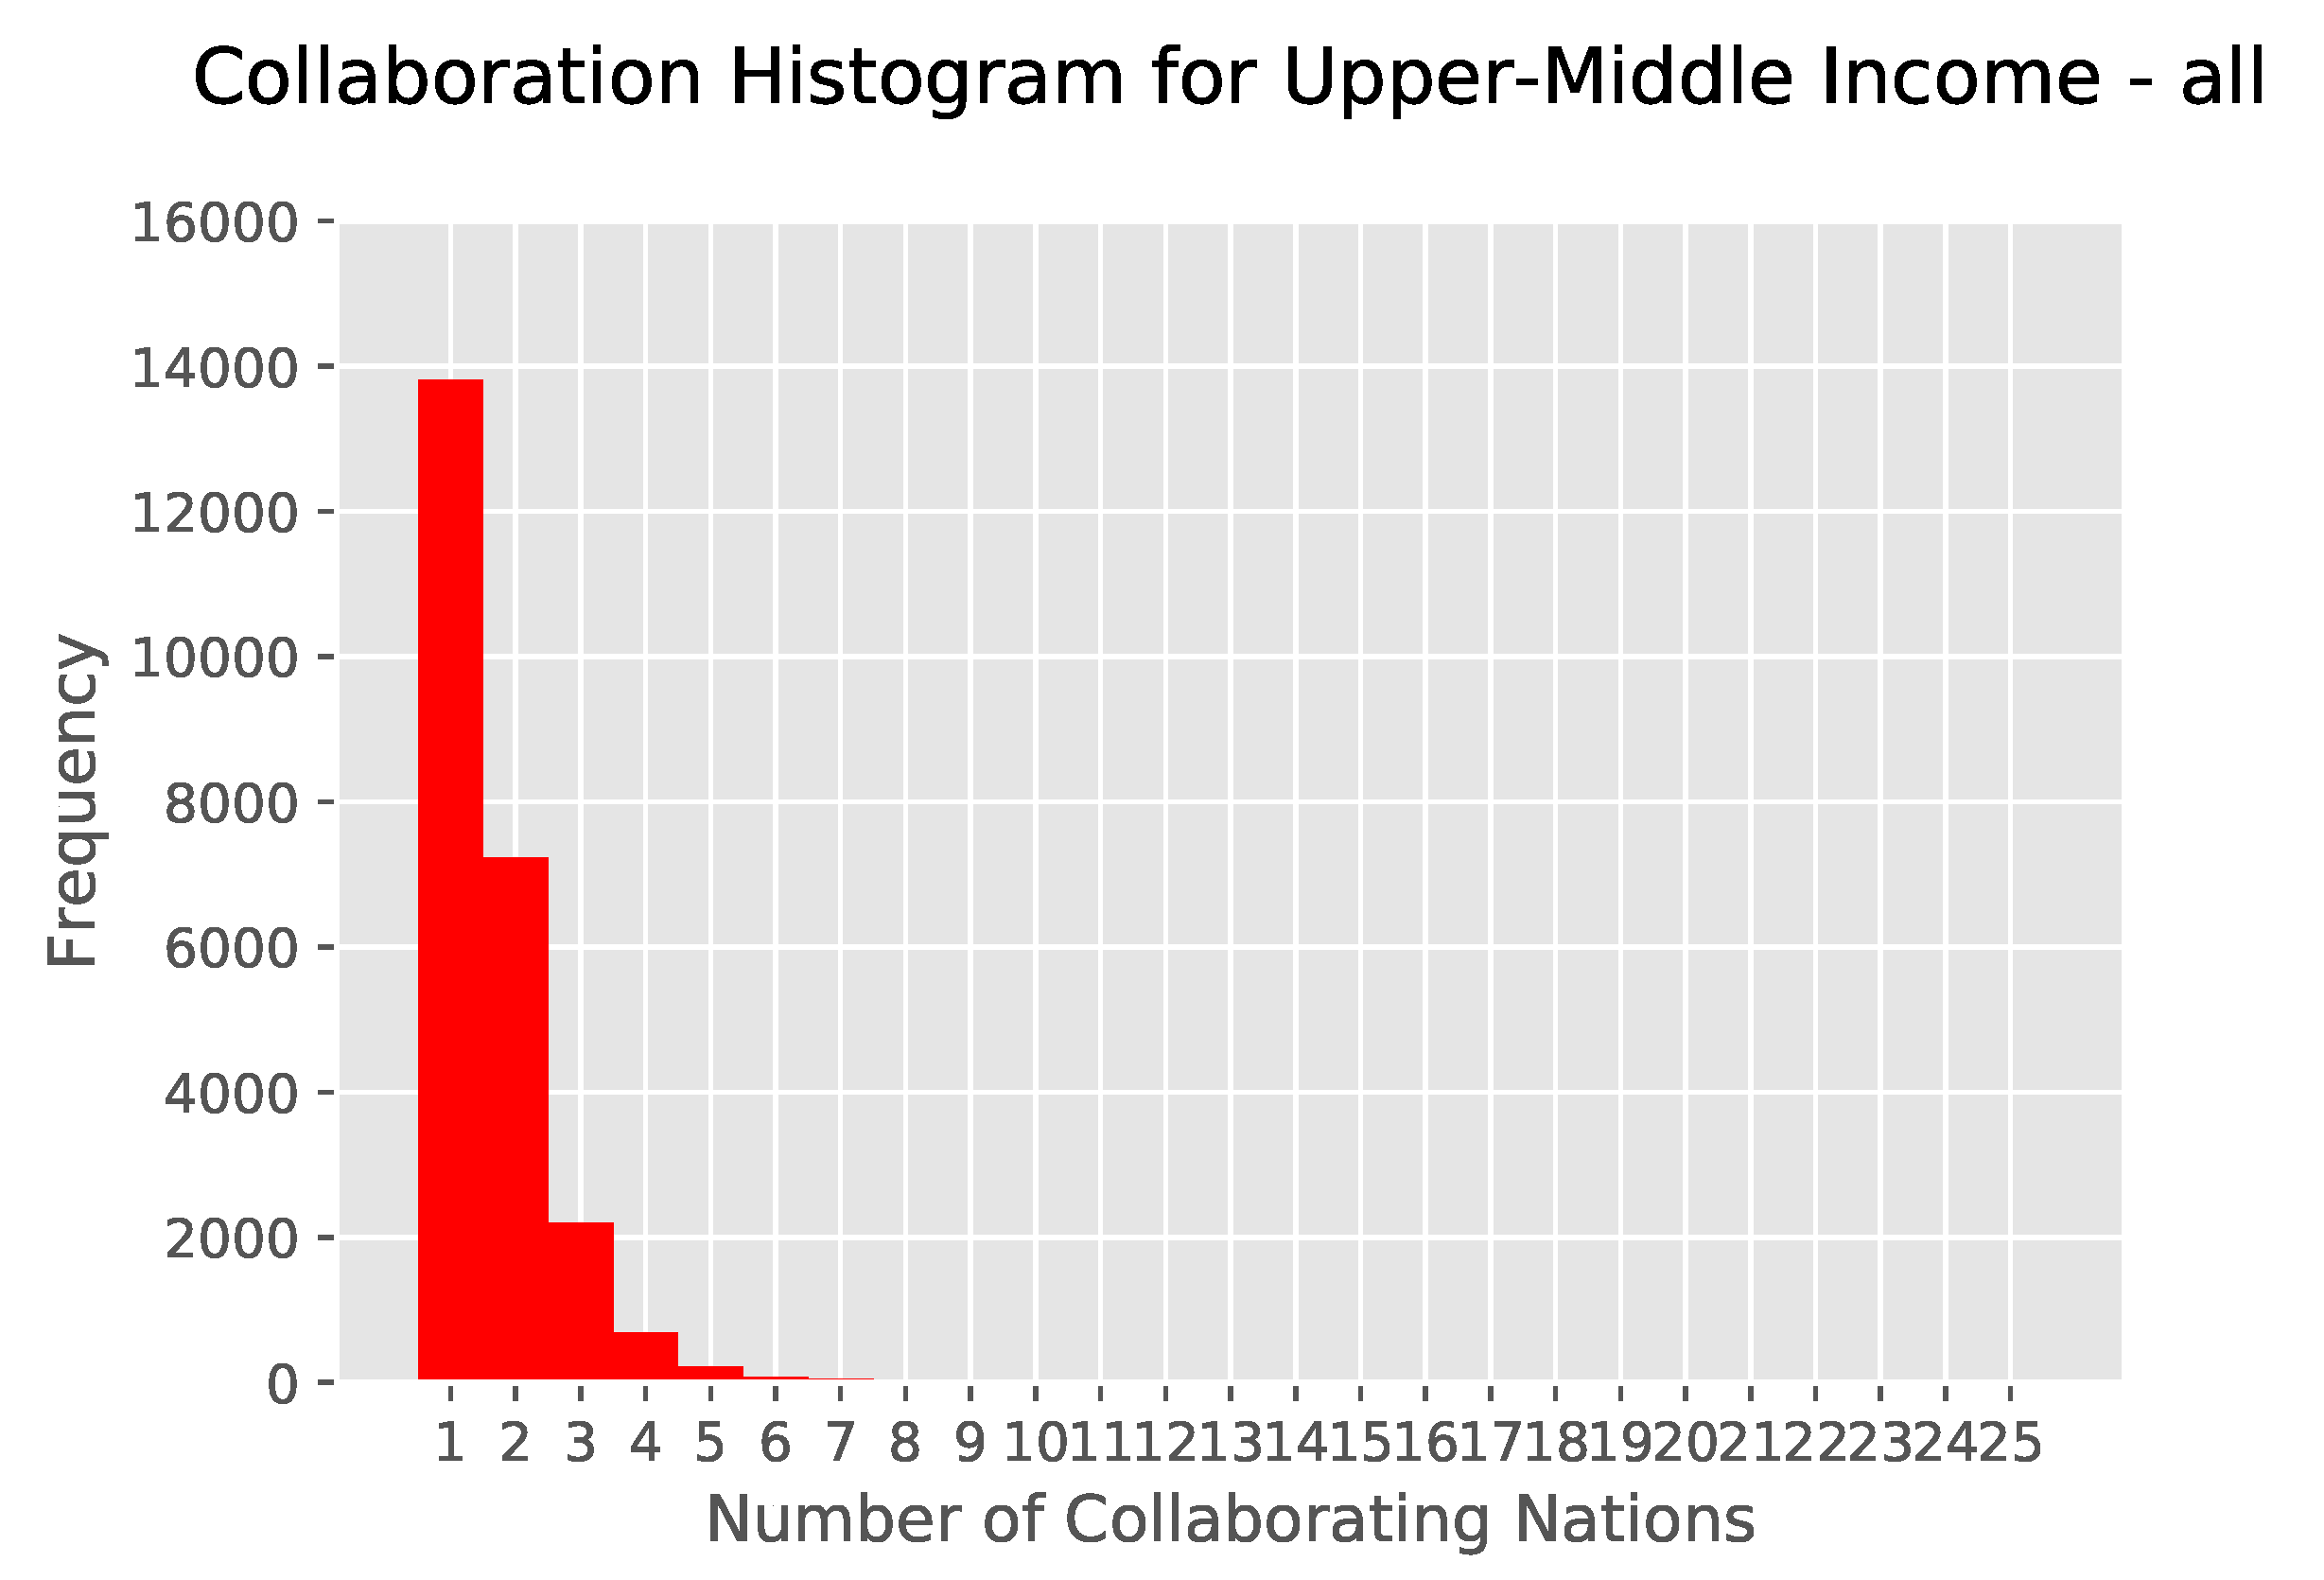
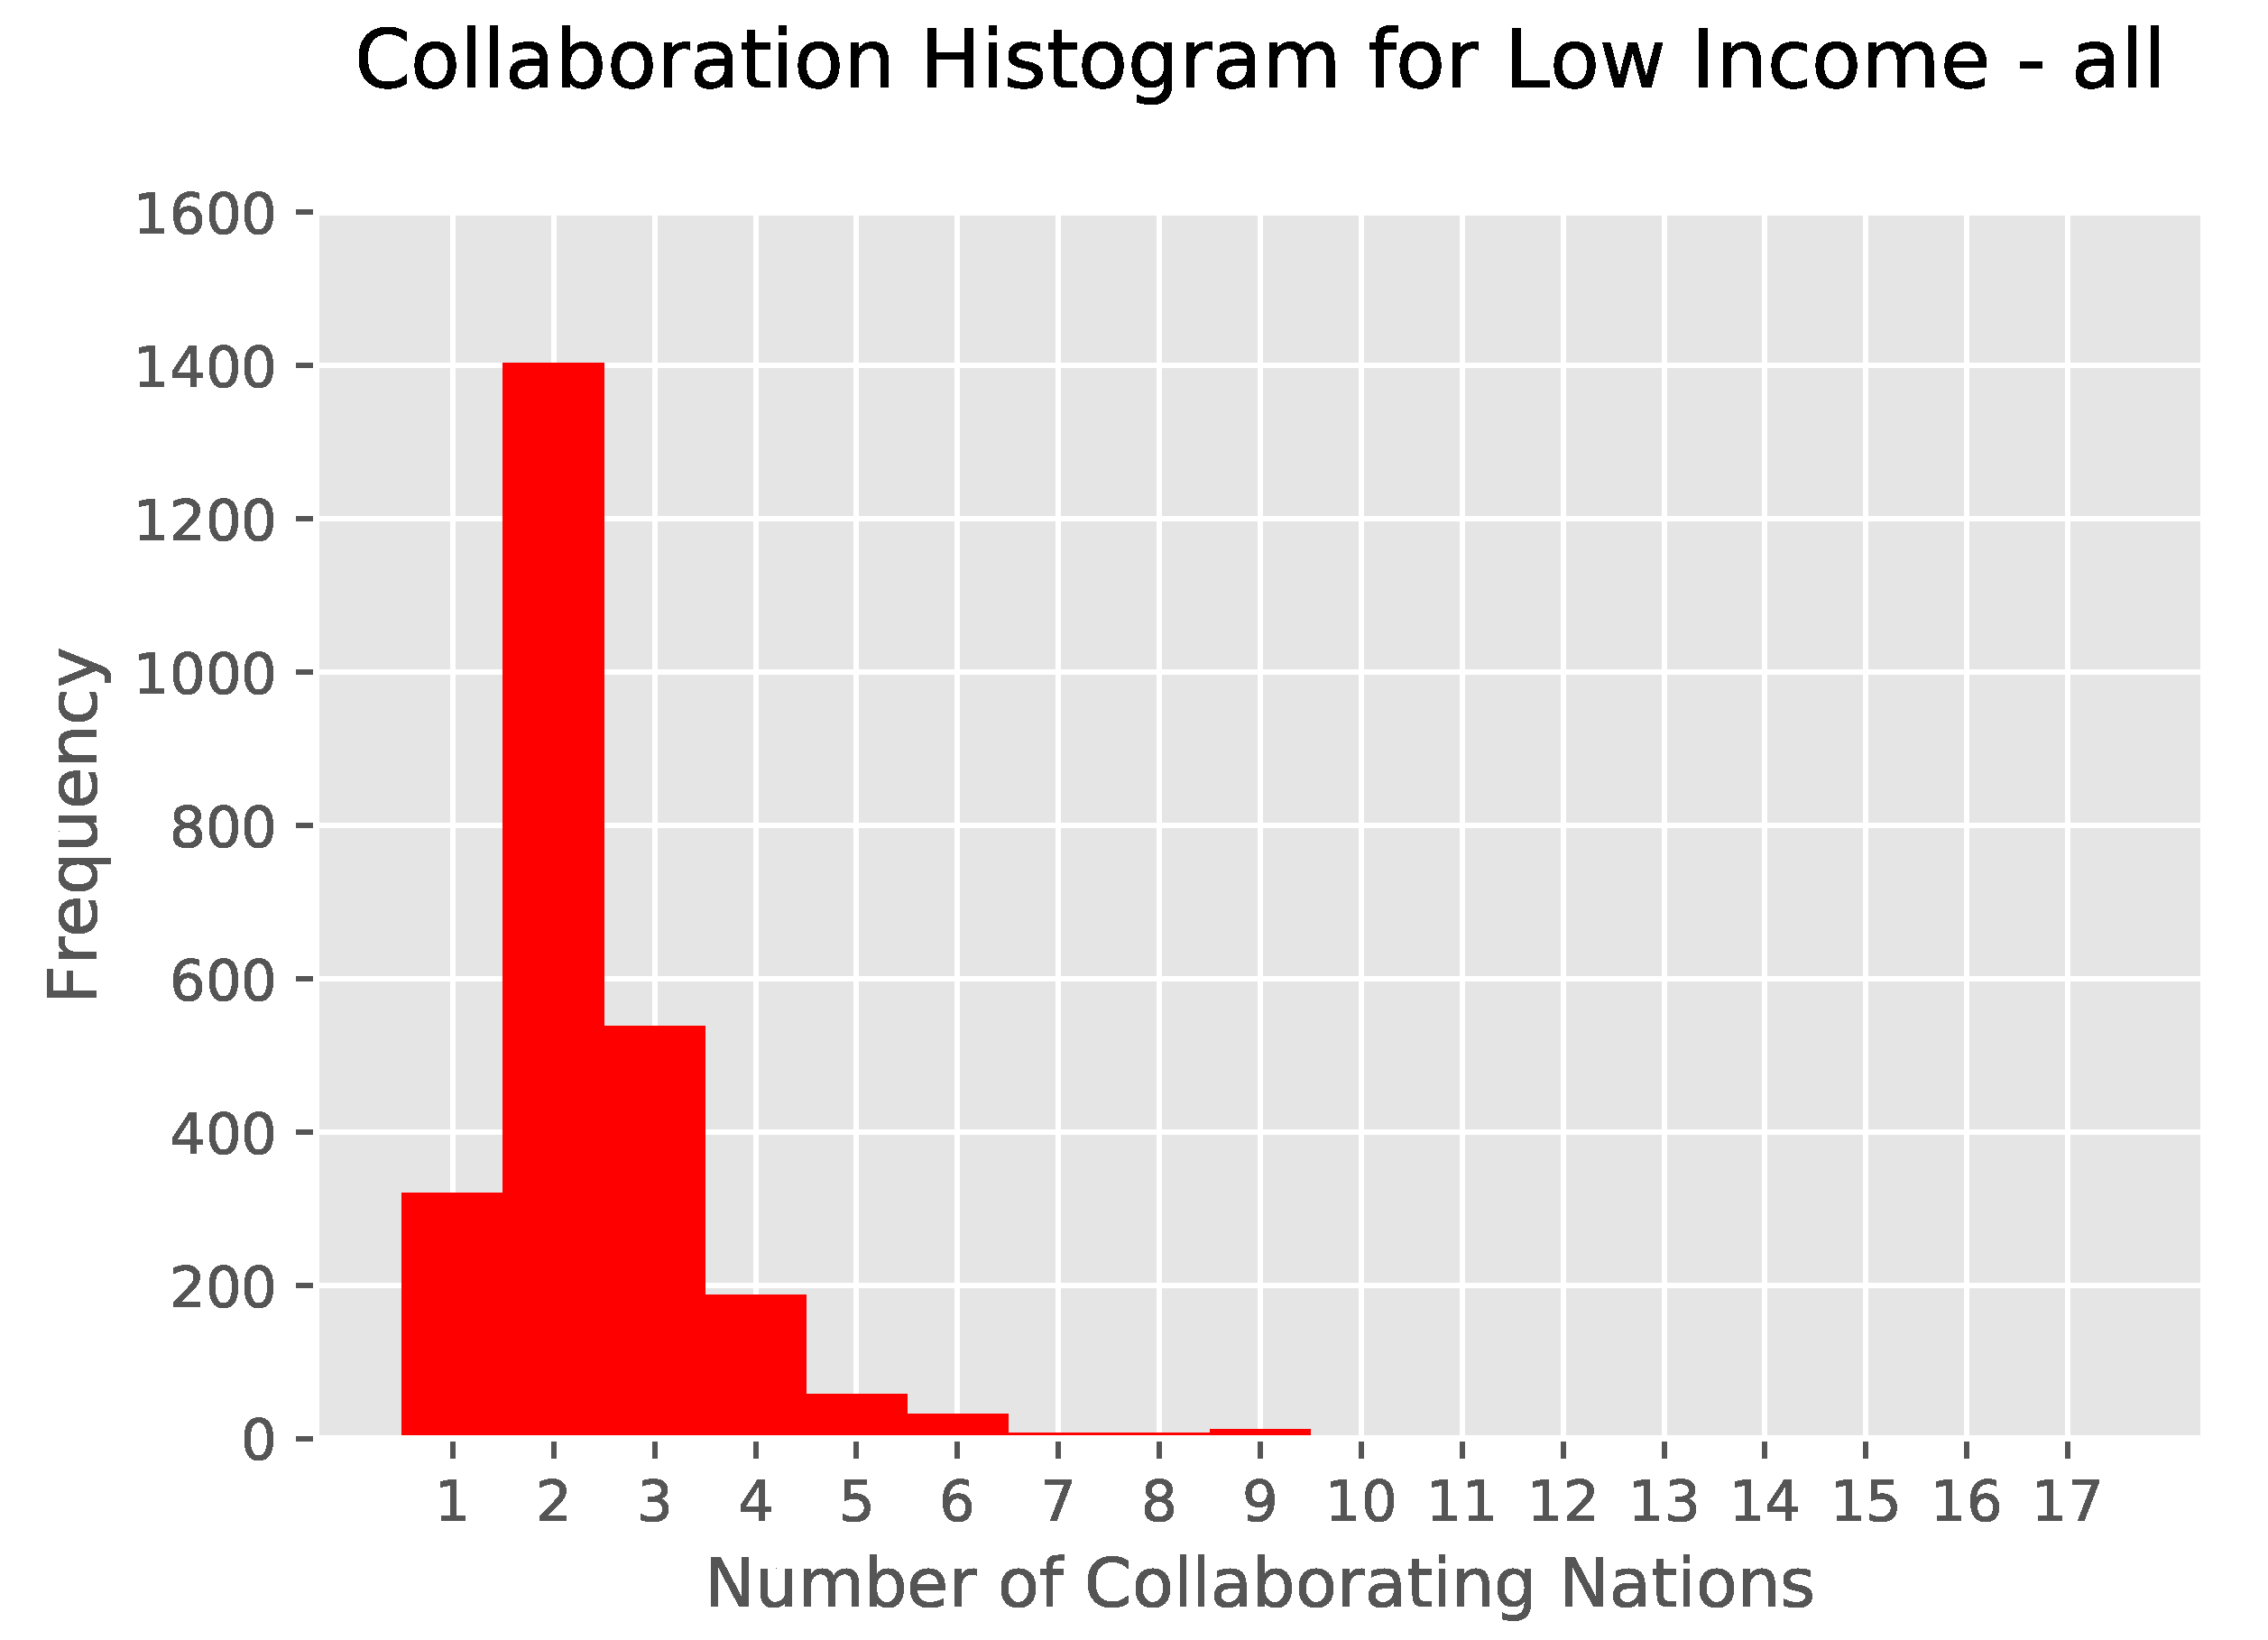
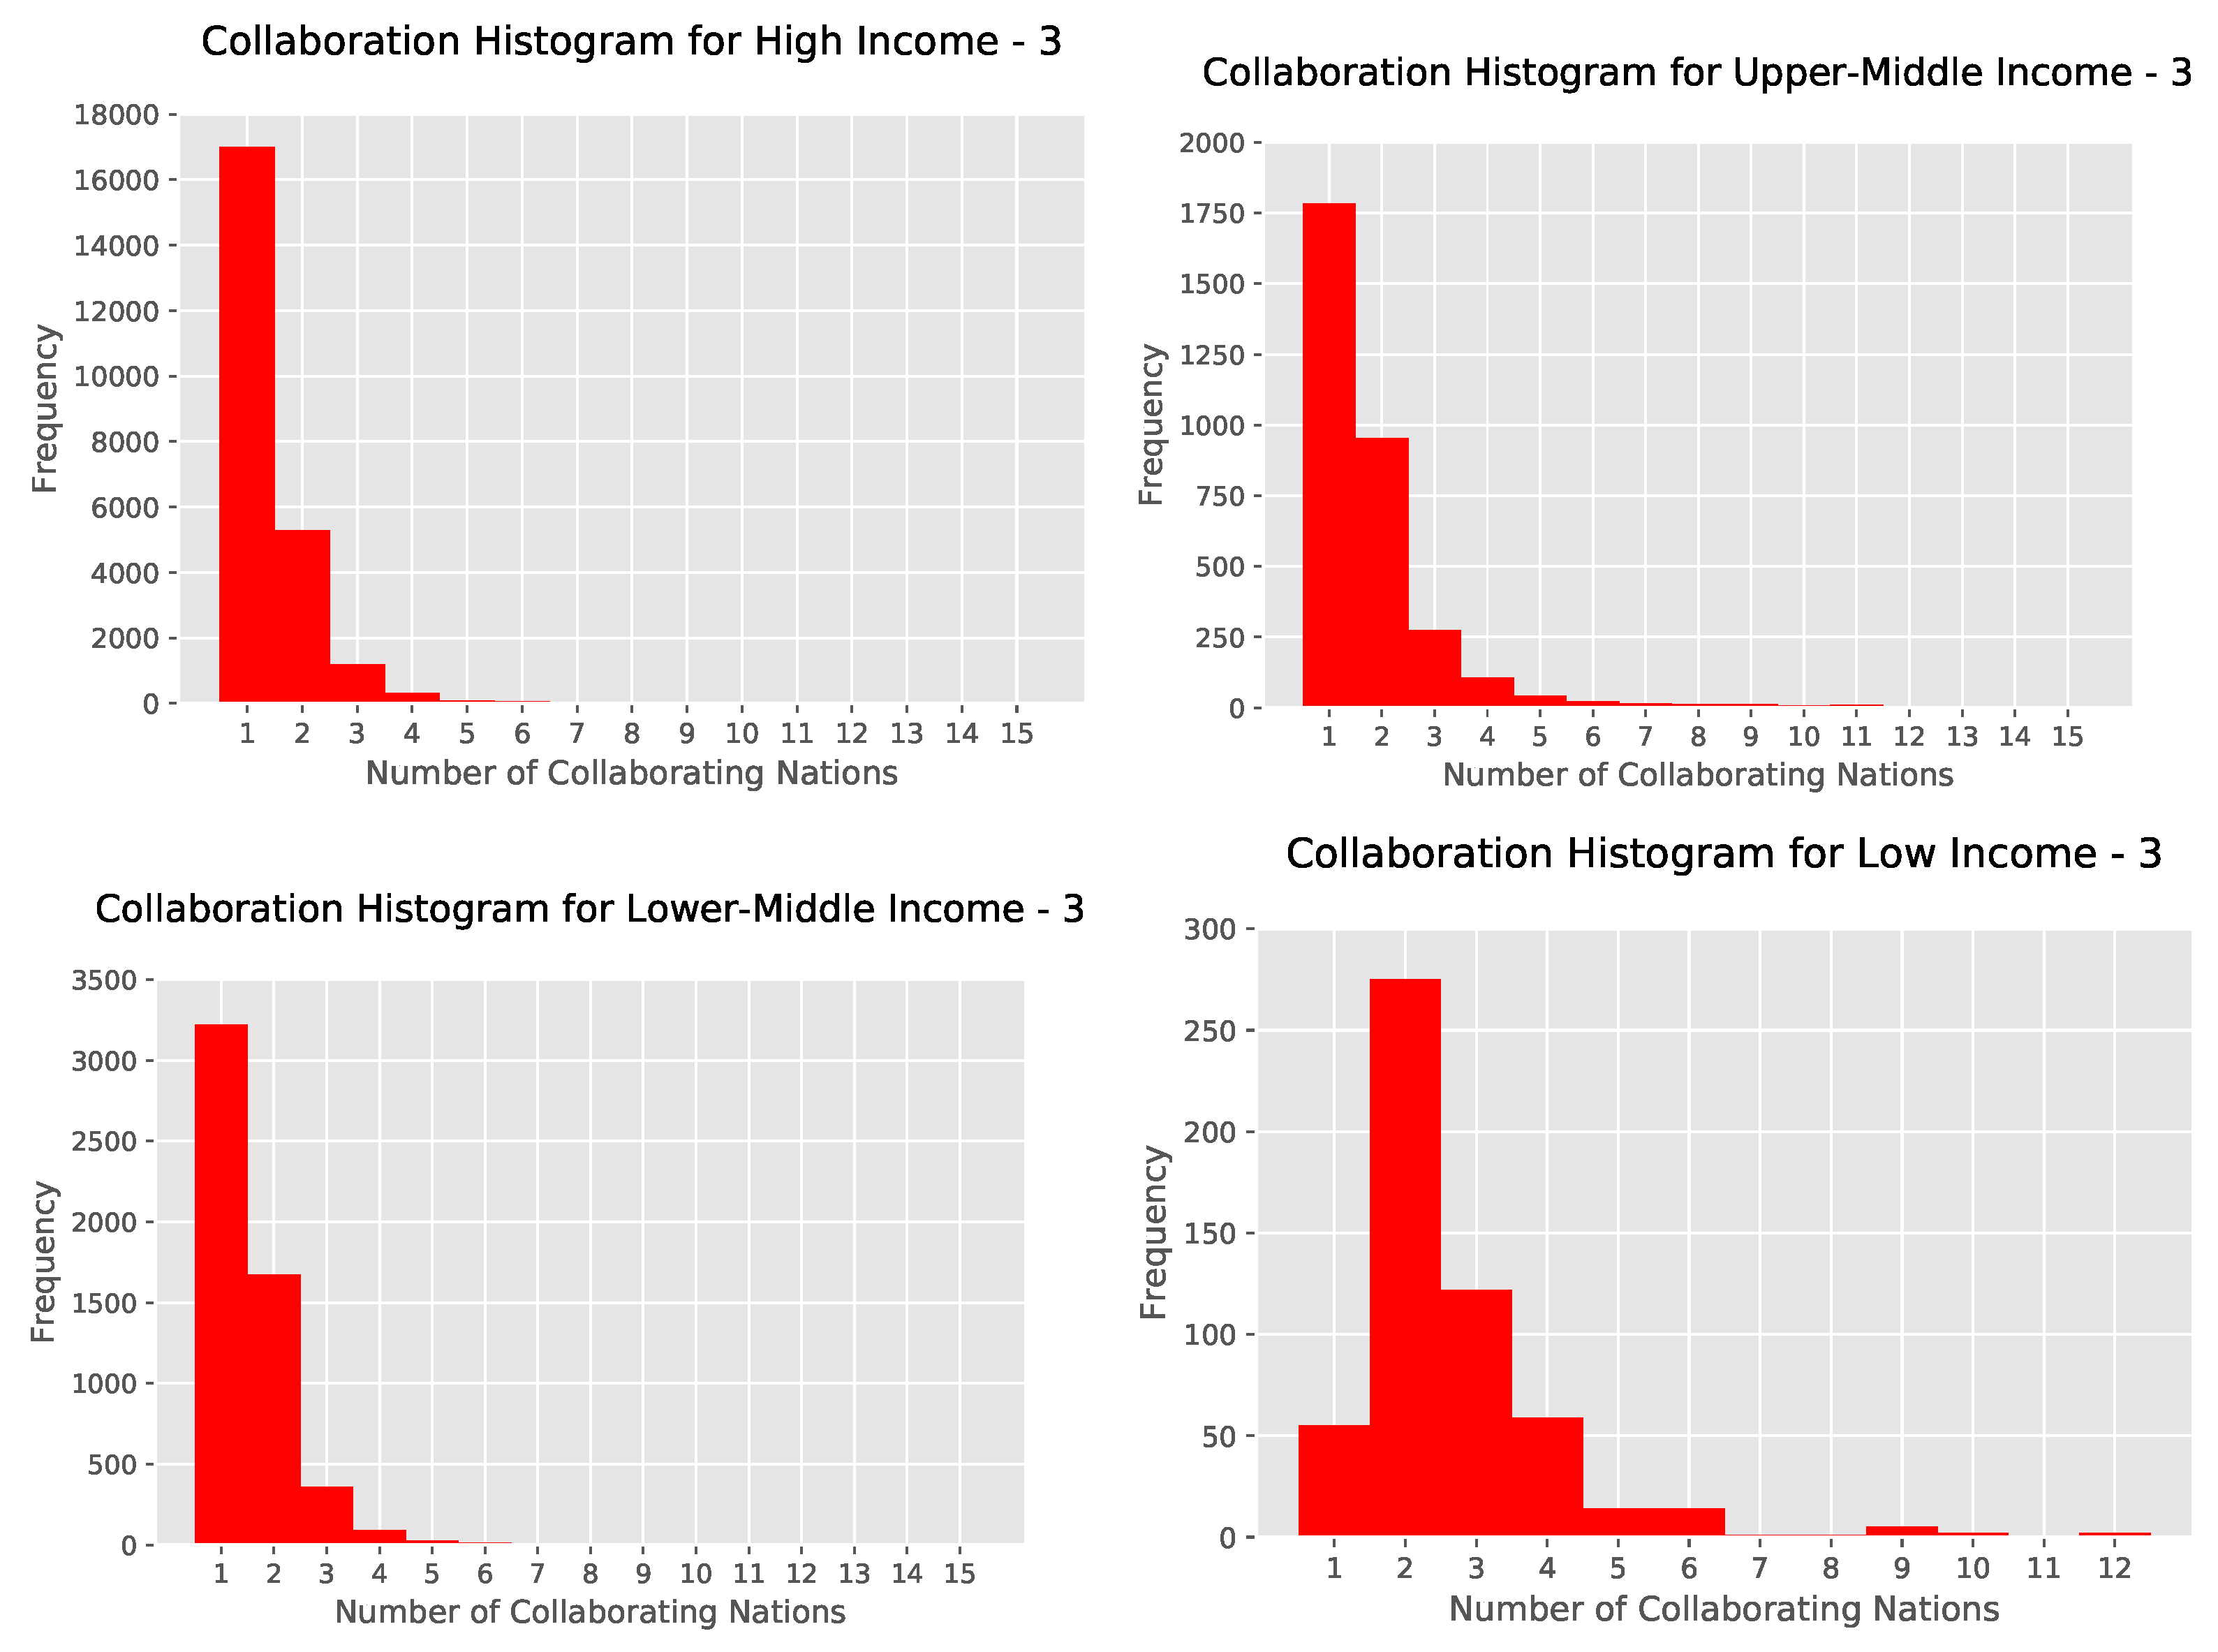
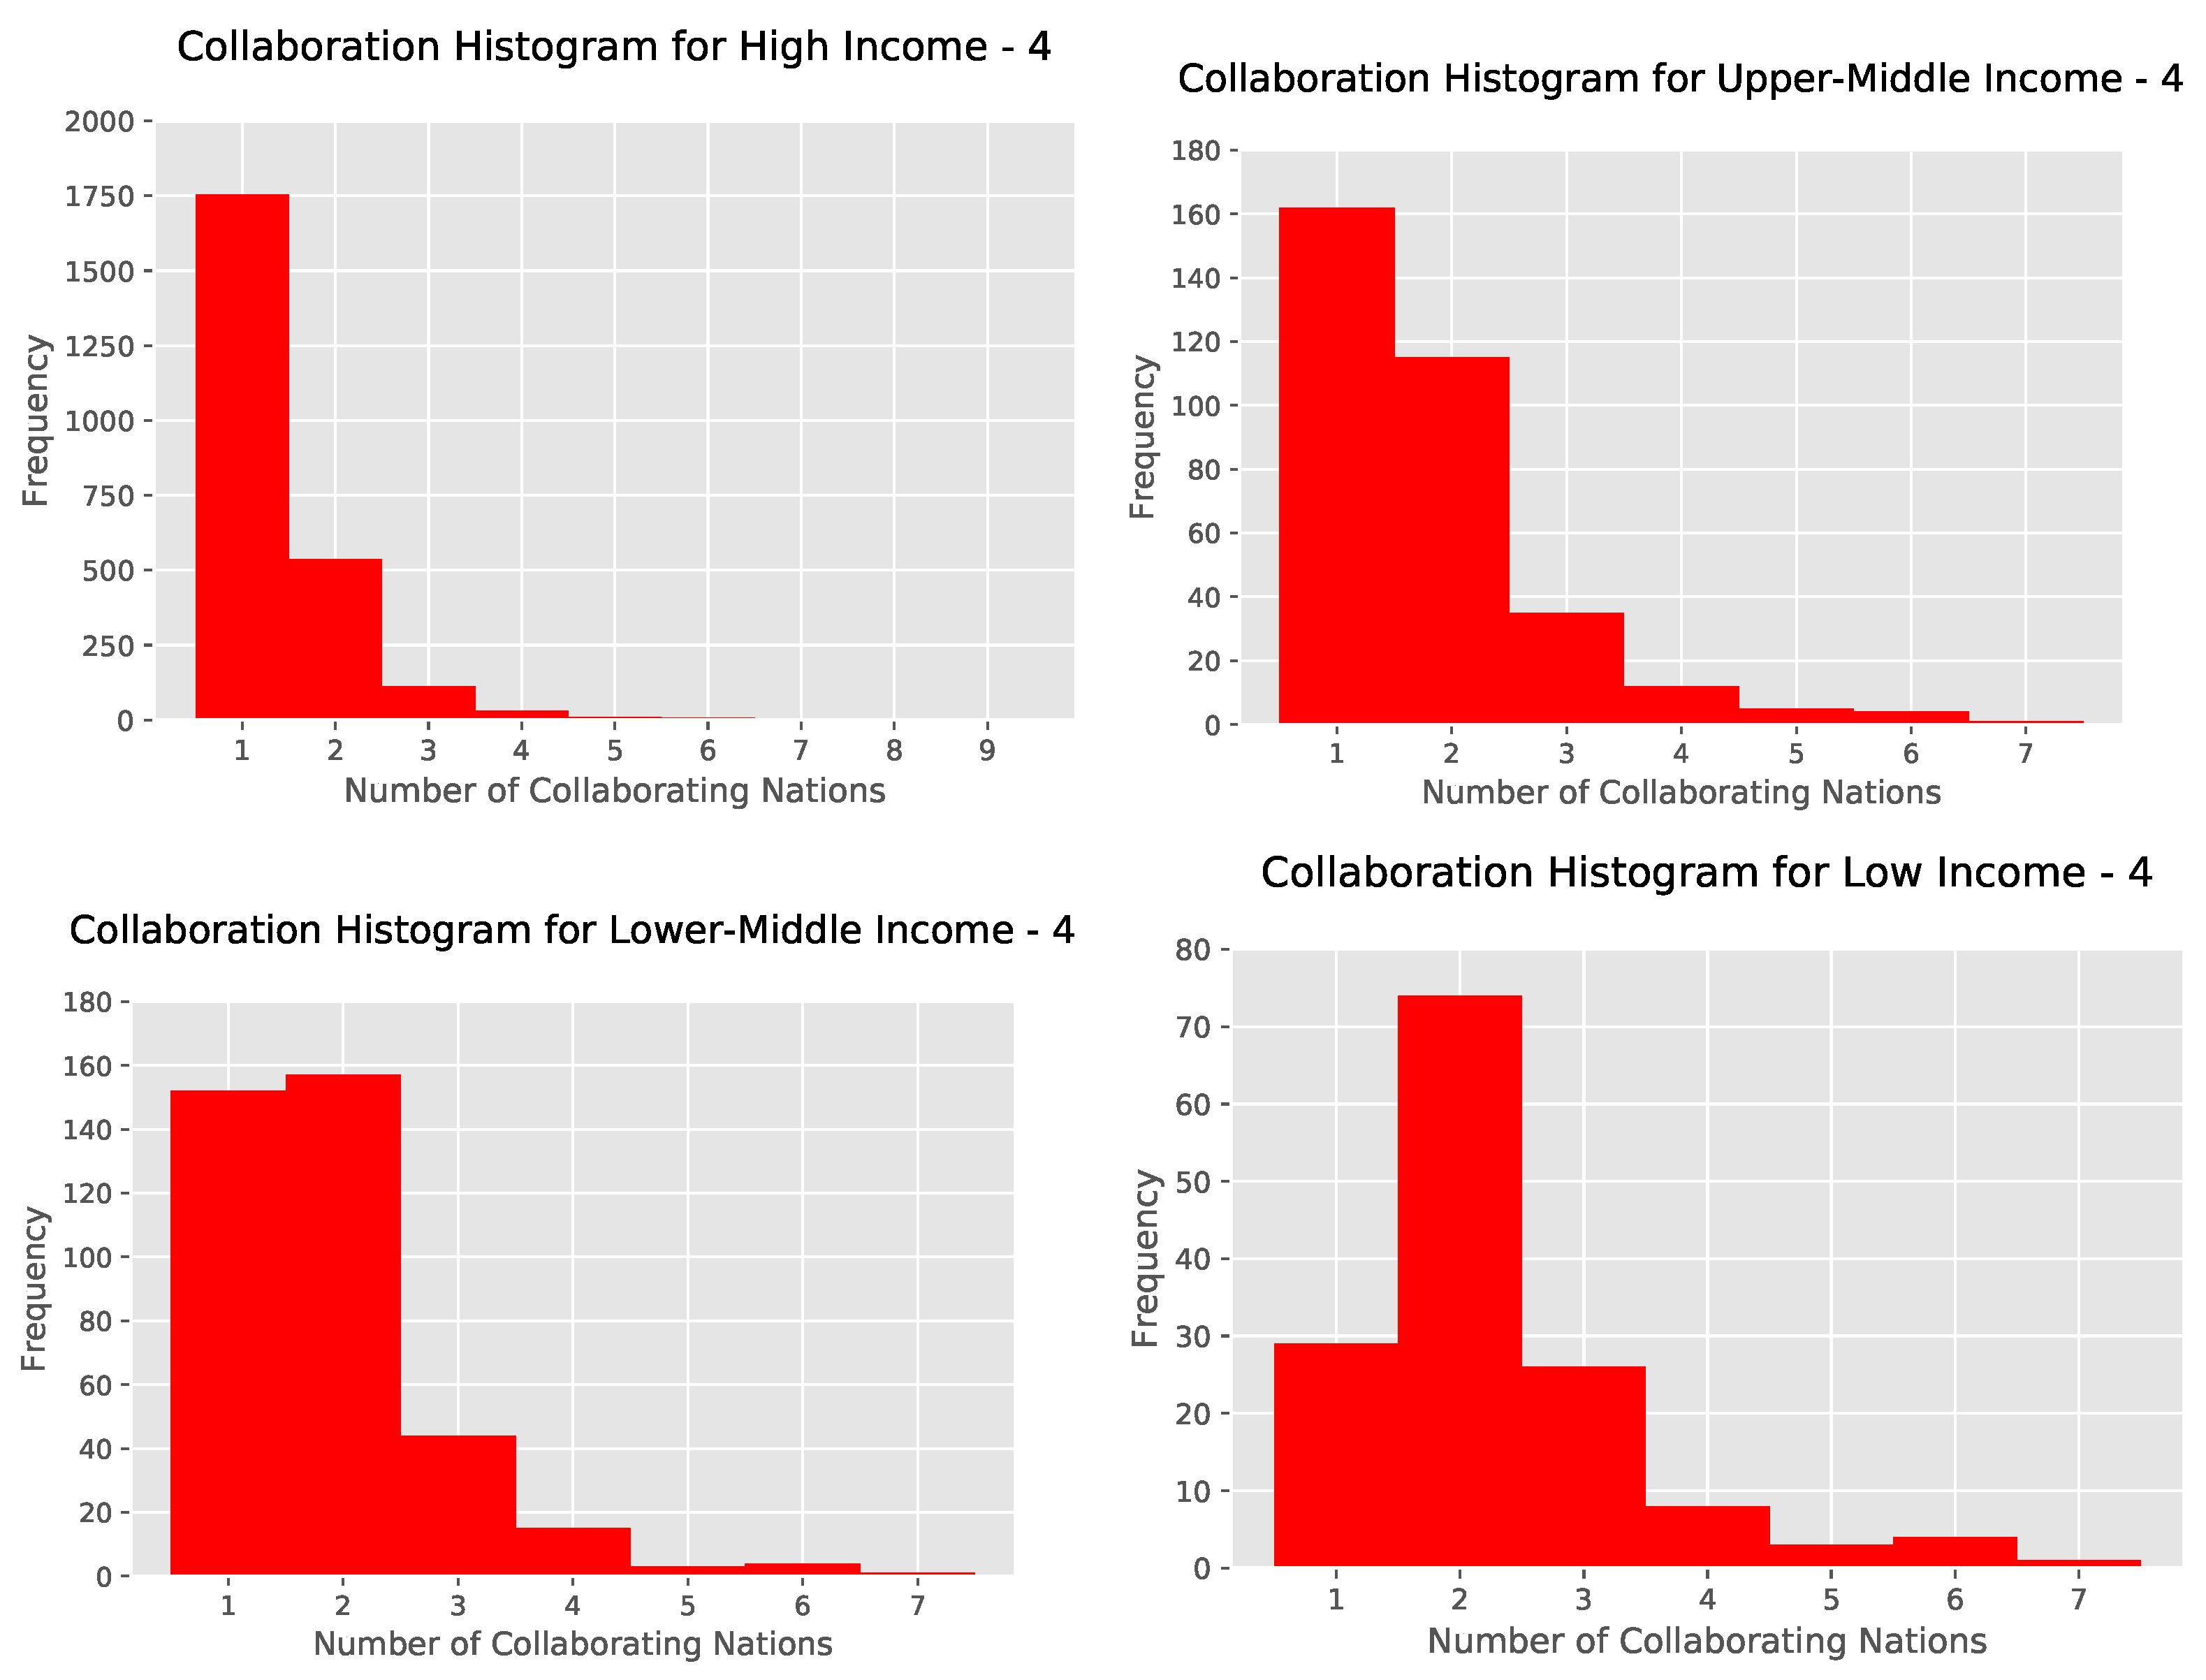
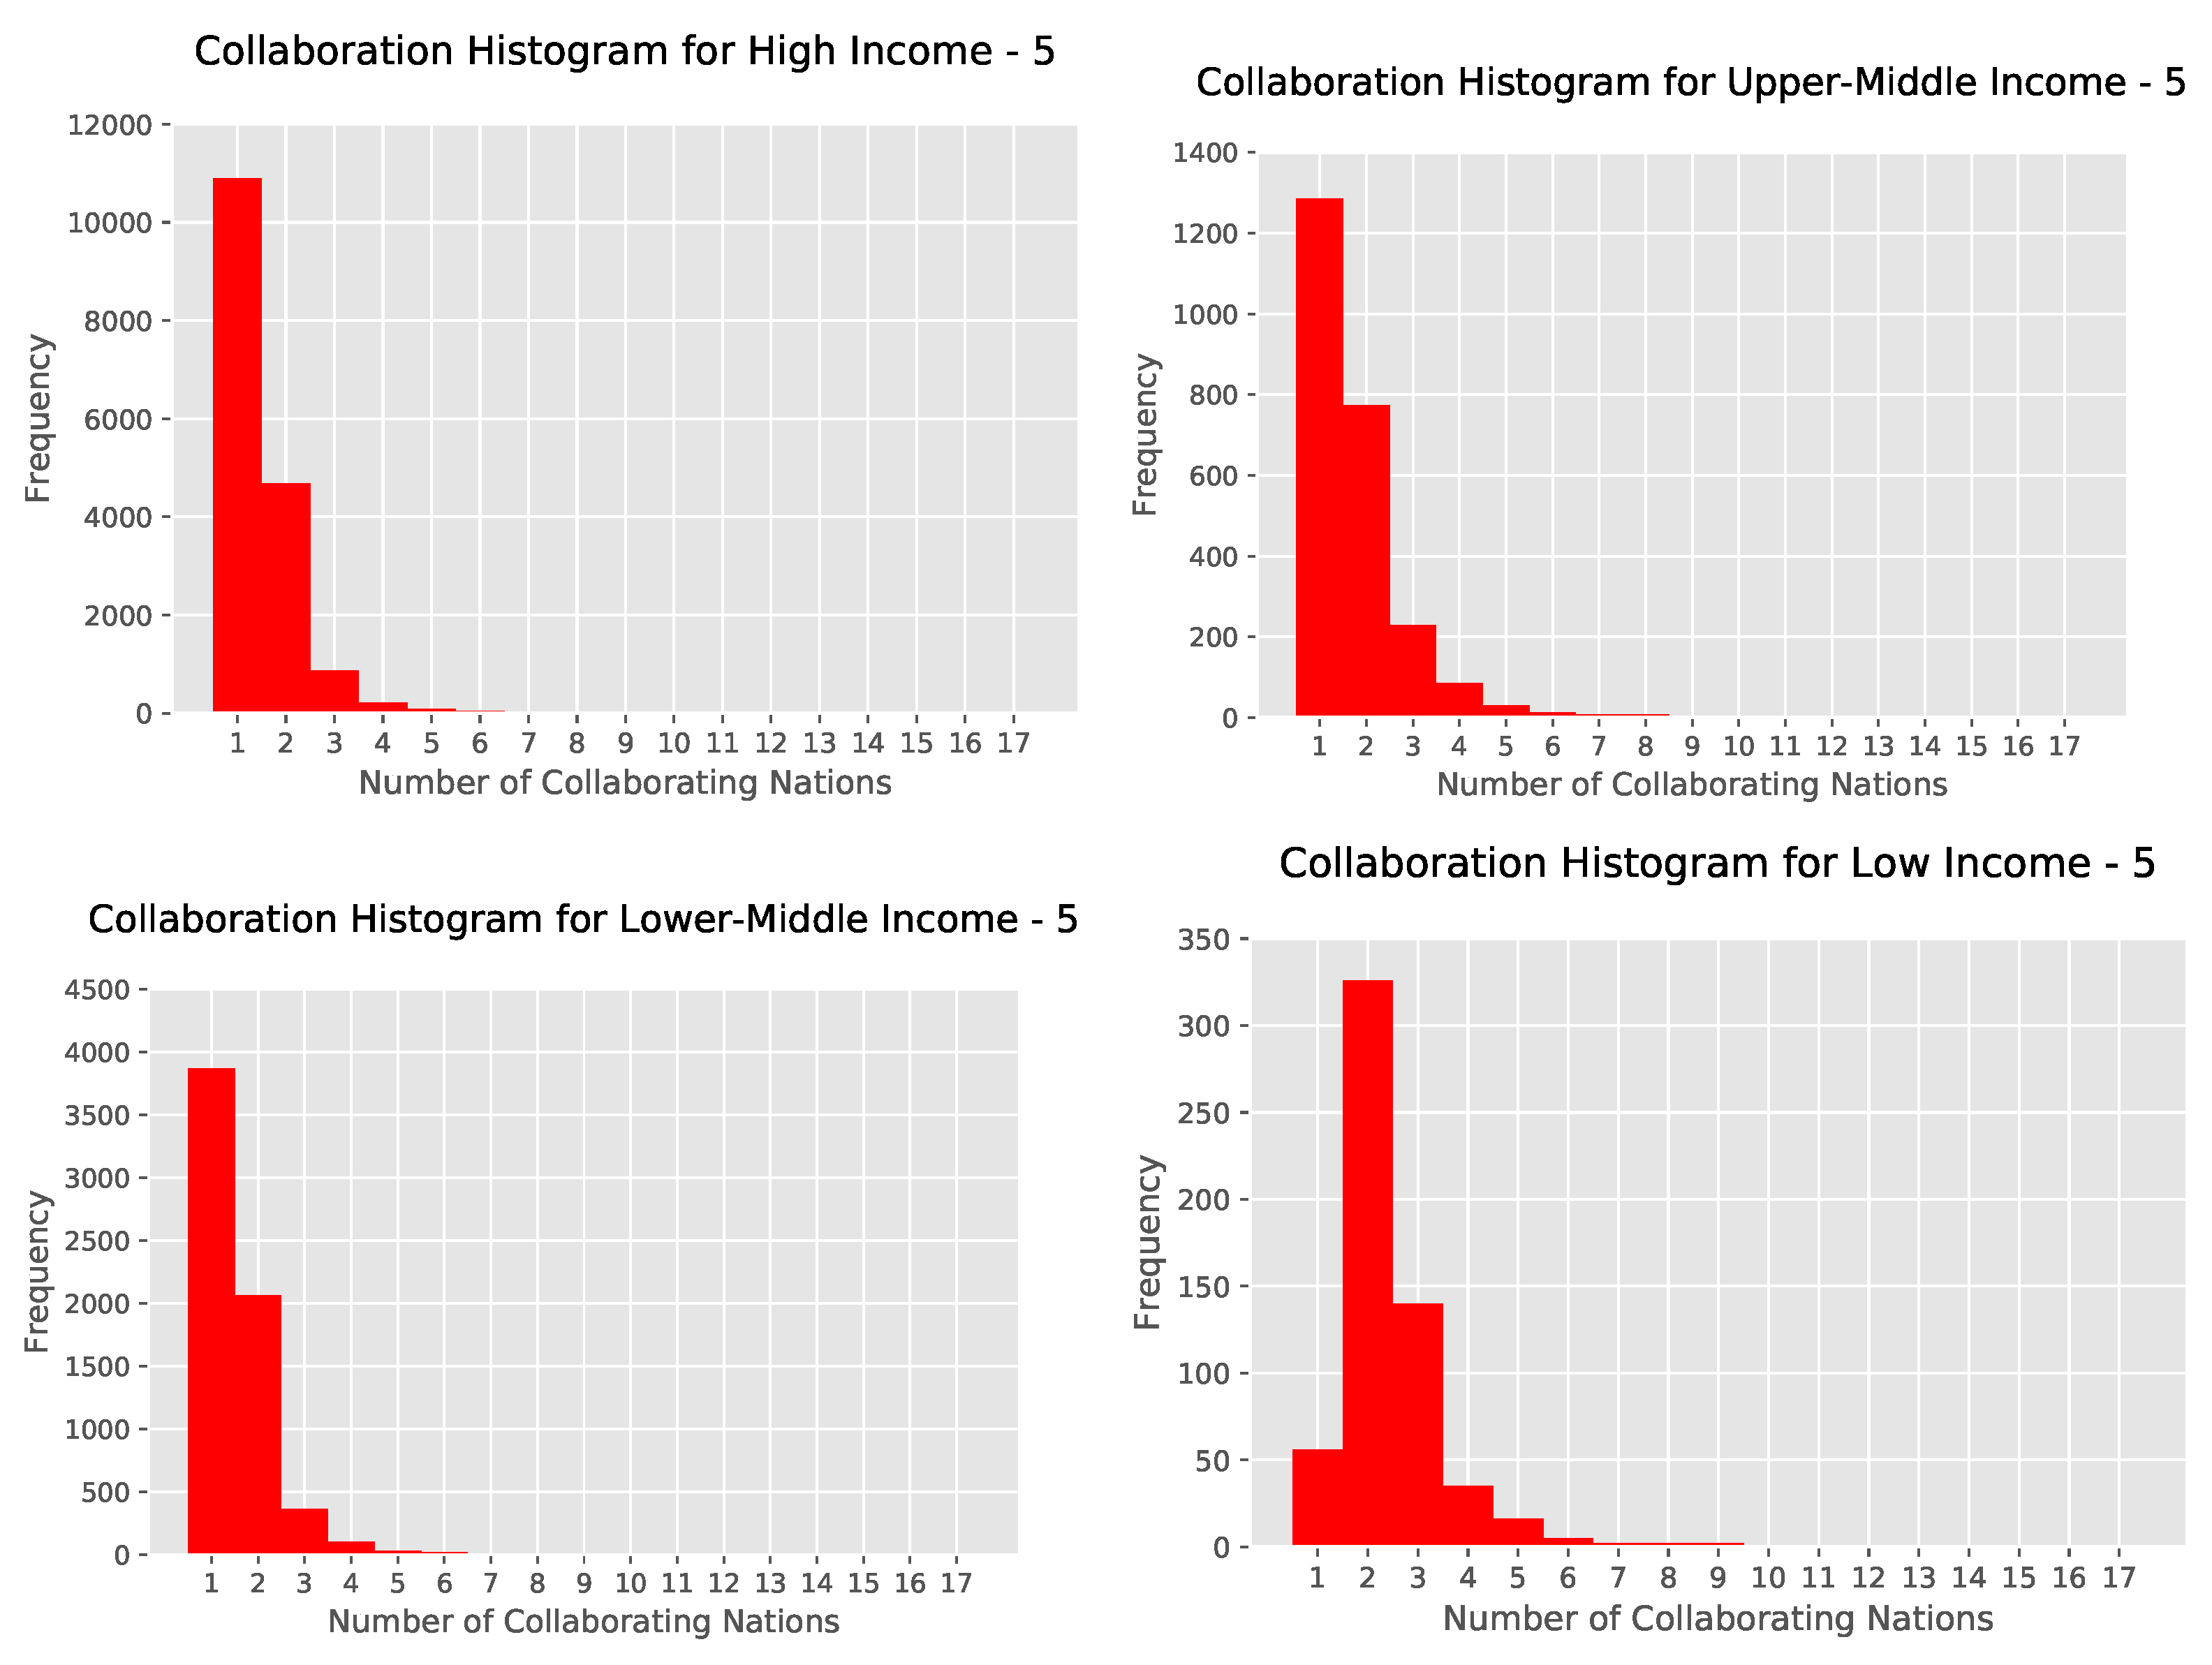
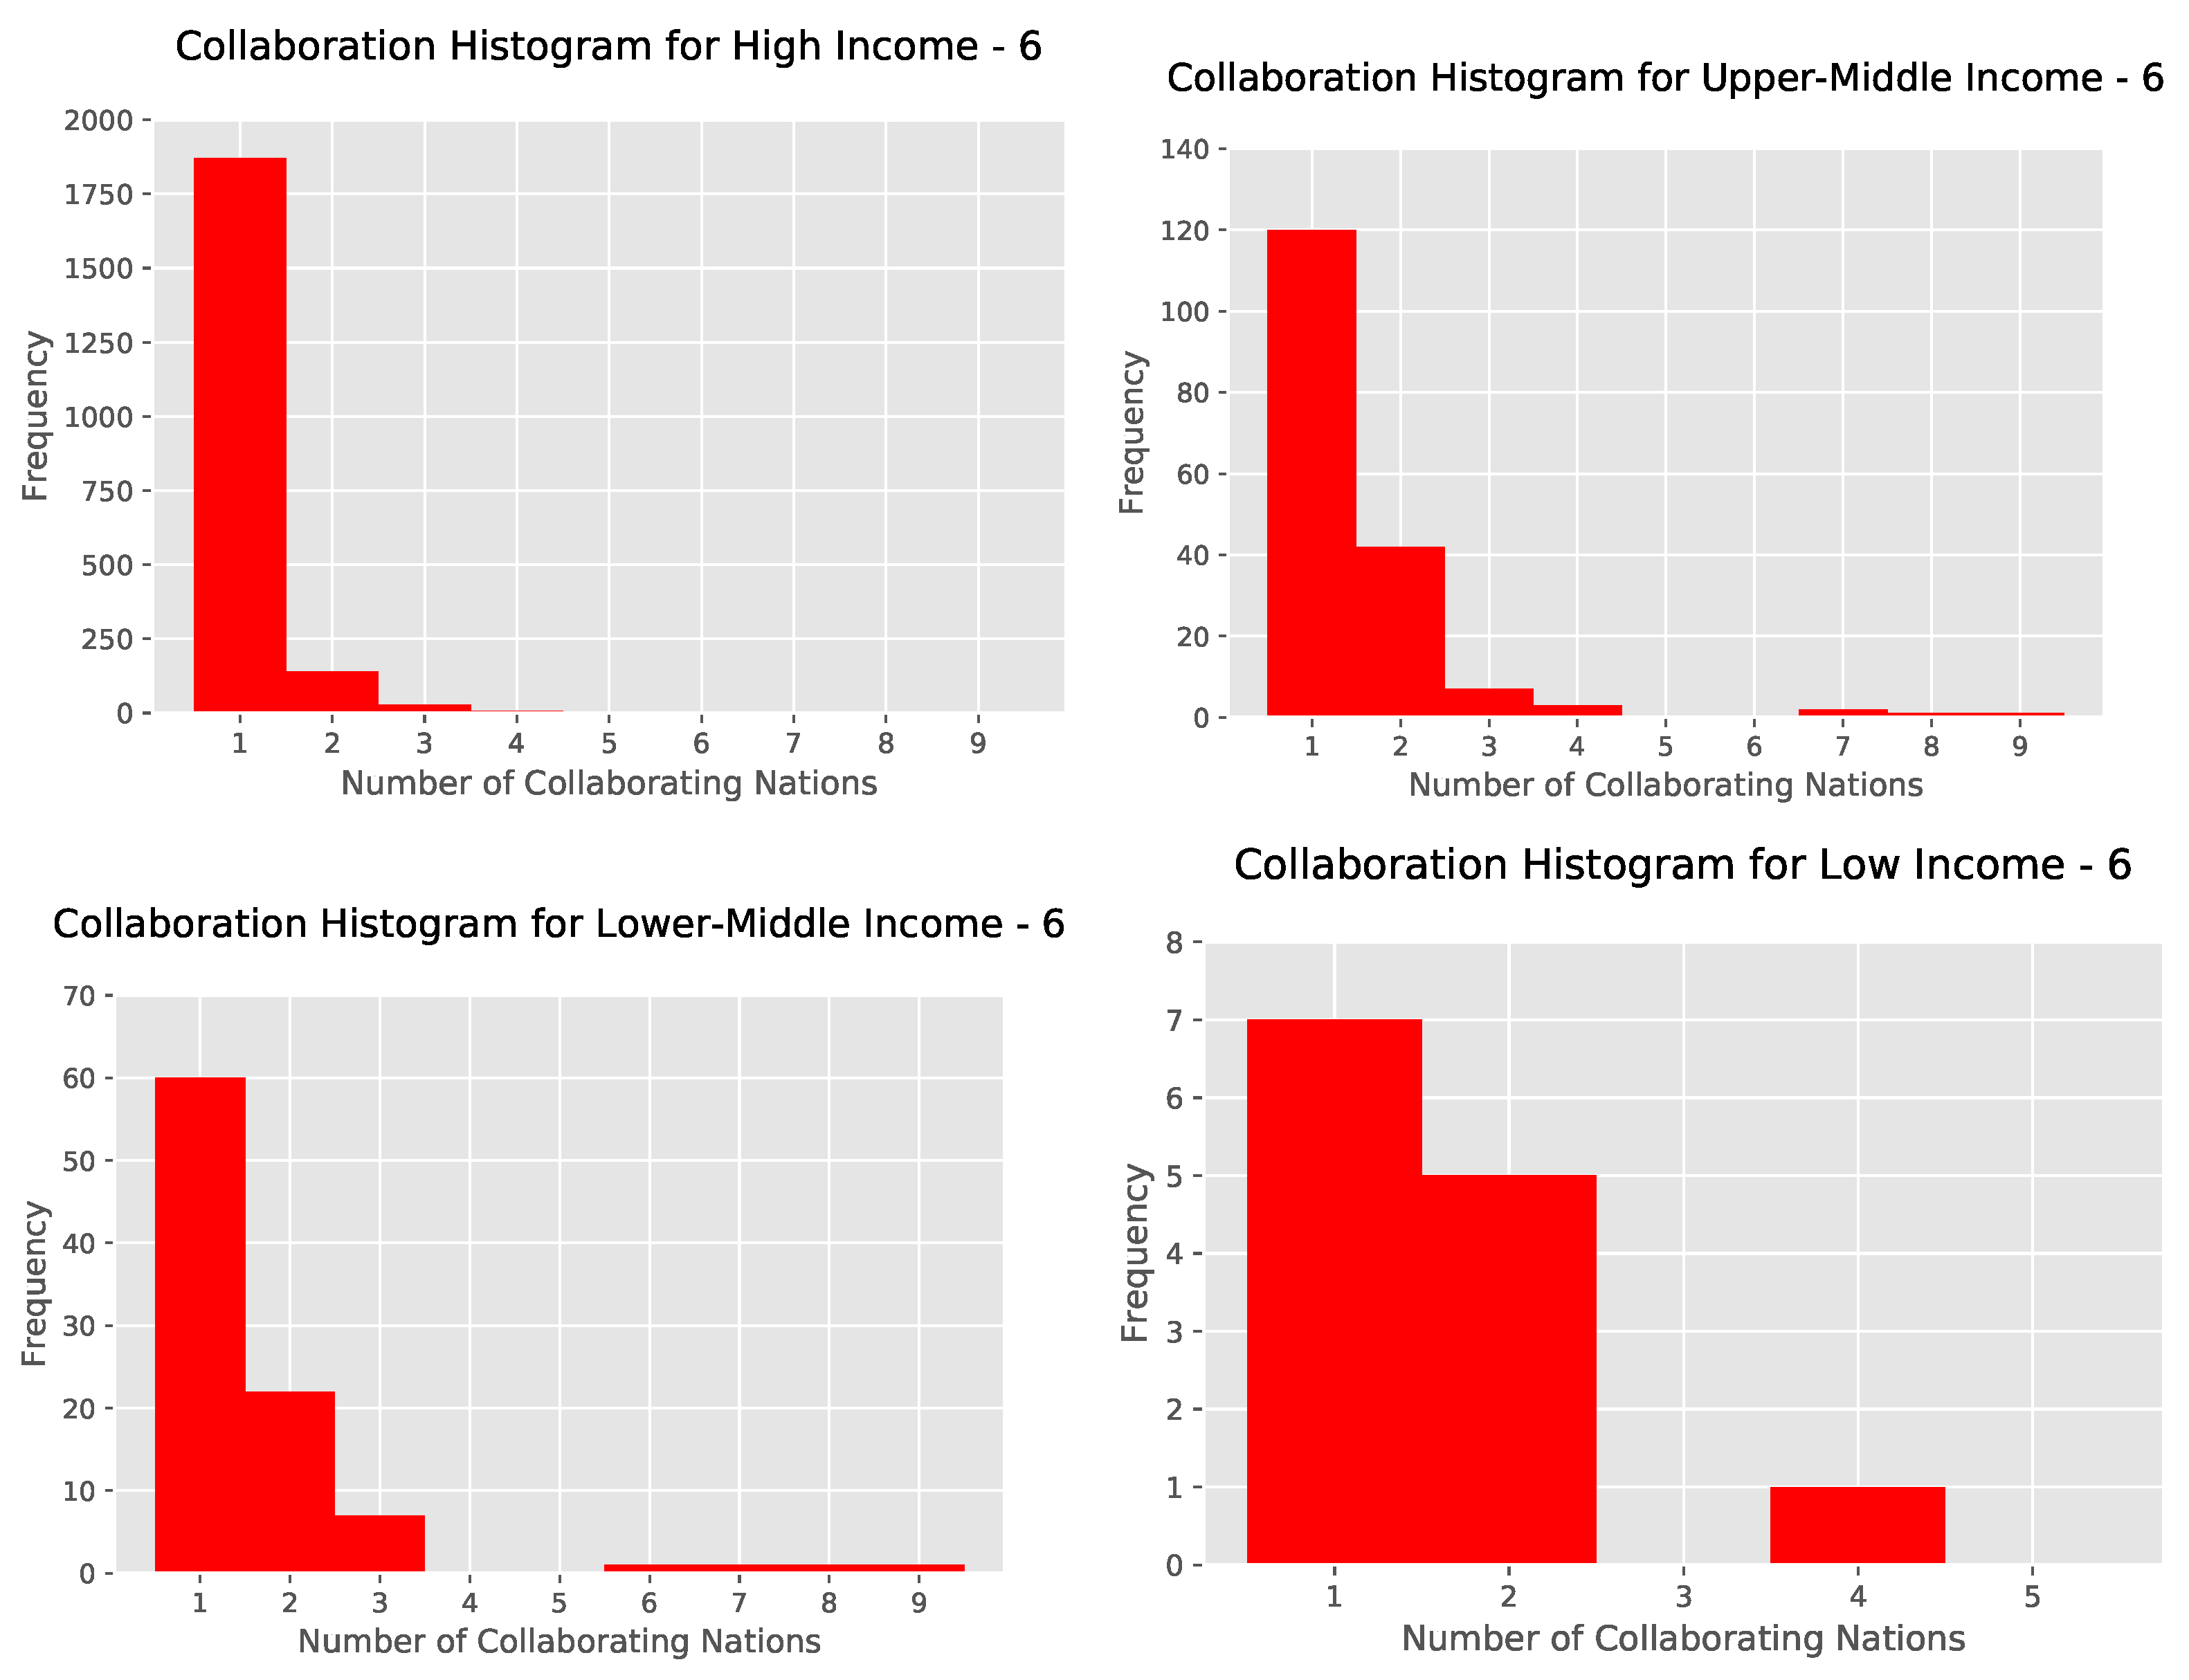
The distribution of the number of different nations collaborating on papers is summarized in Table 4 along with summary statistics in Table 5 and histograms for all nations (Figure 3), high-income nations (Figure 4), upper-middle-income nations (Figure 5), lower-middle-income nations (Figure 6), and low-income nations (Figure 7). Note that the percentage of papers with one nation represented is higher for the entire data set than it is for any individual income group. This is because there is no overlap between papers with only one nation represented across different income groups, while there is such an overlap across income groups for papers with two or more nations represented. This is a consequence of the existence of international collaborations with members from different income groups.
As can be seen from the summary statistics and histograms, researchers from low-income nations form international collaborations in what appears to be a significantly different manner. Specifically, it appears as though researchers from low-income nations form international collaborations more frequently than researchers from relatively wealthier nations. This provides evidence in support of the main results presented in this paper, that income is an important factor in the formation of international collaborations, and specifically that researchers from low-income nations are more likely to form international collaborations.
Using the distribution of the number of different nations collaborating on papers which include at least one author from a nation in a given income group as a measure of how researchers in each income group form international collaborations when publishing in MDPI journals, we can statistically test the hypothesis that researchers from low-income nations form international collaborations more frequently than researchers from relatively wealthier nations.
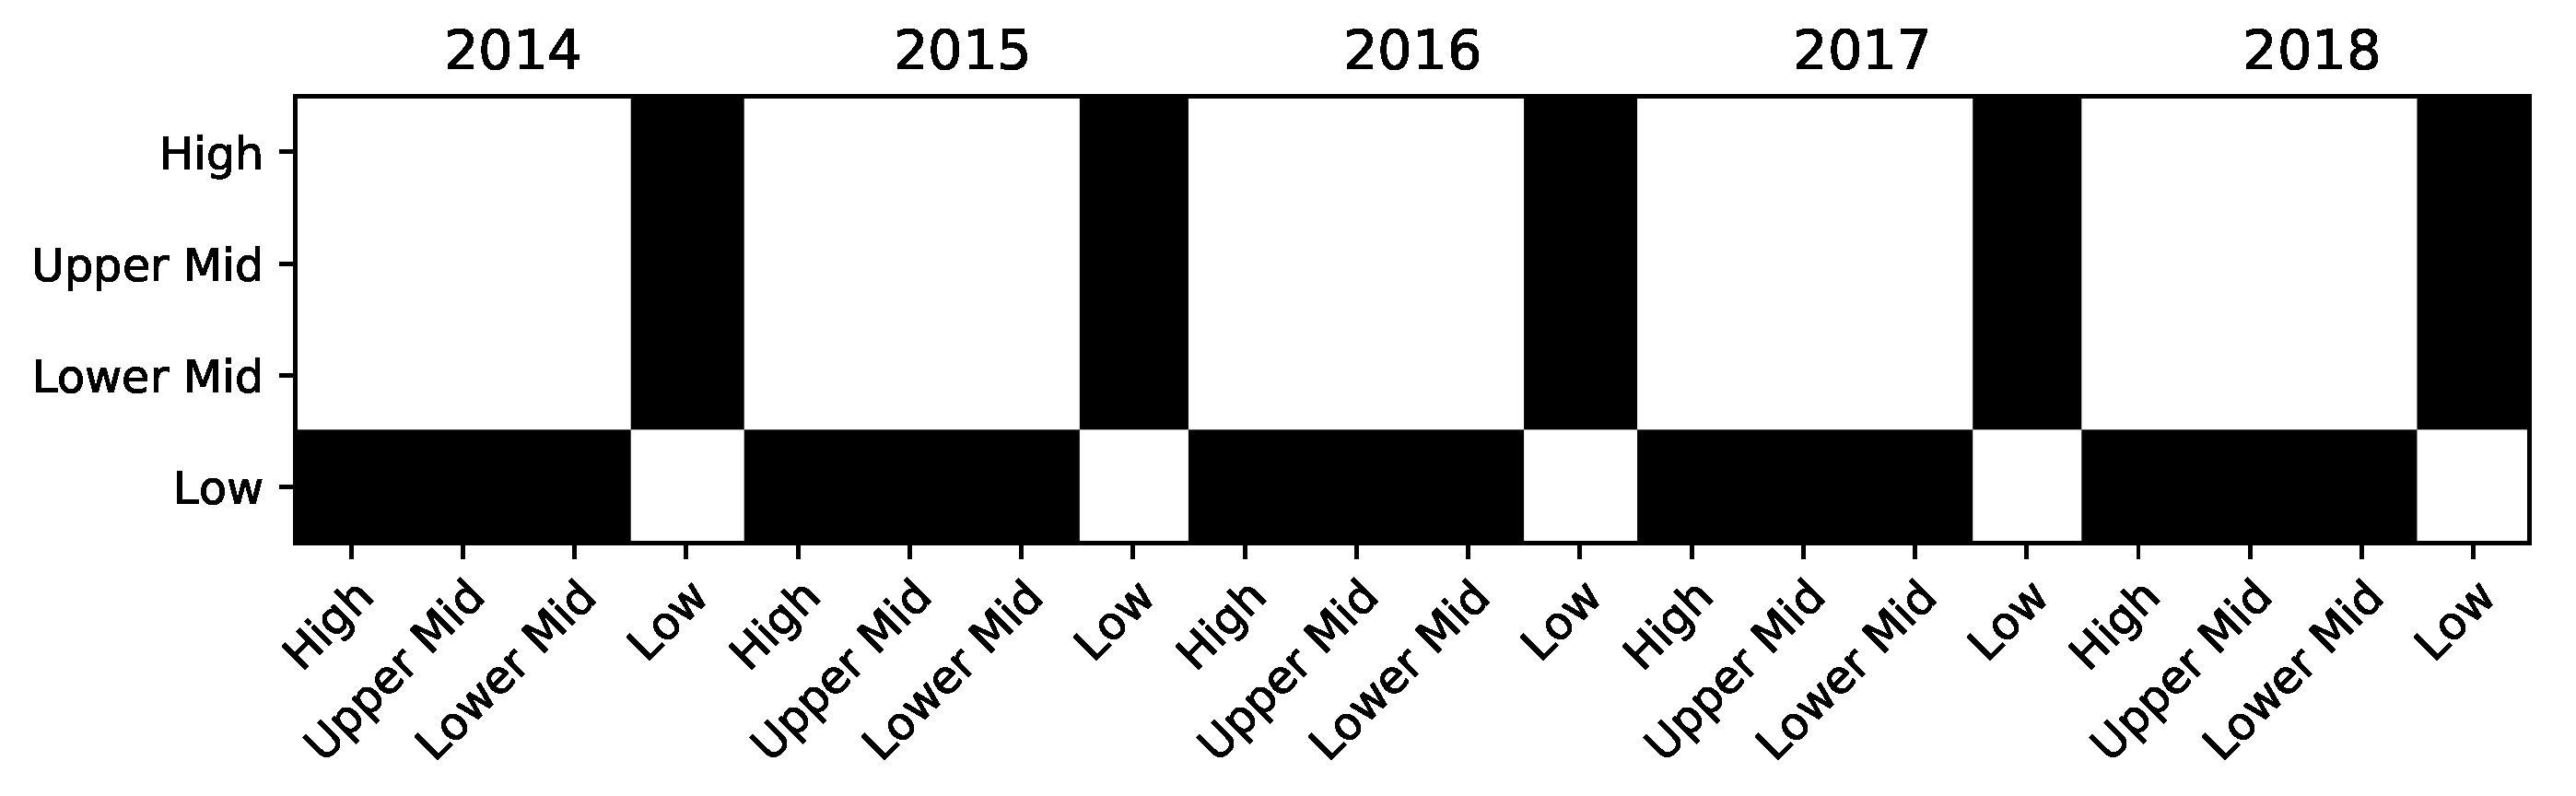
To test this, we use a series of Kolmogorov–Smirnov tests to test the null hypothesis that the distribution of the number of collaborating nations per paper does not vary across income groups. The Kolmogorov–Smirnov test is a non-parametric test which tests the hypothesis that two distributions are equal by comparing their estimated cumulative distribution functions. We perform pairwise Kolmogorov–Smirnov tests for all possible pairs of income groups for each year from 2014 through 2018 and reject the null hypothesis if the test produces a significant difference at the 5% level. We choose 2014 through 2018 as our time frame because these are the only years in which low-income nations contributed to at least 100 papers published in MDPI journals.
The results from each year between 2014 and 2018 are consistent and indicate that researchers from low-income nations collaborate more frequently than researchers from wealthier nations. In the remaining three classifications (high income, upper middle income, and lower income), we find that there is no significant difference in the distribution of nations collaborating on papers published by researchers. These results are summarized below in Figure 8. Black squares represent rejections of the null hypothesis that the distribution of the number of collaborating nations per paper does not vary across a given pair of income groups in that year. The results are robust to the removal of papers with greater than 20 nations represented, with the lone exception of the distributions for upper-middle- and low-income nations in 2016. We do mention that the distributions for upper-middle- and low-income nations in 2016 were significantly different at the 10% level during the robustness checks.
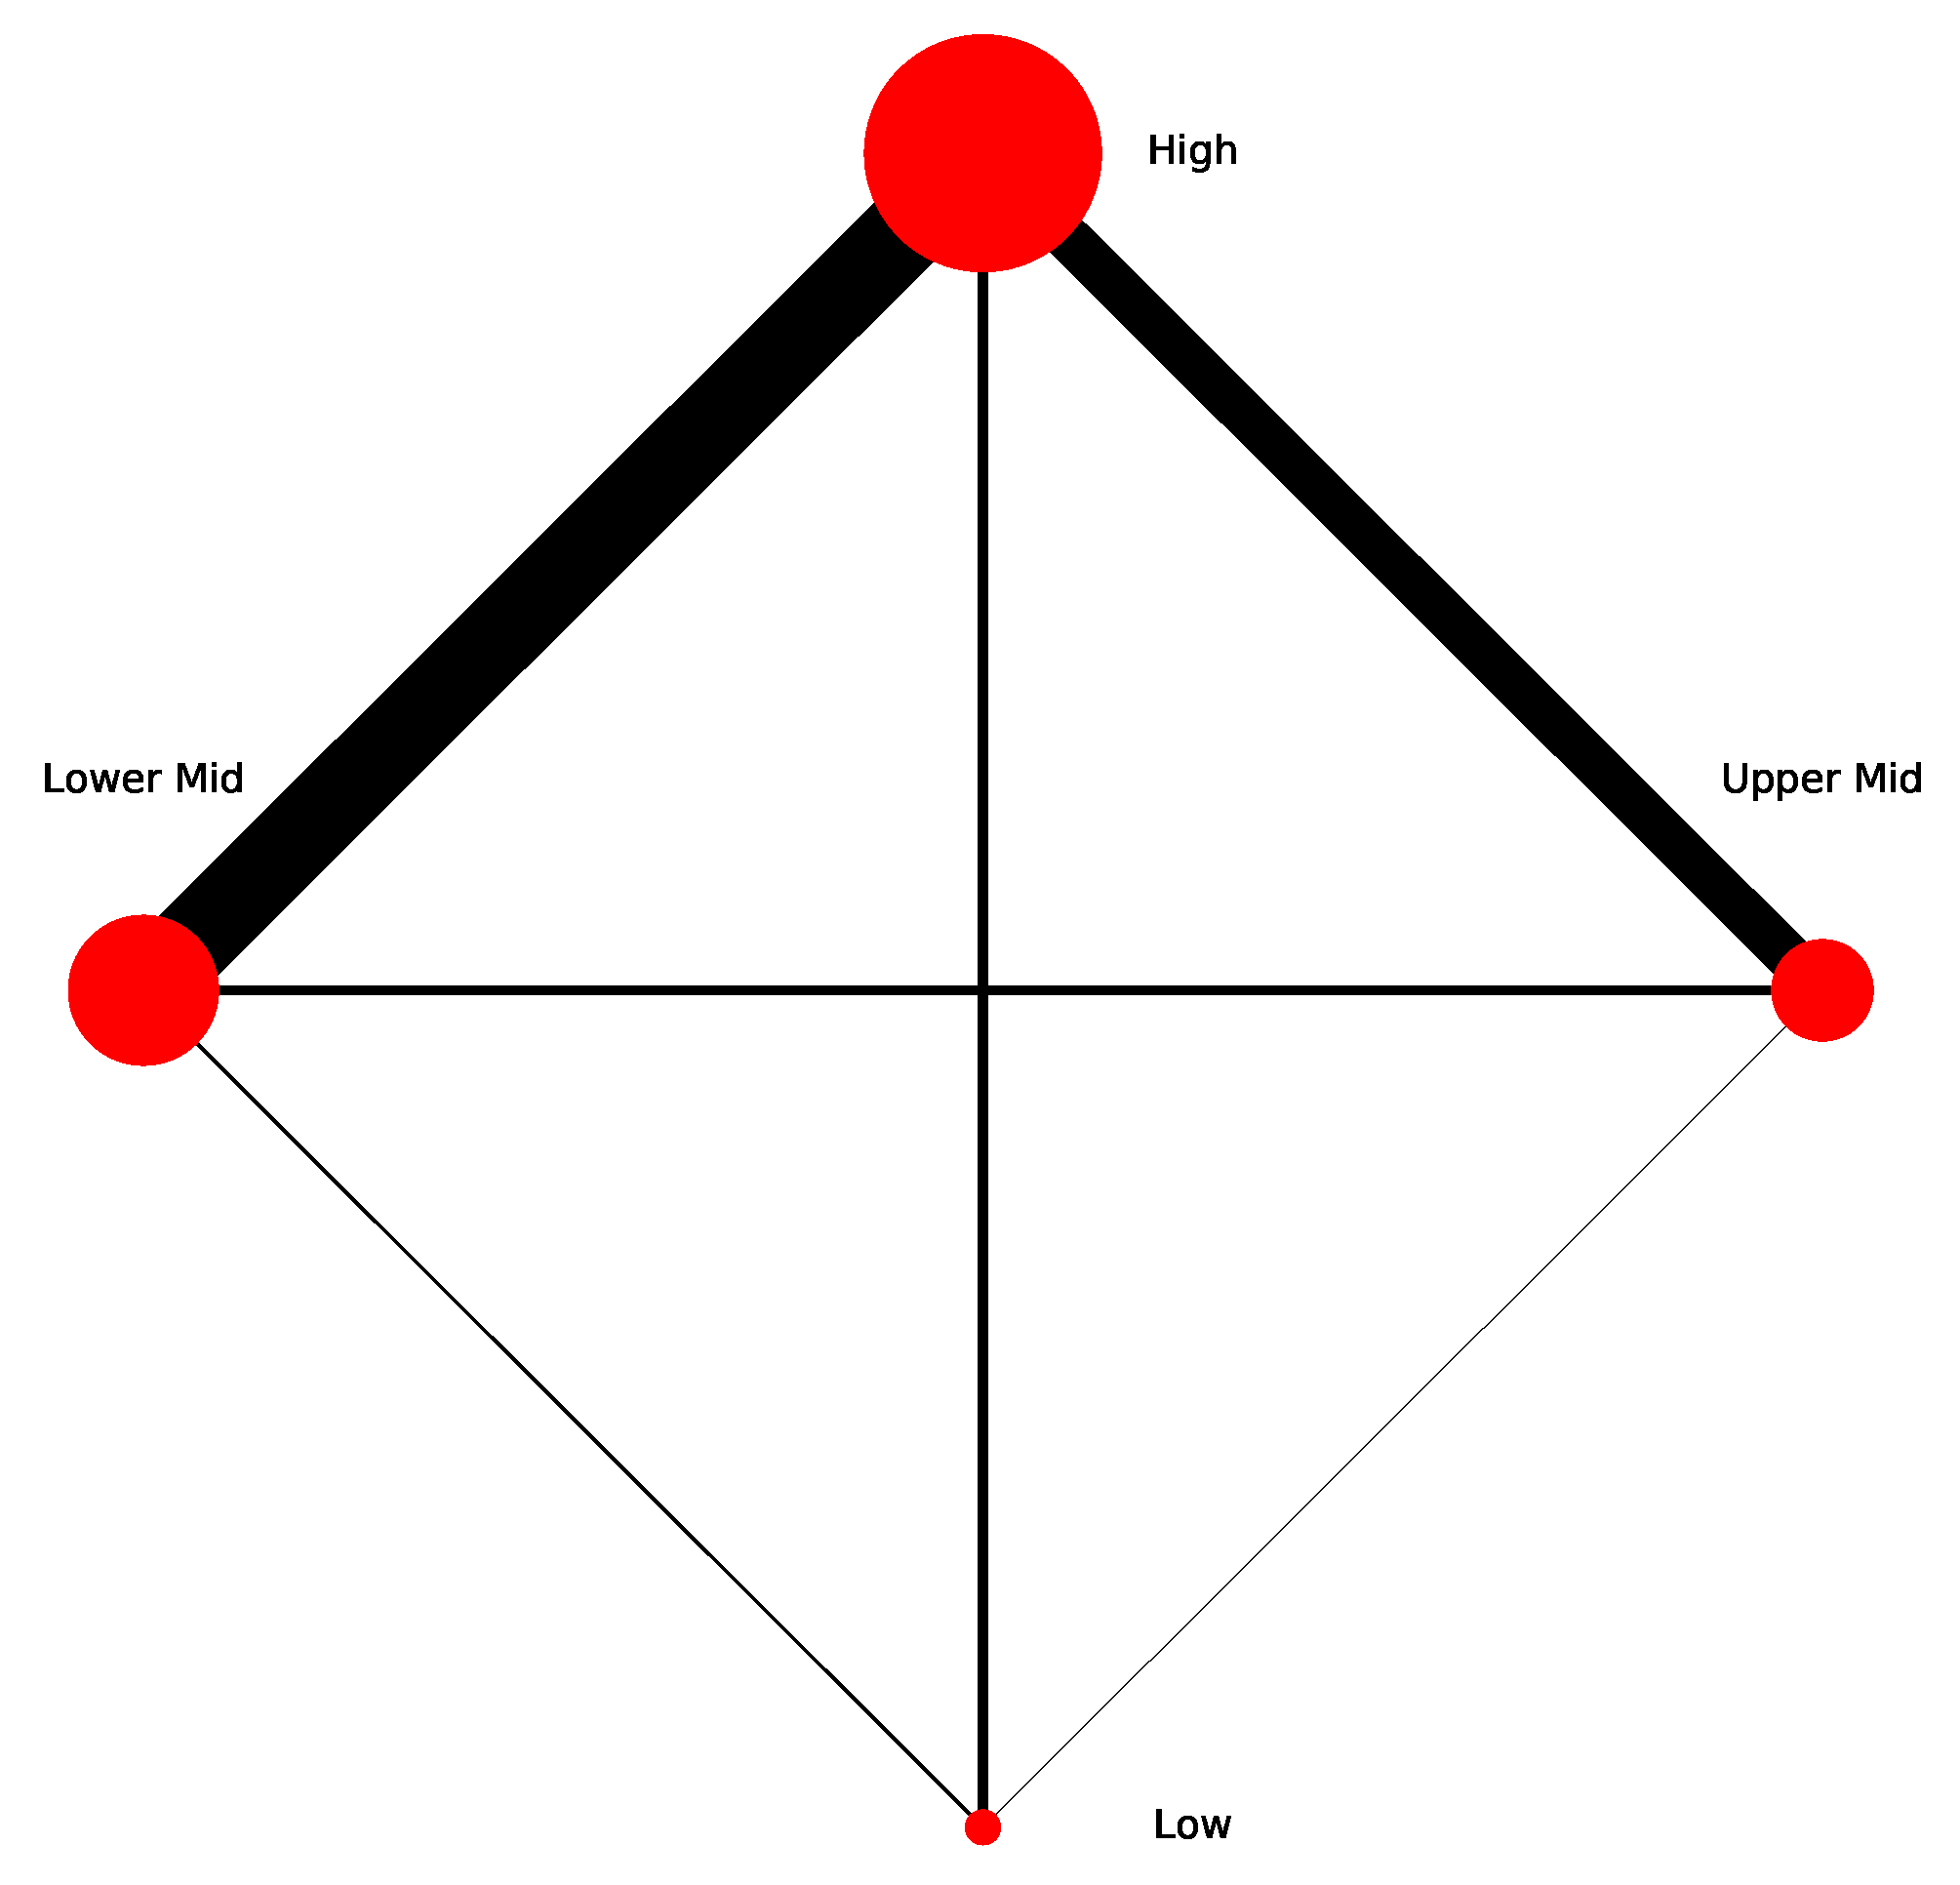
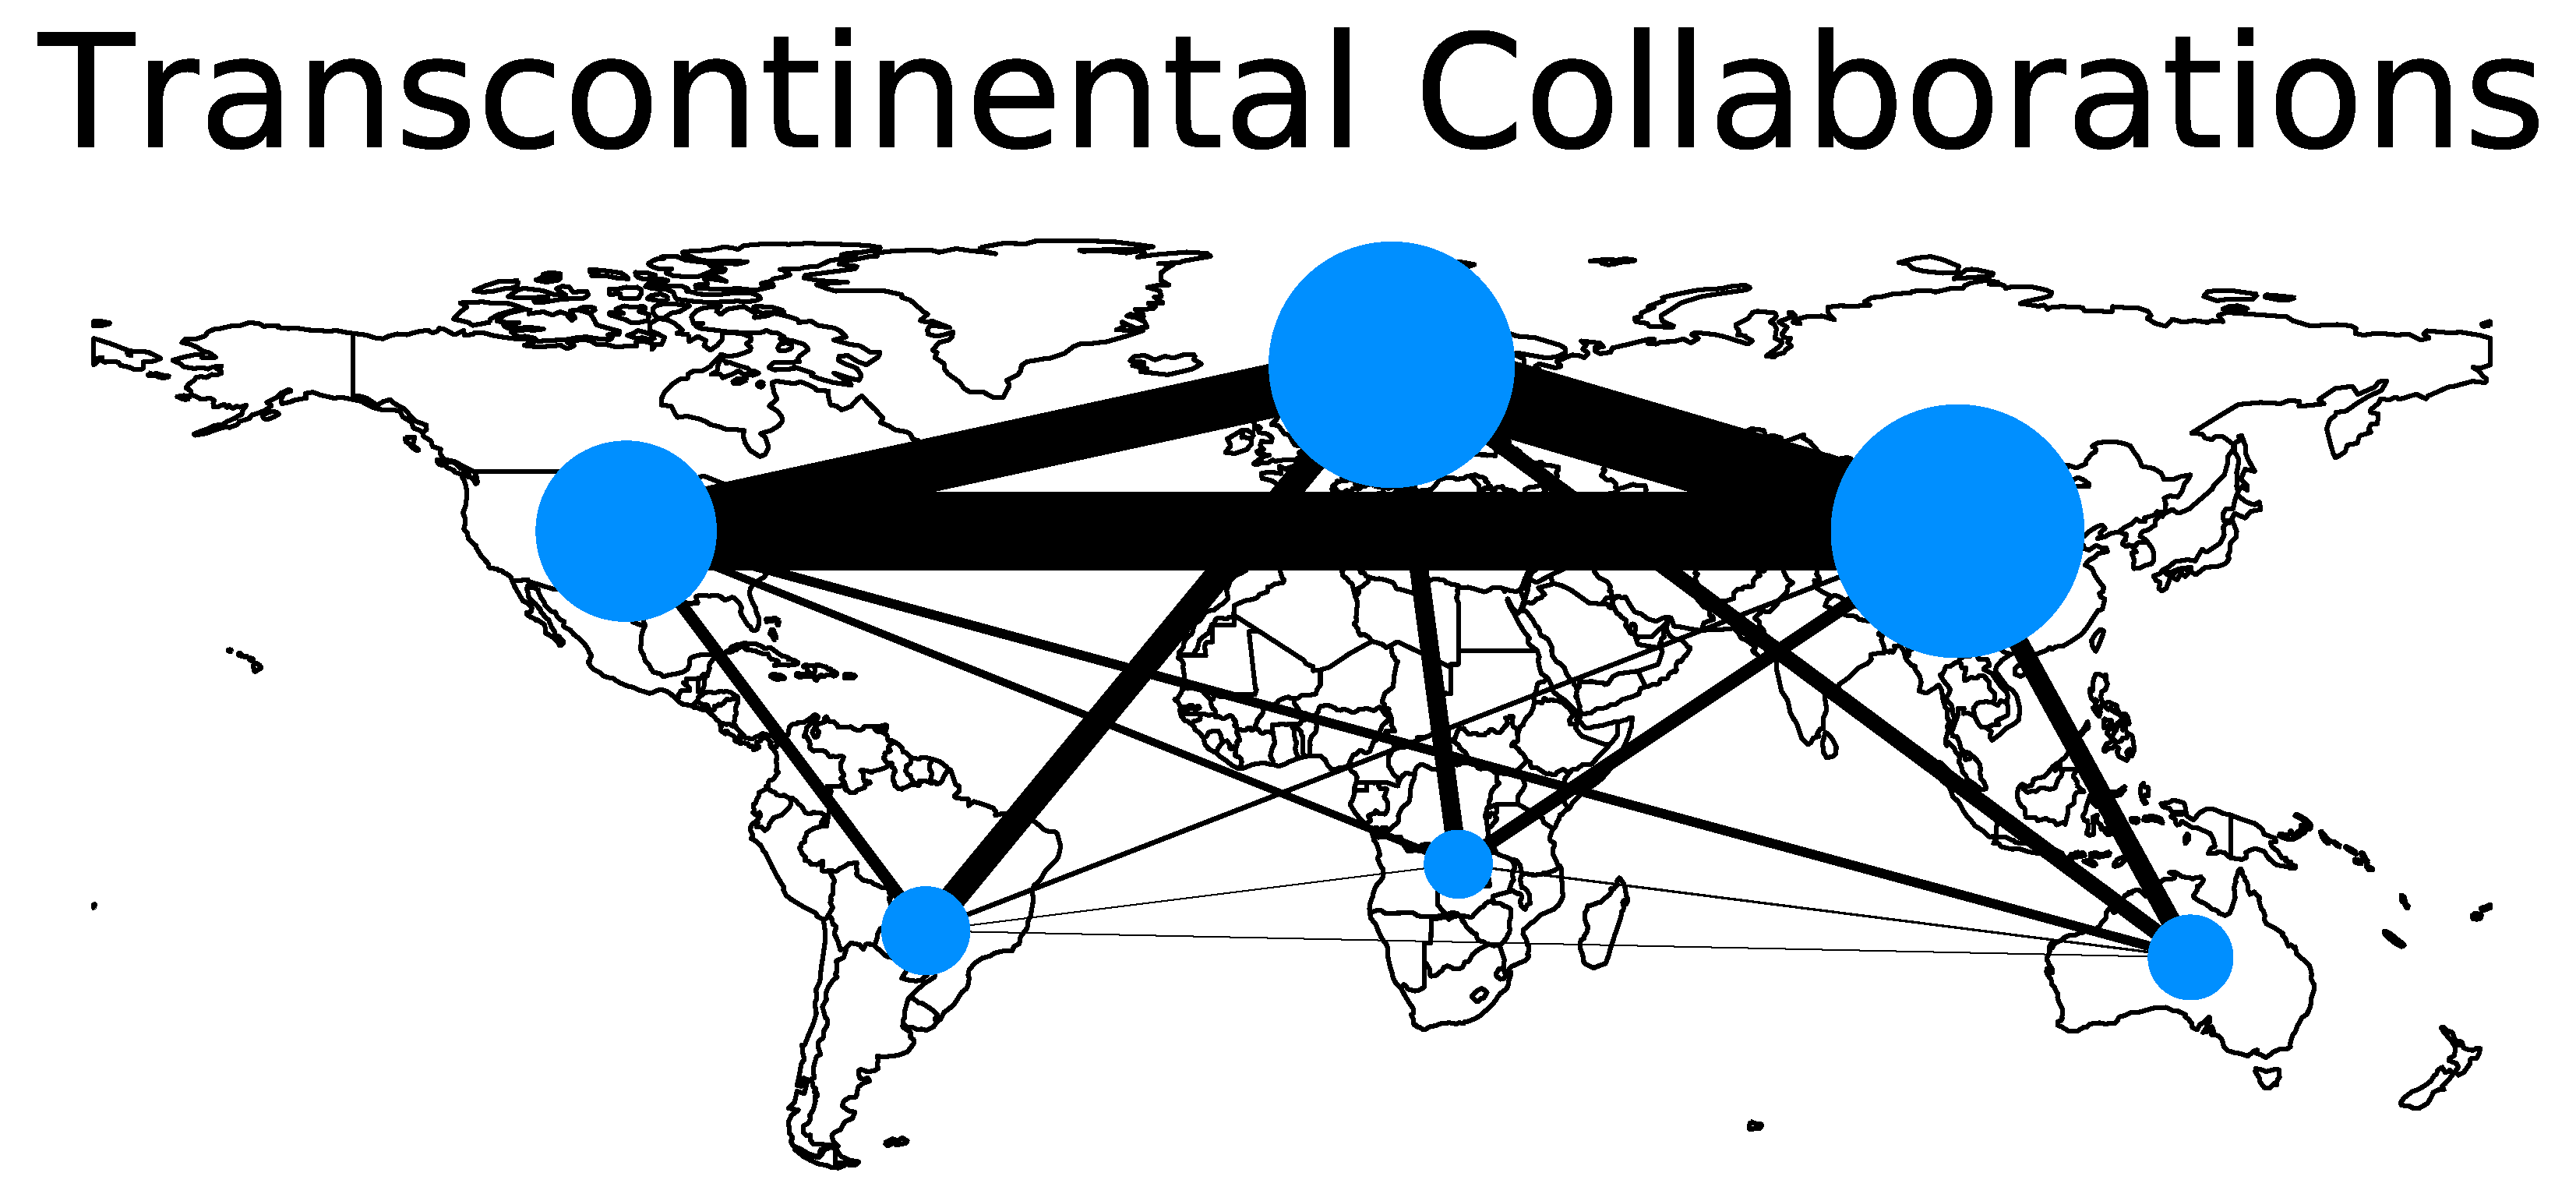
To depict the collaboration tendencies exhibited by each income group, we present in Figure 9 a graph which shows both the difference in the volume of publications by income group and the differences in the volume of collaborations involving nations from different income groups.
We have shown that researchers in low-income nations form international collaboration more frequently than researchers in wealthier nations, but are these high-income, upper-middle-income, or lower-middle-income nations? To answer this question, we look at the income group of the most frequent collaborator of each nation. To make this analysis more palatable, we divide the world into six different regions and study each individually. The regions are: Africa, Asia, Europe, North America (excluding Central America), Oceania, and South and Central America.
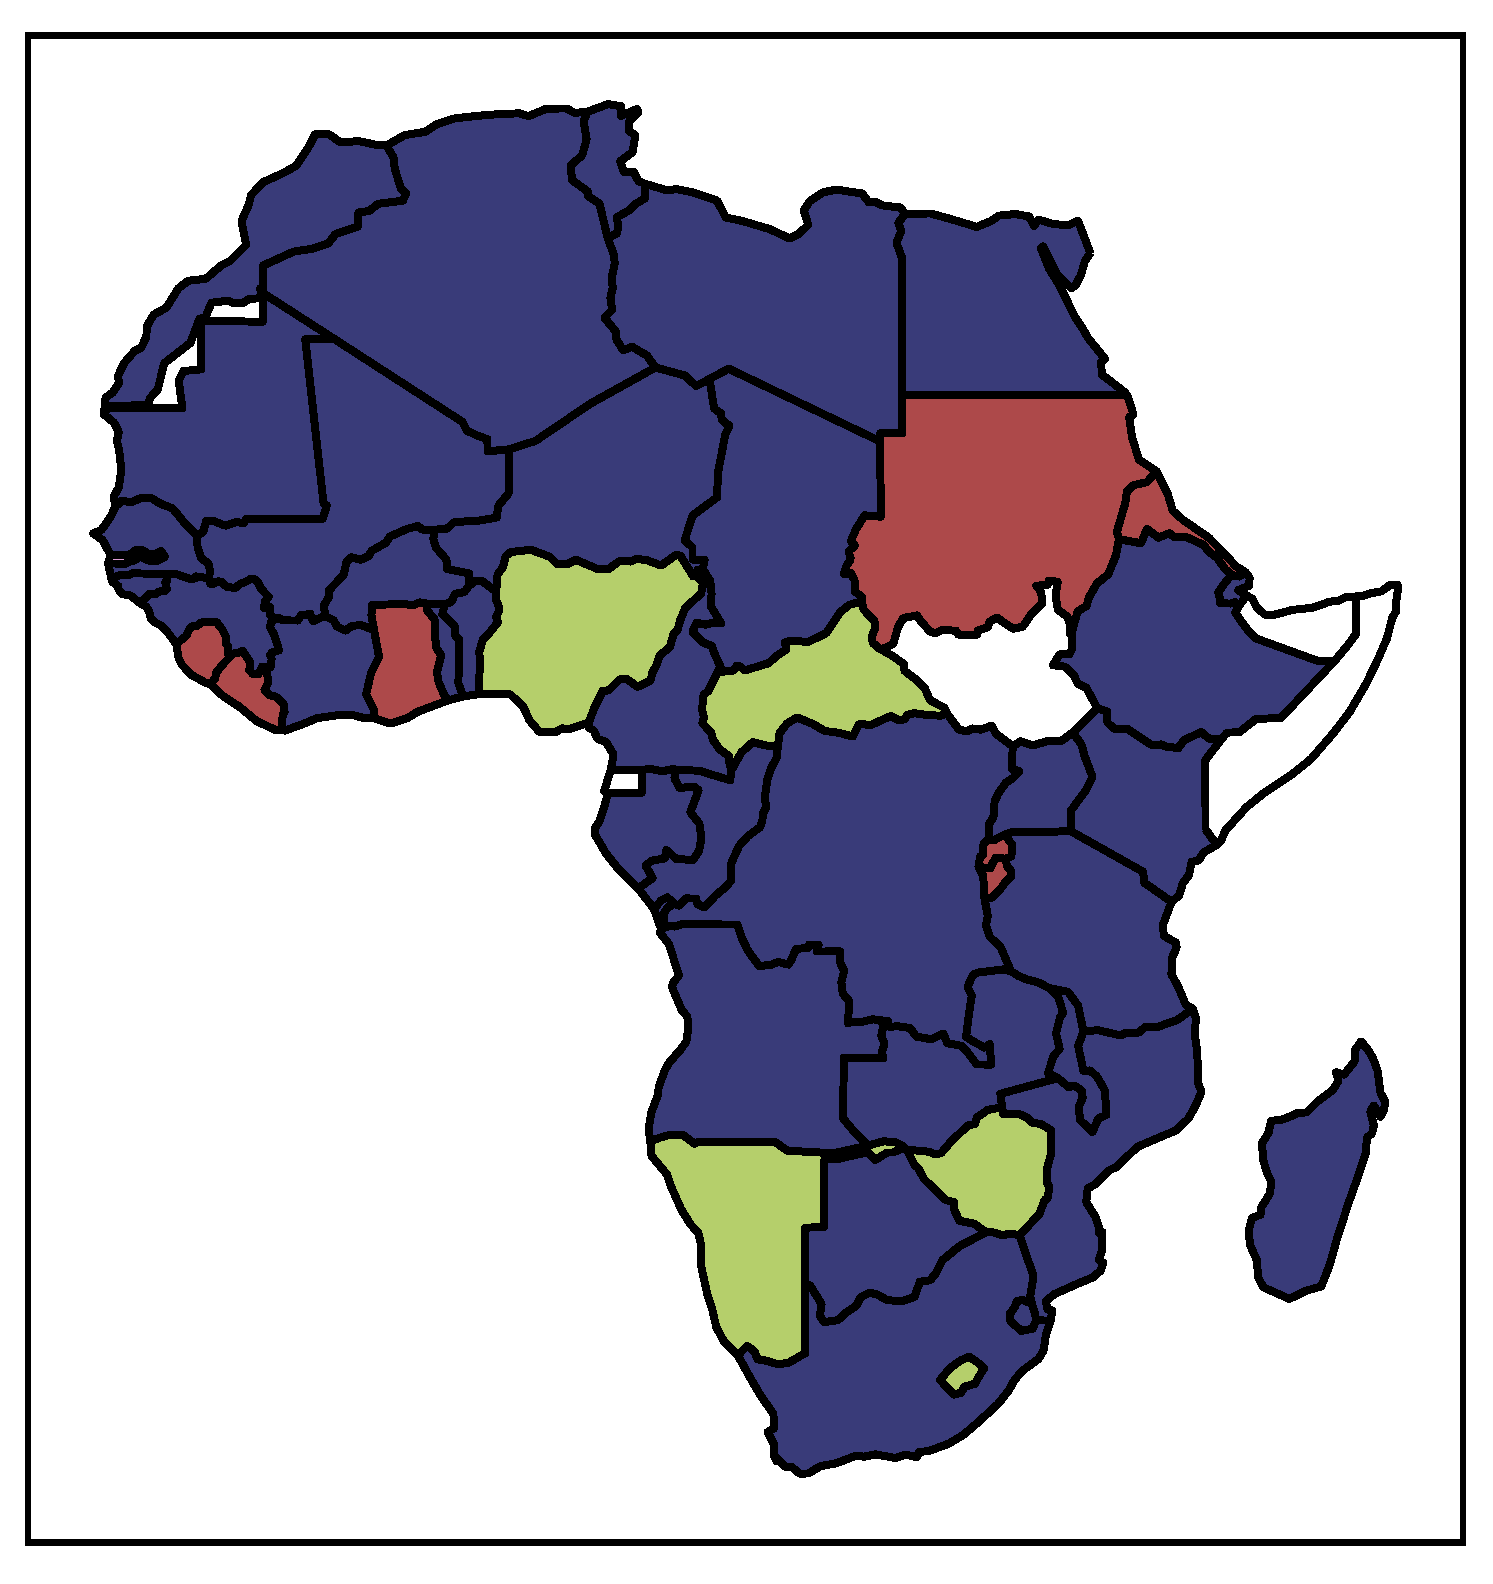
We begin with Africa. In Figure 10, we show the income group of the most frequent collaborator of each nation. Blue represents nations which most frequently collaborate with a high-income nation, green represents nations which most frequently collaborate with an upper-middle-income nation, red represents nations which most frequently collaborate with a lower-middle-income nation, pink represents nations which most frequently collaborate with a low-income nation, and white represents nations for which there are no data. No nations collaborated most frequently with a low-income nation over the time period 1996 through 2018. Interestingly, in 2018, the most frequent collaborator of Niger was Burkina Faso, a low-income nation. However, Burkina Faso is a geographic neighbor of Niger and both have French as an official language, thereby making collaborations between these two nations relatively easy to develop. That nations, particularly African nations, form collaborations in part based on geographic proximity and shared language and cultural aspects confirms the existing literature on international collaborations generally [40,41,42,43,44,45] and for Africa specifically [14].
As can be seen in Figure 10, the overwhelming majority of nations in Africa collaborated most frequently with a high-income nation. Given that many African nations are categorized as low-income, this provides support that low-income nations not only form international collaborations more often, but that they are also doing so with high-income nations, i.e., with researchers from nations which are most likely to help alleviate the financial constraint in open access publishing.
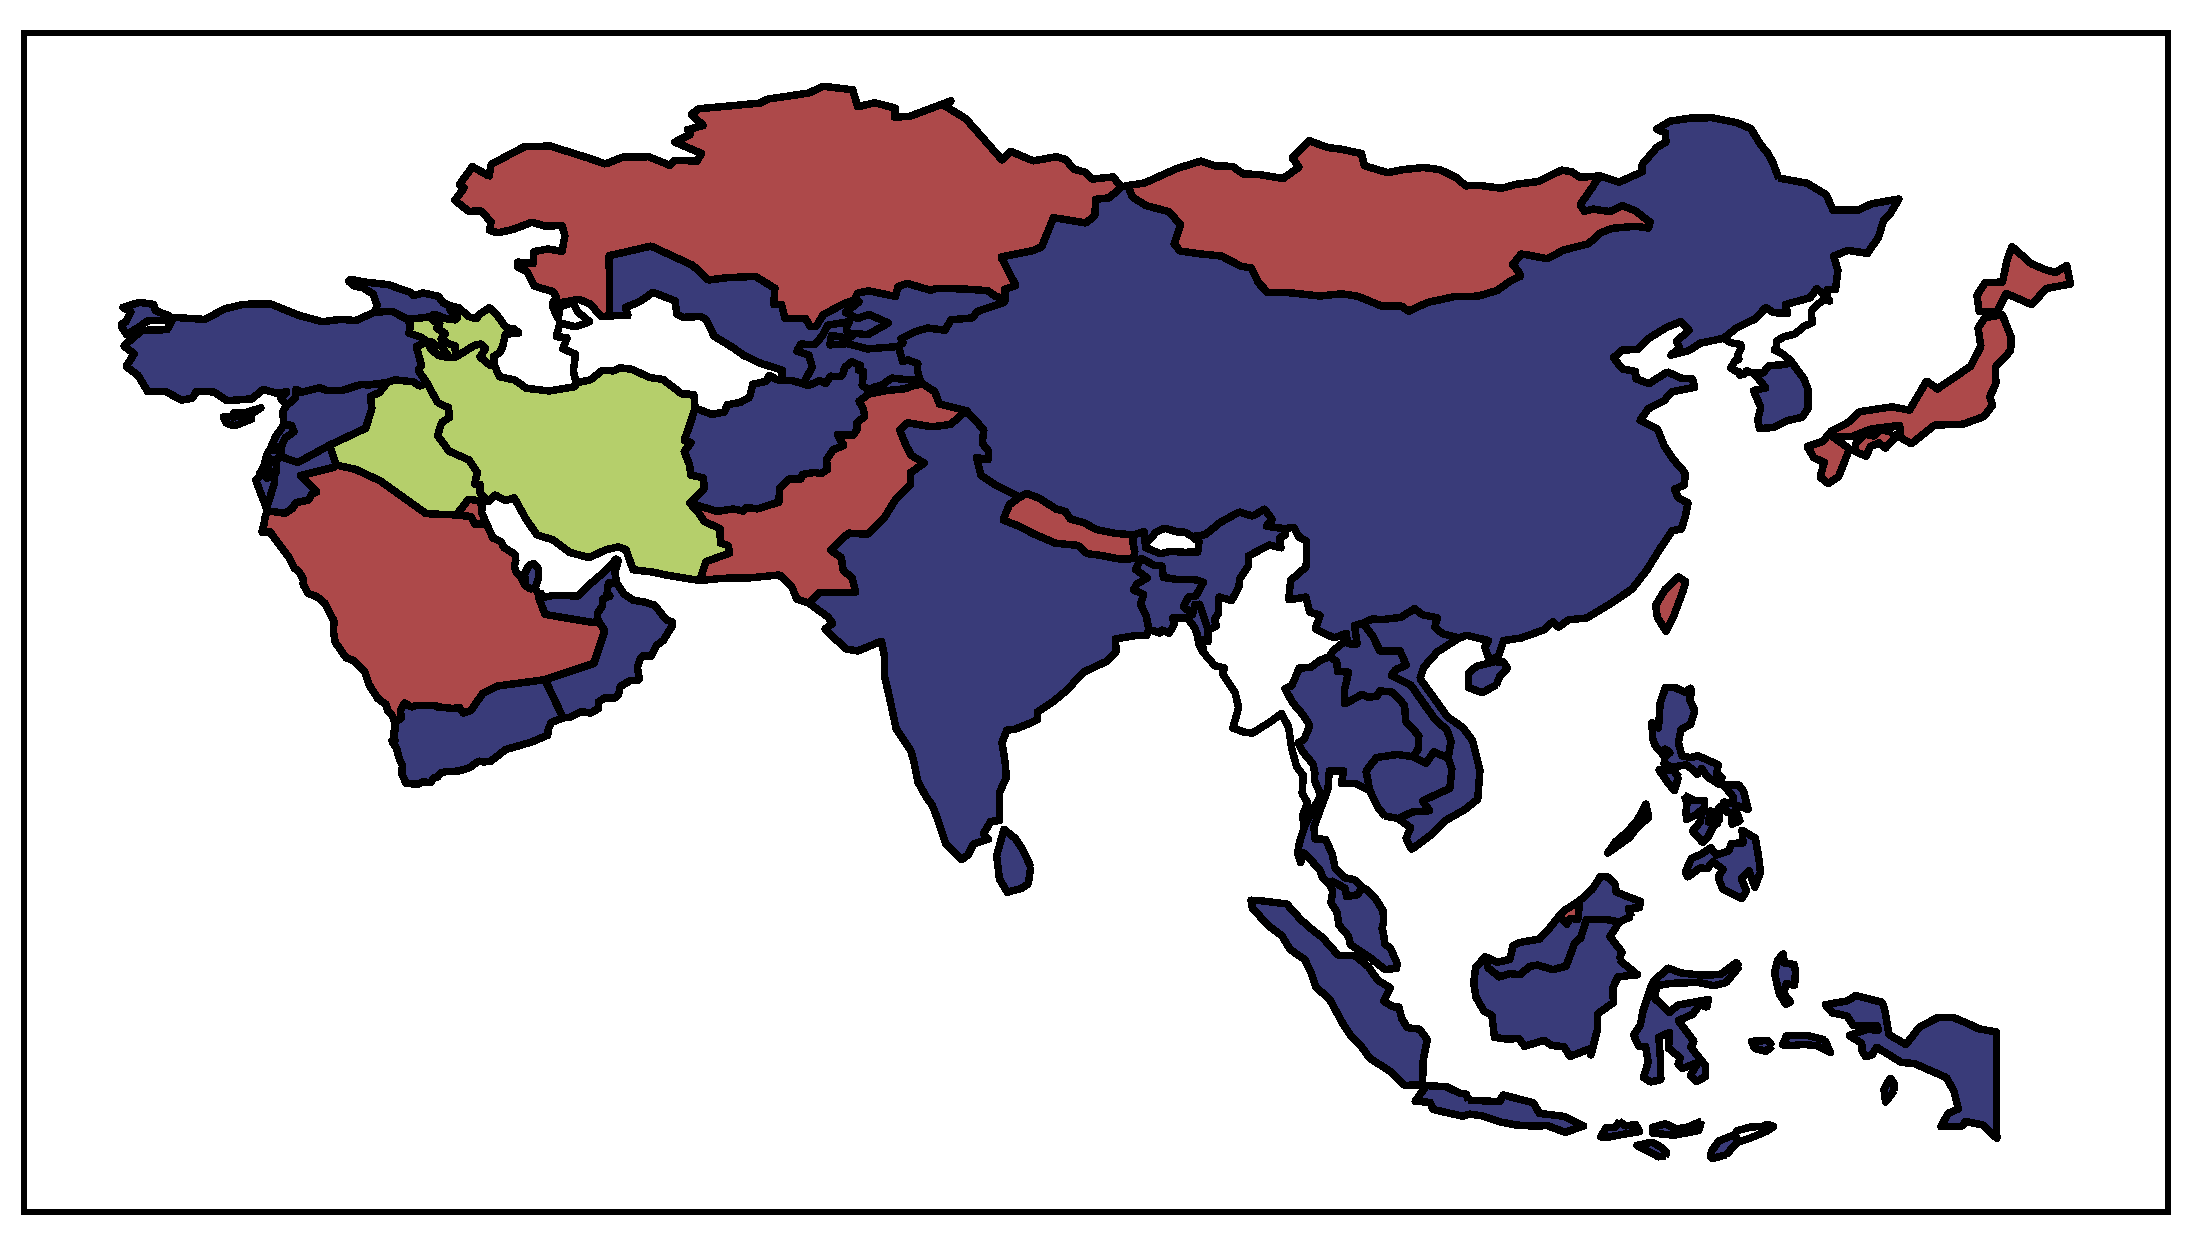
Next, we turn our attention to Asia. As can be seen in Figure 11, most nations collaborate most frequently with high-income nations. However, China, a lower-middle-income nation, has a strong collaborative presence throughout Asia. With the exception of Saudia Arabia (who most frequently collaborated with Egypt) and Iran and Iraq (who both most frequently collaborated with Malaysia), all Asian nations that did not most frequently collaborate with a high-income nation instead collaborated most frequently with China. This even includes the high-income nation of Japan. These results are consistent with previous research that looked at international collaborations within Asia [23]. However, given the rapid expansion of Chinese research over the past several decades, this result is not unexpected and, in fact, still supports the thesis of this paper, since these nations which collaborate most frequently with China are low- and lower-middle-income nations, with the lone exception of Kazakhstan, which is categorized as an upper-middle -ncome nation.
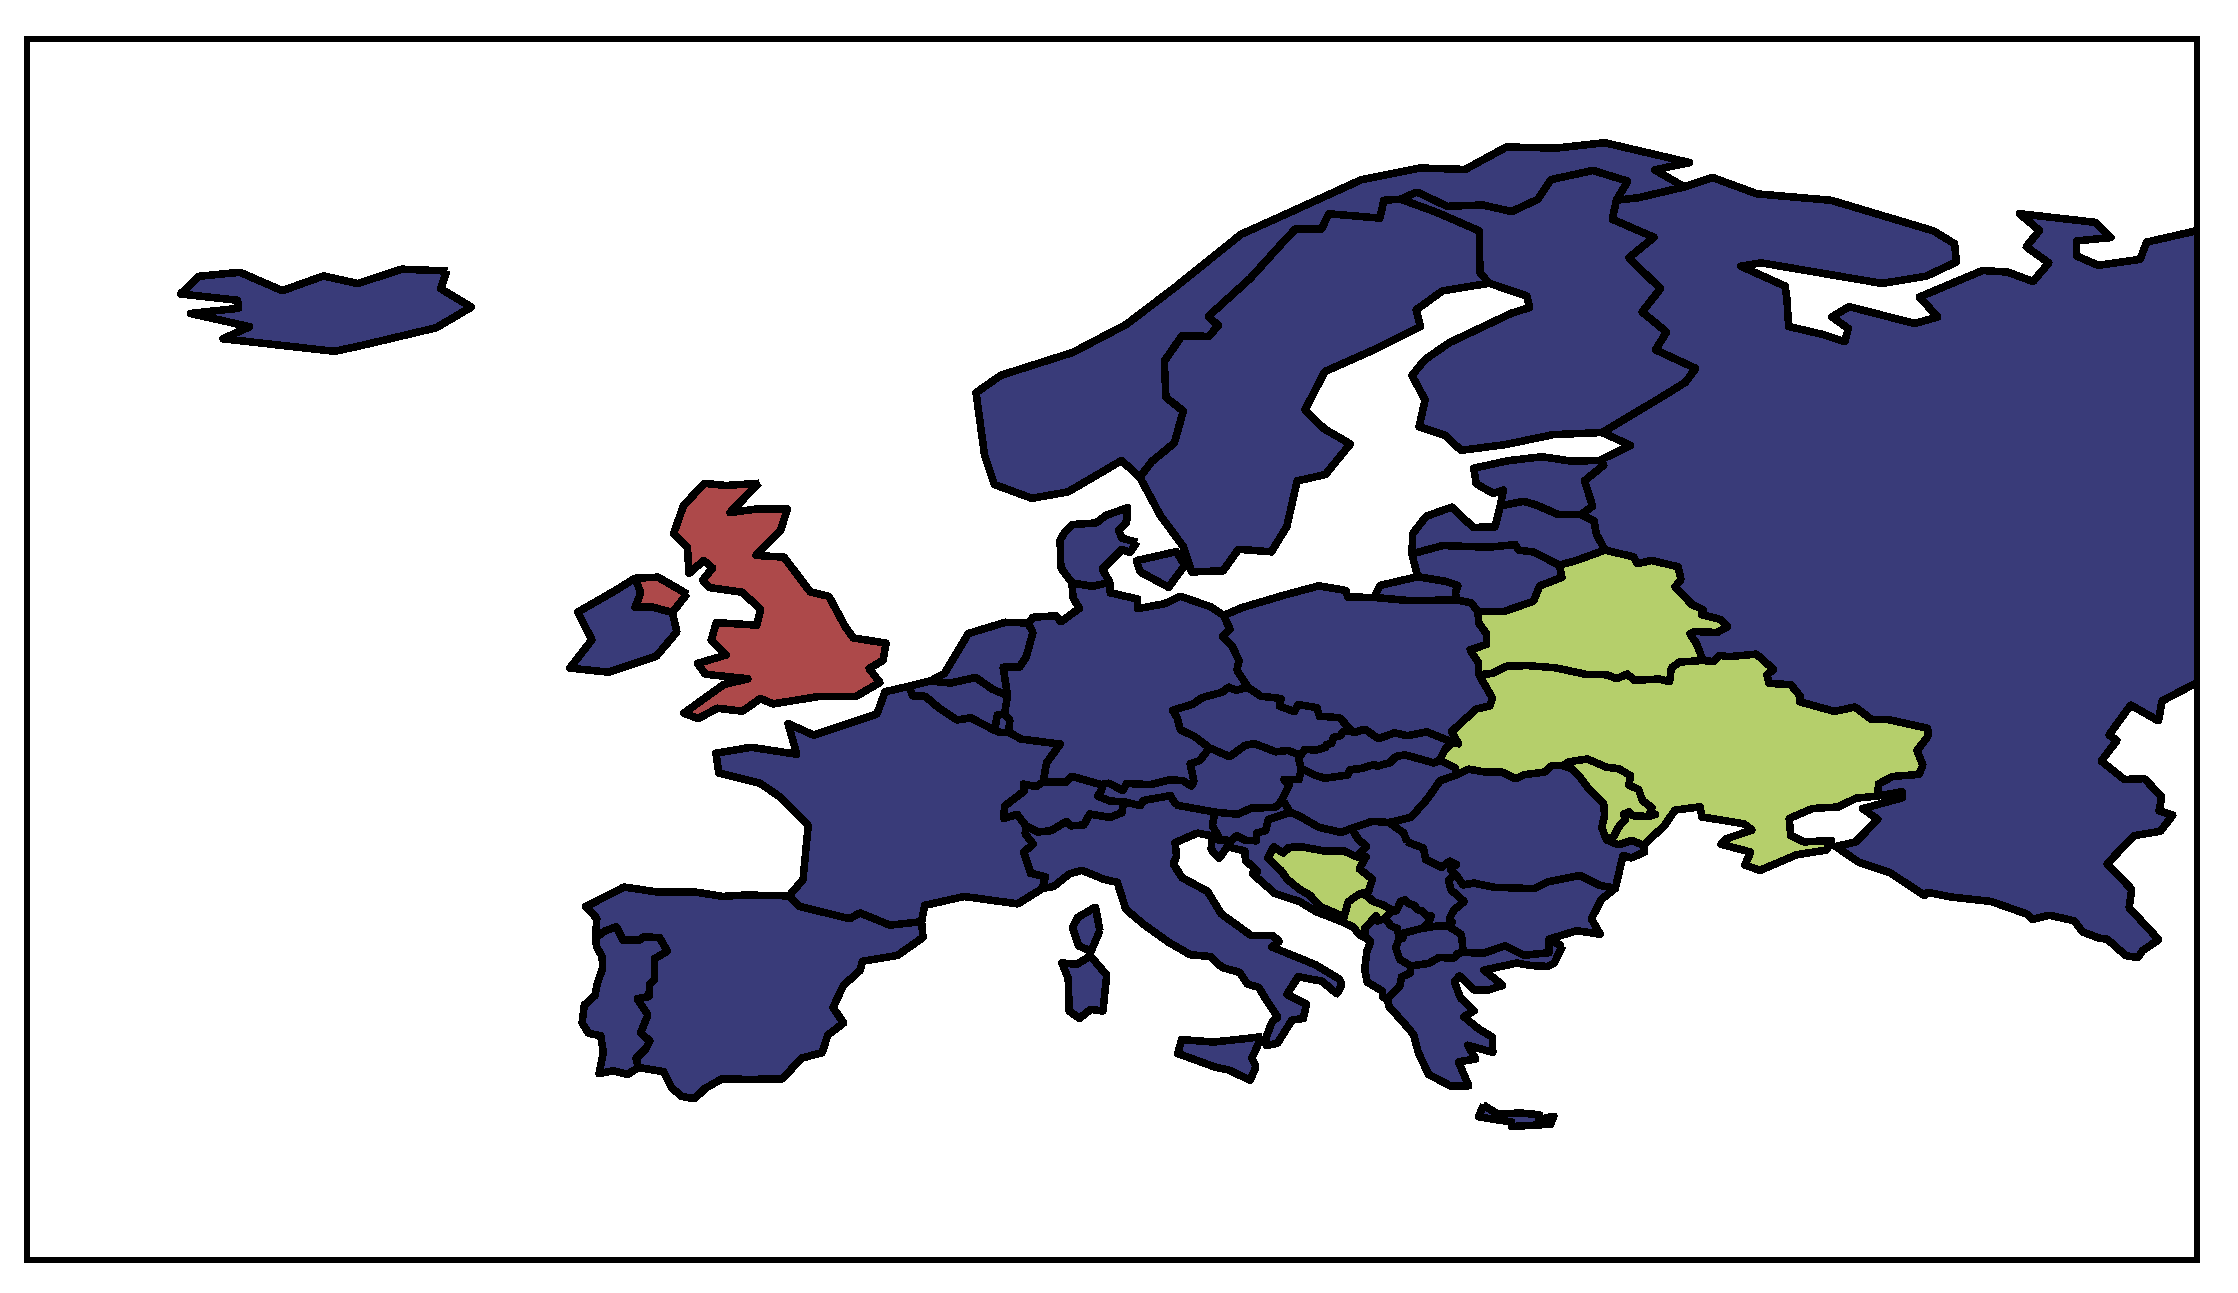
Moving on to Europe (Figure 12), we again see that most nations collaborate most frequently with high-income nations. The exceptions to this were the UK (China), Bosnia and Herzegovina (Serbia), Montenegro (Serbia), Moldova (Romania), Ukraine (Poland), and Belarus (Russia). With the exception of the UK, all of these examples represent collaboration with a geographic neighbor. Those European nations which most frequently collaborated with high-income nations collaborated most frequently with either other European nations or with the USA.
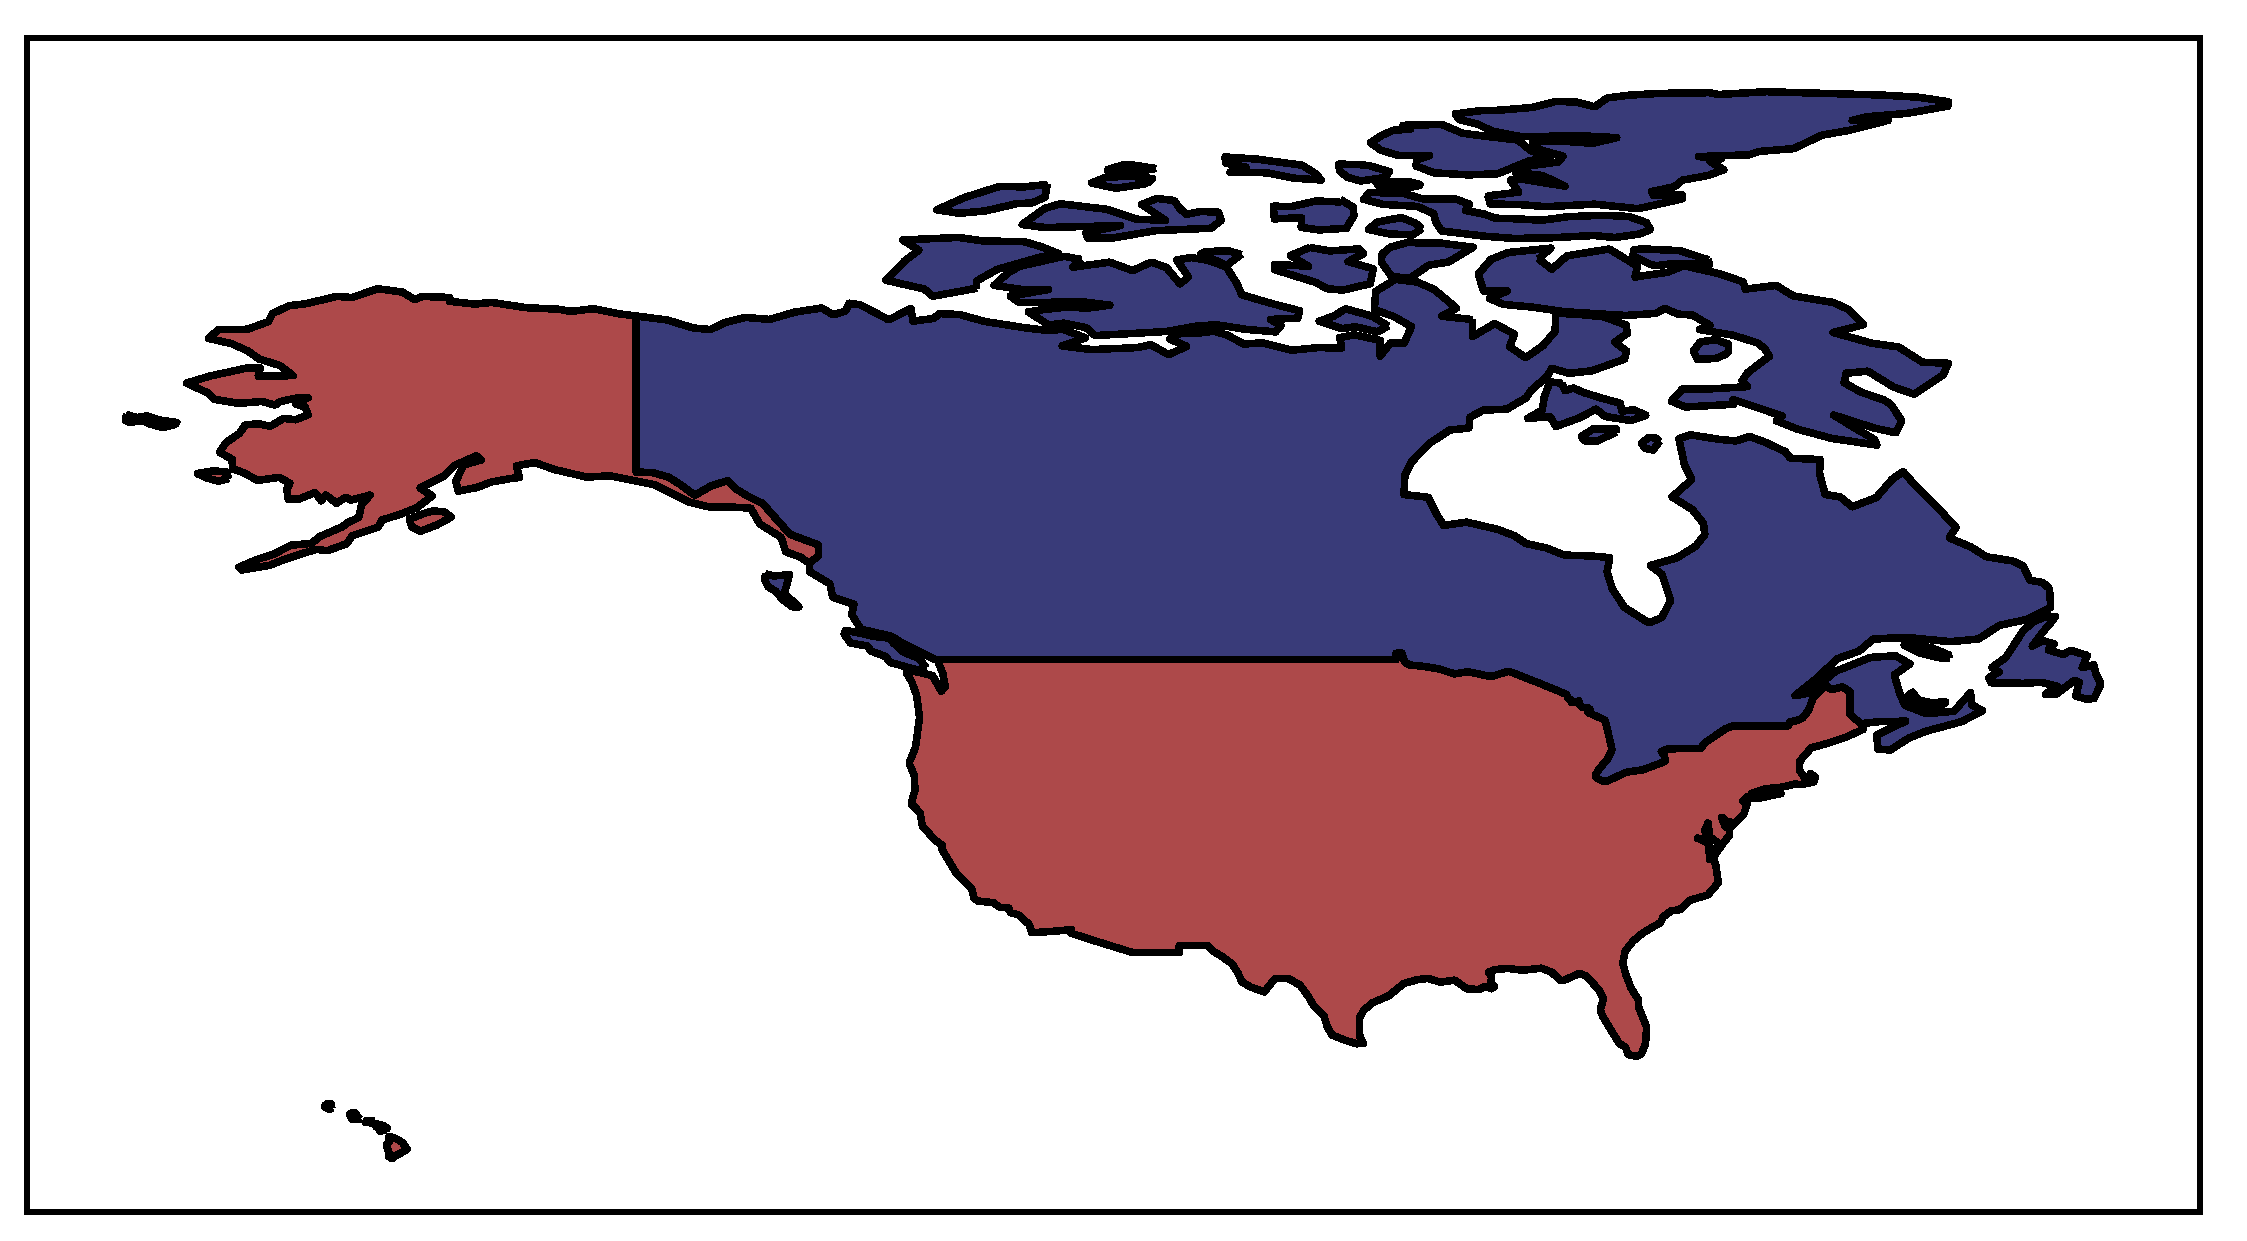
In North America, which here consists solely of Canada and the USA, we see a story similar to that of Europe. Canada most frequently collaborated with the USA, and the USA most frequently collaborated with China. This latter result fits the existing literature, which has also provided evidence that Chinese nationals in the USA contribute to the formation of a significant percentage of collaborations between the USA and China [46]. The results are depicted in Figure 13. While Mexico and the remainder of Central America are typically counted as North American countries, we include them in the conglomerate Central and South American region, as these countries are all relatively similar culturally, economically, and linguistically.
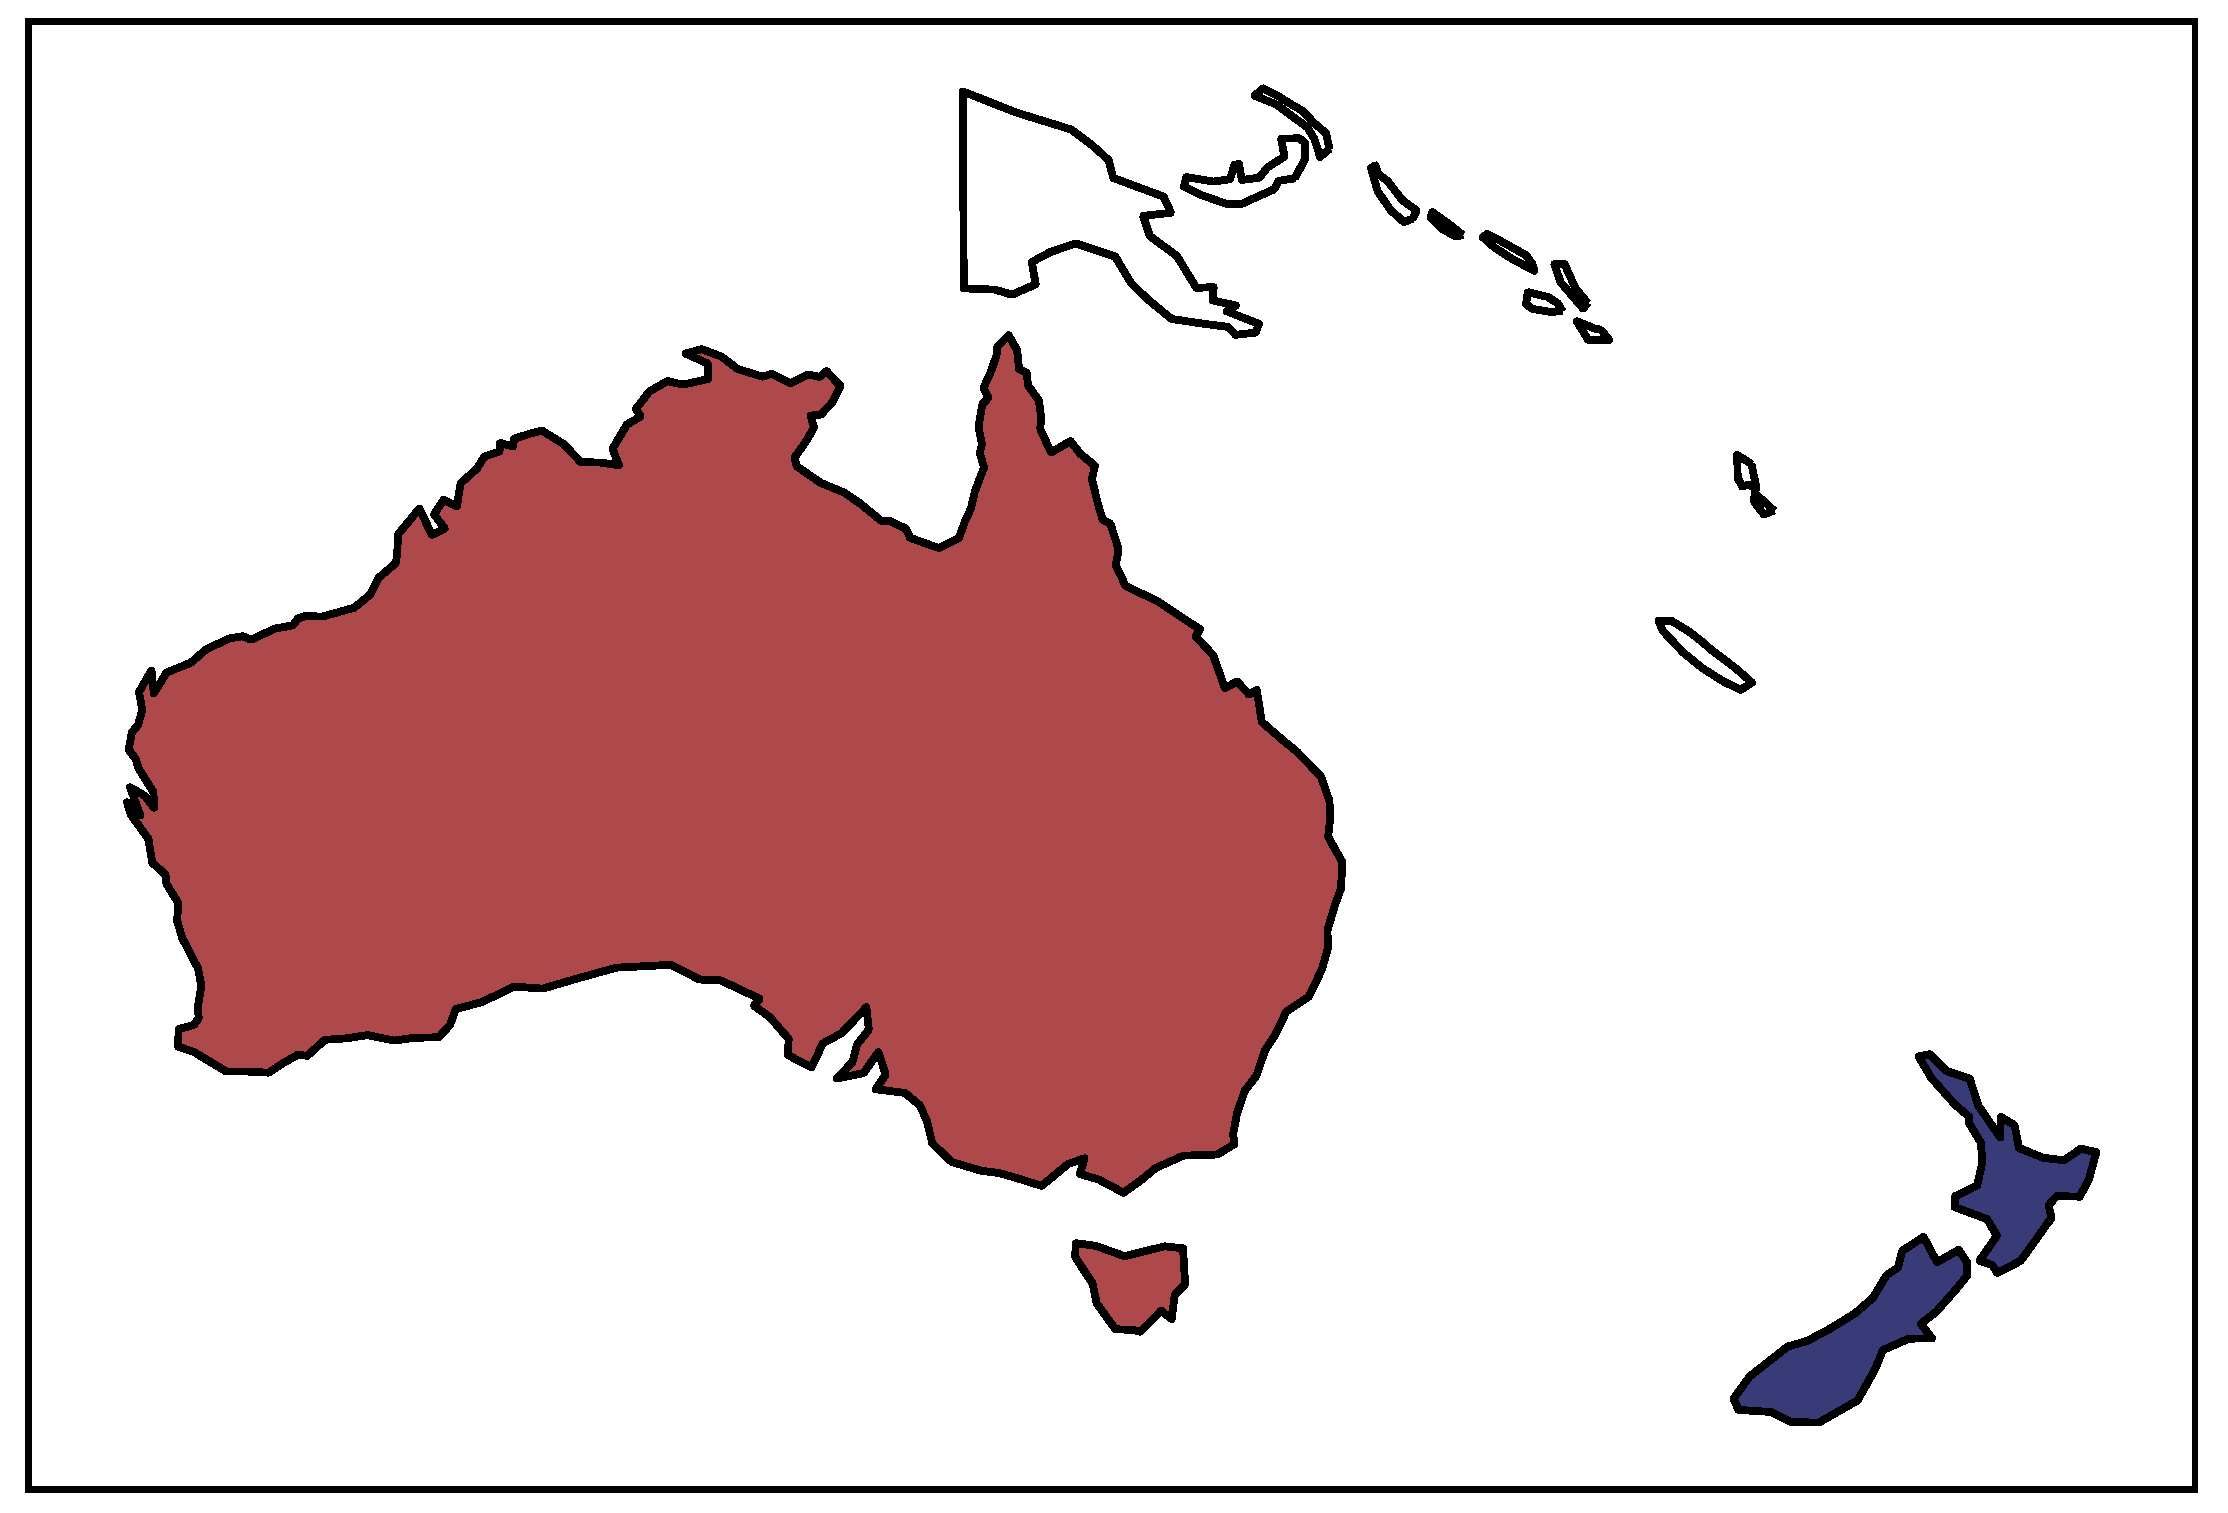
Oceanic nations (Figure 14) mirror North American nations in that New Zealand most frequently collaborated with Australia, while Australia most frequently collaborated with China.
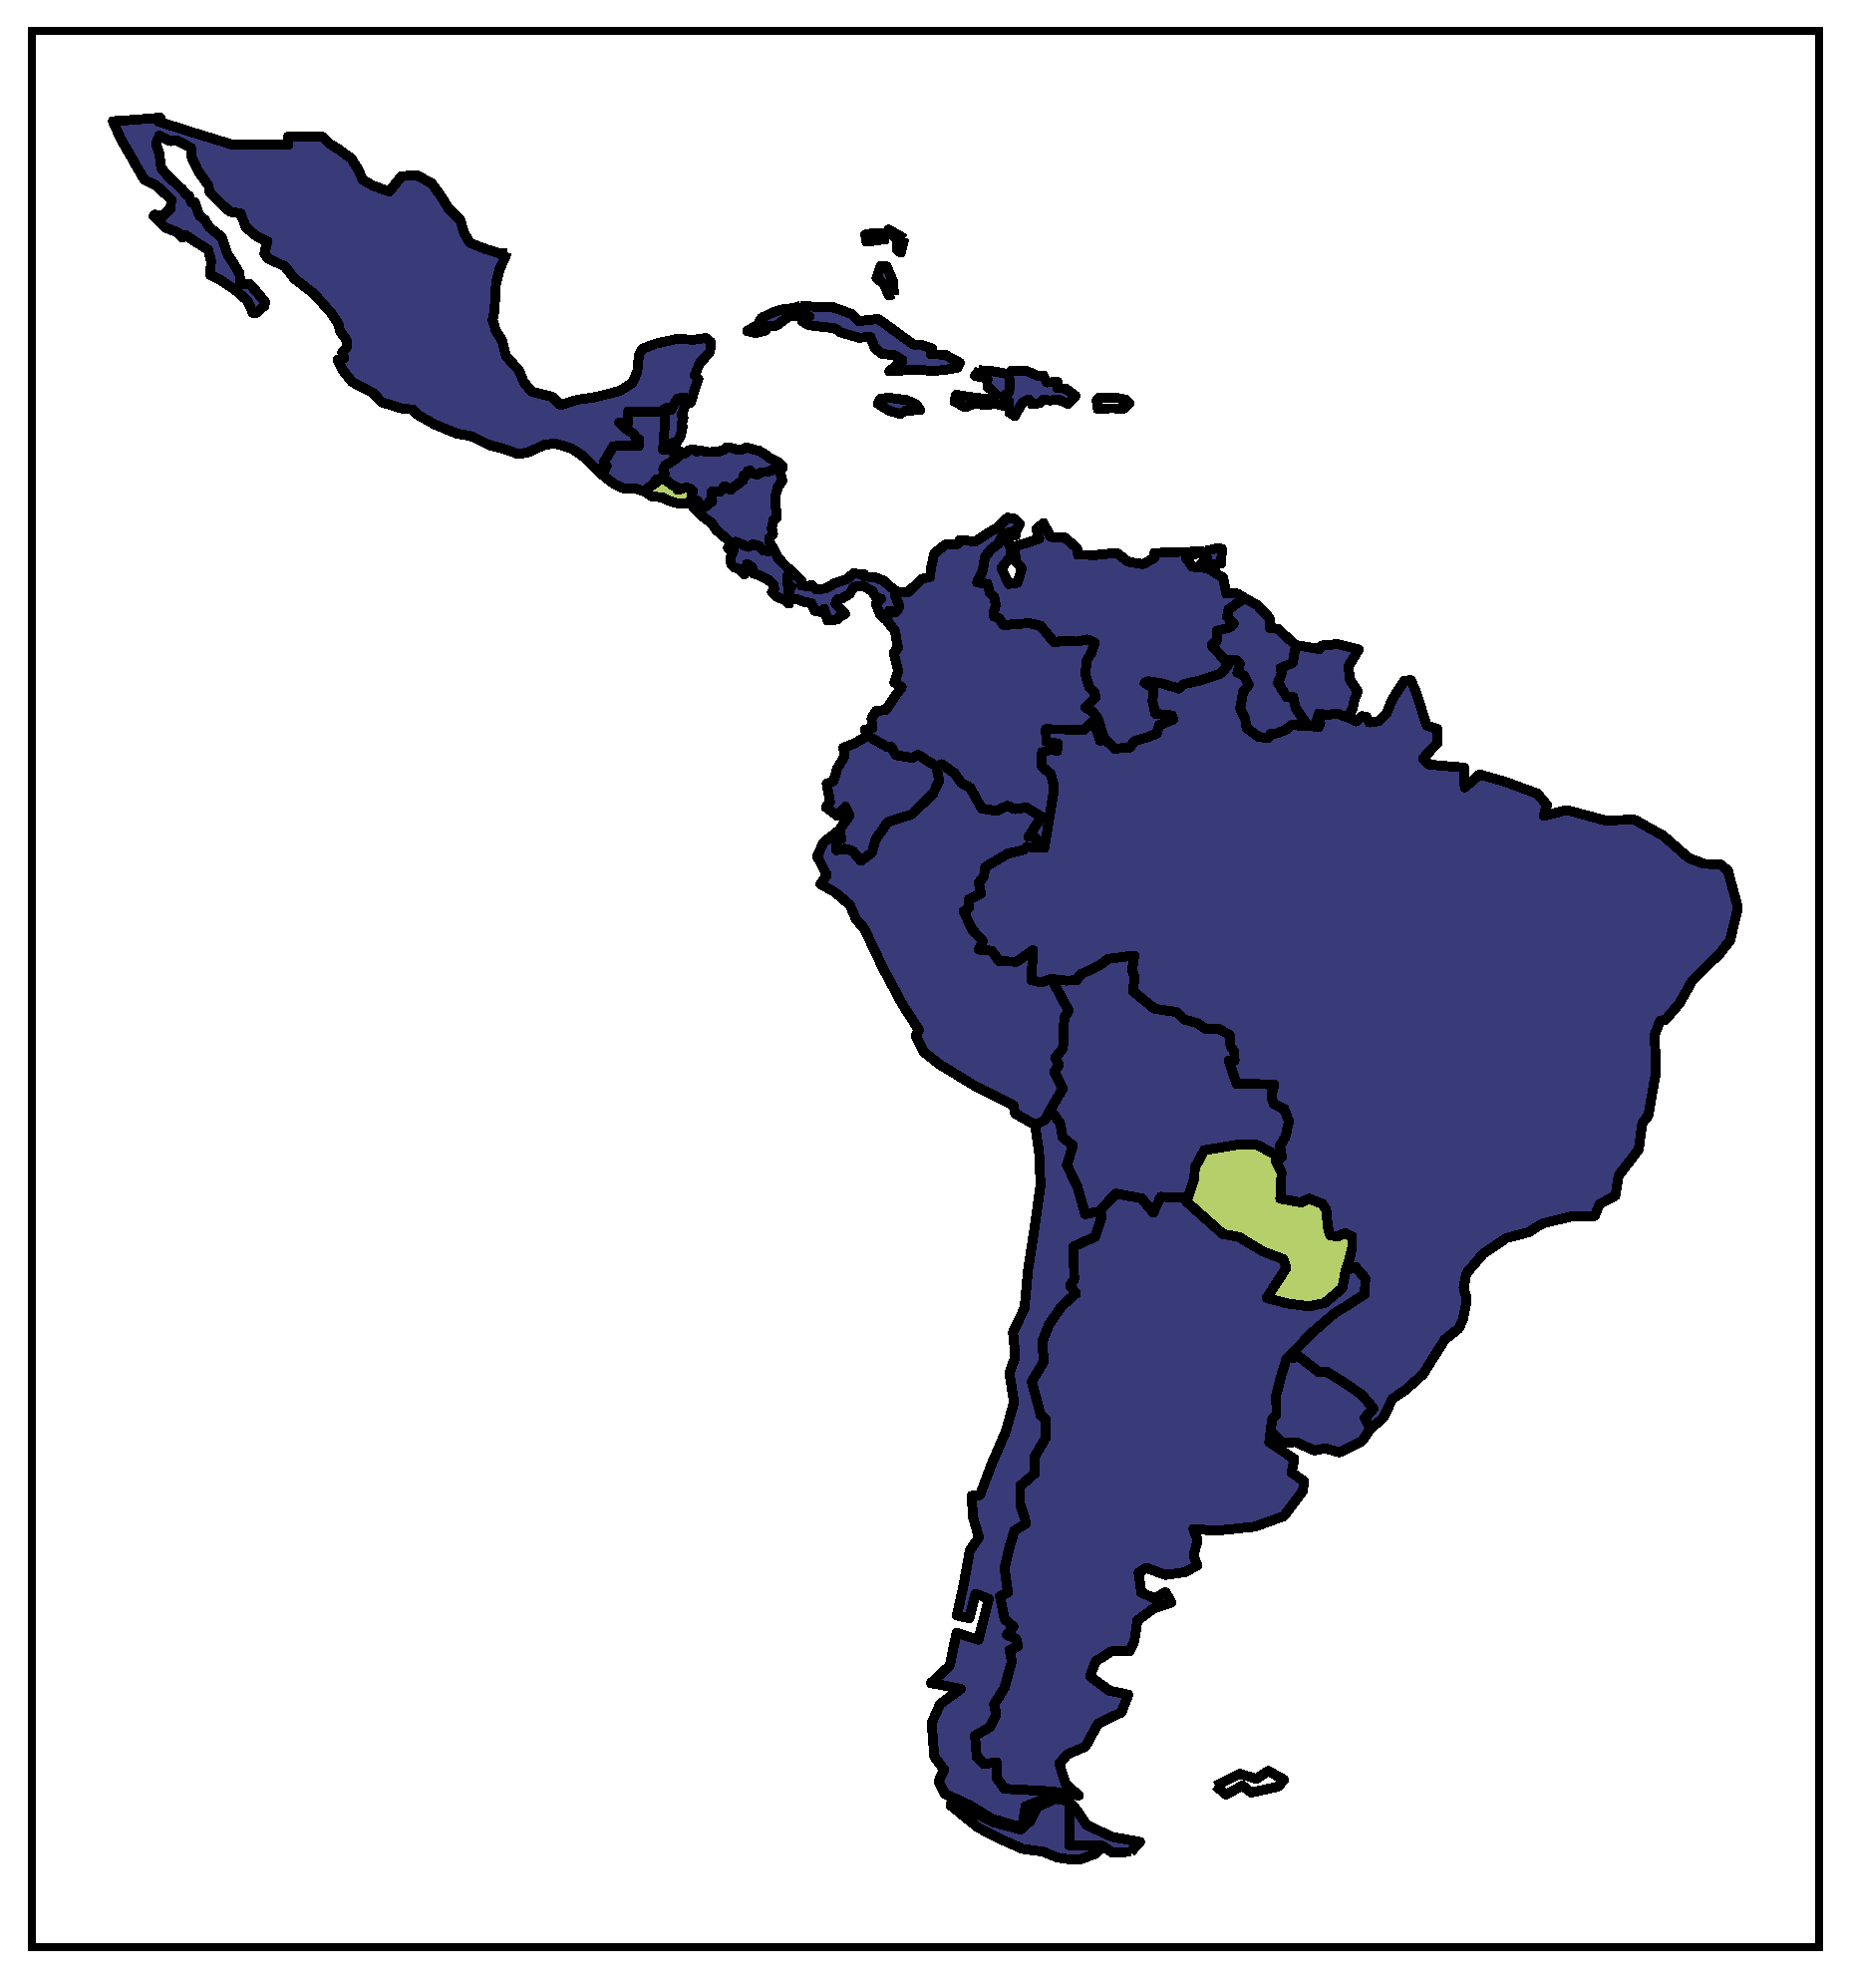
Lastly, with the exception of Paraguay, every nation in South and Central America most frequently collaborated with a high-income nation. Paraguay, a lower-middle-income nation, most frequently collaborated with its (almost) neighbor Uruguay, an upper middle income nation. Consequentially, researchers in every nation in South and Central America collaborated most frequently with researchers from a nation that was at least as wealthy as their own. This can be seen in Figure 15.
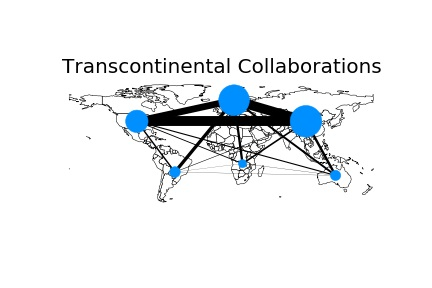
Now that we have provided evidence that researchers most frequently form collaborations with researchers from a nation at least as wealthy as their own, with the only exceptions being collaborations between geographic neighbors with cultural similarities, we provide three graphics which help visualize international collaborations in a geographic setting. 
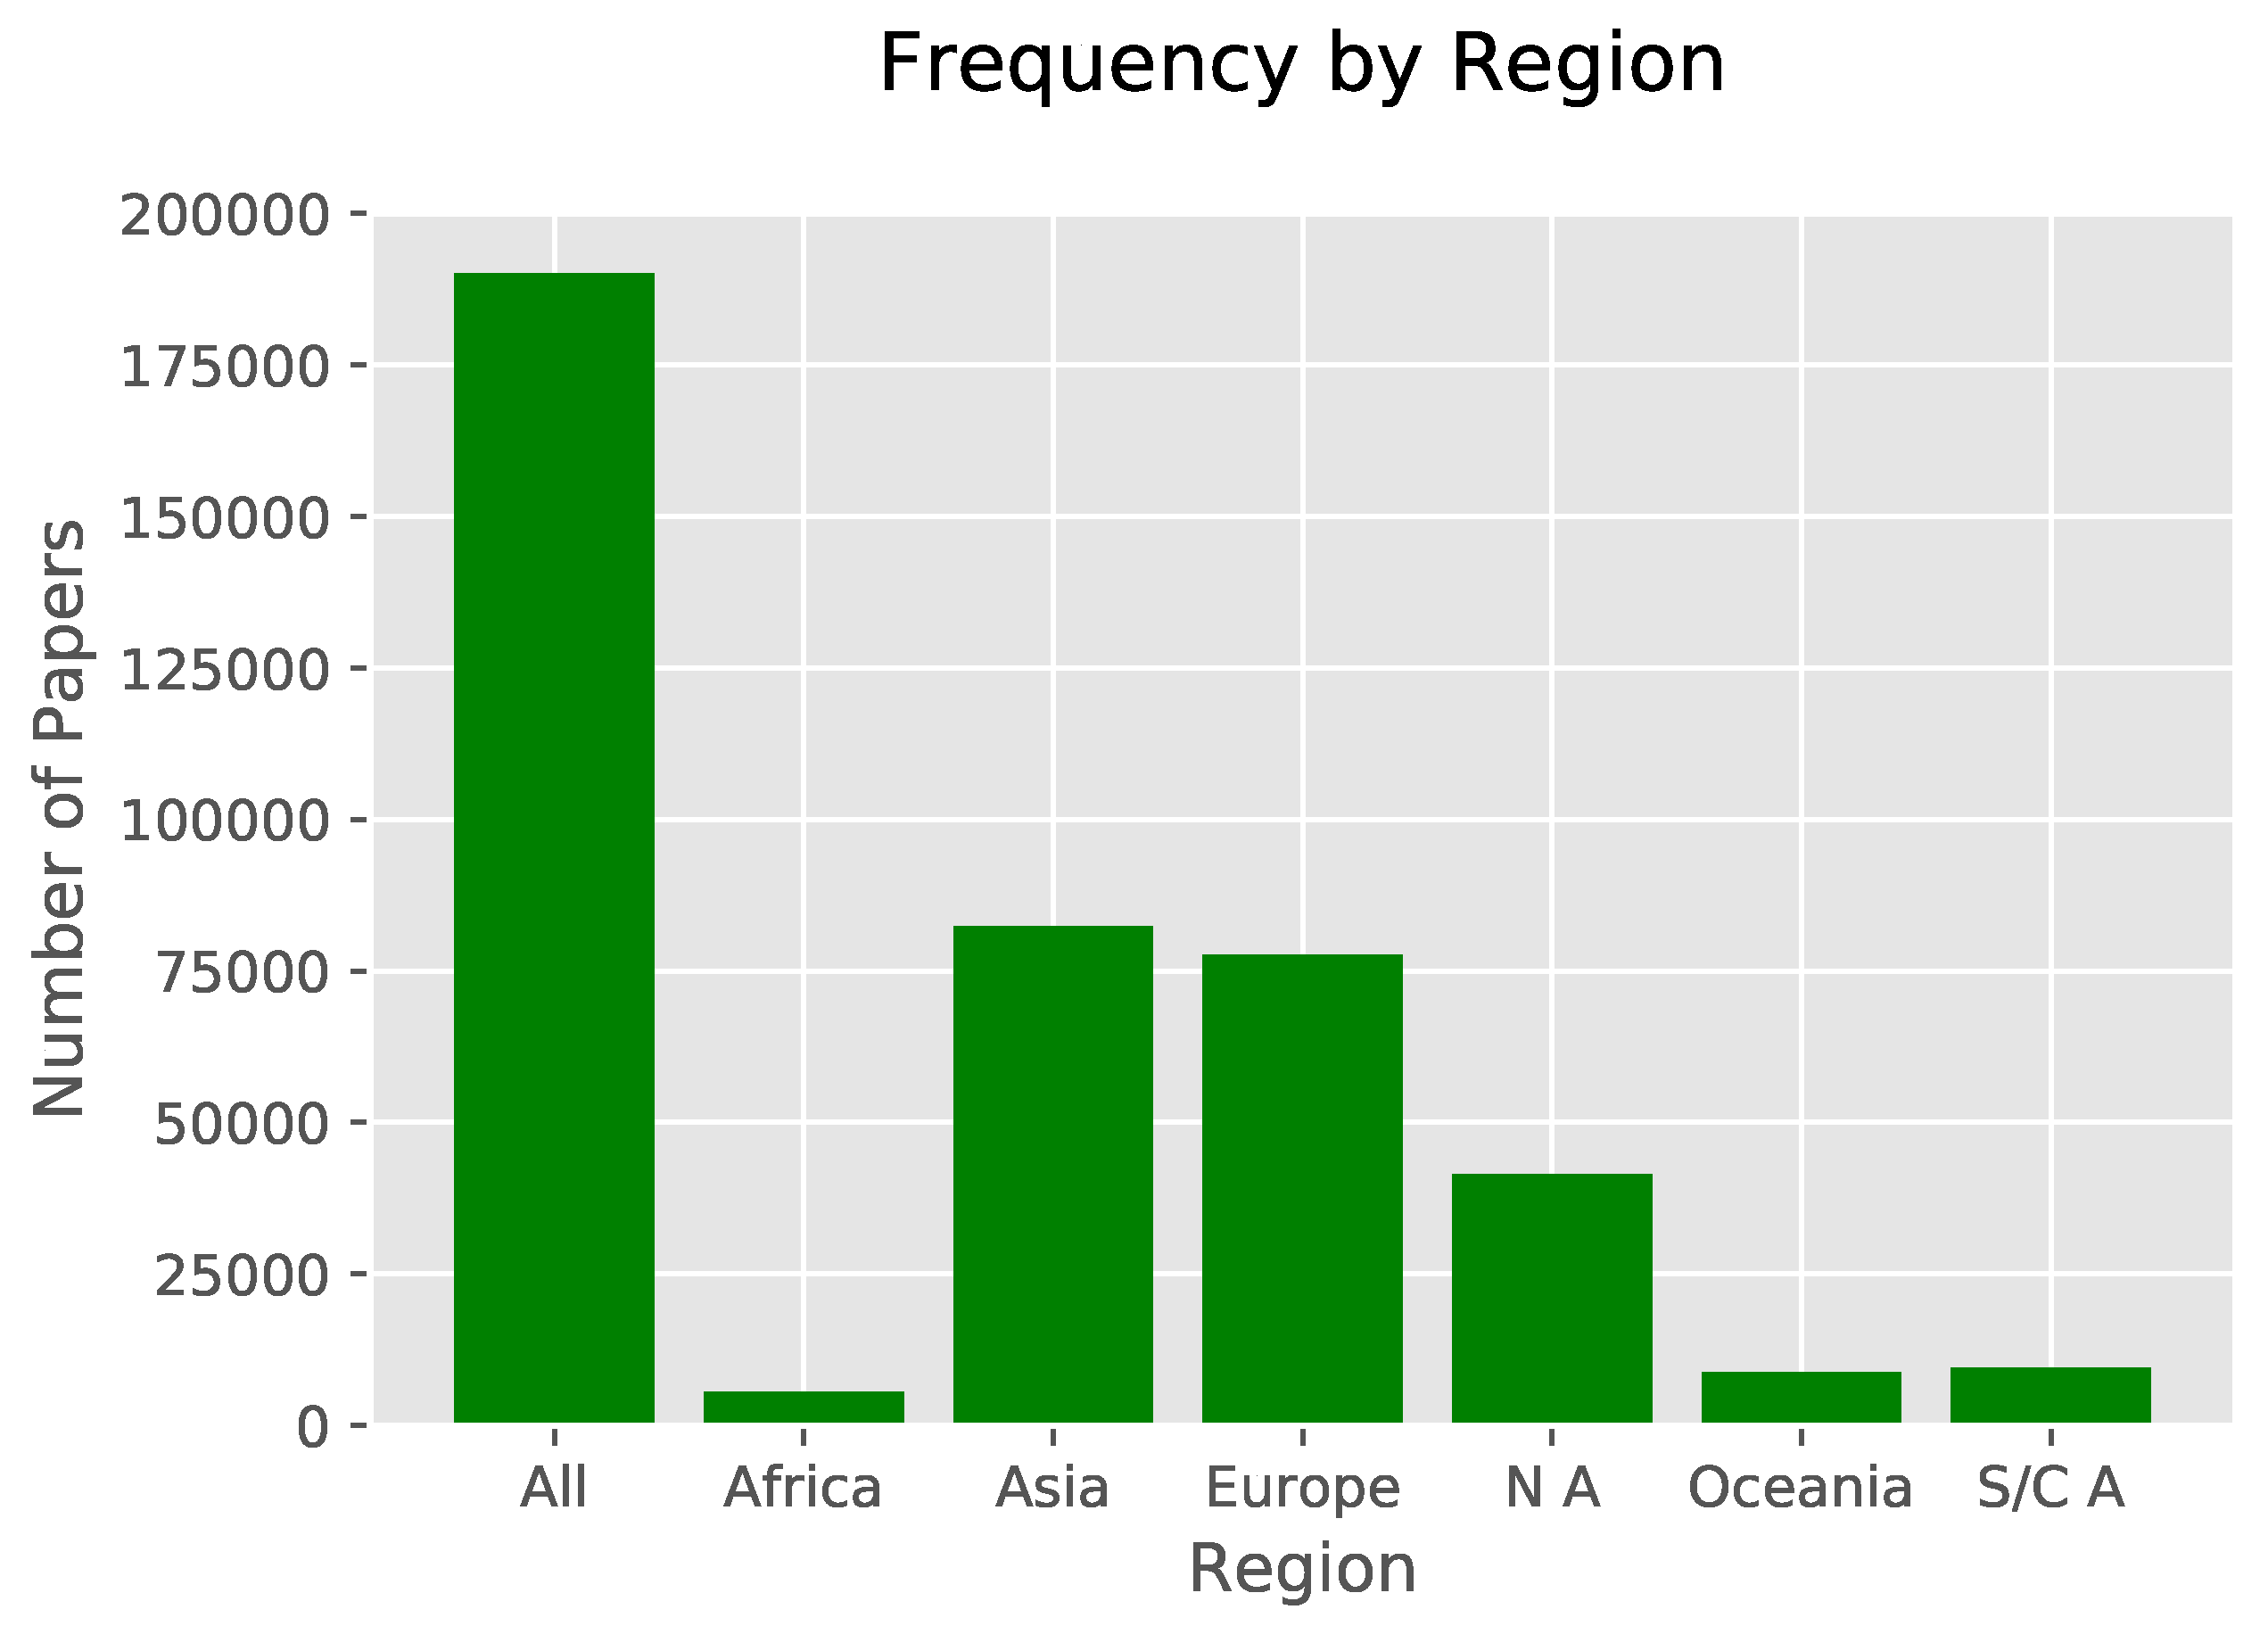
Figure 16 is a chart showing the number of papers published in MDPI journals which include at least one author from a given region. Figure 17 is the regional analog of Figure 9 superimposed on a map of the world with vertices weighted by the data presented in Figure 16 and with edges weighted to show the relative frequencies of international collaborations that cross regional boundaries.

5. International Collaboration Within Disciples

In the previous section we provided evidence that income plays a role in the formation of international collaborations that lead to publication. In this section, we determine whether or not this behavior is discipline-specific. To do this, we classified journals into six distinct categories using the classification system found in the Frascati Manual [47]. These six categories are: Natural Sciences, Engineering and Technology, Medical and Health Sciences, Agricultural and Veterinary Sciences, Social Sciences, and Humanities and the Arts. Summary statistics by Frascati Manual category and income group are presented in Table 6.
As can be seen in the following histograms in Figure 18, Figure 19, Figure 20, Figure 21, Figure 22 and Figure 23, the distribution of the number of nations represented on papers according to Frascati Manual category is very similar to what we saw in the aggregated data in the previous section.
In order to validate these results and show that researchers from low-income nations form international collaborations in a significantly different manner from that of researchers from their wealthier counterparts, we use pairwise Kolomogorov–Smirnov tests that compare the distribution of the number of nations represented per paper for papers that include at least one researcher from a nation in a specific income group. Since two of the six categories in the Frascati Manual (Agricultural and Veterinary Sciences and Humanities and the Arts) covered significantly fewer papers than the other four groups, we perform the Kolmogorov–Smirnov tests using aggregated data over all years of available data (1996 through 2018).
The results from the Kolmogorov–Smirnov tests comparing collaboration tendencies across income groups within the distinct research categories outlined in the Frascati Manual were consistent with the earlier Kolmogorov–Smirnov tests comparing income groups over all publications. For the categories of Natural Sciences, Engineering and Technology, Medical and Health Sciences, and Social Sciences, we found that low-income nations form collaborations more frequently than other nations, and that this difference is statistically significant at the 5% level and is robust to the removal of papers with authors from more than 20 different nations. For the other two categories, Agricultural and Veterinary Sciences and Humanities and the Arts, we saw that the only statistically significant differences were between high-income nations and low-income nations. Both were robust to the removal of papers with authors from more than 20 nations, though for the Humanities and the Arts, the results were only robust at the 10% level, not the 5% level. A possible explanation for why there was no other significant difference observed from the Kolmogorov–Smirnov tests for these two categories is simply that the data were limited because there were fewer papers published in these categories, and so the size of the data set was drastically smaller. It is possible that as more papers are published in MDPI journals which fit into these two categories, the data limitation will dissipate and the tendency for low-income nations to exhibit distinct collaboration tendencies will emerge. The results are presented in Figure 24.

6. Conclusions and Future Directions

In this paper, we present the first analysis of a data set that contains data on international collaborations from all papers published in MDPI journals. Considering all of the various costs of publishing, e.g., financial and labor costs, and considering that MDPI journals are open access and have publication fees, economics suggests that researchers from lower-income nations would have the most to benefit from forming international collaborations.
Our analyses confirmed that this is indeed the case. By using a series of pairwise Kolmogorov–Smirnov tests, we confirmed that not only do national income levels factor into how researchers form international collaborations, but that researchers in low-income nations exhibit behavior that is significantly different from that of researchers in relatively wealthier nations. Specifically, researchers in low-income nations are far more likely to form international collaborations on papers that are published in MDPI journals.
Additionally, we saw that the overwhelming majority of nations most frequently form international collaborations with high-income nations. The few exceptions to this were either (1) nations which collaborated with geographic neighbors that shared immediately obvious cultural aspects such as language, (2) Asian nations which collaborated most frequently with China, or (3) high-income nations which collaborated most frequently with China. In all, researchers from 16 different nations chose to form international collaborations most frequently with China, the same frequency as for Germany and France. Only the USA was more often the most frequently sought nation for forming international collaborations, with 37 different nations collaborating most frequently with the USA.
We then used the six categories of research outlined in the Frascati Manual to determine whether or not this behavior is consistent across disciplines. We found that it is indeed the case that low-income nations form collaborations at significantly higher rates than wealthier nations, again by using a series of pairwise Kolmogorov–Smirnov tests. We also confirmed that publications in MDPI journals have many of the same characteristics as publications in other open access journals.
While these results are a fruitful beginning to studying the formation of international collaborations in open access publications, there are some limitations to this study that should be mentioned. First, we established that low-income nations are more likely to form international collaborations when publishing in open access journals than other nations. This, however, is not that same as saying that low-income nations collaborate more frequently than other nations. Since the topic of this paper was the formation of international collaborations, we did not consider the possibility of several authors or institutions from the same country being reflected on a given paper. The raw data collected in this project do provide the opportunity to ask questions about overall rates of collaboration, international or not. We again remind the reader that the data and all associated code can be found in the “2018_Initial” directory within the repository https://github.com/cat-astrophic/MDPI.
Building directly on this research, it would be interesting to explore the role of income group and region in determining how frequently nations collaborate within the same income group or region versus different income groups or regions. All else equal, do nations tend to form international collaborations with high(er)-income nations in their own region?
Another interesting question building on the research presented in this paper would be to determine whether nations publish in open access (specifically MDPI) journals in proportion to their total number of scholarly publications across all journals, or if certain nations are more likely to publish in open access than other nations. If the latter is true, what factors motivate this behavior?
Throughout this paper, we consistently mentioned the article publication fees associated with publishing in open access journals, such as the MDPI journals which comprise this new data set. While these are only one of many costs in the production of academic publications, determining what effect they have on the formation of collaborations, international or otherwise, would be a significant contribution to the literature.
In addition to these potential future research directions, the data collected in this project present a perfect opportunity for network analyses, as well as the use of spatial econometric/statistical models for studies seeking to determine what socioeconomic factors influence the formation of international collaborations.

Author Contributions

Conceptualization: M.C. and T.R.; Theoretical Analysis: M.C. and T.R.; Writing: M.C. and T.R.; Software Development: M.C.; Statistical Analysis: M.C.; Data Visualization: M.C. All authors have read and agreed to the published version of the manuscript.

Funding

This research received no external funding.

Conflicts of Interest

The authors declare no conflicts of interest.

References

  1. Papin-Ramcharan, J.I.; Dawe, R.A. Open access publishing: A developing country view. First Monday 2006, 11. [Google Scholar] [CrossRef]
  2. Guerrero Bote, V.P.; Olmeda-Gómez, C.; de Moya-Anegón, F. Quantifying the benefits of international scientific collaboration. J. Am. Soc. Inf. Sci. Technol. 2013, 64, 392–404. [Google Scholar] [CrossRef]
  3. Czarnitzki, D.; Hottenrott, H. Inter-organizational collaboration and financing constraints for R&D. Econ. Lett. 2017, 161, 15–18. [Google Scholar]
  4. Katz, J.S.; Martin, B.R. What is research collaboration? Res. Policy 1997, 26, 1–18. [Google Scholar] [CrossRef]
  5. Hottenrott, H.; Thorwarth, S. Industry funding of university research and scientific productivity. Kyklos 2011, 64, 534–555. [Google Scholar] [CrossRef] [Green Version]
  6. Hottenrott, H.; Lawson, C. Fishing for complementarities: Research grants and research productivity. Int. J. Ind. Organ. 2017, 51, 1–38. [Google Scholar] [CrossRef] [Green Version]
  7. Hottenrott, H.; Lawson, C. Research grants, sources of ideas and the effects on academic research. Econ. Innov. New Technol. 2014, 23, 109–133. [Google Scholar] [CrossRef] [Green Version]
  8. Matthias, L.; Jahn, N.; Laakso, M. The Two-Way Street of Open Access Journal Publishing: Flip It and Reverse It. Publications 2019, 7, 23. [Google Scholar] [CrossRef] [Green Version]
  9. Piwowar, H.; Priem, J.; Larivière, V.; Alperin, J.P.; Matthias, L.; Norlander, B.; Farley, A.; West, J.; Haustein, S. The state of OA: A large-scale analysis of the prevalence and impact of Open Access articles. PeerJ 2018, 6, e4375. [Google Scholar] [CrossRef] [Green Version]
  10. Hottenrott, H.; Lopes-Bento, C. (International) R&D collaboration and SMEs: The effectiveness of targeted public R&D support schemes. Res. Policy 2014, 43, 1055–1066. [Google Scholar]
  11. Kim, M.J. Korean science and international collaboration, 1995-2000. Scientometrics 2005, 63, 321–339. [Google Scholar] [CrossRef]
  12. Ahinon, J.S.; Havemann, J. Open Science in Africa–Challenges, Opportunities and Perspectives. AfricArXiv 2018. [Google Scholar] [CrossRef]
  13. Chigwada, J.P.; Chiparausha, B. Efficacy of Culture Houses and Centres in the Acquisition, Preservation, and Dissemination of Indigenous Knowledge in Zimbabwe. In Indigenous Studies: Breakthroughs in Research and Practice; IGI Global: Hershey, PA, USA, 2020; pp. 498–518. [Google Scholar]
  14. Adams, J.; Gurney, K.; Hook, D.; Leydesdorff, L. International collaboration clusters in Africa. Scientometrics 2014, 98, 547–556. [Google Scholar] [CrossRef]
  15. Rougier, N.P.; Hinsen, K.; Alexandre, F.; Arildsen, T.; Barba, L.A.; Benureau, F.C.; Brown, C.T.; De Buyl, P.; Caglayan, O.; Davison, A.P.; et al. Sustainable computational science: The ReScience initiative. PeerJ Comput. Sci. 2017, 3, e142. [Google Scholar] [CrossRef] [Green Version]
  16. Willinsky, J. The unacknowledged convergence of open source, open access, and open science. First Monday 2005, 10. [Google Scholar] [CrossRef] [Green Version]
  17. Chigwada, J.P. Adoption of Open Source Software in Libraries in Developing Countries. Int. J. Libr. Inf. Serv. (IJLIS) 2018, 7, 15–29. [Google Scholar] [CrossRef] [Green Version]
  18. Strauss, P. Shakespeare and the English Poets: The Influence of Native Speaking English Reviewers on the Acceptance of Journal Articles. Publications 2019, 7, 20. [Google Scholar] [CrossRef] [Green Version]
  19. Jonkers, K.; Tijssen, R. Chinese researchers returning home: Impacts of international mobility on research collaboration and scientific productivity. Scientometrics 2008, 77, 309–333. [Google Scholar] [CrossRef]
  20. Wagner, C.S. The New Invisible College: Science for Development; Brookings Institution Press: Washington, DC, USA, 2009. [Google Scholar]
  21. Glänzel, W.; De Lange, C. A distributional approach to multinationality measures of international scientific collaboration. Scientometrics 2002, 54, 75–89. [Google Scholar] [CrossRef]
  22. He, T. International scientific collaboration of China with the G7 countries. Scientometrics 2009, 80, 571–582. [Google Scholar] [CrossRef]
  23. Arunachalam, S.; Doss, M.J. Mapping International Collaboration in Science in Asia through Coauthorship Analysis. Current Science 2000, 79, 621–628. [Google Scholar]
  24. Arunachalam, S.; Srinivasan, R.; Raman, V. International collaboration in science: Participation by the Asian giants. Scientometrics 1994, 30, 7–22. [Google Scholar] [CrossRef]
  25. Basu, A.; Kumar, B.V. International collaboration in Indian scientific papers. Scientometrics 2000, 48, 381–402. [Google Scholar] [CrossRef]
  26. Leydesdorff, L.; Wagner, C.; Park, H.W.; Adams, J. International collaboration in science: The global map and the network. arXiv 2013, arXiv:1301.0801. [Google Scholar] [CrossRef] [Green Version]
  27. Leydesdorff, L.; Wagner, C.S. International collaboration in science and the formation of a core group. J. Informetr. 2008, 2, 317–325. [Google Scholar] [CrossRef] [Green Version]
  28. Wagner, C.S.; Leydesdorff, L. Network structure, self-organization, and the growth of international collaboration in science. Res. Policy 2005, 34, 1608–1618. [Google Scholar] [CrossRef] [Green Version]
  29. Davidson Frame, J.; Carpenter, M.P. International research collaboration. Soc. Stud. Sci. 1979, 9, 481–497. [Google Scholar] [CrossRef] [Green Version]
  30. Wagner, C.S. Six case studies of international collaboration in science. Scientometrics 2005, 62, 3–26. [Google Scholar] [CrossRef]
  31. Schubert, A.; Braun, T. International collaboration in the sciences 1981–1985. Scientometrics 1990, 19, 3–10. [Google Scholar] [CrossRef]
  32. Luukkonen, T.; Persson, O.; Sivertsen, G. Understanding patterns of international scientific collaboration. Sci. Technol. Hum. Values 1992, 17, 101–126. [Google Scholar] [CrossRef] [Green Version]
  33. Coccia, M.; Wang, L. Evolution and convergence of the patterns of international scientific collaboration. Proc. Natl. Acad. Sci. USA 2016, 113, 2057–2061. [Google Scholar] [CrossRef] [PubMed] [Green Version]
  34. Rodriguez, A. Collaboration in scholarly communication: Opportunities to normalize open access. Coll. Res. Libr. News 2017, 78, 270. [Google Scholar] [CrossRef] [Green Version]
  35. Barik, N.; Jena, P. Authorship Distribution and Collaboration in LIS Open Access Journals: A Scopus based analysis during 2001 to 2015. Libr. Philos. Pract. 2018, 1–24. [Google Scholar]
  36. Fantom, N.; Serajuddin, U. The World Bank’s Classification of Countries by Income; The World Bank: Washington, DC, USA, 2016. [Google Scholar]
  37. World Bank. World Bank Analytical Classifications. 2015. Available online: http://siteresources.worldbank.org/DATASTATISTICS/Resources/OGHIST.xls (accessed on 25 October 2019).
  38. Fazey, I.; Fischer, J.; Lindenmayer, D.B. Who does all the research in conservation biology? Biodivers. Conserv. 2005, 14, 917–934. [Google Scholar] [CrossRef]
  39. World Bank. World Development Indicators. 2019. Available online: https://datacatalog.worldbank.org/dataset/world-development-indicators (accessed on 5 November 2019).
  40. Autant-Bernard, C.; Mairesse, J.; Massard, N. Spatial knowledge diffusion through collaborative networks. Pap. Reg. Sci. 2007, 86, 341–350. [Google Scholar] [CrossRef]
  41. Hoekman, J.; Frenken, K.; Van Oort, F. The geography of collaborative knowledge production in Europe. Ann. Reg. Sci. 2009, 43, 721–738. [Google Scholar] [CrossRef] [Green Version]
  42. Hoekman, J.; Frenken, K.; Tijssen, R.J. Research collaboration at a distance: Changing spatial patterns of scientific collaboration within Europe. Res. Policy 2010, 39, 662–673. [Google Scholar] [CrossRef]
  43. Katz, J.S. Geographical proximity and scientific collaboration. Scientometrics 1994, 31, 31–43. [Google Scholar] [CrossRef]
  44. Larivière, V.; Gingras, Y.; Archambault, É. Canadian collaboration networks: A comparative analysis of the natural sciences, social sciences and the humanities. Scientometrics 2006, 68, 519–533. [Google Scholar] [CrossRef]
  45. Ponds, R.; Van Oort, F.; Frenken, K. The geographical and institutional proximity of research collaboration. Pap. Reg. Sci. 2007, 86, 423–443. [Google Scholar] [CrossRef] [Green Version]
  46. Jin, B.h.; Suttmeier, R.P.; Zhang, W.; Cao, C.; Wang, D.; Zhou, Q.j. Sino-US science collaboration: An analysis in bibliometrics. J.-Shanxi Univ. Nat. Sci. Ed. 2007, 30, 295. [Google Scholar]
  47. OECD. Frascati Manual 2015; OECD: Paris, France, 2015. [Google Scholar] [CrossRef]
Figure 1. This chart shows the number of papers published in Multidisciplinary Digital Publishing Institute (MDPI) journals from 1996 through 2018 with at least one author from a country in a given income classification. Note that the sum of each income classification exceeds the total number of papers; these results are a consequence of international collaborations that transcend income classification.
Publications 08 00013 g001
Figure 2. This shows income group level time series for the percentage of papers published with only a single country represented. As can be seen, all income groups have experienced increased international collaboration between 2000 and 2018.
Publications 08 00013 g002
Figure 3. A histogram of the number of different nations represented on papers published in MDPI journals between 1996 and 2018.
Publications 08 00013 g003
Figure 4. A histogram of the number of different nations represented on papers published in MDPI journals between 1996 and 2018 which include at least one author from a nation in the high-income classification.
Publications 08 00013 g004
Figure 5. A histogram of the number of different nations represented on papers published in MDPI journals between 1996 and 2018 which include at least one author from a nation in the upper-middle-income classification.
Publications 08 00013 g005
Figure 6. A histogram of the number of different nations represented on papers published in MDPI journals between 1996 and 2018 which include at least one author from a nation in the lower-middle-income classification.
Publications 08 00013 g006
Figure 7. A histogram of the number of different nations represented on papers published in MDPI journals between 1996 and 2018 which include at least one author from a nation in the low-income classification.
Publications 08 00013 g007
Figure 8. A heatmap of the results of all pairwise Kolmogorov–Smirnov tests. Black cells indicate where we reject the null hypothesis that two income groups form international collaborations in similar manners.
Publications 08 00013 g008
Figure 9. Vertices are weighted to show the relative difference in the number of papers published which include at least one author working in a nation from a given income classification. Edges are weighted to show the relative difference in the number of papers including an international collaboration which includes nations from different income classifications.
Publications 08 00013 g009
Figure 10. A map portraying the income groups of the most frequent collaborators of African nations. Nations colored in blue most frequently collaborate with high-income group nations, nations in green most frequently collaborate with upper-middle-income group nations, nations colored in red most frequently collaborate with lower-middle-income group nations, and nations colored in white did not have publications in the data set.
Publications 08 00013 g010
Figure 11. A map portraying the income groups of the most frequent collaborators of Asian nations. Nations colored in blue most frequently collaborate with high-income group nation, nations in green most frequently collaborate with upper-middle-income group nations, nations colored in red most frequently collaborate with lower-middle-income group nations, and nations colored in white did not have publications in the data set.
Publications 08 00013 g011
Figure 12. A map portraying the income group of the most frequent collaborator of European nations. Nations colored in blue most frequently collaborate with a high income group nation, nations in green most frequently collaborate with an upper middle income group nations, nations colored in red most frequently collaborate with a lower middle income group nations, and nations colored in white did not have publications in the data set.
Publications 08 00013 g012
Figure 13. A map portraying the income groups of the most frequent collaborators of North American nations. Nations colored in blue most frequently collaborate with high-income group nations, nations in green most frequently collaborate with upper-middle-income group nations, nations colored in red most frequently collaborate with lower-middle-income group nations, and nations colored in white did not have publications in the data set.
Publications 08 00013 g013
Figure 14. A map portraying the income groups of the most frequent collaborators of Oceanic nations. Nations colored in blue most frequently collaborate with high-income group nations, nations in green most frequently collaborate with upper-middle-income group nations, nations colored in red most frequently collaborate with lower-middle-income group nations, and nations colored in white did not have publications in the data set.
Publications 08 00013 g014
Figure 15. A map portraying the income groups of the most frequent collaborators of South and Central American nations. Nations colored in blue most frequently collaborate with high-income group nations, nations in green most frequently collaborate with upper-middle-income group nations, nations colored in red most frequently collaborate with lower-middle-income group nations, and nations colored in white did not have publications in the data set.
Publications 08 00013 g015
Figure 16. This chart shows the number of papers published in MDPI journals from 1996 through 2018 with at least one author from a country in a given region. Note that the sum of each region exceeds the total number of papers; this result is a consequence of international collaborations that transcend regional boundaries.
Publications 08 00013 g016
Figure 17. This is the vertex- and edge-weighted graph of trans-regional collaborations superimposed on a map of the world.
Publications 08 00013 g017
Figure 18. The distribution of distinct nations represented on papers in the natural sciences by income group.
Publications 08 00013 g018
Figure 19. The distribution of distinct nations represented on papers in engineering and technology by income group.
Publications 08 00013 g019
Figure 20. The distribution of distinct nations represented on papers in the medical and health sciences by income group.
Publications 08 00013 g020
Figure 21. The distribution of distinct nations represented on papers in the agricultural and veterinary sciences by income group.
Publications 08 00013 g021
Figure 22. The distribution of distinct nations represented on papers in the social sciences by income group.
Publications 08 00013 g022
Figure 23. The distribution of distinct nations represented on papers in the humanities and the arts by income group.
Publications 08 00013 g023
Figure 24. A 2 × 3 grid of heatmaps of the results of all pairwise Kolmogorov–Smirnov tests. Black cells indicate where we reject the null hypothesis that two income groups form international collaborations in similar manners. The top row contains the results from the Kolmogorov–Smirnov tests for the first through the third Frascati Manual categories (Natural Sciences, Engineering and Technology, and Medical and Health Sciences), and the second row contains the results from the fourth through the sixth categories (Agricultural and Veterinary Sciences, Social Sciences, and Humanities and the Arts).
Publications 08 00013 g024
Table 1. This table contains the total number of papers published each year by income group.
YearHighUpper MidLower MidLowTotal
19965261031
199751189078
1998611411086
19996643140112
2000171194450381
200117243602265
200215855761267
200318396941343
200418875764316
200517886842327
2006259801230422
20073971142065649
200871319727051,116
20091817306401152374
20103219493667254093
20113502725911314719
2012527210251567687155
2013747610861801819383
201494961499293413112,414
201513,1291925455420617,379
201617,1372614724031923,573
201726,992454411,65654437,522
201847,143914521,612113367,180
All137,78624,40354,4122573190,186
Table 2. Income group level summary data.
Income GroupTotal PapersPopulation
(in Millions)
Papers per
Million People
Countries
High-Income Nations137,7861112123.963
Upper-Middle-Income Nations24,403103923.545
Lower-Middle-Income Nations54,412419913.056
Low-Income Nations257310902.443
All Nations190,186744025.6207
Table 3. Income Group Membership Table.
Income GroupList of Members
High IncomeAndorra, Antigua and Barbuda, Aruba, Australia, Austria, Bahrain,
Barbados, Belgium, Bermuda, Brunei, Canada, Channel Islands,
Croatia, Cyprus, Czech Republic, Denmark, Equatorial Guinea,
Estonia, Faeroe Islands, Finland, France, French Polynesia,
Germany, Greece, Greenland, Hong Kong, Hungary, Iceland,
Ireland, Isle of Man, Israel, Italy, Japan, Korea, Kuwait, Liechtenstein,
Luxembourg, Macao, Malta, Monaco, New Caledonia, New Zealand,
Northern Mariana Islands, Norway, Oman, Portugal, Qatar, San Marino,
Saudi Arabia, Singapore, Slovakia, Slovenia, Spain, Sweden, Switzerland,
Taiwan, The Bahamas, The Cayman Islands, The Netherlands,
Trinidad and Tobago, UK, USA, United Arab Emirates
Upper Middle IncomeAlgeria, American Samoa, Argentina, Belarus, Bosnia and Herzegovina,
Botswana, Brazil, Bulgaria, Chile, Colombia, Costa Rica, Cuba, Dominica,
Dominican Republic, Fiji, Gabon, Grenada, Jamaica, Kazakhstan, Latvia,
Lebanon, Libya, Lithuania, MacMontenegro, Namibia, Palau, Panama, Peru, Poland, Romania, Russia,
Saint Kitts and Nevis, Saint Lucia, Saint Vincent and the Grenadines,
Serbia, Seychelles, South Africa, Suriname, Turkey, Uruguay, Venezuela
Lower Middle IncomeAlbania, Angola, Armenia, Azerbaijan, Belize, Bhutan, Bolivia, Cabo Verde,
Cameroon, China, Djibouti, Ecuador, Egypt, El Salvador, Eswatini, Georgia,
Guatemala, Guyana, Honduras, India, Indonesia, Iran, Iraq, Ivory Coast,
Jordan, Kiribati, Kosovo, Lesotho, Maldives, Marshall Islands, Micronesia,
Moldova, Mongolia, Morocco, Nicaragua, Nigeria, Pakistan, Palestine,
Papua New Guinea, Paraguay, Philippines, Republic of the Congo, Samoa,
Sao Tome and Principe, Solomon Islands, Sri Lanka, Sudan, Syria, Thailand,
Timor-Leste, Tonga, Tunisia, Turkmenistan, Ukraine, Vanuatu
Low IncomeAfghanistan, Bangladesh, Benin, Burkina Faso, Burundi, Cambodia,
Central African Republic, Chad, Comoros, Democratic Republic of the Congo,
Eritrea, Ethiopia, Ghana, Guinea, Guinea-Bissau, Haiti, Kenya,
Korea, Dem. Rep., Kyrgyzstan, Laos, Liberia, Madagascar, Malawi,
Mali, Mauritania, Mozambique, Myanmar, Nepal, Niger, Rwanda, Senegal,
Sierra Leone, Somalia, Tajikistan, Tanzania, The Gambia, Togo, Uganda,
Uzbekistan, Vietnam, Yemen, Zambia, Zimbabwe
Table 4. Distribution of the number of collaborating nations per paper.
Income Group1 Nation2 Nations3 Nations4 Nations5+ Nations
High-Income Nations67.32%25.57%5.21%1.22%0.68%
Upper-Middle-Income Nations56.58%29.63%9.03%2.82%1.94%
Lower-Middle-Income Nations66.32%26.39%5.34%1.30%0.65%
Low-Income Nations12.44%54.53%20.91%7.31%4.81%
All Nations75.18%19.56%3.86%0.89%0.51%
Table 5. Summary statistics on international collaborations by income group.
Income GroupMeanStd. Dev.Max
High-Income Nations1.431.3825
Upper-Middle-Income Nations1.672.8025
Lower-Middle-Income Nations1.441.4017
Low-Income Nations2.445.8317
All Nations1.331.0025
Table 6. The number of papers in each of the Frascati Manual categories containing at least one author from a nation in a given income group.
Cat 1Cat 2Cat 3Cat 4Cat 5Cat 6
High53,02039,39224,044245616,8222052
Upper Middle12,342585932513342441176
Lower Middle22,76019,3085412376646393
Low82345755014558513
Total77,40256,04729,333284422,3152245

