Article

Preparation and Characterization of Large Area Li-NASICON Electrolyte Thick Films

1
Instituto de Ciencia de Materiales de Madrid, ICMM-CSIC. C/Sor Juana Inés de la Cruz 3, Cantoblanco, 28049 Madrid, Spain
2
Instituto de Cerámica y Vidrio, ICV-CSIC. C/Kelsen 5, Cantoblanco, 28049 Madrid, Spain
3
Department of Materials Science and Engineering, National Cheng Kung University, No. 1, University Road, Tainan City 70101, Taiwan
4
Institute of Applied Electrodynamics and Telecommunications, Faculty of Physics, Vilnius University, Saulėtekio av. 9, LT-10222 Vilnius, Lithuania
*
Author to whom correspondence should be addressed.
Inorganics 2019, 7(9), 107; https://doi.org/10.3390/inorganics7090107
Submission received: 29 June 2019 / Revised: 7 August 2019 / Accepted: 10 August 2019 / Published: 26 August 2019

Abstract

:
The preparation of solid electrolyte ceramic membranes is the object of intense study for its fundamental parts in the development of all solid-state batteries and improved battery separators. In this work, the procurement of large area solid electrolyte ceramic thick film membranes of the Li-NASICON Li1.3Al0.3Ti1.7(PO4)3 (LATP) composition is attempted. Through the use of LATP powders from a sol–gel reaction, a slurry is formulated and tape casted. The green tapes are sintered using two sintering times. In both cases, ceramic thick films of a 5.5 × 5.5 cm2 area and ≈250 µm average thickness were obtained. The characterization indicated almost pure phase samples with a bi-modal microstructure composed of large and smaller grains, being larger for longer sintering time. The samples are porous and brittle, presenting very high “bulk” conductivity but lower total direct current (DC) one, as compared with the commercial Li-NASICON (OHARA) thick films with a similar area. The larger the grains, the poorer the total conductivity and the mechanical properties of the thick-films. The formation of poorly adhering grain boundaries as the grain size grows is responsible for the worsened properties. A better control of the microstructure is mandatory.

Graphical Abstract

1. Introduction

Because of their high energy performance, lithium-ion batteries are nowadays widely used for storage power generation and uninterruptible power supply (UPS) systems [1,2]. The use of Li-conducting organic liquid and/or polymer electrolytes, in the present battery technology, prevents the fabrication of completely safe devices as a result of low thermal stability. The use of an inorganic solid instead of a liquid/polymer electrolyte will significantly improve the safety of the lithium-ion battery, also extending its life by reducing the degradation processes [3,4,5]. The rather poor temperature stability of Li-batteries based on organic electrolytes prevents the use of these devices in harsh environments where temperatures can rise above 100 °C. This limitation can be overcome by using ionic liquids, but the reduced ionic conductivity is deleterious for the output power of the battery. The preparation of all solid-state batteries (ASSBs) can be of interest for their use in a wider temperature and pressure range that the current liquid electrolyte-based batteries (LEEBs) cannot cover.
Another interesting niche of application of ASSBs is the result of the progressive miniaturization of electronic components. An increasing demand for micro-sized power sources incites the research of thin or thick films, so as to avoid the use of liquid electrolytes and to confine the batteries in a defined space (integrated batteries). Smart cards, implanted medical devices, micro electro-mechanical systems, memory blocks, sensors, transducers, and especially military equipment are potential consumers of ASSBs film batteries [6,7,8]. Besides the implementation of ASSBs, the use of full dense solid electrolytes ceramic membranes as separators in liquid electrolyte-based batteries to prevent any short circuit caused by the growth of dendrites is an important application [9]. These dense ceramic electrolyte membranes can be also used as separators in metal–air batteries, protecting the anodic compartment from the ambient [10]. However, there are many drawbacks that limit their implementation. The first one is the relatively low ionic conductivity of the solid, which is usually one order of magnitude lower than that of their liquid electrolyte counterparts. But the main challenge to be faced is the procurement of electrochemically active solid electrodes/solid electrolyte interfaces. To accomplish this challenge, inter-diffusion must be avoided as much as possible. Another drawback is the mechanical fatigue produced on the interfaces during insertion de-insertion processes.
In ASSBs solid electrode/electrolyte, the interfacial area is small, as contacts are limited. In comparison with conventional secondary batteries, the diffusion path lengths for the electron draining at the current collectors, and for the Li insertion, are much larger. The length reduction of the diffusion path is fundamental for fast electrochemical kinetics and high power [11]. The thin film battery ASSBs concept was proposed to solve this problem. Different designs have been made to increase the interfacial area. ASSBs based on thin film materials presented high charge and discharge rates, comparable to liquid electrolyte Li batteries, but the total energy stored remains poor [12,13]. The active mass of the electrodes must be increased, as this is proportional to the stored energy. Thick films with thicknesses in the range of 10–100 μm can be a solution. They will provide increased energy and enough power. Novel ASSB designs are needed in order to reduce the diffusion path length of the ions and electrons. Moreover, the strain effects due to the insertion/de-insertion of Li must be minimized to increase battery durability. This minimization will require important changes in battery designs [14]. Electrolyte supported large area ASSB architecture can be a solution. It allows for flexible electrode design to minimize the strain effects, reduce the diffusion path, and balance the electrode mass between the anode and cathode. Two main different configurations of supported ASSBs can be foreseen. The first one with the anode and cathode at different sides of the electrolyte, and the second one with electrodes disposed at the same side of the electrolyte (inter-digital electrode configuration). A self-supported electrolyte thick-film with a high enough mechanical strength is mandatory for the first configuration. In the second one, a supported solid electrolyte layer on a refractory mechanically resistant substrate can be used. The procurement of planar large area electrolyte thick films is of main importance for both ASSB configurations. Among the different families of high conductivity Li solid electrolytes, Li1.3Al0.3Ti1.7(PO4)3 with a NASICON structure is a good candidate for ASSBs, because of its high lithium conductivity (σbulk ∼10−3 S·cm−1 at RT), chemical resistance, and mechanical stability [15,16,17,18,19]. These materials are widely studied in the form of ceramics and glass ceramics. Studies on thick-films ceramics are still scarce. The sulfide-based solid electrolytes presented larger Li conductivities, but are difficult to handle in a regular atmosphere compared to the same, but oxide-based.
For the procurement of solid electrolyte thick films with a thickness larger than 10 µm, tape casting or screen-printing methods are more appropriate [20]. For the application, the thick film must be dense. The presence of pores and cracks in the ceramic films produce a negative impact on the electrical and mechanical properties of the films. It is necessary to find ways to produce full dense thick films [21,22].
The aim of this work is the preparation of self-standing thick-films of Li1.3Al0.3Ti1.7(PO4)3 with a high Li conductivity, to be used as support for all solid-state Li batteries. The structure, phase homogeneity, and microstructure of prepared thick films have been investigated by XRD, NMR, confocal micro-Raman, and SEM techniques. Impedance spectroscopy (IS) in a wide temperature and frequency range was used to extract the “total” and “bulk” direct current (DC) conductivity of the thick film samples prepared. A mechano-elastic characterization of the thick films was also performed, as high mechanical properties are needed to be used as support. The results obtained have been discussed and compared with those reported in other samples of a similar composition, especially the OHARA Li-NASICON glass-ceramic (OHGC), which is a commercial large area Li solid electrolyte that is available.

2. Results

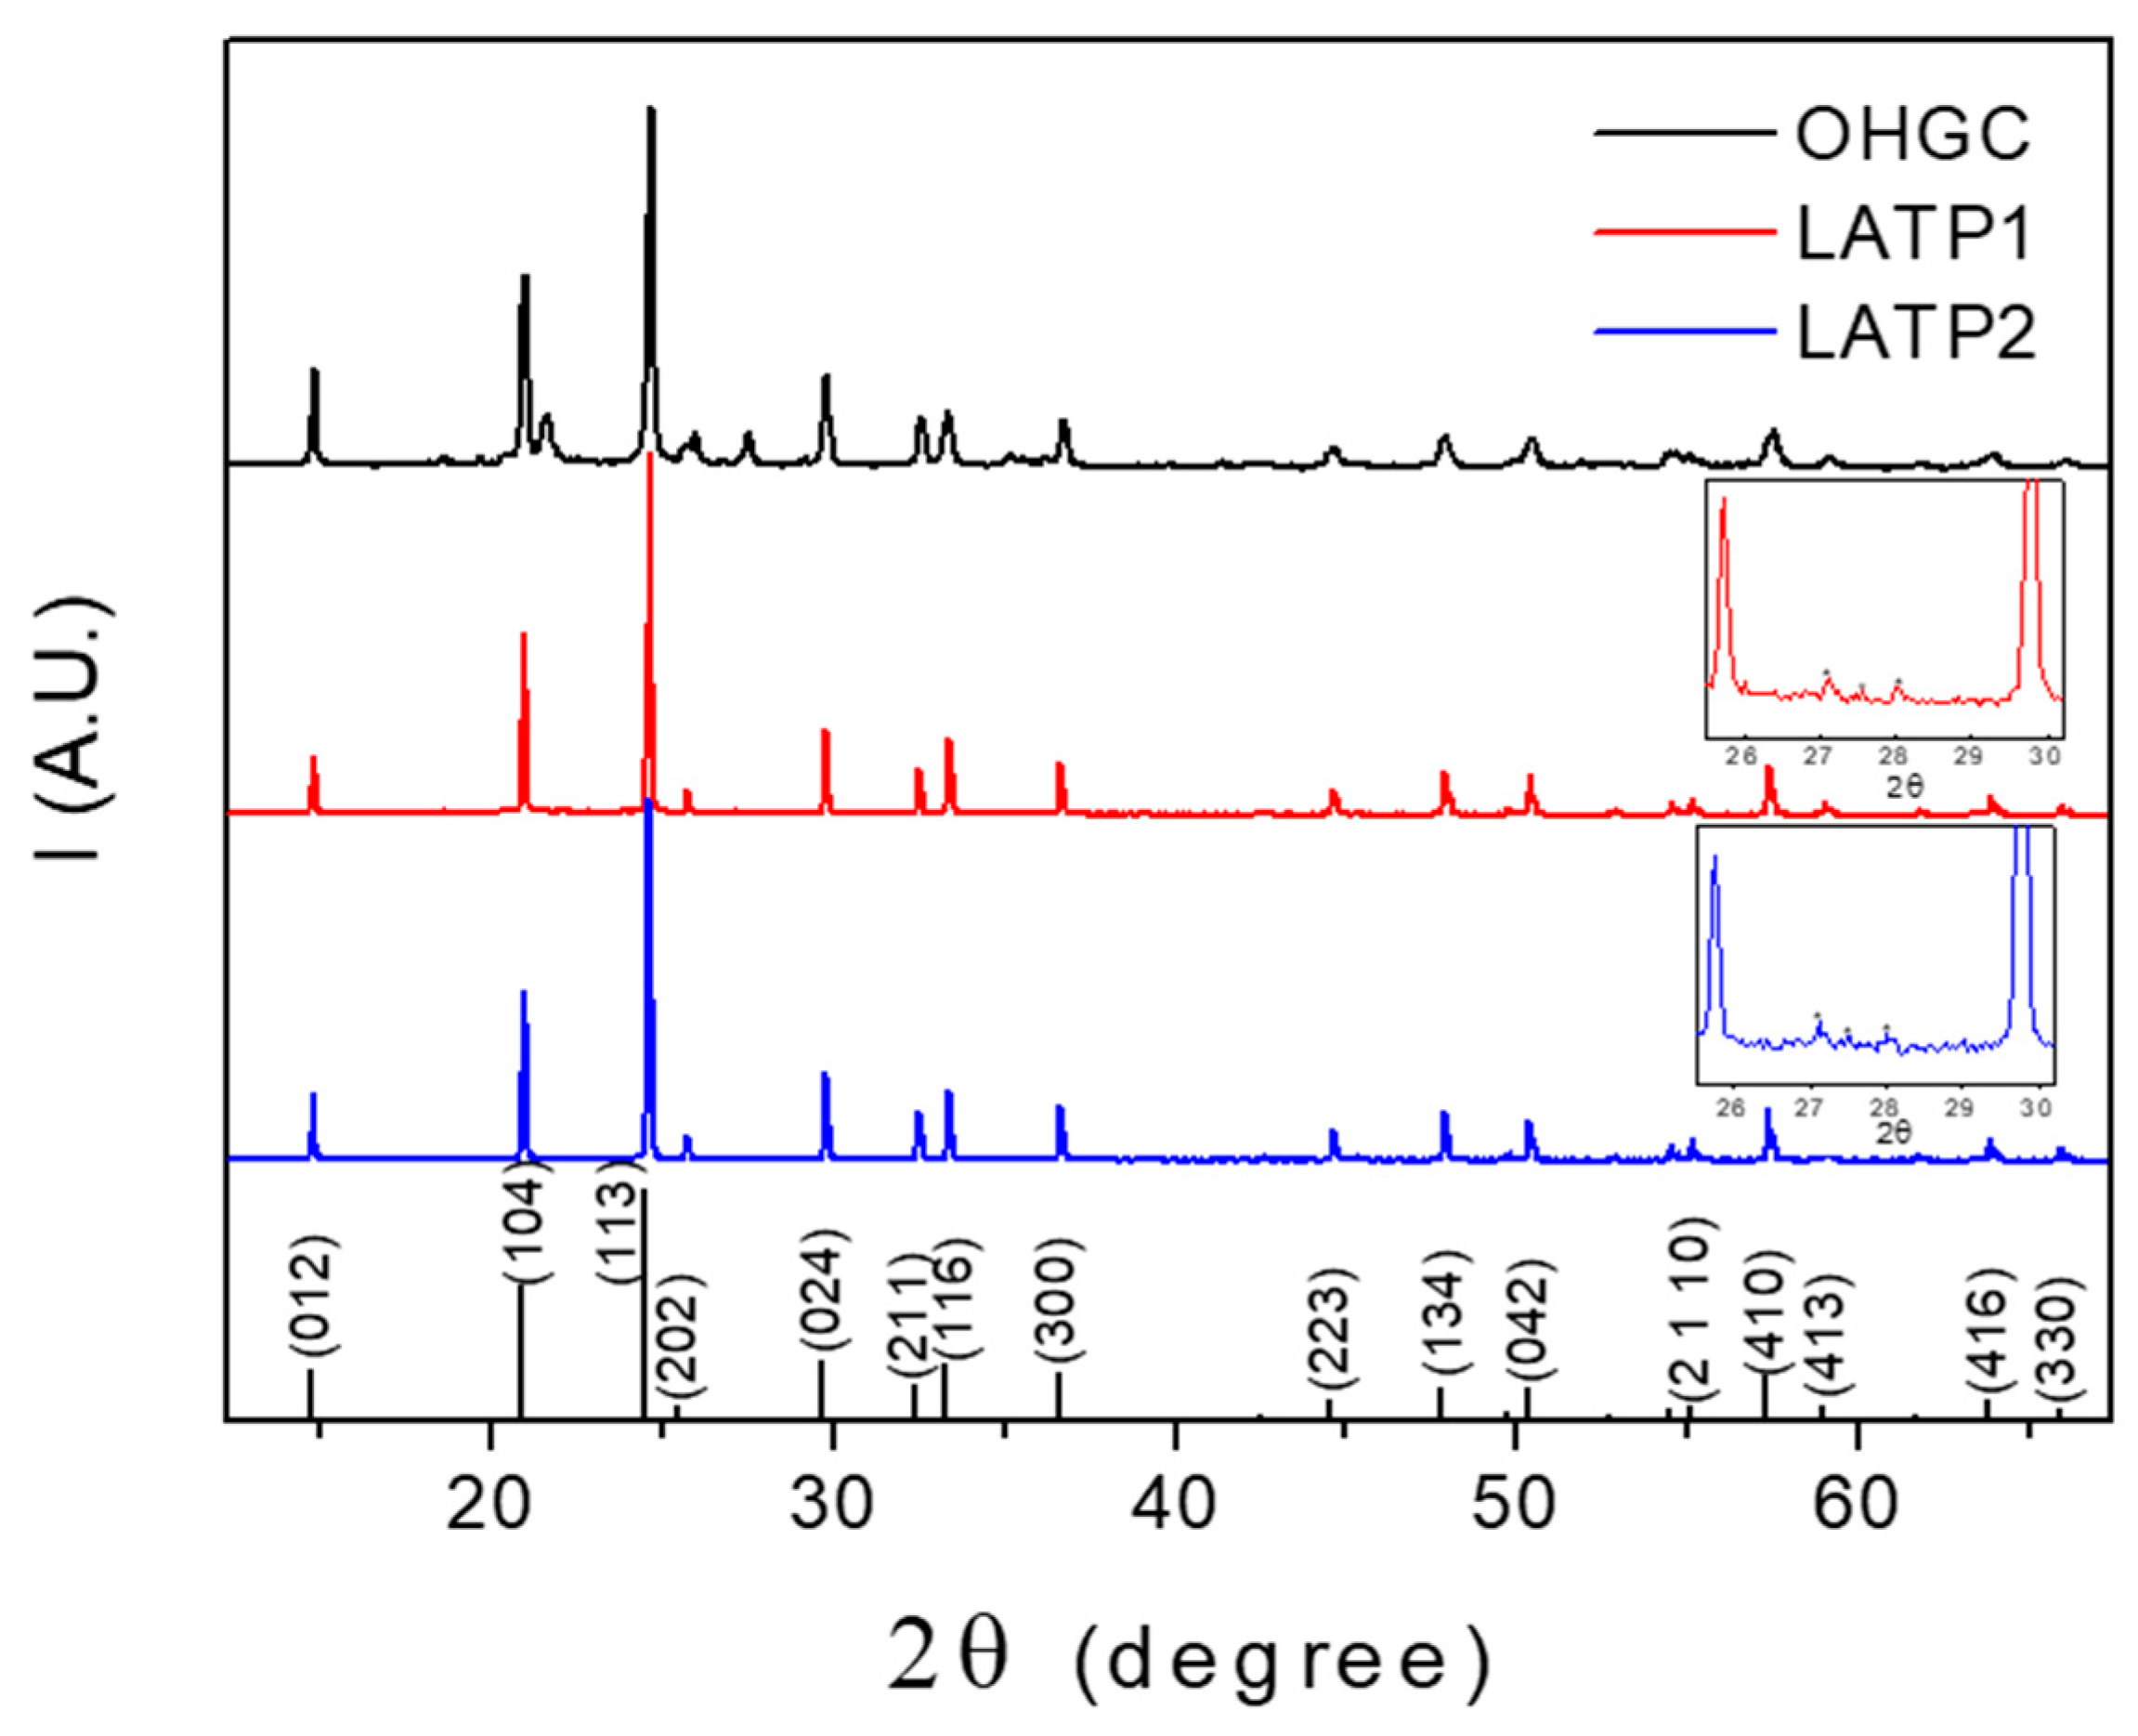
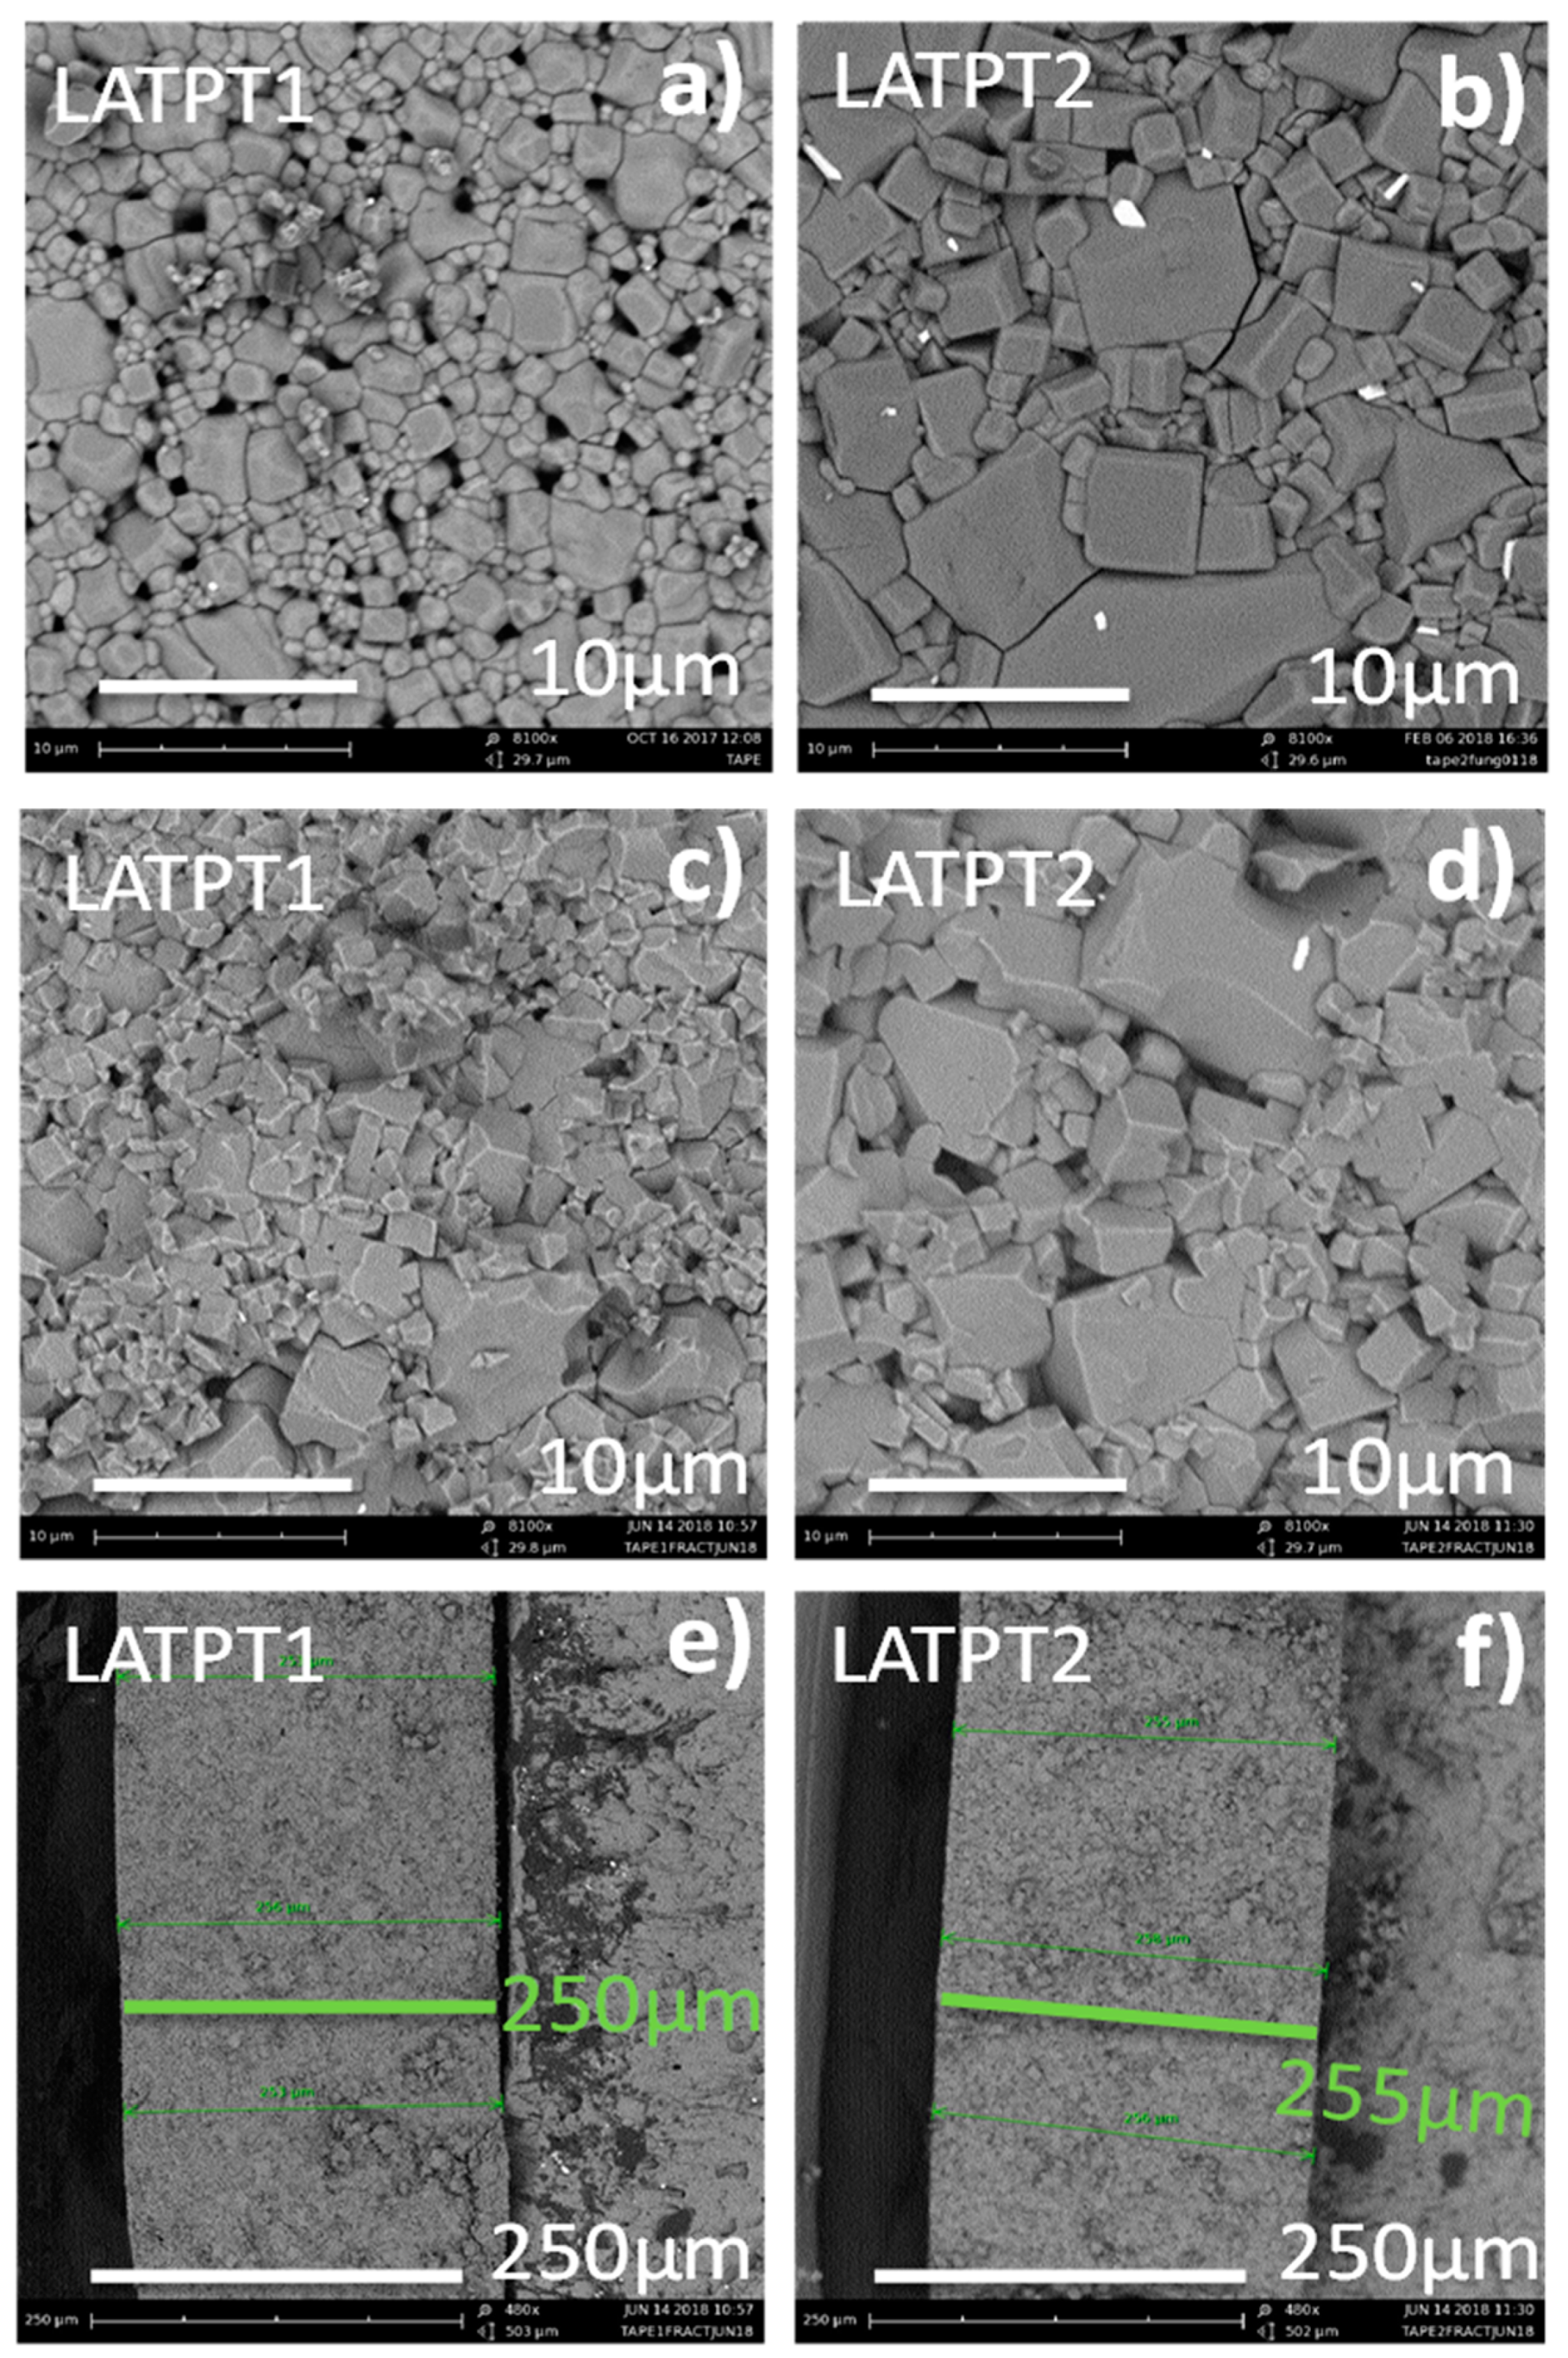
2.1. Structural and Microstructral Characterization

XRD patterns of the prepared Li-NASICON Li1.3Al0.3Ti1.7(PO4)3 LATPT1 and LATPT2 films, and the OHGC are included in Figure 1. The main peaks found in these patterns correspond to the Li-NASICON R-3C phase. In the 2θ (26°–29°) interval, small peaks of the secondary phase LiTiPO5 can be detected (see inset of the two films). Besides the mean peaks, the XRD pattern of the commercial OHGC sample shows the presence of an appreciable quantity of the AlPO4 secondary phase.
In Figure 2, the photos of the prepared samples are given, so as to demonstrate the capability of the proposed method to yield a large area of self-supported Li-NASICON thick films. The dimensions obtained for both samples are 5.5 × 5.5 cm2. The ceramic microstructure has an important effect on the final properties of the prepared samples.
The microstructure of the surface, fresh fracture, and transversal section of the LATPT1 sample are depicted in Figure 3a,c,e, respectively, and those of the LATPT2 are depicted in Figure 3b,d,f, respectively. From Figure 3a,b, it is clear that the LATPT2 sample presents a larger grain size than the LATPT1 sample. In both cases, the large grain coexists with the smaller ones in a kind of a bi-modal microstructure. The difference in the preparation procedure (sintering time) produces a change in the microstructure, increasing the average grain size for both the large and small grains of the bi-modal grain distribution. In the LATPT2 sample, the grain facets are better defined. Some cracks in the grains can also be seen in the micrograph of the LATPT2 sample. The calculation of porosity after the digitalization/binarization of the micrographs gives a value close to the 28% ± 2% (open porosity). The microstructure found out in the fresh fracture showed, in some regions, clean boundaries even with crystallite facets. This observation justifies the poor sintering achieved, which affects the mechanical and electrical properties of samples.
The average thickness of both samples is around 255 µm, as it can be obtained from the measurements performed in the corresponding transversal sections depicted in Figure 3e,f.

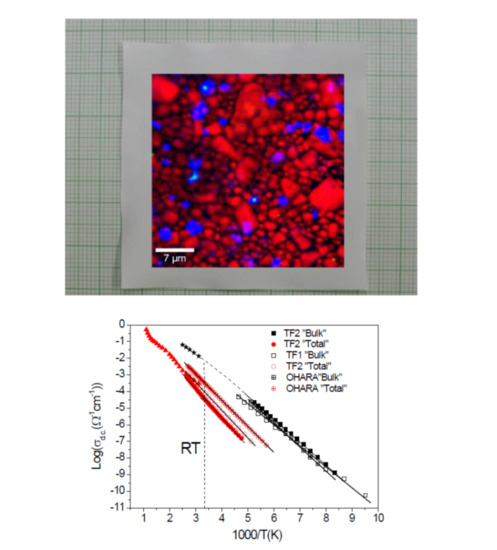
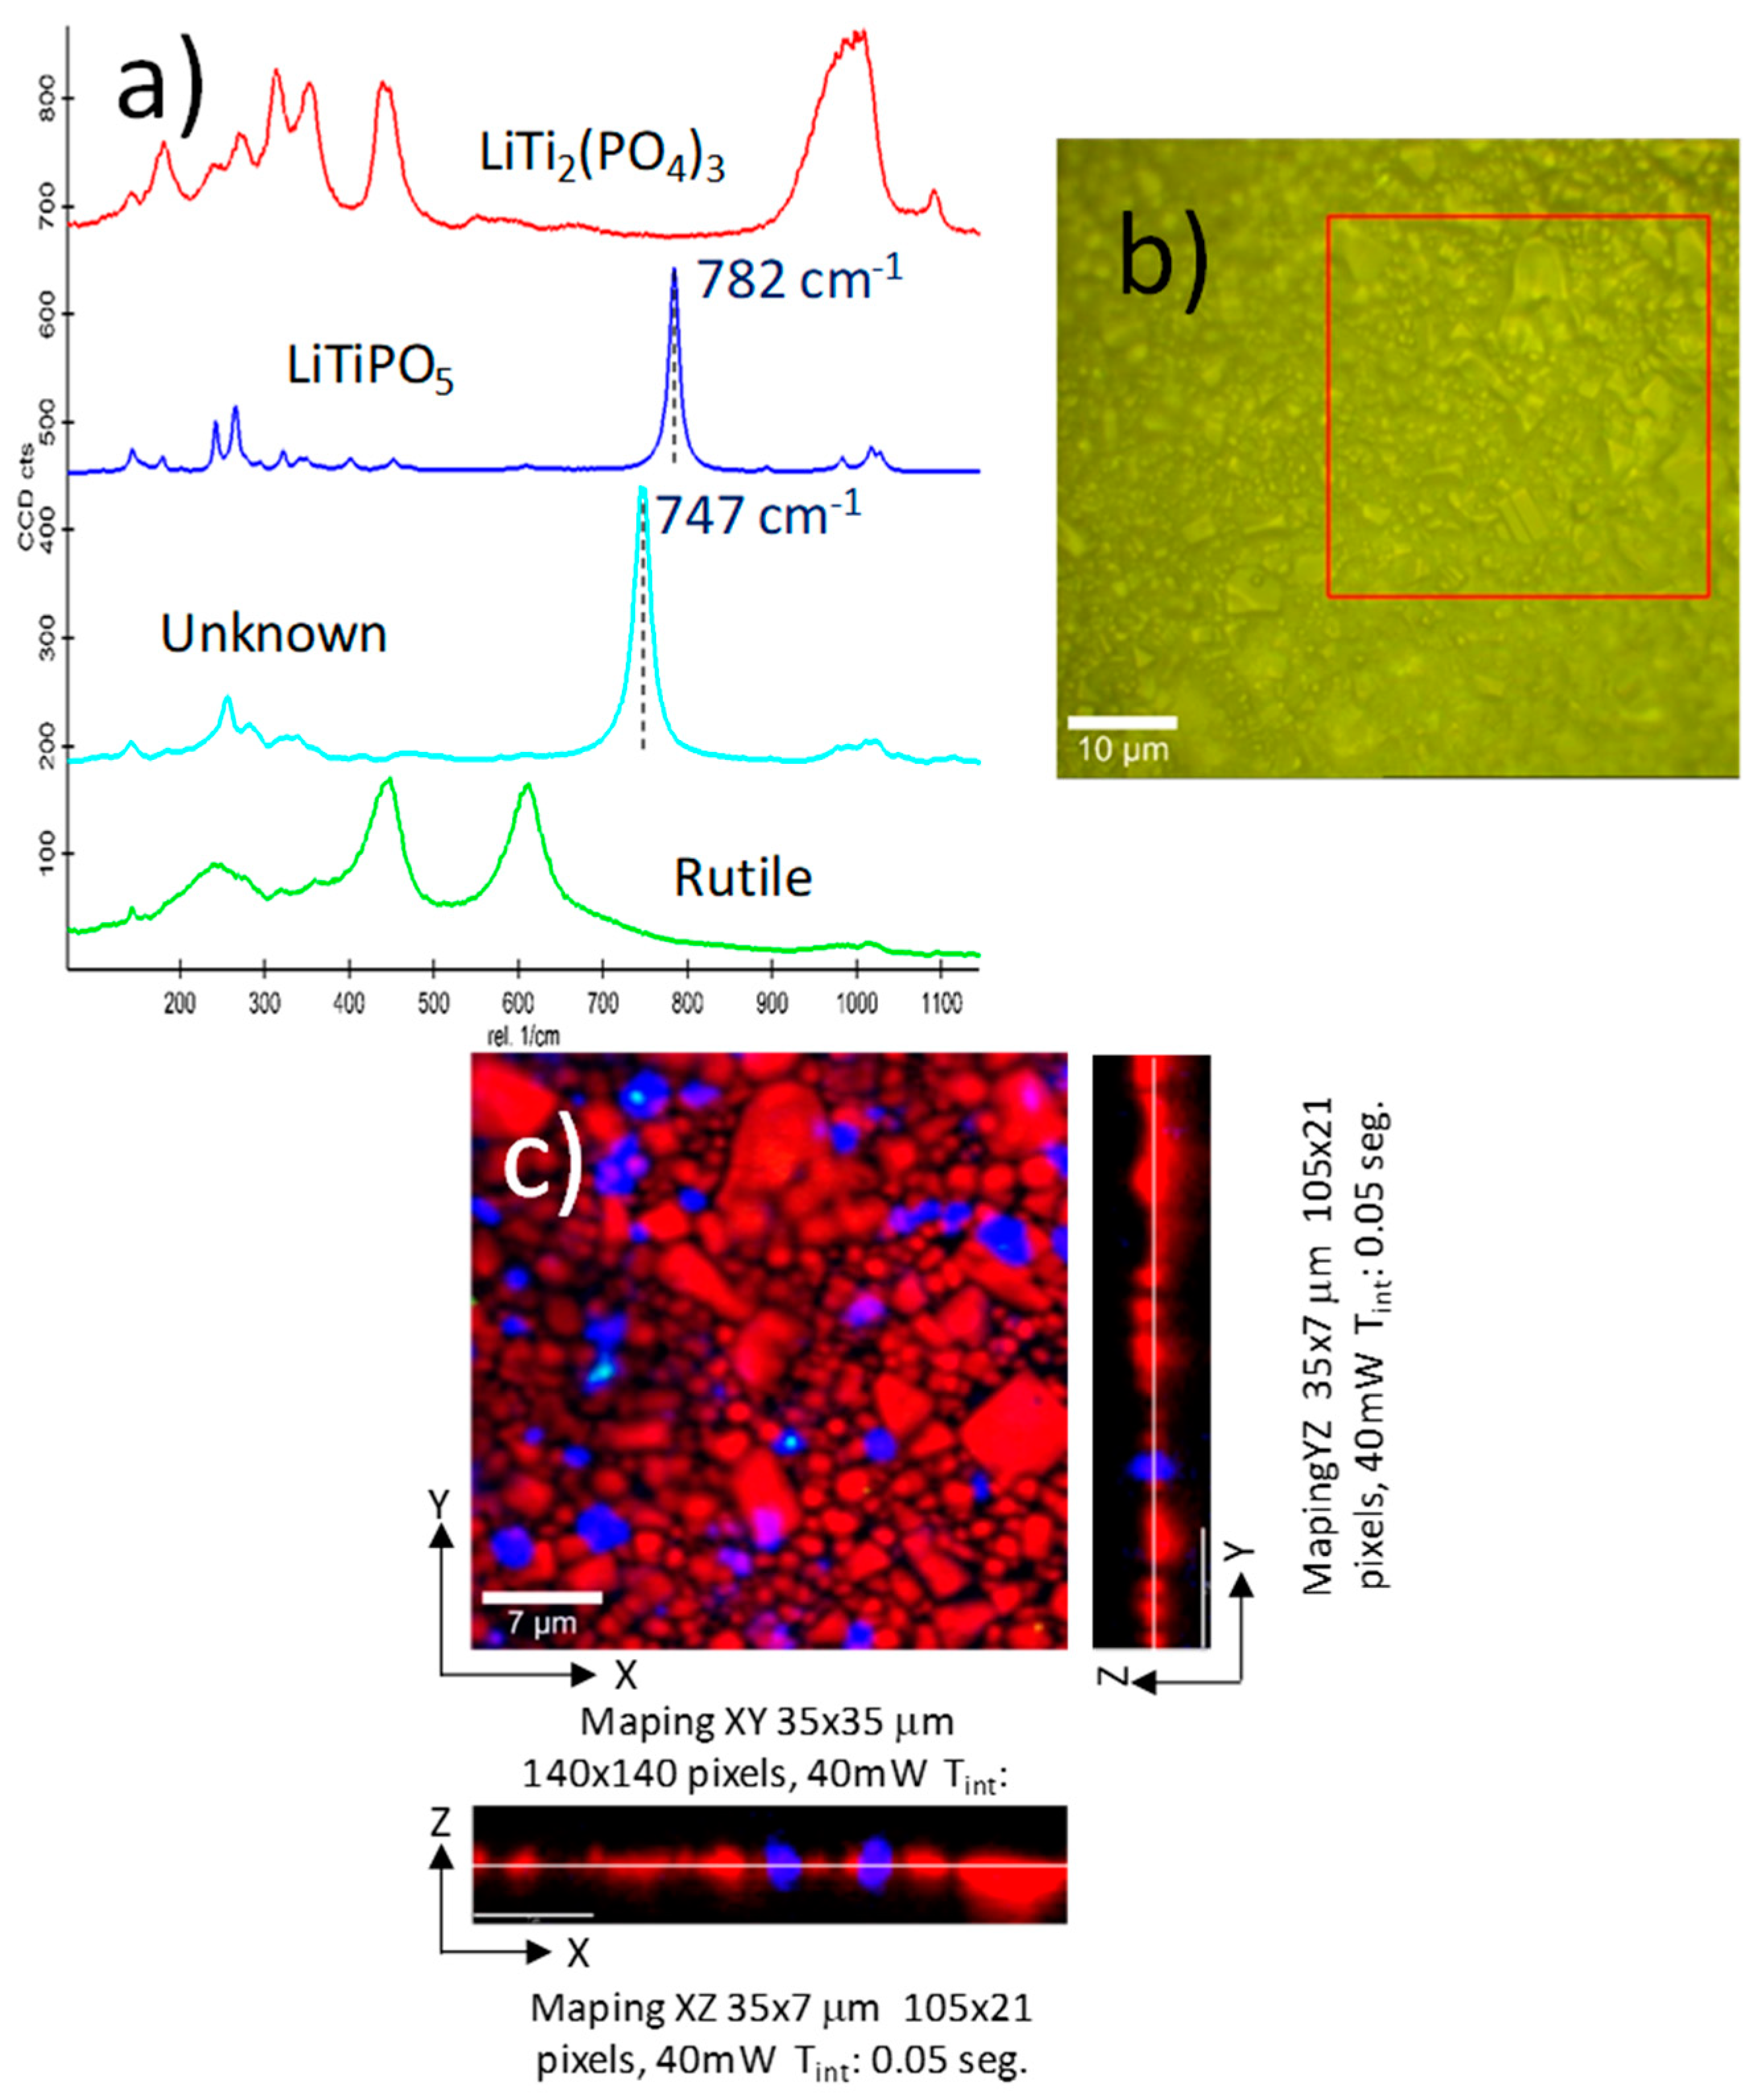
2.2. Confocal Raman Characterization

As indicated previously, the relevant information concerning the secondary phases can be obtained using the confocal RAMAN sweeps. The RAMAN technique is sensitive to both crystalline and amorphous phases, which makes this technique suitable for the investigation of amorphous secondary phases in the supported Li-NASICON thick films [23,24]. Another advantage of this technique is spatial resolution in the distribution study of secondary phases, which is crucial for the understanding of the physical properties. In Figure 4a, the Raman spectra of the different phases found in the LATPT1 sample characterization is shown. Each spectrum corresponds to a small region (pixel) of the mapping, Li-NASICON (red), LiTiPO5 (deep blue), unknown phase (light blue), and TiO2 Rutile (green). The deep secondary phase was identified as LiTiPO5 [25], which is the main secondary phase found in the XRD.
In Figure 4b, the optical microscope image of the analyzed sample surface is illustrated. The Z/X and Z/Y profiles (measured sweep area) are visualized in Figure 4, where a sample in deep information is also given. The obtained results are included in Figure 4c. From this plot, it can be inferred that the main phase is the Li-NASICON (62%), with a significant amount of LiTiPO5 secondary phase (9%; deep blue), a small quantity of unknown secondary phase (1%; light blue), and traces of Rutile (green; 0.3%). The light blue secondary phase has a similar RAMAN spectrum, with a displacement to lower energy of the main band. This peak was assigned to the Ti–O–Ti bond, and it did not move with the degree of Li insertion [25]. The softening of this band should be related to changes in this bond, maybe the inclusion of some amount of Al3+ replacing Ti4+ in the phase. The main secondary phase is also observable in the profile maps, (Z/X and Z/Y), showing a particle size similar to the NASICON particles.

2.3. NMR Characterization

The Magic Angle Spinning Nuclear Magnetic Resonance (MAS-NMR) spectroscopy has been used to characterize the formed phases in the analyzed samples.

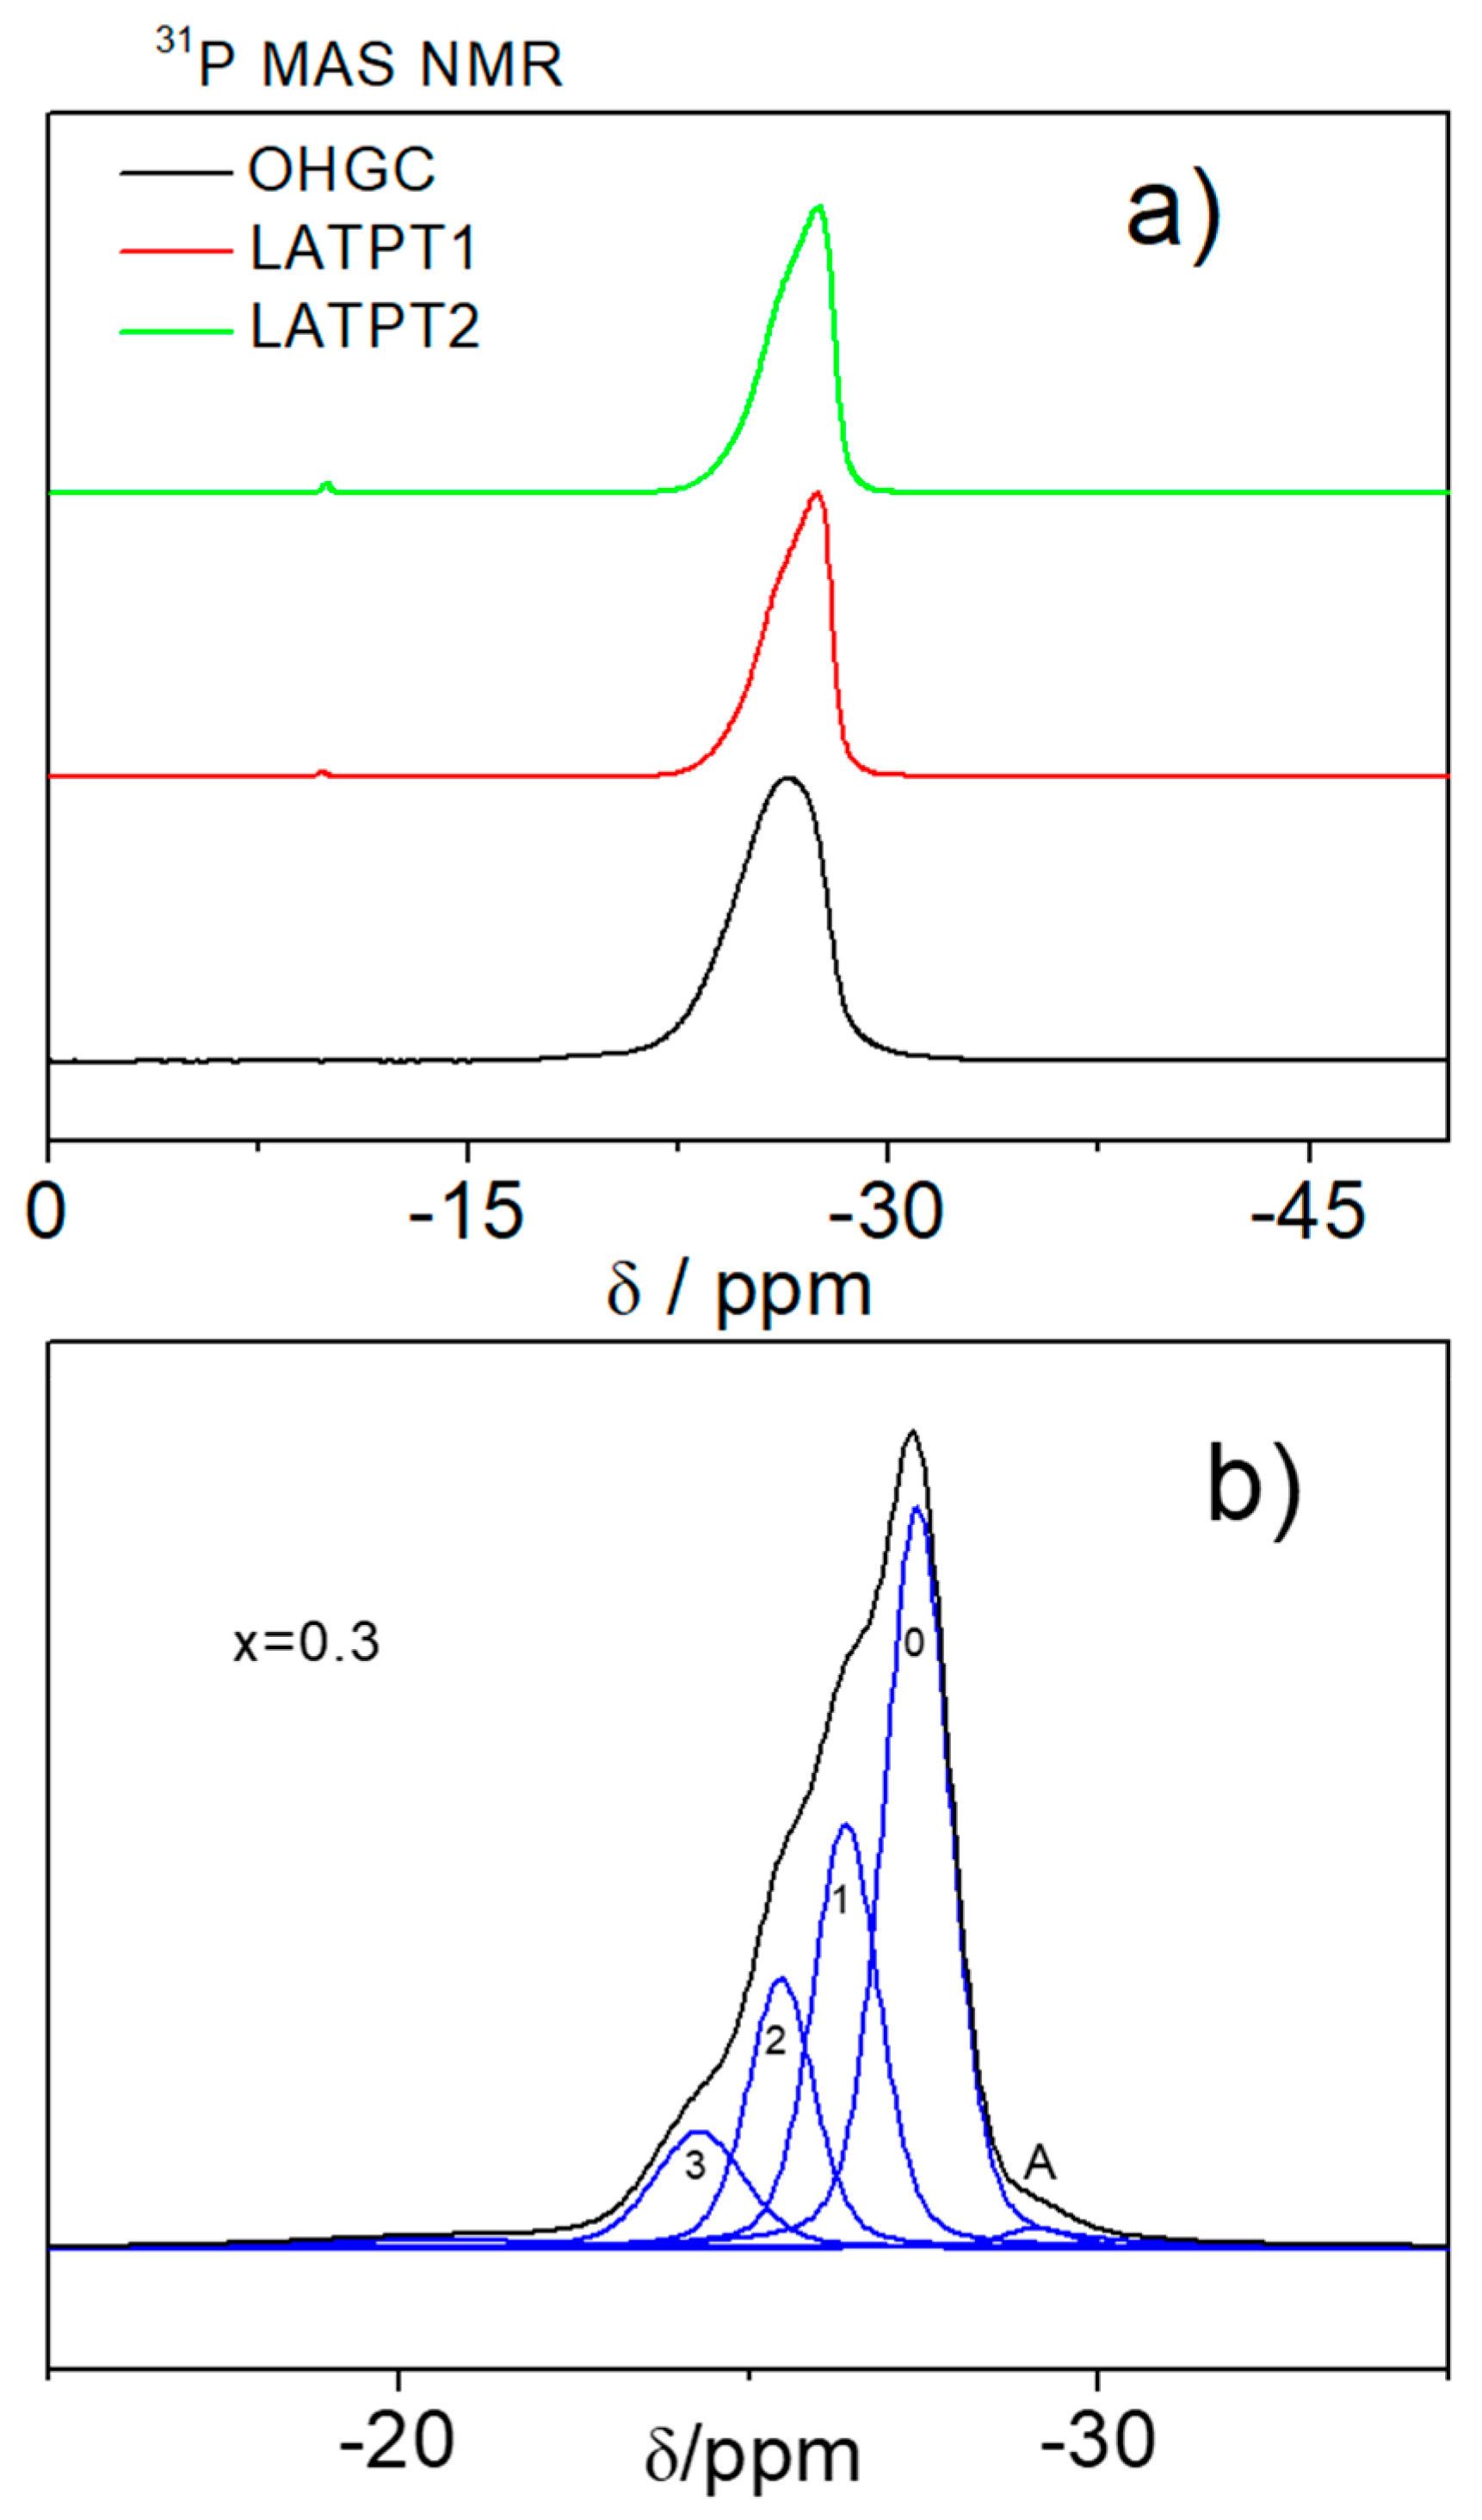
2.3.1. 31P (I = 1/2) MAS-NMR Spectroscopy

In the LATPT1 and LATPT2 samples, the 31P MAS-NMR spectra show a broad and asymmetric component at ~−27 ppm, ascribed to the formation of the LATP NASICON phase (Figure 5a, all of the lines). Small components at −10 and −20 ppm were ascribed to the secondary LiTiPO5 and LiAlP2O7 phases [26]. In the commercial OHARA sample, the small non-resolved component at −30 ppm was associated with the AlPO4 orthophosphate (line A in Figure 5b).
The experimental envelope at −26 ppm was deconvoluted with the DMFIT software that reproduces the positions, line widths, and integrated intensities of the Lorentzian/Gaussian (L/G) components. The deconvolution of this band was done using four equally spaced components of the same line-width, ascribed to P(OTi)4−n(OAl)n environments of NASICON phases (Figure 5b).
From the deconvolution of the 31P MAS-NMR spectra, it was possible to estimate the Al content of the NASICON phases, with the following expression:
(Al3+)/(Ti4+) = (4I4 + 3I3 + 2I2 + I1)/(4I0 + 3I1 + 2I2 + I1) = x/(2 − x)
where (n = 0, 1, 2, 3, and 4) stands for the intensity of the bands associated with the (4−n)Ti(n)Al environments. From the Al/Ti ratios and the relative amounts of Al(x) and Ti(2−x) contents per structural formula were deduced. The Al content deduced in the LATPT1 and LATPT2 samples was near 0.36.
In the case of the commercial OHARA sample, the maximum of the main peak is shifted to −26 ppm, indicating that the peak associated with the 3Ti1Al displays the highest intensity. This observation indicates that the amount of Al is higher in this sample. A similar analysis to that performed in the LTAPT1 and LTAPT2 films indicate that the amount of Al/structural formula is 0.4 in the OHARA sample.

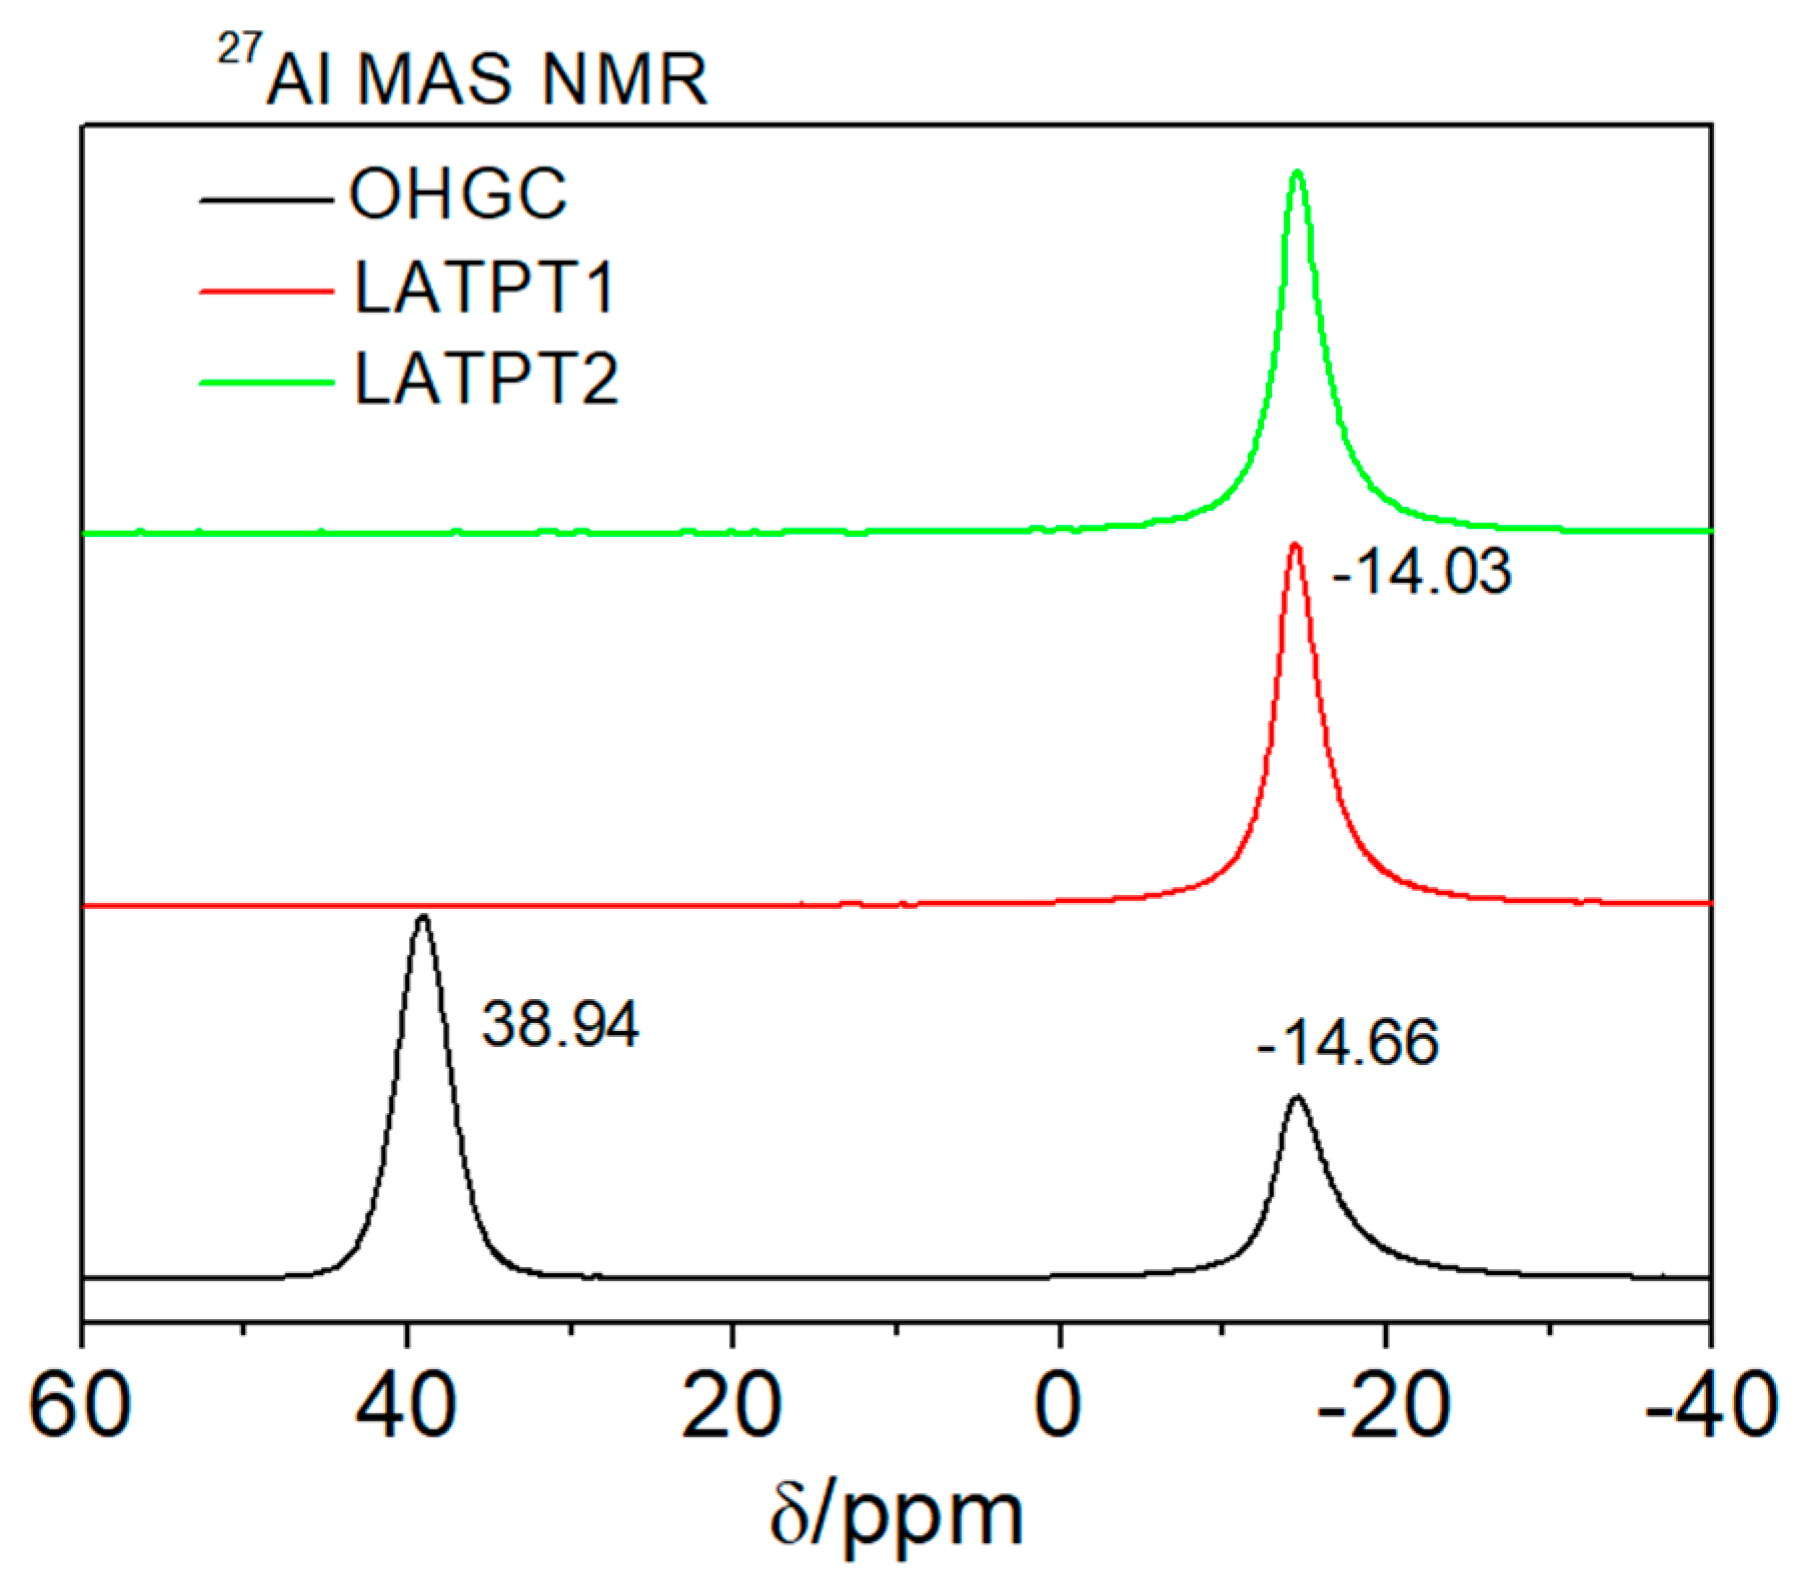
2.3.2. 27Al (I = 5/2) MAS-NMR Spectroscopy

The 27Al MAS-NMR spectra of the LATPT1, LATPT2, and OHARA films are given in Figure 6. In this figure, the presence of tetra (~40 ppm) and octahedral (−14 ppm) Al components was detected. In the prepared films, only the octahedral component was detected, indicating that all of the Al has been incorporated into the NASICON phase. In the case of the OHARA film, the important component at 38.9 ppm has been ascribed to tetrahedral Al in the Al(OP)4 environments of the AlPO4 phase. The difference of intensity of the two peaks indicates that most parts of Al are not incorporated into the NASICON phase of the OHARA sample. Differences detected in the intensity of the 31P and 27Al MAS-NMR bands are due to different amounts of Al per structural formula in the AlPO4 and Li1.3Ti1.7Al0.3(PO4)3 phases (Al/P = 1 and 0.1).

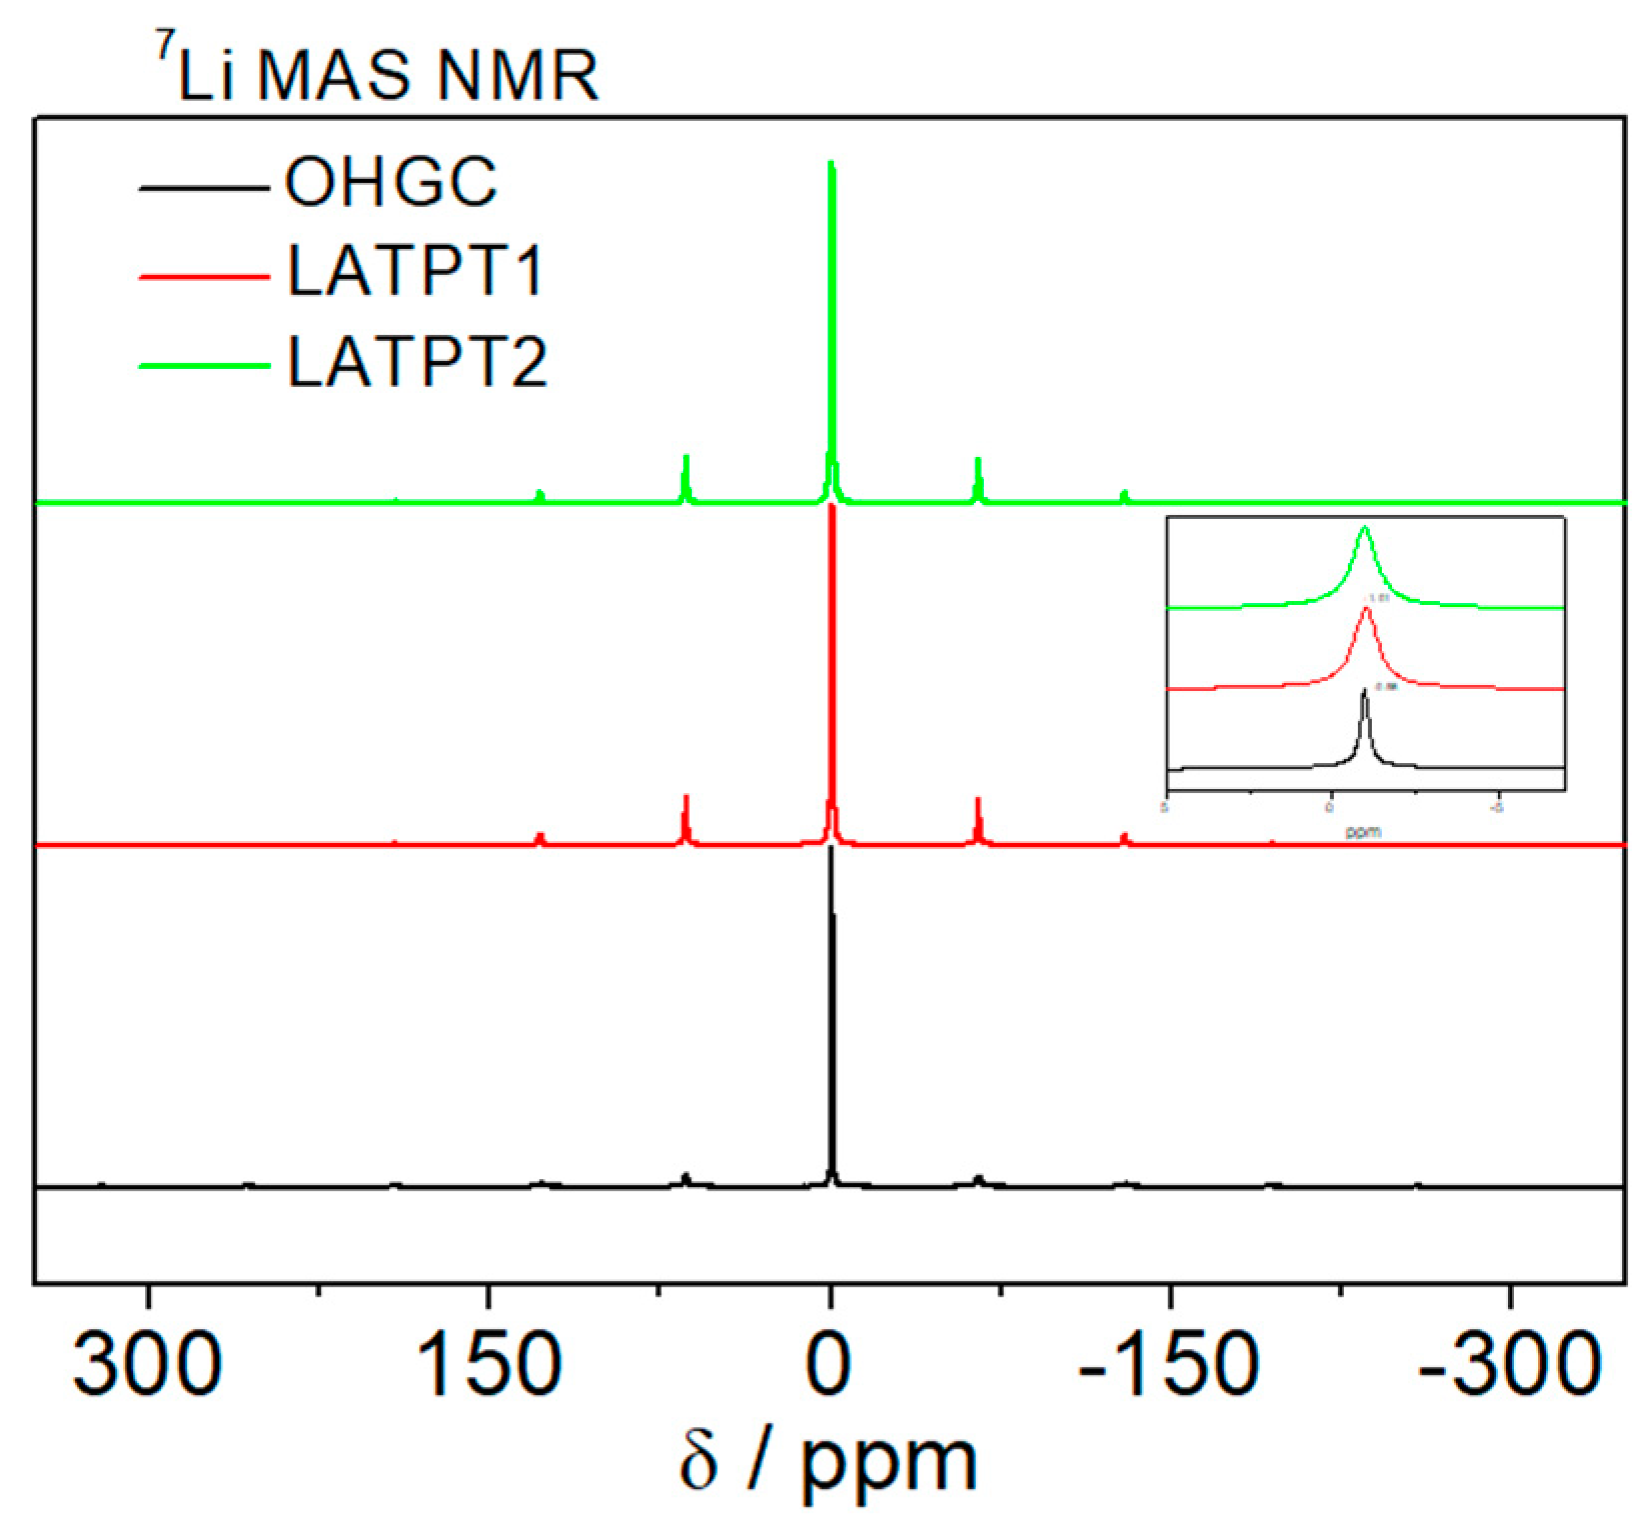
2.3.3. 7Li (I = 3/2) MAS-NMR Spectroscopy

The 7Li MAS NMR spectrum (Figure 7) displays an intense central band near −1 ppm, which corresponds to the octahedral coordination of lithium. Equal spaced bands have been associated with quadrupole interactions of Li ions in distorted octahedral of NASICON phases. An analysis of the 7Li MAS-NMR patterns indicates that there are two Li species, namely: one corresponds to Li allocated at the M1 sites of the NASICON phases (quadrupole constant CQ: ~40 kHz), and the other allocated at the new sites, displaying a higher mobility (absence of quadrupole interactions) [15].
In the case of the OHGC sample, the intensity of the spinning side bands decreases considerably, suggesting that most Li display a high mobility, which averages dipolar and anisotropy terms of interactions at structural sites. The analysis of the central component shows that mobility is higher in the OHGC sample than in the LATPT1 and LATPT2 samples. The Li mobility cancels the dipolar interactions, making the central lines become narrower.

2.4. Mechano-Elastic Characterization

The characterization of the complex Young’s modulus was performed at room temperature using a triple point bending (TPB) technique. In Table 1, the results of the mechano-elastic measurements are included. The commercial sample presents the largest Young’s modulus of 40 GP and small losses. This sample behaves as an elastic material with a high Young’s modulus. The ceramic thick film samples of this work presented a lower Young’s modulus and larger losses. In the case of the LATPT2 sample, the Young’s modulus was more than four times lower than the commercial sample. The presence of porosity in a ceramic produces a reduction in the Young’s modulus if compared to the value of a full dense ceramic [27]. In the case of materials with a thermal expansion anisotropy, which is the case of Li-NASICON, microcracking at the grain boundaries can appear [28], also reducing the Young’s modulus in the ceramic. The lower Young’s modulus found in the LATPT1 and LATPT2 samples in comparison with the commercial OHGC can be explained, in part, as a result of the large porosity found in our samples. However, the reduction of the modulus is larger than expected for the observed porosity, and can be related with the apparition of microcracking. Moreover, the differences in the Young’s modulus found between our samples cannot be explained by the porosity. The larger grain size of the LATPT2 sample can induce enhanced microcracking in this sample in comparison to LATPT1, and so lower modulus [29]. The load force used in the TPB measurement is very low, as our thick film samples are much more brittle than the OHGC. The fracture modulus of our samples (not measured) is small, as the samples present both important porosity and microcracking. This combination makes the crack propagation in the ceramic body very easy, producing a very brittle behavior of the prepared thick films.

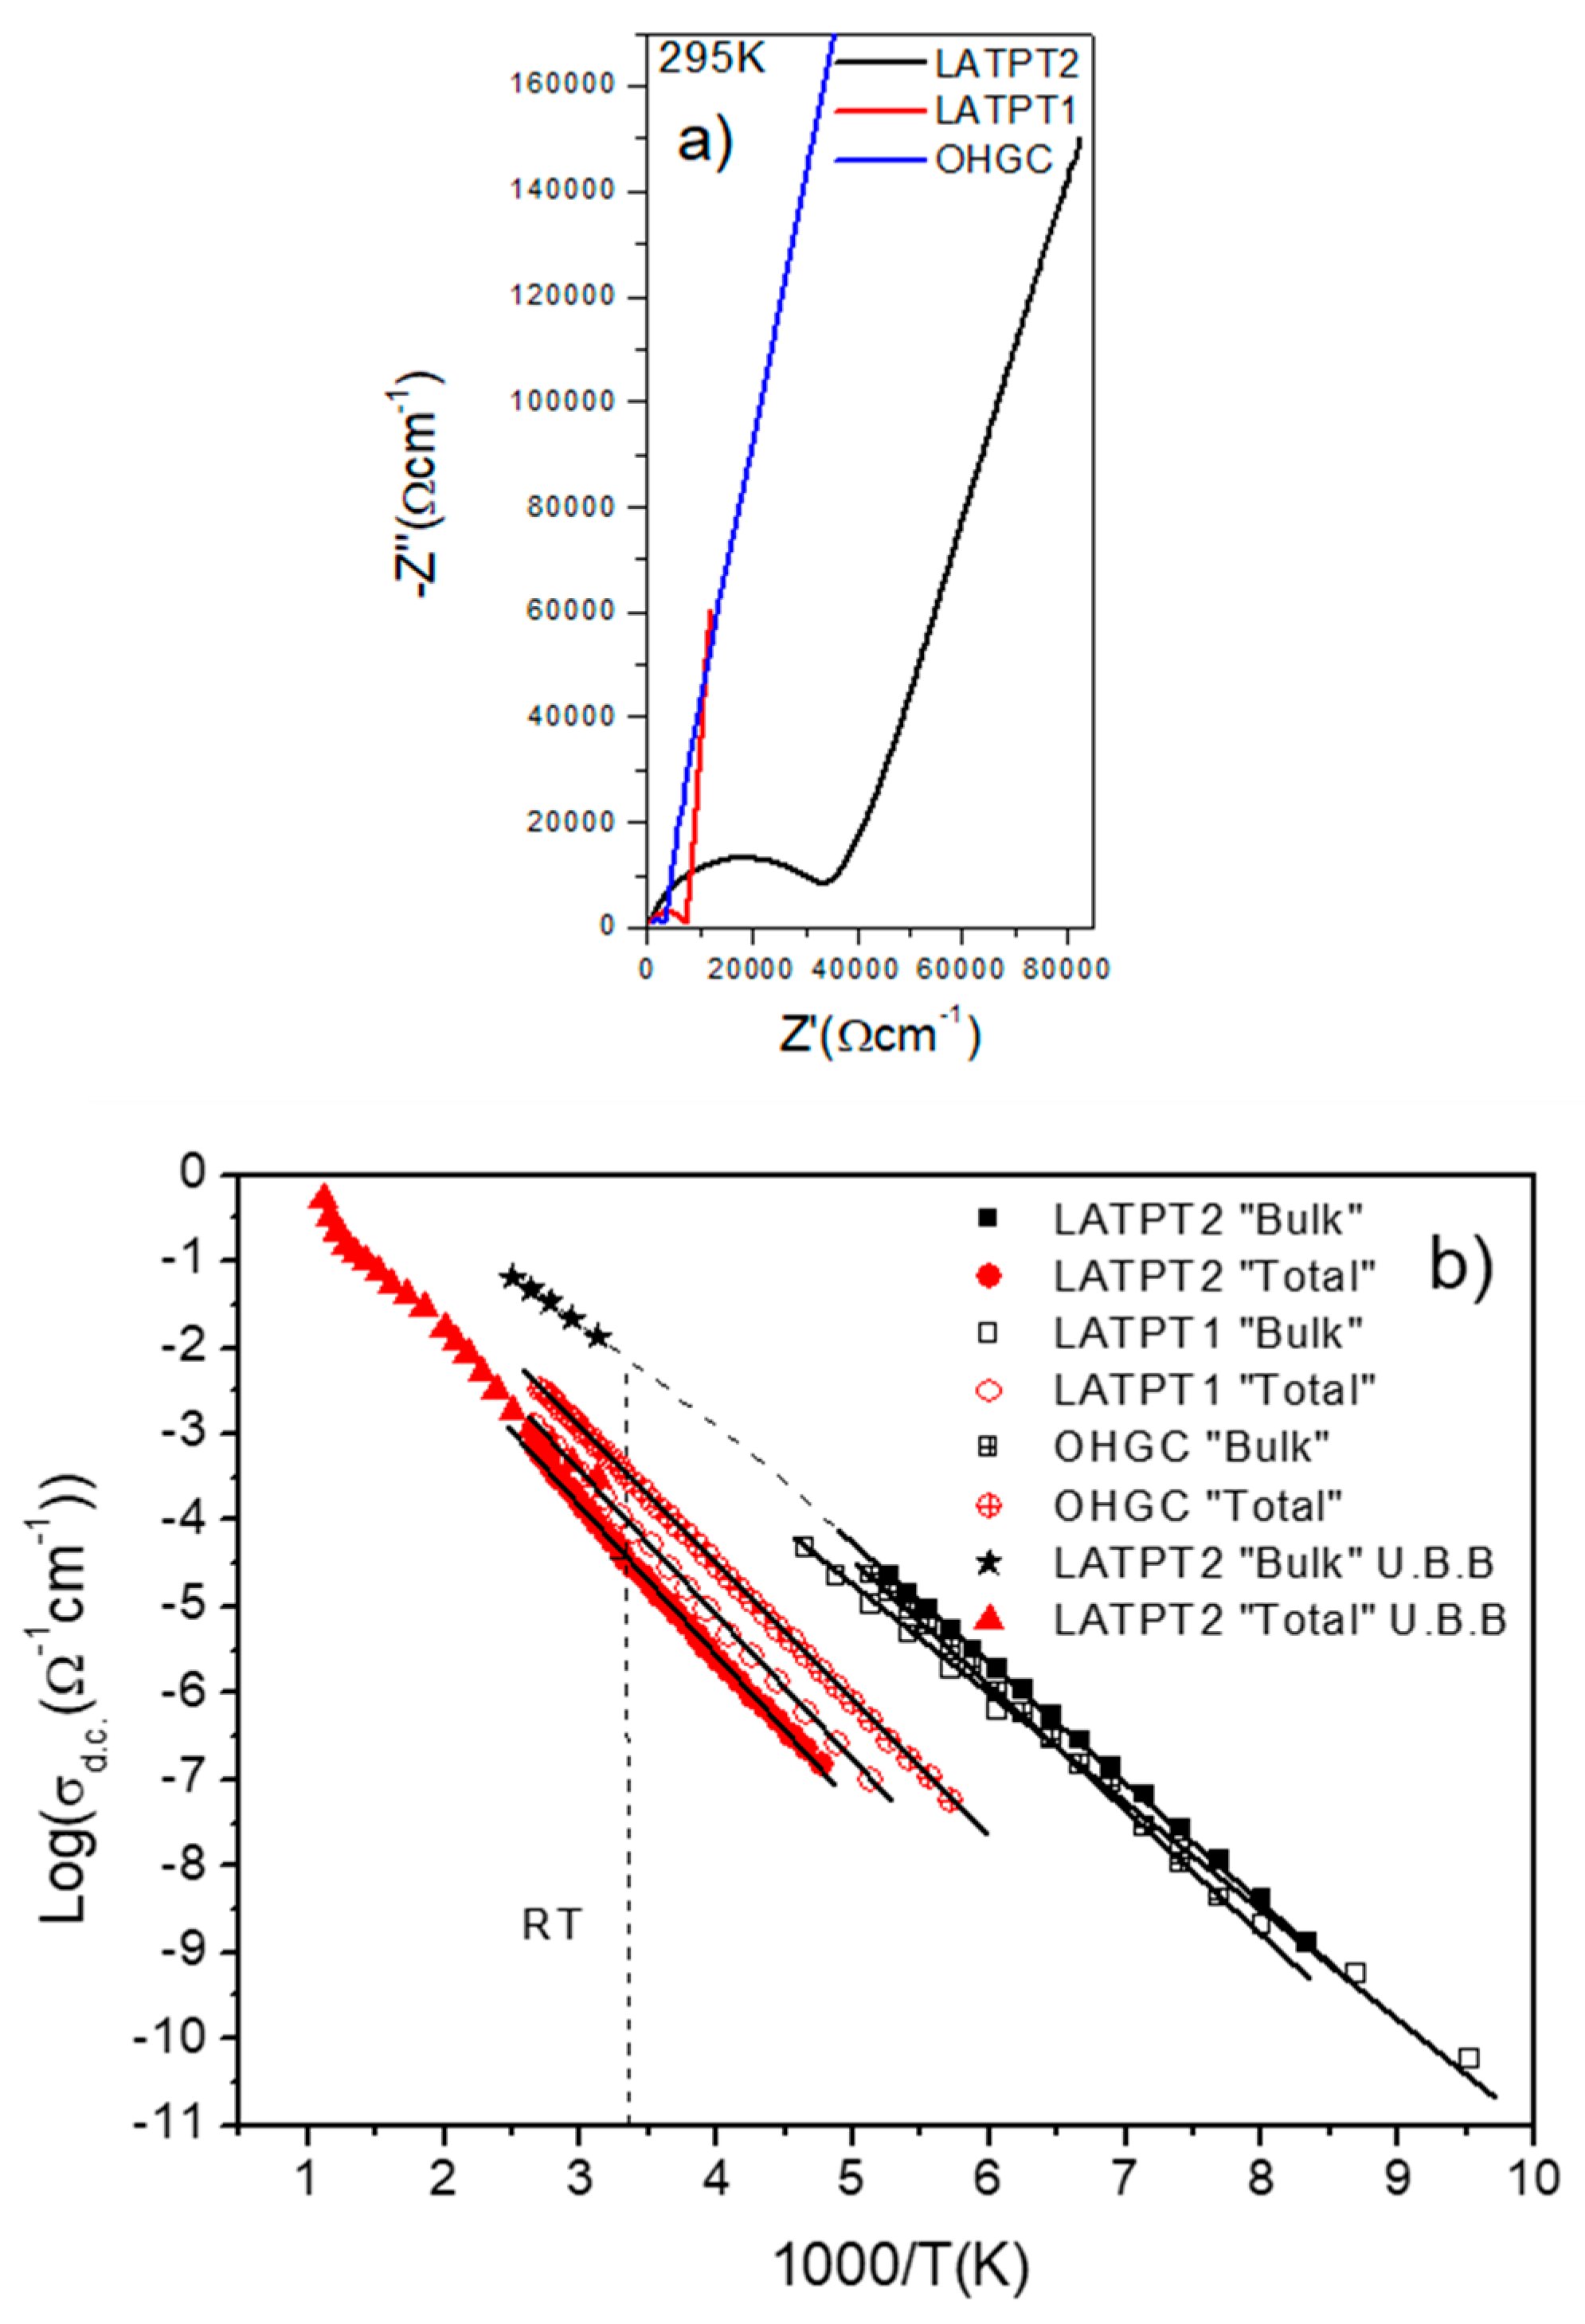
2.5. Electrical Characterization

The AC electrical characterization of the sample was performed over a wide range of temperatures. In this way, it is possible to identify the different contributions to the conductivity of the prepared samples. In Figure 8a, the normalized impedance measurement at room temperature (Nyquist plots) for the different samples are shown. In all of the samples, a low frequency spike was observed, associated with the Li+ blocking behavior at the Au electrodes. This response confirms the ionic nature of conductivity. In the Li-NASICON samples, the ionic conductivity is so high that the conductivity constant time of the bulk component of the impedance is out of the frequency window of these measurements (20 Hz–2 MHz). The semi-circle observed in the high frequency part of the impedance is due to the blocking effect in poor Li conducting grain boundaries.
The best total conductivity found out at room temperature corresponds to the commercial sample. In the particular case of the samples prepared in this work, conductivity is larger in the LATPT1 than in the LATPT2 sample (see Table 2). From the complex non-linear fit (CNLS) of the impedance results, the “bulk” and “overall” conductivities at each temperature were deduced. In Figure 8b, the Arrhenius plots of two contributions of two ceramic thick-films and the commercial sample are included. The best “bulk” ionic conductivity is found in the LATPT2 sample. An interesting conclusion deduced in this analysis was that the “bulk” conductivities of three samples are similar. There is a small difference in the activation energy, which is larger in the commercial sample and smaller in the LATPT1 sample.
The overall DC conductivity displays much more differences. At low temperatures, the overall conductivity is dominated by the grain boundary response in analyzed samples. The sample with the best overall conductivity is the commercial sample (OHGC) not the LATPT thick films, being the conductivity of LATPT2 sample the poorest one. The results of the Arrhenius analysis of the DC conductivity are given in Table 2. The activation energy is similar in the three samples (0.31–0.35 eV).
As the best “bulk” conductivity was found in the LATPT2 sample, this sample was selected for broad-band (1 Hz–10 GHz) high temperature (RT–1000K) measurements. Because of the difficulty in the preparation of suitable samples for the broad band IS technique (KHz–GHz), the “bulk” response could only be measured in a small range of temperatures (see Figure 8b stars symbol). From the electric results, it was deduced that the RT DC conductivity of the sample was 8.5 × 10⁻³ Ω−1·cm−1, with an activation energy of 0.22 eV. The “overall” response follows the trend observed in the previous works, but changes in the slope were detected at an increasing temperature. This effect can be related to changes in the grain boundary conductivity during high temperature cycling’s.

3. Discussion

Large area self-supported Li-NASICON thick films can be prepared by tape casting the slurries prepared with Li-NASICON powder obtained from the sol–gel powders. The crystallization temperature of the powder was 800 °C and the sintering was done at 900 °C in order to produce materials with a very small quantity of crystalline secondary phases. A small quantity of LiTiPO5 was found by XRD. In the commercial OHGC sample, a large quantity of AlPO4 was detected, which was not present in the LATP thick films. The NMR characterization of the samples, found other small quantities of secondary phases like LiAlP2O7 and LiTiPO5 in the LATP thick film samples.
On the other hand, the microstructure of our samples is similar to that of bulk ceramics, with a typical bi-modal grain distribution [30], but with a larger porosity. The average grain size is much larger than the one found in the commercial sample, where the sizes are sub-micrometric [31]. Another important difference in the microstructure, especially in the LATPT2 one, is that the facets of the large Li-NASICON crystals are clearly visible, in both the surface and in the fresh fracture micrographs. This feature is related with the easy breaking of the ceramic through the grain boundaries instead of through the intra-grain fracture. The larger crystals grow, but do not sinter with the neighbor ones, producing a poor attached interface in these samples at temperature and time-used in treatments. The poor sintering among the large grains joined to the large porosity can be responsible of the low Young’s modulus of the prepared thick films, as well as their brittle behavior. From the observed microstructure large grain boundary, impedance can be expected for the prepared thick films. Moreover, the grain size growth can be deleterious for the conductivity property, as it surpasses the critical size for the micro-cracks formation as a result of the strong dilatation anisotropy of the Li-NASICON [32]. The absence of AlPO4 as a secondary phase justifies large grain growths detected in the thick films samples from the sol–gel powders, as this phase prevents grain growth in LATP NASICON [33].
The NMR characterization allowed for the quantification of the Al and Li incorporation in the LATP NASICON phase. The LATP x = 0.3 phase is almost stoichiometric (x = 0.34), showing a good quality in the prepared LATP crystallites of thick-films. The information about the Li+ dynamics in the samples indicates enhanced dynamics for the OHGC sample, as it presented a narrower central line and reduced quadrupolar interaction. This result is not in agreement with the conductivity results, which indicate a better conductivity in the LATPT2 sample. The complexity of the Li+ conductivity mechanism in Li-NASICON that implies a diffusion path along M1–M3–M1 sites with different residence times at different sites means that this simplified analysis of the line is not strictly valid. The changes on the residence time of two sites explain the increment of quadrupolar constants with temperature [34].
The mechanical properties of an electrolyte thick-film must be high for the development of large-area ASSBs or Li–air batteries. The results of the Young’s modulus of the prepared thick-films are quite poor, compared with the OHGC commercial film. In the best case, LATPT1 is three times lower, increasing losses and dissipation effects at grain boundaries, making the material more viscous-elastic. LATPT2 presented the poorest mechanical properties. This drop of the mechanical properties can be related to the microstructure and the nature of the grain boundaries. Large grains imply that samples are prone to develop micro-cracking [32] and poor sintering. This effect, joined with a rather large porosity of samples, can be the reason for the low Young’s modulus and the important brittleness of the sample providing a poor mechanical performance of prepared thick-films.
The ionic conductivity is also affected by the sample’s microstructure. The LATPT2 samples showed the highest “bulk” ionic conductivity, resulting in a good crystallization and stoichiometry, with a rather small quantity of secondary phases. The obtained value, 7 × 10⁻³ Ω−1·cm−1 (measured at RT), is remarkable, displaying a very low activation energy of 0.22 eV. The conductivity measured in the micro-crystals of the LATP of the same composition is 5 × 10⁻³ Ω−1·cm−1 at RT, and no activation energy value is given. [35] Poor sintering, large porosity, and the presence of micro-cracks strongly reduces the “overall” DC Li conductivity. At 195 K, the difference between the “bulk” and the grain boundary values is three orders of magnitude. The LATPT1 shows the same problems, but in a lower degree.
The existence of secondary phases can also be behind the increase in the ceramic total resistivity. In the phase analysis of our samples, a secondary phase of LiTiPO5 was found, as well as small quantities of LiAlP2O7 and rutile. This main secondary phase is much less Li conducting (1.1 × 10⁻⁵ Ω−1·cm−1 at 400 °C, Ea = 1 eV) [36] than LATP. If this secondary phase is accumulated at the grain boundaries, it can be, to some extent, responsible for their strong blocking behavior. To observe the distribution of the secondary phases in the sample, the confocal Raman technique is a powerful technique. From the compositional map of the LATPT1 thick-film sample (Figure 4c), an even distribution of this and the other secondary phases is observed. The Raman spectrum of the unknown phase does not match with that of the LiAlP2O7 one (the main Raman bands of this phase are around 669 nm−1, and 713 nm−1, because of the υ P–O–P and vs P–O–P modes) [37]. This secondary phase can be sub-micrometer in size, and thus out of the confocal Raman sensitivity.
As the secondary phases observed in the confocal RAMAN sweep are evenly distributed in the thick film, their Li+ and electronic conductivities are well below those of the LATP, and the quantity is not enough to give a percolated path through the sample; the influence of them in the overall Li- conductivity is to reduce the volume fraction of the LATP phase, and reduce the grain boundary area. Both effects produce a reduction in the “bulk” conductivity as well as in the total DC conductivity, but in a lower extent than if they would be arranged in series with the LATP grains. Maybe the LiAlP2O7 secondary phase, which is not observed in the RAMAN spectroscopy, could be accumulated at the grain boundaries. The conductivity of this phase is 8.8 × 10⁻⁶ Ω−1·cm−1 at 330 °C, just three orders of magnitude lower than the “bulk” one [37]. With this conductivity, the distribution of this phase at the grain boundaries cannot explain the increase in the blocking behavior.
As the main difference between the LATPT1 and LATPT2 samples is the change of grain size, the quantity of the grain boundaries must be smaller for the LATPT2 sample, and the reduction in the total DC conductivity, which is as a result of the increase in the blocking effect of the grain boundaries, must be because of the worse grain boundaries in this sample. This statement is also supported by the reduction of the Young’s modulus of this sample in comparison with the LATPT1 one. A larger sintering time increases the grain size, but produces worse grain boundaries. This effect can be related to some thermodynamic instability of the Li-NASICON phase at these temperatures, added to the presence of microcracking at the grain boundaries. The in depth explanation of the origin of this effect is not in the scope of this work.
From our results, it can be concluded that, in pure phase LATP thick-films. the increase in grain size is deleterious for the functional properties. The large porosity joined with the bad quality of the interfaces between the large grains produced this effect. In fact, the OHGC thick film sample was designed to avoid the grain growth and the formation of LATP/LATP grain boundaries. The fabrication of the OHGC sample implies high temperatures to melt the mixture, and then the re-crystallization step (700 °C), to a specified extent. It should be kept in mind that heating the OHGC sample at temperatures larger than 700 °C increased re-crystallization and reduced the total DC Li conductivity; this is a limitation for its application in ASSBs.
In order to produce large area ceramic LATP thick films, the use of sintering aids is mandatory, as well as some additives that could reduce the grain growth. For this last aim, the use of a small volume of AlPO4 to reduce grain size, as proposed in the literature [33], could be a solution. Another way, which is totally different, is the use of spark plasma sintering (SPS), as it gives a higher density and smaller grain size; however, this is not a good choice for large area samples.

4. Materials and Methods

4.1. LATP Powder Preparation

The Li1.3Al0.3Ti1.7(PO4)3 solid-state electrolyte powder was synthesized by a sol–gel method. The raw materials used were LiNO3 (purity >97.0%; J.T. Baker Chemical Co, Phillipsburg, NJ, USA) City, Country), Al(NO3)3 9H2O (98%; Alfa Aesar, Ward Hill, MA, USA), NH4H2PO4 (purity >98%; Sigma-Aldrich, St. Louis, MO, USA) and Titanium(IV) isopropoxide (98%; Sigma-Aldrich). Titanium (IV) isopropoxide was added to the de-ionized water while stirring. Titanium hydroxide precipitate was formed immediately. The precipitate was filtered and washed. The washed precipitate was transferred to an empty beaker, and de-ionized water was added into the beaker. Nitric acid (65%, Aldrich) was then added to the titanium hydroxide precipitation with water. When a clear TiO2 and nitrate solution was formed, citric acid monohydrate (99%, Merck, Darmstadt, Germany) was added into the solution to stabilize it. LiNO3 and Al(NO3)3·9H2O added into the TiO2 and nitrate solution while stirring. After the salts were dissolved, NH4H2PO4 was then added to the solution and a sol was immediately formed. The gel was dried at 80 °C for 24 h and calcined at 600 °C for 4 h. The calcined powder was milled in ethanol with zirconia balls for 24 h, and pressing into pellets. The pressed pellets were sintered at 800 °C. The pellets were milled again and sieved through a 200 mesh.

4.2. Slurry and Thick Film Preparation

The LATP powder and binder (B73305 Ferro Corp., San Marcos, CA, USA; solute PVB, solvent Ethanol + Toluene) in 62.5:37.5 wt % proportions were mixed by ball milling in a Teflon bottle with zircona balls for 24 h. The mix was de-foamed in an oven at 70 °C for one hour. Then, it was ball milled again for 12–16 h. The recipient with the slurry was introduced into a vacuum chamber for 4–6 min for degassing. The slurry was tape casted using a commercial lab-size tape casting machine (uni99 from Huan-Yang Co., Ltd.) using a blade separation of 1 mm at a speed of 2 cm/s. The formed tape was dried at 40 °C and cut into pieces of 60 × 60 mm, and the final sintering was performed at 900 °C with a LATP powder bed during 4 h LATPT1 and 12 h LATPT2.

4.3. Samples Characterization

X-ray diffraction (XRD) patterns were recorded at room temperature using a Bruker D8 Advance diffractometer (40 kV and 30 mA, Bruker AXS, Karlsruhe, Germany), using the Cu Kα radiation. The XRD patterns were recorded in the 10–70° range. The angular step was 0.04°, and the counting time/step was 0.5 s. The crystalline phases were identified using the data of the International Centre for Diffraction Data (ICDD).
The thick films compositional homogeneity was also tested by using the confocal Raman microscope (Witec alpha-300R, WITec GmbH, Ulm, Germany), using a 532 nm excitation laser and a 100× objective lens (NA = 0.9). The incident laser power was 0.5 mW. The optical diffraction resolution in the confocal Raman apparatus microscope was limited to ~200 nm laterally and ~500 nm vertically. The resolution achieved in the recorded Raman spectra was 0.02 cm−1. The sample was mounted on a piece-driven scan platform, displaying a 4 nm lateral and 0.5 nm vertical positional accuracy. The collected spectra were analyzed by using the Witec Control Plus Software.
The 27Al, 7Li, and 31P MAS-NMR spectra were recorded with an AVANCE-400 Bruker spectrometer (9.4 T magnetic field). The frequencies used were 104.26, 155.45, and 161.97 MHz, respectively. The spectra were recorded after a π/2 irradiation (2.0 μs pulses for aluminum and lithium, and 4.0 μs for phosphorus) with the MAS technique (rotation of samples at 10 kHz around an axis inclined 54°44′, with respect to the external magnetic field). The number of scans was chosen in the range of 100–800. The position of the NMR components was referred to as 1 M AlCl3, 1 M LiCl, and 85% H3PO4 aqueous solutions. The spectral deconvolutions (position, linewidths, and intensities of components) were obtained with the commercial DMFIT (D. Massiot software, NMR @ CEMHTI CNRS UPR3079, Orléans, France).
The cross-section and plan-view micrographs of the crystalline oxide films were obtained using Scanning Electron Microscopy SEM (Phenom™ G2 pro SEM 5 kV; Eindhoven, Holland). The porosity of the thick films was calculated from the binarization of the plane view SEM images using the image processing software MIP 45 (Digital Imaging Systems Ltd., Buckinghamshire, UK).
The electrical properties of the thick films were measured on planar capacitors by the de-metallization of the opposite face of the samples with Au paste (Dupont 8216), and sintered at 800 °C 2 h. The metalized capacitors were mounted in a broad temperature cryostat Janis VPF-700 to perform impedance spectroscopy (IS) measurements as a function of the temperature (77–575 K) in the frequency range of 20 Hz–1 MHz, using an Agilent LCR E4192A apparatus (Santa Clara, CA, USA). Higher frequency measurements were performed in an ultra- broad frequency range from 1 Hz to 10 GHz, and temperatures up to 800 K [38]. Two methods were combined, namely: a conventional two-electrode method [39] and a coaxial line method [40]. A sample voltage of 100 mV at a low frequency range and incident wave power of −10 to 0 dBm in the coaxial line was applied. All of the measurements provided up to 16 frequency points per octave, and were carried out in atmospheric air. The temperature stability during the measurements was around 0.4 K, and the speed of change was 2–3 deg/min. The films were measured in in-plane configuration, the samples of 1.5 mm length were prepared, and Pt electrodes were fired at 800 °C.
For the mechano-elastic characterization of the prepared samples at room temperature, samples with dimensions 6 × 2.5 mm2 were prepared from the large thick film samples, and were mounted in a triple point bending sample holder coupled to a dynamic mechanical analyzer DMA 7 (Perkin Elmer, Norwalk, CT, USA). The measurement conditions were as follows: static stress 6 × 10⁶ Pa, dynamic stress 5 × 10⁶ Pa, strain 0.01%, and frequency 10 Hz.

5. Conclusions

Large area, 5.5 × 5.5 cm2, high purity thick film membranes of a Li1.3Al0.3Ti1.7(PO4)3 Li-NASICON solid electrolyte has been prepared at 900 °C by tape casting slurries formed with powders obtained from the sol–gel method. The larger the sintering time used to prepare the thick-film membranes, the larger the grain size in the sample. The increased grain size increases the “bulk” Li conductivity, reaching values larger than 10−3 Ω−1·cm−1, but this is detrimental for the total Li conductivity, and reduced the mechanical strength of the membrane. This reduction in functional properties is related to the formation of poor grain boundaries, which worsen on increasing the grain size. In order to increase the total Li conductivity and the mechanical strength, a reduction of the grain size, procurement of enhanced grain boundaries, and lower porosity are mandatory. To obtain this goal, a possible strategy to be studied is the use of additives to reduce grain size, and sintering aids in the slurry’s formulation.

Author Contributions

Conceptualization, K.Z.F., R.J., and E.K.; methodology, J.S., M.L.C., E.K., and K.Z.F.; formal analysis, I.S., A.K., S.Y.T., and A.A.d.C.; investigation, S.M.-C., M.R.L., and A.K.; resources, S.Y.T. and S.M.-C.; writing (original draft preparation), R.J.; writing (review and editing), all of the authors.

Funding

This research was funded by the Spanish Ministry of Science, Innovation, and Universities, PCIN-2017-110, in the frame of the M-Era-net 2016 program, by a grant (S-M-ERA.NET-17-1) from the Research Council of Lithuania, and by the project MOST 106-2923-M-006-002-MY3. Project MAT2016-78362-C4-2R is also acknowledged.

Acknowledgments

Our acknowledged to J. F. Bartolomé from the ICMM (CSIC, Madrid) for his helpful support in the microstructure study.

Conflicts of Interest

The authors declare no conflict of interest.

References

  1. Tarascon, J.M.; Armand, M. Issues and challenges facing rechargeable lithium batteries. Nature 2001, 414, 359–367. [Google Scholar] [CrossRef] [PubMed]
  2. Brent, C.M.; Tarascon, J.M. Design and preparation of materials for advanced electrochemical storage. Acc. Chem. Res. 2013, 46, 1226–1238. [Google Scholar] [CrossRef]
  3. Bruce, P.G.; Freunberger, S.A.; Hardwick, L.J.; Tarascon, J.M. Li–O2 and Li–S batteries with high energy storage. Nat. Mater. 2012, 11, 19–29. [Google Scholar] [CrossRef] [PubMed]
  4. Cho, K.I.; Lee, S.H.; Cho, K.H.; Shin, D.W.; Sun, Y.K. Li2O–B2O3–P2O5 solid electrolyte for thin film batteries. J. Power Sources 2006, 163, 223–228. [Google Scholar] [CrossRef]
  5. Money, B.K.; Hariharan, K. Relation between structural and conductivity relaxation in PEO and PEO based electrolytes. Solid State Ionics 2008, 179, 1273–1277. [Google Scholar] [CrossRef]
  6. Takada, K.; Inada, T.; Kajiyama, A.; Sasaki, H.; Kondo, S.; Watanabe, M.; Murayama, M.; Kanno, R. Solid-state lithium battery with graphite anode. Solid State Ionics 2003, 158, 269–274. [Google Scholar] [CrossRef]
  7. Kotobuki, M.; Isshiki, Y.; Munakata, H.; Kanamura, K. All-solid-state lithium battery with a three-dimensionally ordered Li1.5Al0.5Ti1.5(PO4)3 electrode. Electrochim. Acta 2010, 55, 68–92. [Google Scholar] [CrossRef]
  8. Notten, P.H.L.; Roozeboom, F.; Niessen, R.A.H.; Baggetto, L. 3-D Integrated all-solid-state rechargeable batteries. Adv. Mater. 2007, 19, 4564–4567. [Google Scholar] [CrossRef]
  9. Zheng, G.; Lee, S.W.; Liang, Z.; Lee, H.W.; Yan, K.; Yao, H.; Wang, H.; Li, W.; Chu, S.; Cui, Y. Interconnected hollow carbon nanospheres for stable lithium metal anodes. Nat. Nanotechnol. 2014, 9, 618–623. [Google Scholar] [CrossRef]
  10. Sun, Y. Lithium ion conducting membranes for lithium-air batteries. Nanomater. Energy 2013, 2, 801–816. [Google Scholar] [CrossRef]
  11. Usiskin, R.E.; Maier, J. Guidelines for optimizing the architecture of battery insertion electrodes based on the concept of wiring lengths. Phys. Chem. Chem. Phys. 2018, 20, 16449–16462. [Google Scholar] [CrossRef] [PubMed] [Green Version]
  12. Shiraki, S.; Oki, H.; Takagi, Y.; Suzuki, T.; Kumatani, A.; Shimizu, R.; Haruta, M.; Ohsawa, T.; Sato, Y.; Ikuhara, Y.; et al. Fabrication of all-solid-state battery using epitaxial LiCoO2 thin films. J. Power Sources 2014, 267, 881–887. [Google Scholar] [CrossRef]
  13. Haruta, M.; Shiraki, S.; Suzuki, T.; Kumatani, A.; Ohsawa, T.; Takagi, Y.; Shimizu, R.; Hitosugi, T. Negligible “Negative Space-Charge effects” at oxide-electrolyte/electrode interfaces of thin-film Batteries. Nano Lett. 2015, 15, 1498–1502. [Google Scholar] [CrossRef] [PubMed]
  14. Choi, Z.; Kramer, D.; Mönig, R. Correlation of stress and structural evolution in Li4Ti5O12-based electrodes for lithium ion batteries. J. Power Sources 2013, 240, 245–251. [Google Scholar] [CrossRef]
  15. Arbi, K.; Mandal, S.; Rojo, J.M.; Sanz, J. Dependence of ionic conductivity of composition of fast ionic conductors Li1+xTi2−xAlx(PO4)3, 0 ≤ x ≤ 0.7. A parallel NMR and electric impedance study. Chem. Mater. 2002, 14, 1091–1097. [Google Scholar] [CrossRef]
  16. Aono, H.; Sugimoto, E.; Sadaoka, Y.; Imanaka, N.; Adachi, G.Y. The electrical properties of ceramic electrolytes for Li1+xMxTi2−x(PO4)3 + yLi2O, M = Ge, Sn, Hf and Zr systems. J. Electrochem. Soc. 1993, 140, 1827–1833. [Google Scholar] [CrossRef]
  17. Adachi, G.; Imanaka, N.; Aono, H. Fast Li+ conducting ceramic electrolytes. Adv. Mater. 1996, 8, 127–135. [Google Scholar] [CrossRef]
  18. Fu, J. Superionic conductivity of glass-ceramics in the system Li2O–Al2O3–TiO2–P2O5. Solid State Ionics 1997, 96, 195–200. [Google Scholar] [CrossRef]
  19. Arbi, K.; Rojo, J.M.; Sanz, J. Lithium mobility in titanium based Nasicon Li1+xTi2−xAlx(PO4)3 and LiTi2−x Zrx(PO4)3 materials followed by NMR and impedance spectroscopy. J. Eur. Ceram. Soc. 2007, 27, 4215–4218. [Google Scholar] [CrossRef]
  20. Jurków, D.; Roguszczak, H.; Golonka, L. Cold chemical lamination of ceramic green tapes. J. Eur. Ceram. Soc. 2009, 29, 703–709. [Google Scholar] [CrossRef]
  21. Park, H.G.; Moon, H.; Park, S.C.; Lee, J.J.; Yoon, D.; Hyun, S.H.; Kim, D.H. Performance improvement of anode-supported electrolytes for planar solid oxide fuel cells via a tape-casting/lamination/co-firing technique. J. Power Sources 2010, 195, 2463–2469. [Google Scholar] [CrossRef]
  22. Jurków, D.; Golonka, L. Low-pressure thermo compressive lamination. J. Eur. Ceram. Soc. 2012, 32, 2431–2441. [Google Scholar] [CrossRef]
  23. Jimenez, R.; del Campo, A.; Calzada ML Sanz, J.; Kobylianska, S.D.; Solopan, S.O.; Belous, A.G. Lithium La0.57Li0.33TiO3 perovskite and Li1.3Al0.3Ti1.7(PO4)3 Li-NASICON supported thick films electrolytes prepared by tape casting method. J. Electrochem. Soc. 2016, 163, A1653–A1659. [Google Scholar] [CrossRef]
  24. Jimenez, R.; del Campo, A.; Calzada, M.L.; Sanz, J.; Kobylianska, S.D.; Liniova, B.O.; Belous, A.G.; Ragulya, A.V. Improved conductivity in tape casted Li-NASICON supported thick films: Effect of temperature treatments and lamination. J. Eur. Ceram. Soc. 2018, 38, 1679–1687. [Google Scholar] [CrossRef]
  25. Fu, Y.; Ming, H.; Zhao, S.; Guo, J.; Chen, M.; Zhou, Q.; Zheng, J. A new insight into the LiTiOPO4 as anode material for Li ion bateries. Electrochim. Acta 2015, 185, 211–217. [Google Scholar] [CrossRef]
  26. Arbi, K.; Bucheli, W.; Jiménez, R.; Sanz, J. High lithium ion conducting solid electrolytes based on NASICON Li1+xAlxM2−x(PO4)3 materials (M = Ti, Ge and 0 ≤ x ≤ 0.5). J. Eur. Ceram. Soc. 2015, 35, 1477–1484. [Google Scholar] [CrossRef]
  27. Boccaccini, A.R.; Fan, Z. A new approach for the Young’s Modulus-Porosity Correlation of Ceramic materials. Ceram. Int. 1997, 12, 239–245. [Google Scholar] [CrossRef]
  28. Davidge, R.W. Cracking at grain Boundaries in polycystalline brittle materials. Acta Metall. 1981, 29, 1695–1702. [Google Scholar] [CrossRef]
  29. Case, E.D.; Smyth, J.R.; Hunter, O. Grain—Size dependence of microcrack initiation in brittle materials. J. Mater. Sci. 1980, 15, 149–153. [Google Scholar] [CrossRef]
  30. Bucharsky, E.C.; Schell, K.G.; Hintennach, A.; Hoffmann, M.J. Preparation and characterization of sol-gel derived high Lithium ion conductive NZP—Type ceramics Li1−xAlxTi2−x(PO4)3. Solid State Ionics 2015, 274, 77–82. [Google Scholar] [CrossRef]
  31. Nakajima, K.; Katoh, T.; Inda, Y.; Hoffman, B. Lithium Ion Conductive Glass Ceramics: Properties and Application in Lithium Metal Batteries. In Proceedings of the Symposium on Energy Storage Beyond Lithium Ion, Oak Ridge, TN, USA, 7–8 October 2010. [Google Scholar]
  32. Jackman, S.D.; Cutler, R.A. Effect of microcracking on ionic conductivity in LATP. J. Power Sources 2012, 218, 65–72. [Google Scholar] [CrossRef]
  33. Hupfer, T.; Bucharsky, E.C.; Schell, K.G.; Hoffmann, M.J. Influence of the secondary phase LiTiOPO4 on the properties of Li1−xAlxTi2−x(PO4)3 (x = 0; 0.3). Solid State Ionics 2017, 302, 49–53. [Google Scholar] [CrossRef]
  34. Arbi, K.; Hoelzel, M.; Kuhn, A.; Garcia-Alvarado, F.; Sanz, J. Structural Factors That Enhance Lithium Mobility in Fast-Ion Li1+xTi2−xAlx(PO4) (0 ≤ x ≤ 0.4) Conductors Investigated by Neutron Diffraction in the Temperature Range 100–500 K. Inorg. Chem. 2013, 52, 9290–9296. [Google Scholar] [CrossRef] [PubMed]
  35. Rettenwander, D.; Welzl, A.; Pristat, S.; Tietz, F.; Taibl, S.; Redhammer, G.J.; Fleig, J. A microcontact impedance study on NASICON-type Li1+xAlxTi2−x(PO4)3 (0 ≤ x ≤ 0.5) single crystals. J. Mater. Chem. A 2016, 4, 1506–1513. [Google Scholar] [CrossRef]
  36. Robertson, A.; Fletcher, J.G.; Skakle, J.M.S.; West, A.R. Synthesis of LiTiPO5 and LiTiAsO5 with the α-Fe2PO5 Structure. J. Solid State Chem. 1994, 109, 53–59. [Google Scholar] [CrossRef]
  37. Taher, Y.B.; Oueslati, A.; Khirouni, K.; Gargouri, M. Impedance Spectroscopy and conduction mechanism of LiAlP2O7 material. Mater. Res. Bull. 2016, 78, 148–157. [Google Scholar] [CrossRef]
  38. Kežionis, A.; Kazlauskas, S.; Petrulionis, D.; Orliukas, A.F. Broadband Method for the Determination of Small Sample’s Electrical and Dielectric Properties at High Temperatures. IEEE Trans. Microw. Theory Tech. 2014, 62, 2456–2461. [Google Scholar] [CrossRef]
  39. Kežionis, A.; Butvilas, P.; Šalkus, T.; Kazlauskas, S.; Petrulionis, D.; Žukauskas, T.; Kazakevičius, E.; Orliukas, A.F. Four-electrode impedance spectrometer for investigation of solid ion conductors. Rev. Sci. Instrum. 2013, 84, 013902. [Google Scholar] [CrossRef]
  40. Kežionis, A.; Kazakevičius, E.; Šalkus, T.; Orliukas, A.F. Broadband high frequency impedance spectrometer with working temperatures up to 1200 K. Solid State Ionics 2011, 188, 110–113. [Google Scholar] [CrossRef]
Figure 1. XRD diagrams of the prepared Li1.3Al0.3Ti1.7(PO4)3 self-supported thick films. The XRD diagram of the OHARA Li-NASICON glass-ceramic (OHGC) is included for comparison. The insets show the presence of a small quantity of LiTiPO5 (04-011-7990) in the self-supported thick films. In the bottom, the indexed diffraction lines for the LiTi2(PO4)3 (01-072-6140) are included.
Inorganics 07 00107 g001
Figure 2. Photographs of the prepared self-supported thick films. (a) LATPT1 and (b) LATPT2 samples aspect. The size of the prepared thick films is 5.5 × 5.5 cm2, with an average thickness of 255 µm.
Inorganics 07 00107 g002
Figure 3. Micrographs of the prepared self-supported thick films. (a,c,e) are the as prepared surface, fresh fracture, and transversal image of the LATPT1 sample, respectively. (b,d,f) are the as prepared surface, fresh fracture, and transversal image of the LATPT2 sample, respectively.
Inorganics 07 00107 g003
Figure 4. Confocal Raman spectroscopy characterization of the LATPT1 thick film, namely: (a) the different Raman spectra of the phases found in the thick film surface. The phase assignment is depicted in the plot. (b) Optical micro-graphs of the surface, indicating the sample region where the Raman sweep was performed. (c) Color map made with the different Raman signals found in the particles that are present in the thick film of the same sample area. Z/X and Z/Y sweeps are also included to show the in-thickness distribution of the main phases.
Inorganics 07 00107 g004
Figure 5. (a) 31P MAS-NMR central components of commercial OHGC, LATPT1, and LATPT2 thick films samples. (b) Deconvolution (DMFIT program) of a complex and bad resolved pattern of x = 0.3 composition, by fitting the experimental data with a model profile shape function. The refined profiles are used for the determination of positions, widths, and areas. An NMR peak is an envelope of a distribution of the Lorentzians/Gaussians components. Intensity bands associated with possible environments of phosphorous in the Li1+xTi2−xAlx(PO4)3 samples. Referred to 85% H3PO4 aqueous solution (δ = 0 ppm), resonant frequency 161.97 MHz.
Inorganics 07 00107 g005
Figure 6. 27Al MAS-NMR spectra of the commercial OHGC, LATPT1, and LATPT2 thick film samples. The bands detected at approximately −14 and 40 ppm correspond to the octahedral and tetrahedral aluminum, respectively. Referred to 1M AlCl3 aqueous solution (δ = 0 ppm), resonant frequency 104.26 MHz.
Inorganics 07 00107 g006
Figure 7. 7Li MAS-NMR spectra of commercial OHGC, LATPT1, and LATPT2 thick films samples. The central components are represented in the insert. Referred to 1 M LiCl aqueous solution (δ = 0 ppm), resonant frequency 155.45 MHz.
Inorganics 07 00107 g007
Figure 8. (a) Nyquist plots of the electrical impedance response of the samples of this work at 295 K. LATPT1 (red line), LATPT2 (black line), OHGC (blue line). (b) Arrhenius plot of the samples “bulk” direct current (DC) conductivity and total (“bulk” plus grain boundary contributions) DC conductivity. The meaning of the symbols is depicted in the plot legend. (U.B.B.) stands for ultra-broad-band.
Inorganics 07 00107 g008
Table 1. Results of the triple point bending mechano-elastic characterization at 10 Hz RT. OHGC—OHARA Li-NASICON glass-ceramic; LATP—Li-NASICON Li1.3Al0.3Ti1.7(PO4)3.
Sample Y’ (GPa) tanδ
OHGC 48 ± 9.6 0.04
LATPT1 13 ± 2.6 0.3
LATPT2 7.5 ± 1.5 0.4
Table 2. Comparative direct current (DC) conductivity results from the Arrhenius analysis of the different samples. Range of temperature (105–375 K), frequency range (20 Hz–2 MHz).
Sampleσbulk195 K−1·cm−1)σtotal.300 K−1·cm−1)Ea bulk (eV)Ea total (eV)
OHGC2.0 × 10−53.4 × 10−40.290.31
LATPT11.0 × 10−59.5 × 10−50.240.33
LATPT23.4 × 10−53.8 × 10−50.270.35

