Abstract
X-ray absorption near-edge structure (XANES) spectra are employed to characterise the coordination numbers of metallic elements within materials. However, conventional XANES analysis methods frequently rely on preconceived assumptions regarding the analysed samples, which may not fully satisfy the requirements of scientific research and industrial applications. To mitigate such reliance, a novel approach based on the Gated Adaptive Network for Deep Automated Learning of Features (GANDALF) is proposed. To effectively extract multi-scale information from the XANES spectrum, the spectrum was segmented into multiple scales. Each segment was fitted using a pseudo-Voigt function, with the absorption edge position. The GANDALF algorithm, a table-based deep learning approach, was employed to model the coordination environment of absorbing elements. The proposed method was validated using a previously published open-access dataset. For vanadium-containing samples, the model achieved R2 values of 0.7837 on test sets with non-integer coordination numbers, whereas the random forest model only achieved 0.6328. Furthermore, our results highlight the significant importance of the post-edge peak when predicting coordination numbers using the full spectrum.
1. Automated Analysis of X-Ray Absorption Fine Structure (XAFS)
Structure–activity relationships have long been a research focus in the material sciences, such as chemistry and materials science, forming the theoretical foundation for new material design, particularly in catalysts. Consequently, structural characterisation has become a crucial component of scientific exploration. In the early 1920s, Hertz and Fricke pioneered the discovery of oscillations in the X-ray absorption coefficient occurring before and after the absorption edge of specific atoms in condensed matter. They called this oscillation the X-ray absorption fine structure (XAFS) [1,2], which serves as a potent tool for analysing the local structure of materials and is composed of extended X-ray absorption fine structure (EXAFS) and X-ray absorption near-edge structure spectra (XANES). Near-edge X-ray absorption fine structure (XANES) contains rich information about the coordination environment. However, traditional analytical methods (such as linear combination fitting) rely on known standard spectra, limiting their application to unknown systems [3]. From LSTM to GRU, the gating mechanism has been widely used in deep learning. The GANDALF algorithm is a tabular deep learning algorithm based on a gating mechanism, which is crafted with feature selection and feature engineering. It demonstrates significant advantages over conventional deep learning methods like convolutional neural networks (CNNs) and recurrent neural networks (RNNs) in handling interactions among non-adjacent features, which arise due to the various distances between peaks in the XANES input, thereby offering superior performance on diverse XANES spectra. This study proposes a coordination number prediction method integrating multi-scale feature engineering with the GANDALF algorithm, offering novel insights for structural characterisation of complex material systems. Section 1 reviews prior research, Section 2 outlines the proposed methodology for determining transition metal coordination numbers from XANES spectra, Section 3 presents the results on public theoretical datasets, and Section 4 concludes with future directions.
1.1. Preliminary Research
Research into automated XAFS analysis has primarily relied on theoretical data derived from computational simulations. Currently, experimental studies determining the coordination number of the absorbing element from XANES spectra still depend on prior knowledge of reference XANES spectra for the relevant system.
Therefore, directly matching reference spectra with pre-computed spectra of test samples represents an intuitive approach. For instance, Chen Zheng et al. first employed FEFF v9 software to accumulate extensive spectral data in a database via quantum mechanical ab initio calculations. Subsequently, their proposed ensemble learning method—the ensemble spectral matching (ELSIE) algorithm—successfully matched test sample XANES data with database entries, thereby analysing the composition and structure of the test samples [4]. The reliability of such matching algorithms hinges on computational precision, an aspect that has received scant attention in recent XAFS research.
1.2. Machine Learning Research on Small Datasets
Comparing test sample spectra with reference spectra across a broad range, researchers have often focused more on analysing a specific system. Consequently, training a data-driven model and directly using it to derive results has become a more common approach. Dimensionality reduction has become a necessary step due to the high dimensionality of spectral data and the scarcity of data suitable for training sets, and principal component analysis (PCA) is frequently employed in this case. For instance, Oleg A. Usoltsev et al. calculated theoretical XANES spectra using FDMNES and subsequently reduced their dimensionality via PCA. They then employed the multivariate curve resolution (MCR) algorithm to fit the resulting principal components to specific structural parameters of designated metallic crystals [5]. Similarly, A. Martini et al. applied PCA to reduce the dimensionality of theoretically calculated small-molecule XANES spectral data, followed by radial basis function (RBF) fitting to obtain conformational data [6]. Beyond this, dimensionality reduction may also be achieved through artificially specified indicators. For instance, Itsuki Miyazato et al. proposed descriptors targeting the atomic number of the element and the energy shift difference Δμ(E)x. Δμ(E)x is defined by Equation (1):
where Ex represents the minimum photon energy corresponding to an absorption rate of x within the XANES spectrum, and E0 denotes the maximum photon energy at an absorption rate of 0. Machine learning models such as support vector machines, trained using the aforementioned descriptors as input, successfully achieve identification of the target element’s valence state [7]. Shuting Xiang et al. demonstrated CO2 participation in the reaction pathway by performing linear combination fitting (LCF) on XANES spectra collected for N2 and CO2, followed by determination of mixing fractions [8].
In recent years, with increasing computational capabilities, deep learning methods have gained prominence in data-driven analysis algorithms for synchrotron radiation X-ray absorption fine structure (XAFS) data. This is due to their superior ability to extract underlying information from data compared to traditional multivariate statistical learning models. For instance, Janis Timoshenko et al. employed artificial neural networks (ANNs) trained on theoretically calculated data to analyse the coordination numbers and shapes of metallic nanoparticles, correlating them with the particle size and interatomic distances of actual metallic crystal clusters [9,10,11]. Meanwhile, Shuting Xiang et al. employed a neural network trained on theoretically calculated spectral data to predict the post-reaction structure of single-atom cobalt catalysts after carbon dioxide reduction reactions [8]. Zhengran Ji et al. opted to augment small samples into large ones via linear combinations, thereby training a convolutional neural network (CNN) to predict manganese oxidation states [12].
1.3. Machine Learning Research on Large Datasets
While small datasets focus on specific systems in which only specific structure parameters changed, large datasets contain various samples in which only the absorption elements and wave ranges are the same, so the built model can analyse XAFS without prior knowledge. Research on large datasets typically involves computational analysis of structural information from public crystal databases or direct utilisation of publicly available spectral and characteristic data. Decision tree methods are commonly employed. This approach originated with Steven B. Torrisi et al., who extracted XANES spectral features via polynomial fitting, subsequently using random forests for coordination number classification and regression prediction for Bader charges and mean nearest neighbour distances [13]. Subsequently, recognising that practical samples are predominantly mixtures, Samuel P. Gleason et al. employed linear combinations of XANES spectra to simulate mixtures, successfully predicting the average oxidation state of copper in copper-containing crystal mixtures using random forests [14]. Tanaporn Na Narong et al. combined XANES with the pair distribution function (PDF) for both oxidation state and coordination number classification, alongside regression for average nearest neighbour bond length. They further interpreted the random forest model using feature importance analysis [15].
Although these studies demonstrate innovation in data sourcing, existing algorithms still show room for improvement in generalisation capability, struggling to meet the demands of academic frontiers. This research proposes a coordination number prediction method based on the GANDALF (Gated Adaptive Network for Learning Features) algorithm. It exhibits strong generalisation properties and implements gradient descent, making it suitable for large-scale sample training and prediction.
2. Results
This study employs the root-mean-square error (RMSE), coefficient of determination (R2), and adjusted coefficient of determination (R2) as evaluation metrics:
where yi denotes the actual value for the i-th sample;
denotes the model-predicted value for the i-th sample; m denotes the number of samples;
denotes the arithmetic mean of the actual values; and p denotes the number of features, which, in this method, corresponds to the input length of the GANDALF model.
For samples without linear combinations, a common approach of directly inputting XANES spectral vectors from the E-space into a random forest to fit coordination numbers was employed as the random forest control group. Given the scarcity of neural network studies analysing structural information in large-sample XANES spectra, the neural network control group was established by reference to relevant research utilising X-ray absorption spectroscopy for detecting prohibited substances. A 1D U-Net convolutional neural network and a bidirectional long short-term memory (LSTM) neural network were established as neural network control groups [16]. Test results on the uncombined test set are presented in the table below.
When the absorbed element was Mn, all four models exhibited the poorest predictive performance, with R2 values below 0.6. Steven B. Torrisi et al. also achieved only 80% classification accuracy for Mn, markedly lower than for other absorbed elements. Similarly, when the absorbing element was Ni or Cu, R2 values were below 0.7. Within the entire dataset, Ni exhibited a marked predominance of 6-coordinate samples over 4- and 5-coordinate samples; Cu showed a clear preponderance of 5-coordinate samples over 4- and 6-coordinate samples; and Mn displayed a distinct scarcity of 4-coordinate samples compared to 5- and 6-coordinate samples. As the training set was randomly selected, this imbalance was also introduced into the training data. When the absorbing element was V, all four models achieved optimal predictive performance, with R2 values exceeding 0.73. The V dataset was also the only one in the entire dataset where the number of samples for each coordination number was no fewer than 1000, exhibiting the best sample balance. Steven B. Torrisi et al. proposed in their research that improving sample balance within datasets is necessary to enhance accuracy [13]. This imbalance is difficult to address because reusing some samples in training models can introduce bias, while under-sampling can cause over-fitting. Both would reduce the performance. The marked variation in model performance across different absorbing elements stems from differing sample balance within the dataset. For the test set derived from linear combinations of XANES spectra, the test results are as follows.
Comparing the results in Table 1 and Table 2, both the pseudo-Voigt-GANDALF method (Supplementary Data) and the random forest method exhibit a decrease in R2 on the linear combination test set relative to the original test set, though the pseudo-Voigt-GANDALF method showed a smaller decline. In Table 2, for each absorbing element, the adjusted R2 of the pseudo-Voigt-GANDALF method is greater than that of the random forest method. This indicates that the pure sample training set cannot fully reflect the relationship between the XANES spectrum of the mixture and the average coordination number of the absorbing elements. In Table 1, the adjusted R2 values for the pseudo-Voigt-GANDALF method are lower than those for the random forest method across all absorbing elements. This should be attributed to the random forest method being trained solely on the original training set containing only integer coordination numbers, hence exhibiting stronger performance on the original test set with integer coordination numbers.

Table 1.
Results on the original test set.
Table 2.
Results on the linear combination test set.
The random forest method, with each tree trained independently, is difficult to parallelise and faces computational efficiency challenges during large-sample training. Reducing the sample size weakens the sample diversity balance, lowering prediction accuracy. By contrast, deep learning methods employ gradient descent training with high parallelism, can utilise GPU acceleration, and can effectively learn the relationship between XANES spectral features and coordination numbers from large sample data. Table 2 demonstrates that, across three metrics, the proposed pseudo-Voigt-GANDALF method outperforms U-Net (representing convolutional neural networks), while U-Net itself outperforms LSTM (representing recurrent neural networks). LSTM’s higher RMSE and lower R2 indicate limitations in multi-scale feature extraction. Although the U-Net can extract multi-scale features, its extraction method lacks guidance from mechanistic knowledge, resulting in relatively constrained performance in the current system.
Synthesising the results from Table 1 and Table 2, the pseudo-Voigt-GANDALF method achieves optimal performance when the absorbing elements are Ti, Co, Ni, and Cu. When the absorbing elements are V, Cr, Mn, and Fe, the model’s performance is only inferior to the random forest model on the original test set. Given computational efficiency challenges for random forest methods in large-scale training, the pseudo-Voigt-GANDALF approach represents the state of the art in this domain. It satisfies preliminary practical application requirements for the best-performing predicted elements, V and Cr.
Furthermore, taking the best-performing absorption elements, V and Cr, as examples, feature importance analysis was conducted on the GANDALF model, predicting their coordination numbers. The feature importance of each input variable in the GANDALF model is as follows:
where I denotes the feature importance of each input variable, N represents the number of GFLU layers, and Mn is the feature mask for the nth layer. The feature importance obtained from the above equation is normalised as follows:
where Ii and Iinorm denote the feature importance and its normalised value for the i-th input variable, respectively, and D is the number of input variables [17]. The feature importance analysis results of the GANDALF model predicting the coordination numbers of the absorption elements V and Cr are shown in Figure 1:
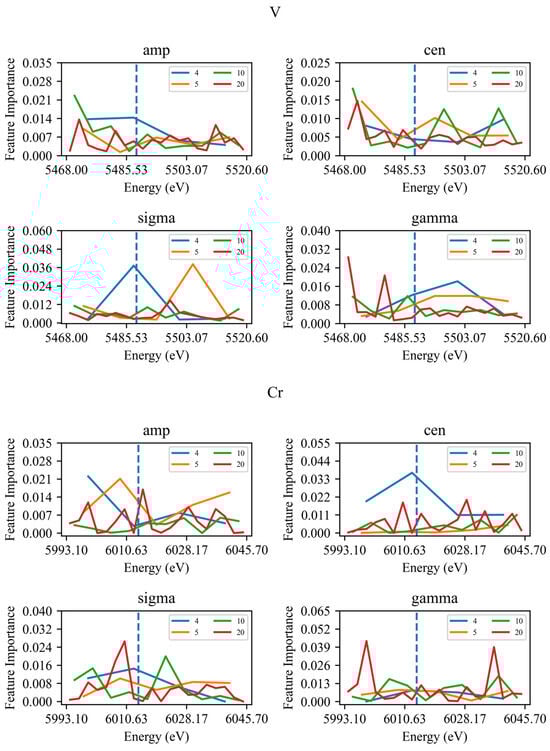
Figure 1.
Feature importance of V and Cr. The dashed line is at the average adsorption edge position of each test set.
When the absorbing element is V, the peak height and peak position in the pre-edge region are strong predictive indicators, with normalised feature importance sums of 0.0788 and 0.0816, respectively. However, the standard deviation of the Gaussian linear function in the post-edge region exhibits a sum of 0.0884 when the spectrum is divided into four and five equal parts, while the sum for the Lorentzian line half-width in the post-edge region is 0.0733 when the spectrum is divided into four and five equal parts, which is close to the sum for peak height and peak position in the pre-edge region across the four scales. When the absorbing element is Cr, for the three features—peak height, Gaussian linear function standard deviation, and Lorentzian linear function half-width—the maximum importance value across all scales, except for peak height in the four-division spectrum, which occurs in the edge-of-band region. This aligns with the conclusion proposed by Tanaporn Na Narong et al. regarding the prediction of coordination numbers, which states that the edge-of-band region possesses non-negligible importance relative to the edge-of-band peak [15]. Surrounding the absorbing atom, ligands both form potential barriers, creating inner trap states, and interfere with outward-extending atomic orbitals to form outer trap states. The probability of 1s orbital electrons transitioning to inner trap states far exceeds that to outer trap states, yielding broad edge-of-band peaks [18]. This enables the edge-of-band region to effectively reflect a material’s coordination number information.
3. Coordinate Analysis Method Based on the GANDALF Algorithm
The method described herein comprises two steps. The first involves segmenting XANES spectra within specified frequency ranges across multiple scales, applying a pseudo-Voigt function fit to each segment, and incorporating absorption edge positions (the energy at the maximum slope point in E-space) to form spectral features. The second step employs the GANDALF algorithm for fitting.
3.1. Pseudo-Voigt Function
This study employs a method of segmenting XANES spectra in E-space for fitting to extract multi-scale features. The Voigt function, as a convolution of Gaussian and Lorentzian functions, is commonly used in spectroscopy to describe peaks. Its formula is as follows:
where
,
,
, and V(v,v0) is referred to as the Voigt linear function. v0 and αL denote the centre frequency and half-width of the Lorentzian line function, respectively, while v0 and αD denote those of the Gaussian line function, respectively [19]. Fitting spectra using this formula is computationally complex and difficult to accelerate using GPUs. Therefore, an approximate pseudo-Voigt function is employed as a substitute since the shape of XANES peaks usually is not pure Gaussian or Lorentzian.
First, the full-width at half-maximum (FWHM) Γ of the pseudo-Voigt function is defined:
where σ denotes the standard deviation of the Gaussian linear function [20]. Let the Gaussian and Lorentzian components share the same centre frequency v0, with their full-width at half-maximum (FWHM) equalling the FWHM Γ of the pseudo-Voigt linear function. For computational convenience, the Lorentzian function is simplified as
The Gaussian linear function is then simplified to
Further, the pseudo-Voigt function yields
where h denotes the peak height. η is a parameter, estimated in this study using the following equation [21]:
Taking h = 1, v0 = 0, αL = 1, and σ = 1, the shape of the pseudo-Voigt function is shown in Figure 2:
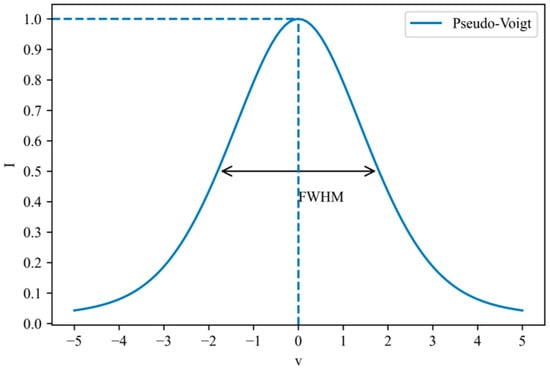
Figure 2.
Example of the shape of the pseudo-Voigt function.
3.2. GANDALF Algorithm
GANDALF is a novel tabular deep learning algorithm comprising two principal stages: the GFLU component and the output head. The former learns optimal representations of input features through feature selection and feature interaction. These representations are the conclusions of which feature in which wave range is important and how they interact. The latter stage generates the final prediction.
The GFLU component comprises multiple serial GFLU units, with each layer learning a feature subset and a feature representation. The results from each layer are combined to form the optimal representation H. A single GFLU neuron is illustrated in Figure 3:
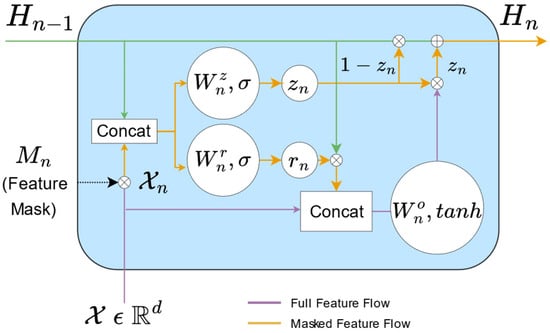
Figure 3.
Detailed view of GFLU.
The feature mask Mn is obtained via the t-softmax algorithm:
where
represents the learnable parameter vector; fi and fj denote elements of Fn; wi and wj are the respective weight coefficients for fi and fj; and t is the temperature coefficient. The internal mathematical definition within GFLU is as follows:
where χ and χn denote the original and masked features, respectively; Hn−1 and Hn denote the feature representations of the previous and current layers, respectively;
denotes element-wise multiplication; zn and rn are intermediate variables;
denotes the concatenation operation of Hn−1 and χn; Sig denotes the sigmoid activation function; and Wnz, WnO, and Wnr are learnable parameters [17].
3.3. Testing Method
Steven B. Torrisi et al.’s computational results for certain transition metal elements acting as absorption elements were selected as the data source. Each absorption element contains thousands of spectra and the structure and valence parameters of the corresponding materials. Structural data was drawn from the Open Quantum Materials Database (OQMD) and Materials Project (MP) databases, while spectral data originated from FEFF9 calculations or spectra recorded in the MP database [13]. For each absorption element, the corresponding FEFF-normalised XANES spectral data with coordination numbers greater than or equal to 4 and less than or equal to 6 were extracted from the data sources, along with their corresponding coordination numbers. These data were chosen because the sample size with other coordination numbers would be too small, so machine learning models cannot learn to predict the coordination number out of the range. For each group of data with different absorption elements, the data were divided into training, validation, and test sets in a 3:1:1 ratio. The specific testing method is illustrated in Figure 4.
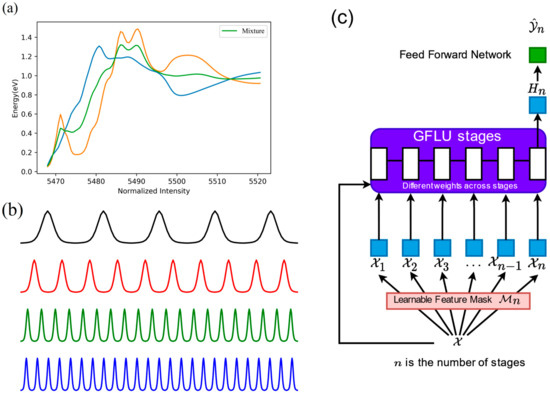
Figure 4.
Flowchart of training data and model construction. (a) The datasets are augmented by creating mixture spectra through linear combinations. The yellow line and the blue line represent 2 different XANES spectra of 2 different materials. (b) The spectral vectors are divided into 4, 5, 10, and 20 equal segments (black, red, green, and blue), and each segment is fitted using a pseudo-Voigt function that yields four features (amp, cen, sigma, and gamma). (c) Descriptor vectors of length (4 + 5 + 10 + 20) × 4 + 1 = 157, which are made of pseudo-Voigt function features and absorption edge position, are used to train and validate the GANDALF model.
To address the issue of average coordination number in mixtures, the selected XANES data were linearly superimposed to construct binary mixture datasets. During combination, mixture ratio coefficients were randomly generated such that their sum equalled one. Each training, validation, and test set was linearly combined only internally to validate model generalisation. The pseudo-Voigt-GANDALF models were trained by the P1000 GPU on KAGGLE for reproducibility. For larger combined datasets, only the top 2.2 million linear combinations were retained based on cosine similarity to the XANES spectral vectors of computationally derived pure samples so that the models could be trained on a single GPU. The labelled coordination numbers were then proportionally weighted and averaged. For instance, if substance A with coordination number A for the absorbing element accounted for proportion a, and substance B with coordination number B for the same absorbing element accounted for proportion 1-a, then the average coordination number of the absorbing element in the mixed sample resulting from the linearly combined XANES spectra of A and B would be
where C denotes the average coordination number for both substances.
As the XANES spectral data employed consisted of absorption rates at 100 equidistant points of 0.53 eV within the E-space of a specified band, reference was made to Steven B. Torrisi et al. for feature extraction via polynomial fitting, and the spectral vectors were divided into 4, 5, 10, and 20 equal segments. Each segment was fitted using a pseudo-Voigt function, yielding four features: peak height (amp), peak position (cen), Gaussian standard deviation (sigma), and Lorentzian half-width (gamma). These features and the absorption edge position yielded a descriptor vector of length (4 + 5 + 10 + 20) × 4 + 1 = 157. This vector was input into the GANDALF model. The PyTorch Tabular API 1.1.1 version was used to build the GANDALF models [22]. Some early tests on the sets in which the absorbing element was Fe showed that when the GFLU layer count was set to 4, 5, and 6, the prediction performance was the best. Models were then trained on the training sets, and these hyperparameters were chosen by grid searching to obtain the validation set R2. For Ti, V, Mn, and Co as absorbing elements, a six-layer GFLU constitutes the GFLU component within the GANDALF model. For Cr and Cu, a five-layer GFLU is employed, while for Fe and Ni, a four-layer GFLU is used. The GFLU component within the GANDALF model adopts a random dropout rate of 0.2, with a linear layer as the output head.
4. Conclusions and Discussion
In this paper, based on publicly available computational X-ray absorption fine structure (XANES) spectral datasets, we propose a pseudo-Voigt-GANDALF method to predict the coordination number of the absorbing element corresponding to a specified XANES spectrum. The XANES spectrum was first equally divided into multiple segments at multiple scales. Parameters obtained by fitting each segment with a pseudo-Voigt function, along with the position of the absorption edge, formed a descriptor vector. The GANDALF model was then employed to predict the coordination number from this descriptor vector. Mixture samples were simulated via spectral linear combinations, transforming the classification problem of integer coordination numbers for simple systems into a fitting problem within a continuous range. When the absorbing element was V, the test set R2 achieved 0.8085 and 0.7837 without and with linear combination, respectively. For all tested groups, the performance degradation on the linear combination test set was smaller than that of traditional methods. The test results confirmed the effectiveness of this model in predicting the coordination number of mixed systems. However, significant performance discrepancies emerged between different absorbing elements, indicating that future research should prioritise improving the balance of sample types within the dataset. Feature importance plots from the GANDALF model reveal that the edge-of-band region contains crucial information when the absorbing elements are V and Cr. This further demonstrates that predicting coordination numbers from XANES spectra requires the full spectrum encompassing both the pre-edge and post-edge regions, rather than merely the pre-edge segment.
This paper is based on computational datasets, but future work can focus on training and testing with experimental datasets. Although a better model is probably needed due to measurement error, using experimental datasets can be beneficial, as they overcome the limitations of FEFF9 [13]. For future research, focus should be placed on improving model architecture. The results of this article suggest that model complexity is positively correlated with performance on both original test sets and linear combination test sets. This is due to the difference in multi-scale feature extraction. Consequently, simpler models that are better at extracting multi-scale features are expected to show better performance.
Supplementary Materials
The code of the pseudo-Voigt-GANDALF method in this research can be obtained online from the Kaggle repository via https://www.kaggle.com/code/alliedcommander/xanes-gandalf (accessed on 10 August 2025).
Author Contributions
Conceptualization, J.G.; Methodology, J.G.; Software, J.G.; Validation, J.G.; Formal analysis, J.G.; Resources, W.S.; Writing—original draft, J.G.; Writing—review and editing, R.C. and X.W.; Supervision, W.S. and X.W.; Project administration, W.S. and X.W. All authors have read and agreed to the published version of the manuscript.
Funding
This research received no external funding.
Data Availability Statement
The data associated with this research can be obtained online from the Kaggle repository via https://www.kaggle.com/datasets/fb99907ae7086f76b0a27d415d6b97e5b33ab5217f949ae983b743020339ba18 (accessed on 10 August 2025).
Conflicts of Interest
The authors declare no conflicts of interest.
References
- Fricke, H. The K-Characteristic Absorption Frequencies for the Chemical Elements Magnesium to Chromium. Phys. Rev. 1920, 16, 202. [Google Scholar] [CrossRef]
- Hertz, G. OBer Die Absorptions grenzen in Der L-Serie. Z. Phys. 1920, 3, 19–25. [Google Scholar] [CrossRef]
- Wang, Y. XAFS Study of the Fine Structure and Properties of Iridium Oxide Electrodes; University of Science and Technology Beijing: Beijing, China, 2021. [Google Scholar]
- Zheng, C.; Mathew, K.; Chen, C.; Chen, Y.; Tang, H.; Dozier, A.; Kas, J.J.; Vila, F.D.; Rehr, J.J.; Piper, L.F.J.; et al. Automated Generation and Ensemble-Learned Matching of X-ray Absorption Spectra. Npj Comput. Mater. 2018, 9, 12. [Google Scholar] [CrossRef]
- Usoltsev, O.A.; Bugaev, A.L.; Guda, A.A.; Guda, S.A.; Soldatov, A. How Much Structural Information Could Be Extracted from XANES Spectra for Palladium Hydride and Carbide Nanoparticles. J. Phys. Chem. C Nanomater. Interfaces 2022, 126, 4921–4928. [Google Scholar] [CrossRef]
- Martini, A.; Guda, A.A.; Guda, S.A.; Bugaev, A.L.; Safonova, O.V.; Soldatov, A.V. Machine learning powered by principal component descriptors as the key for sorted structural fit of XANES. Phys. Chem. Chem. Phys. 2021, 23, 17873–17887. [Google Scholar] [CrossRef] [PubMed]
- Miyazato, I.; Takahashi, L.; Takahashi, K. Automatic oxidation threshold recognition of XAFS data using supervised machine learning. Mol. Syst. Des. Eng. 2019, 4, 1014–1018. [Google Scholar] [CrossRef]
- Xiang, S.; Huang, P.; Li, J.; Liu, Y.; Marcella, N.; Routh, P.K.; Li, G.; Frenkel, A.I. Solving the structure of “single-atom” catalysts using machine learning—Assisted XANES analysis. Phys. Chem. Chem. Phys. 2022, 24, 5116–5124. [Google Scholar] [CrossRef] [PubMed]
- Timoshenko, J.; Lu, D.; Lin, Y.; Frenkel, A.I. Supervised Machine-Learning-Based Determination of Three-Dimensional Structure of Metallic Nanoparticles. J. Phys. Chem. Lett. 2017, 8, 5091–5098. [Google Scholar] [CrossRef] [PubMed]
- Timoshenko, J.; Halder, A.; Yang, B.; Seifert, S.; Pellin, M.J.; Vajda, S.; Frenkel, A.I. Subnanometer Substructures in Nanoassemblies Formed from Clusters under Reactive Atmosphere Revealed Using Machine Learning. J. Phys. Chem. C 2018, 122, 21686–21693. [Google Scholar] [CrossRef]
- Timoshenko, J.; Roese, S.; Hvel, H.; Frenkel, A.I. Silver clusters shape determination from in-situ XANES data. Radiat. Phys. Chem. 2018, 175, 208049. [Google Scholar] [CrossRef]
- Ji, Z.; Hu, M.; Xin, H.L. MnEdgeNet for accurate decomposition of mixed oxidation states for Mn XAS and EELS L2,3 edges without reference and calibration. Sci. Rep. 2023, 13, 14132. [Google Scholar] [CrossRef] [PubMed]
- Torrisi, S.B.; Carbone, M.R.; Rohr, B.A.; Montoya, J.H.; Ha, Y.; Yano, J.; Suram, S.K.; Hung, L. Random forest machine learning models for interpretable X-ray absorption near-edge structure spectrum-property relationships. NPJ Comput. Mater. 2020, 6, 109. [Google Scholar] [CrossRef]
- Gleason, S.P.; Carbone, M.R.; Lu, D.; Ciston, J. Prediction of the Cu Oxidation State from EELS and XAS Spectra Using Supervised Machine Learning. Microsc. Microanal. 2024, 10, 221–231. [Google Scholar]
- Na Narong, T.; Zachko, Z.N.; Torrisi, S.B.; Billinge, S.J.L. Interpretable multimodal machine learning analysis of X-ray absorption near-edge spectra and pair distribution functions. NPJ Comput. Mater. 2025, 11, 98–110. [Google Scholar] [CrossRef]
- Fang, Z.; Song, S.; Ye, B.; Chen, S. XAS Distortion Correction Algorithm of Illicit Drugs by ResU-Net Model. In Proceedings of the 2024 IEEE 18th International Conference on Anti-Counterfeiting, Security, and Identification (ASID), Xiamen, China, 1–3 November 2024; IEEE: Piscataway, NJ, USA, 2025. [Google Scholar]
- Joseph, M.; Raj, H. GANDALF: Gated Adaptive Network for Deep Automated Learning of Features. arXiv 2022, arXiv:2207.08548. [Google Scholar]
- Wang, Q.; Liu, W. X-Ray Absorption Fine Structure and Its Applications; Science Press: Beijing, China, 1994. [Google Scholar]
- Yin, Z.Q.; Wu, C.; Gong, W.Y.; Gong, Z.K.; Wang, Y.J. Investigation of the Voigt Line Function and Its Maximum Value. Acta Phys. Sin. 2013, 12, 123301–123306. [Google Scholar]
- Olivero, J.J.; Longbothum, R.L. Empirical fits to the Voigt line width: A brief review. J. Quant. Spectrosc. Radiat. Transf. 1977, 17, 233–236. [Google Scholar] [CrossRef]
- Thompson, P.; Cox, D.E.; Hastings, J.B. Rietveld refinement of Debye–Scherrer synchrotron X-ray data from Al2O3. J. Appl. Crystallogr. 1987, 20, 79–83. [Google Scholar] [CrossRef]
- Manu, J. PyTorch Tabular: A Framework for Deep Learning with Tabular Data. arXiv 2021, arXiv:2104.13638. [Google Scholar] [CrossRef]
Disclaimer/Publisher’s Note: The statements, opinions and data contained in all publications are solely those of the individual author(s) and contributor(s) and not of MDPI and/or the editor(s). MDPI and/or the editor(s) disclaim responsibility for any injury to people or property resulting from any ideas, methods, instructions or products referred to in the content. |
© 2025 by the authors. Licensee MDPI, Basel, Switzerland. This article is an open access article distributed under the terms and conditions of the Creative Commons Attribution (CC BY) license (https://creativecommons.org/licenses/by/4.0/).