Abstract
We have investigated the structural, morphological, magnetic, and up-conversion luminescence properties of the Yb3+/Er3+-doped LiGdF4 nanocrystals precipitated in the silica glassy matrix. Morphological analysis showed uniform distribution of LiGdF4 nanocrystals (tens of nm in size), embedded in silica glass matrix. FTIR spectroscopy analysis showed trifluoracetates thermolysis with silica lattice formation and structural analysis by XRD is consistent with the LiGdF4 crystallization process, most likely through an autocatalytic reaction. The stress and crystalline lattice distortion are assigned to the doping and glass matrix environment where the growth process occurs. The EPR spectra associated with the Gd3+ ions have shown a well-defined spectrum in the xerogel, associated with the trifluoroacetate ligand environment. In the LiGdF4 nanocrystals, the broad and unresolved spectrum is due to an envelope of unresolved anisotropic fine structure and a high dipole–dipole interaction between the Gd3+/Yb3+/Er3+ paramagnetic ions. Under 980 nm laser light pumping, we observed the characteristic “blue”, “green” and “red” up-conversion luminescences of the Er3+ ions through Yb → Er energy transfer process, that imply three and two-photon process; near UV up-conversion luminescence of Gd3+ is observed at about 280–300 nm where Yb → Er and Er → Gd energy transfer is involved. The UC luminescence properties can be improved up to two times by additional Yttrium co-doping due to the induced crystal field distortion.
1. Introduction
Multifunctional nanocomposite based on stabilized functional nanoparticles (NP) embedded in the glassy matrix have become key components for a wide range of applications including nanotechnology, nanoengineering, and nanoscience []. In particular, there is a high interest in glassy nanocomposites containing rare-earth (RE)-doped fluoride nanocrystals dispersed in silica glassy matrix, representing a new generation of tailorable materials with high potential for optical and photonic applications ([] and references therein). They combine the exploitation of their outstanding optical emission functionality, along with the optical transparency and good physico-chemical properties of the silica matrix. In particular, flame spray pyrolysis is an industrially scalable technology that enables the engineering of a wide range of metal-based nanomaterials with tailored properties nanoparticles []. It is an interesting option for the upconverting luminescent nanocrystals synthesis in one single step by combination of the core material precursor with silica precursor in a flame with greatly enhancement luminescence and low optical scattering effects [].
Among the fluorides, Yb/Er-doped LiGdF4 nanocrystals have been recognized for remarkable UP-conversion luminescence properties and made it very attractive for various applications such as bioimaging [], transparent displays [] and optical sensors []. The UC-luminescence properties can be improved and the red-to-green emission adjusted by additional co-doping capable of distorting the local symmetry around the rare-earth ions [] or host matrix modification [,], leading to the luminescence enhancement. Recent approach for the UC luminescence increase is based on the synthesis optimization []. However, the optical properties investigations of the nanocomposite counterpart are relatively limited to LiGdF4:Eu3+ nanocrystallites dispersed into polymeric [] or a silica matrix []. Recently, our investigations on UC luminescence and magnetic properties of Er3+/Yb3+-doped SiO2-GdF3/LiGdF4 glass-ceramics revealed the effect of Li-ions concentration to tune the nanocrystals structure from GdF3 to LiGdF4 and their UC luminescence properties []. Moreover, EPR investigations of the glassy materials and disordered polycrystalline materials containing gadolinium ions have been reported ([] and references therein), but similar studies on glass-ceramics are relatively limited [,].
The aim of this paper is to investigate the formation and structure–property relationship during the thermal processing of a xerogel by using structural (XRD) and electron microscopy (TEM) by correlation with vibrational (FTIR) and electron paramagnetic resonance (EPR) spectroscopy techniques and the investigation of the up-conversion properties investigation of the nanocomposite material.
2. Results and Discussion
2.1. Structural Analysis
The precipitation of the nanocrystals in the silica glass matrix has been reached by calcination of the xerogel and is revealed by the XRD patterns depicted in Figure 1. It can be seen that structural modifications occur in the temperature range from 280 to 320 °C, where thermal decomposition reaction (thermolysis) of the lanthanide trifluoroacetate salts occurs [,]. The thermolysis involves breaking the C–F bond in the trifluoroacetate ligands with forming new lanthanide–fluoride bonds and subsequent growth of fluoride nanocrystals in the glassy matrix, i.e., glass ceramization. The broad background observed for the initial xerogel is consistent with the amorphous silica matrix structure. As the calcination temperature increases, extra-diffraction peaks assigned to the nanocrystalline phases precipitation in the glass matrix, GdF3 (PDF 012-0788) and LiGdF4 (PDF 060-0476) [] developed. The GdF3 nanocrystalline phase crystallization starts right from the beginning (at about 275 °C) [,] and for temperatures above 325 °C, the LiGdF4 nanocrystalline phase starts to develop and becomes dominant above 525 °C. Moreover, besides the crystallization improvement, we observe peaks shift to higher angles and peaks ratio change, indicating strong influences on the structural properties.
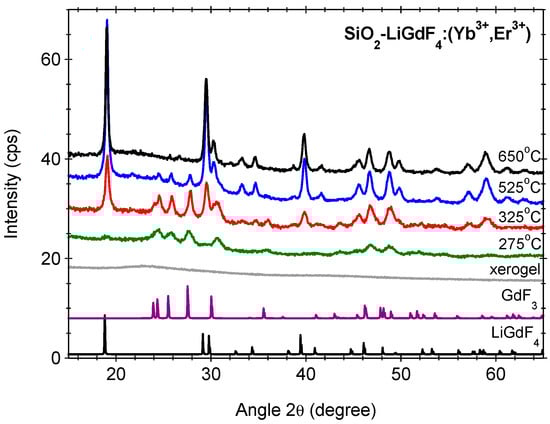
Figure 1.
The XRD patterns of Yb3+/Er3+-doped SiO2-LiGdF4 xerogel before and after calcination at indicated temperatures. The PDF files of GdF3 (PDF 012-0788) and LiGdF4 (PDF 060-0476) are included for comparison.
A deeper XRD patterns analysis (Table 1) indicated differences in the lattice parameters compared to those from the ICDD database [] assigned to the distortions of the crystalline lattice caused by RE-dopants. The LiGdF4 belongs the scheelite family with I41/a (no. 88) symmetry group where Li+ and Gd3+ ions are fourfold and eightfold coordinated by F- ions, respectively. The lattice parameter values indicated a contraction of the cell volume of ≅1.5% and 3.0% compared to the orth-GdF3 and LiGdF4, respectively (Table 1). As the ionic radii of 8-fold coordinated Yb3+ions (105.3 pm) and Er3+ ions (100.4 pm) are much lower than that of 8-fold coordinated Gd3+ ions (119 pm) [], the contraction effect is assigned to the Yb, Er ions incorporation within the precipitated nanocrystalline phases. However, the relaxation in Yb/Er-doped LiGdF4 powder was smaller, i.e., 0.5% (a = b = 5.21, and c = 10.96 Å with cell volume V = 297.5 Å) and therefore, the effect cannot be fully assigned to the Yb, Er doping but also to the Li-ions incorporation in the crystalline phase accompanied by the contraction of the cell volume with fluorine vacancies and/or oxygen ions as charge compensators [,]. Moreover, during their growth, the nanocrystals are subjected to internal pressure and stress, inducing lattice distortions that differ from the bulk material; impurities may also contribute to the stress and distortion effects. The gradual replacement of the Gadolinium ions by the Yttrium ions induces the conversion of the LiGdF4 nanocrystals to LiYF4 ones.

Table 1.
The results of the X-ray diffraction (XRD) pattern analysis of Yb3+/Er3+-doped SiO2-LiGdF4 and SiO2-LiGdxY1-xF4 (x = 0–1) nano-glass-ceramic. The lattice parameters for GdF3 (PDF 012-0788) and LiGdF4 (PDF 060-0476) [] are included for comparison.
As we observed from the XRD patterns analysis, the LiGdF4 nanocrystals phase precipitation occurs for calcination temperatures above 325 °C at the expense of GdF3 nanocrystals observed for low temperatures. Hence, we might suppose an autocatalytic process where the GdF3 metastable phase acts as a catalyst that promotes and accelerates the crystallization process of the LiGdF4 phase by reducing the energy barrier. Such a mechanism was effective for the RE-doped GdF3 nanocrystals growth in silica glass matrix, described as an autocatalytic-type reaction where a second metastable phase, LiF, acts as a catalyst [].
2.2. Morphological Analysis
Transmission electron microscopy images of the glass-ceramic sample showed two size distributions: particles with a small average size (around 20 nm) that can be seen clumped together forming large clusters (Figure 2) and a group of particles with a larger average dimension and a broad size distribution (40–300 nm range) that can be seen individually, well separated from one another (Figure 3). Both groups of morphologies seem to be uniformly distributed in the SiO2 matrix. The selected area diffraction (SAED) patterns of both morphologies display spots that belong to the LiGdF4 phase (Figure 2 and Figure 3), but in the case of the particles with larger size, some additional spots that can correspond to the secondary GdF3 phase are seen. The high-resolution TEM images show that the larger particles are polycrystalline with the grains having sizes of around 5–7 nm (Figure S1-Supplementary Material). The particles with smaller dimensions that are seen grouped are both single crystals, but it appears that they can also be formed from a few grains (Figure S2-Supplementary Material). The FFT analysis of high-resolution images shows some well-oriented nanoparticles and confirms the LiGdF4 phase with a high degree of confidence, as the Fourier pattern was directly comparable with single-crystal diffraction simulations (Figures S1 and S2, Supplementary Material).
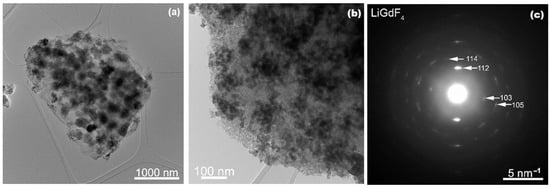
Figure 2.
Low magnification TEM images of the small LiGdF4 particles at two different magnifications (a,b) and the corresponding SAED pattern (c) recorded on the glass ceramic sample.
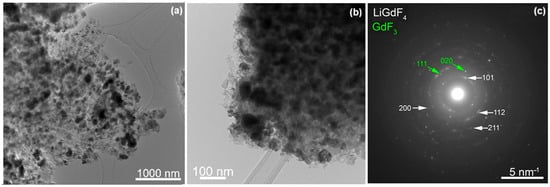
Figure 3.
Low-magnification TEM images of the large size LiGdF4 particles at two different magnifications (a,b) and the corresponding SAED pattern (c) recorded on the glass-ceramic sample.
The STEM-EDS mapping images show no distinction between the elemental compositions of the two distributions of particles and a uniform distribution of the Si and O together with localization of the Gd, F, and Yb within the nanoparticles, as expected (Figures S3 and S4-Supplementary Material). The EDX spectral analysis of the glass-ceramic sample (Figure S5-Supplementary Material) showed the presence of the elements from the precursor reagents: 33Si, 46O, 3Gd, 17F, 2Yb (at%). The Er ions’ concentration is very small and does not appear in the elemental composition, although a bump in the spectrum can be seen at the corresponding energy.
2.3. FTIR Spectroscopy Measurements
The structural modifications of the initial xerogel during the thermal processing have been tracked by the FTIR spectra presented in Figure 4. The spectrum of the initial xerogel shows the vibrations of organic groups such as acetate and trifluoroacetate responsible for the sharp peaks observed in the 650 to 900 cm−1 and from 1100 to 1750 cm−1 region []; two evident peaks located at 1455 and 1670 cm−1 are attributed to C–O vibrations of trifluoroacetic acid used as an in situ fluorinated agent []. The Si–O–Si network formation during xerogel drying is revealed by the bands at 950 and near 1100 cm−1 assigned to the Si–O–Si bonds and Si–OH stretching deformation vibrations, respectively []. The presence of hydroxyl groups is confirmed by the broad band centered at 3400–3500 cm−1 ascribed to the stretching and bending vibrations. Some weak modifications are observed after 200 °C calcination, where the thermal decomposition of organic residues is expected. However, as the temperature reaches 325 °C and higher, these peaks disappear, indicating the complete thermolysis of trifluoroacetate and acetate, and only the 800, 950, and 1100 cm−1 silica peaks are visible because the those related to the LiGdF4 crystalline matrix are lying at lower energies [].
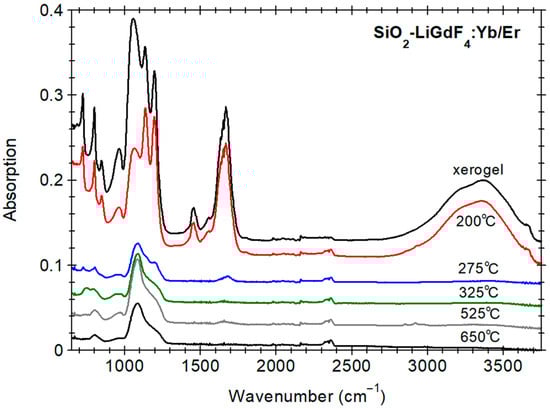
Figure 4.
The FTIR spectra recorded on Yb3+/Er3+-doped SiO2-LiGdF4 dried xerogel before and after calcination at the indicated temperatures; the spectra are offset for a better visualization.
2.4. EPR Spectroscopy Measurements
EPR spectroscopy was used to assess the paramagnetic centers in the Yb3+/Er3+-doped SiO2-LiGdF4 and powder samples and, in particular, to investigate the environment changes in the Gd3+ paramagnetic ions. In LiGdF4, gadolinium has a 3+ oxidation state, Gd3+, in the s-state with the spin-only angular momentum S = 7/2. The Er3+ ions have a 4f11 configuration and a 4I15/2 free-ion ground state, while trivalent Yb has a 4f13 configuration and a 2F7/2 free-ion ground state, making them paramagnetic.
The EPR spectra recorded in X-band (Figure 5a) show broad resonance signals for all three studied samples, which are assigned to the dipole–dipole interaction between the paramagnetic centers in the samples []. New features are observed when the excitation frequency is increased to 33.88 GHz (Q-band)-Figure 5b.
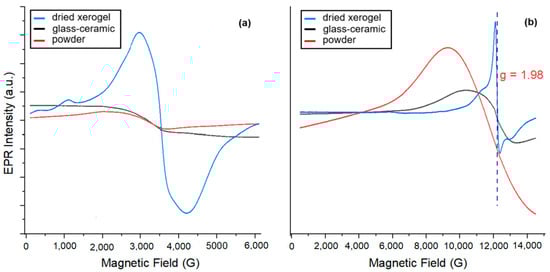
Figure 5.
The EPR spectra recorded in the X-band (a) and Q-band (b) for the xerogel before and after calcination at 525 °C, compared with the Yb3+/Er3+-doped LiGdF4 polycrystalline powder sample.
The EPR spectrum of dried xerogel sample shows a well-defined line with a g-value of 1.98 characteristic of Gd3+ in LiGdF4, as reported in [], where the asymmetry of the EPR signal was related to a strong crystal field. In our case, the shape of the spectrum was assigned to the trifluoroacetate groups environment of the Gd3+ ions, acting as a counter-ion. However, no distinctive EPR features are observed for the spectra recorded on SiO2-LiGdF4:Yb3+/Er3+ glass-ceramic and powder samples, indicating a high concentration of paramagnetic centers, which results in a strong exchange interaction accompanied by broadenning effects. In the glass-ceramic sample, the Gd3+ ions are dominantly incorporated within the fluoride crystalline environment and significant broadening effects EPR signal are assigned to an envelope of unresolved anisotropic fine structure of the Gd3+ ions [,]; a limited incorporation within the silica matrix cannot be rejected and may affect the shape of the spectra. The spectrum is broader than that of the LiGdF4: Yb3+/Er3+ powder sample, most likely due to internal stress and strain observed in the XRD analysis.
2.5. Up-Conversion Luminescence Properties
Figure 5 presents the up-conversion luminescence spectra recorded under 980 nm laser light pumping on Yb3+/Er3+-doped nano-glass-ceramic and LiGdF4 polycristalline powder. The spectra shows the characteristic green ((2H11/2, 4S3/2) → 4I15/2), red (4F9/2 → 4I15/2) and UV-blue ((4G11/2, 2H9/2)→ 4I15/2) luminescence of the Er3+ ions (Figure 6a); a very weak luminescence signal was observed in the near UV range at around 280–300 nm (Figure 6a-inset) and assigned to 6IJ, 6PJ → 8S7/2 transitions of Gd3+. As expected, the spectra are quite similar for the glass-ceramic and powder samples, consistent with the similar environment of the Er3+ ions in the two samples.
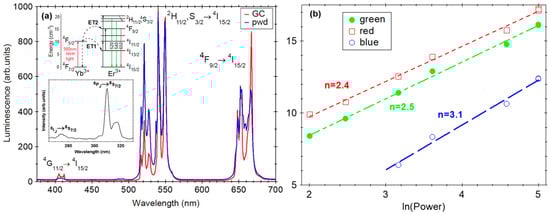
Figure 6.
Normalized up-conversion luminescence spectra recorded on glass-ceramic (GC) and Yb3+/Er3+-doped LiGdF4 polycrystalline powder samples under 980 nm laser light pumping. The inset shows the UC luminescence observed in the UV range and the UC luminescence mechanism. (a) Double-logarithmic plot of UC luminescence intensity vs. incident laser power for blue ((4G11/2, 2H9/2) → 4I15/2) green ((2H11/2, 4S3/2) → 4I15/2) and red (4F9/2 → 4I15/2) luminescence of glass-ceramic sample (b).
The UC luminescence properties have been widely investigated in various Yb3+/Er3+-doped materials, including oxyfluoride glass-ceramics [,,,]. The most efficient and accepted mechanism is the energy transfer up-conversion (ETU) where the sequential absorption of two or more photons by the Yb3+ ions (i.e., 2F7/2 → 2F5/2 transition at about 980 nm) is followed energy transfer (ET), multi-phonon and cross-relaxation (Yb3+-Er3+) and processes leading to the population of Er3+ light emitting levels [,] (Figure 6a-inset). For unsaturated UC processes, the n number of pump photons necessary to populate the emitting level can be extracted from a double logarithmic plot, luminescence intensity vs. incident pump intensity dependence, where n is the slope [] (Figure 6b). The green ((2H11/2, 4S3/2) → 4I15/2) and red (4F9/2 → 4I15/2) up-conversion luminescences involve two-photon absorption processes and three photons for the “UV-blue” up-conversion luminescence (4G11/2, 2H9/2 → 4I15/2). Regarding the near-UV up-conversion luminescence from the 6IJ and 6PJ levels of Gd3+ ions, these can be populated through energy transfer (ET) processes of Yb → Er and Er → Gd, involving a higher number of energy levels and photons [].
Regarding the UC luminescence efficiency, it can be improved by partial replacement of the Gadolinium ions by the Yttrium, as shown in Figure 7. A similar effect was observed in Yb/Er-doped LiYF4 nanocrystals []. As the Yttrium concentration increased to 40 mol%, the UC luminescence intensity increased by about two times but decreased significantly for higher concentrations. The UC luminescence enhancement was assigned to the local symmetry distortion around Yb3+, Er3+ ions (compared to the Gd-free nanocrystal) [,,] and the energy transfer (ET) distance [] leading to an increase in the transition probabilities. For an evaluation of the UC luminescence efficiency, we compared it to the β-NaYF4:18Yb/2Er polycrystalline powder [], known to show the best luminescence property among UC luminescent materials. The up-conversion luminescence signal recorded in the nano-glass-ceramic is only about 20% but if we consider a glass ceramization volume fraction of about 40% the signal reached 50% compared to the β-NaYF4:18Yb/2Er polycrystalline powder.
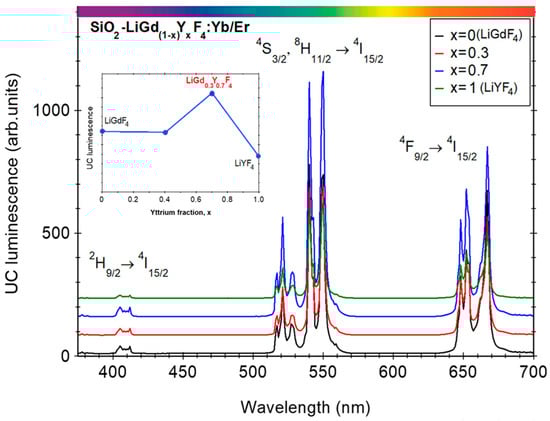
Figure 7.
Up-conversion luminescence spectra recorded on Yb3+/Er3+-doped SiO2-LiGd1-xYxF4 (x = 0, 0.3, 0.6, 1) samples. The inset shows the UC luminescence signal dependence on Yttrium fraction x.
3. Materials and Methods
3.1. Sample Preparation
The 1Er3+/4Yb3+-doped 90SiO2-5LiGdF4 (mol%) glass-ceramic samples were prepared according to the sol–gel synthesis route method described in ref. [] and by using precursors materials (all from Alfa-Aesar, Heysham, Lancashire, UK). Firstly, TEOS was hydrolyzed with a mixed solution of ethanol, water and glacial acetic acid with the 1:4:3.5:0.5 molar ratio was. The second solution was prepared by using the corresponding acetates of Er(CH3COO)3, Yb(CH3COO)3, Li(CH3COO), Gd(CH3COO)3 with Er:Yb:Li:Gd:F 1:4:20:5:122 for molar ratio and added to the first solution. Li-ions were added in excess at a 4:1 ratio to assure the formation of the LiGdF4 nanocrystalline phase [,]. The mixed solution was stirred and then aged at room temperature, followed by drying up to 120 °C to form the xerogel. Glass-ceramic samples were obtained after subsequent calcination in air at different temperatures for 60 min. For comparison, we prepared LiGdF4:4Yb/1Er polycrystalline powder by using hybrid sol–gel route described in ref. []. Day light photo images (Figure S6-Supplementary Material) showed white powder for xerogel and glass-ceramic samples (a) and the UC luminescence has been observed only for the glass-ceramic sample under 980 nm laser light spot (c).
3.2. Samples Characterization
The structural characterization of the materials was performed using X-ray diffractometry (XRD) and a BRUKER D8 ADVANCE-type X-ray diffractometer (Billerica, MA, USA) operating in focusing geometry, equipped with a copper target X-ray tube and LynxEye one-dimensional detector, in a range between 15° and 55°, with 0.05° step and 2 s integration time. For the analysis of the XRD patterns, we used the Powdercell 2.3 dedicated software []. The morphological investigations were performed using a JEM-ARM200F (JEOL, Tokyo Japan) transmission electron microscope operating at 200 kV electron beam accelerating voltage and equipped with an energy-dispersive X-ray spectrometer ((JEOL JED 2300T, JEOL, Tokyo, Japan). The FTIR-ATR spectra were recorded in the 500 to 4000 cm−1 range with a 0.05 cm−1 step using an FTIR Spectrum BX spectrophotometer (Perkin Elmer, Shelton, CT, USA) and the ATR accessory. For the up-conversion (UC) luminescence spectra, we used a Fluoro Max 4P spectrophotometer (HORIBA Jobin Yvon, Kyoto, Japan) and a laser light module (200 mW) centered at 980 nm as a pumping light source. Electron paramagnetic resonance (EPR) spectroscopy measurements were performed at room temperature on a dual-band Bruker E-500 ELEXSYS X spectrometer (Bruker GmbH, Mannheim, Germany) in X-band (9.88 GHz) and Q-band (33.9 GHz).
4. Conclusions
We have investigated the formation and structure–properties relationship of the Yb3+/Er3+-doped LiGdF4 nanocrystals embedded in silica glassy matrix.
The XRD analysis is consistent with the LiGdF4 crystallization process, most likely through an autocatalytic-type reaction with GdF3 metastable phase acting as a catalyst. Electron microscopy analysis by TEM and STEM indicated uniform distribution of Yb/Er-doped LiGdF4 nanocrystals (tens of nm size), inside the silica glass matrix.
The EPR spectra shape reflects the change in the Gd3+ environment—from a sharp signal in the xerogel, attributed to the trifluoroacetate ligand environment, to a broad (unresolved) one in the LiGdF4 nanocrystals—resulting from an envelope of unresolved anisotropic fine structure. FTIR spectroscopy confirmed the thermolysis of trifluoracetates and silica lattice formation.
Under 980 nm laser light, the nanocrystals exhibit the characteristic “green–red” up-conversion of Er3+ ions at 525, 545, and 660 nm, as well as a blue emission at 408 nm, corresponding to two- and three-photon absorption processes, respectively. A very weak UV-blue up-conversion luminescence, assigned to the Gd3+ transitions (4G11/2, 2H9/2 → 4I15/2), was observed at around 280–300 nm. The UC luminescence properties can be improved by partial replacement of the Gadolinium ions with the Yttrium co-doping, yielding approximately a twofold increase in intensity.
Sol–gel-derived transparent glassy nanocomposites comprising well dispersion of the optically active nanocrystals in the silica matrix are very well suited for functional thin-films coatings photonic applications based on fluoride materials.
Supplementary Materials
The following supporting information can be downloaded at: https://www.mdpi.com/article/10.3390/inorganics13110378/s1, Figure S1: HRTEM image of large LiGdF4 nanoparticles (left), FFT of the indicated region (top), simulated diffraction pattern along the [311] zone axis; Figure S2: HRTEM image of small LiGdF4 nanoparticles (left), FFT of the indicated region (top), simulated diffraction pattern along the [311] zone axis; Figure S3: STEM-EDS map images of the large LiGdF4 particles observed in Yb3+/Er3+-doped SiO2-LiGdF4 glass ceramic; Figure S4: STEM-EDS map images of the small LiGdF4 particles observed in Yb3+/Er3+-doped SiO2-LiGdF4 glass ceramic; Figure S5: EDS spectrum and elemental composition analysis: O=46%; F=17%; Si=33%; Gd=3%; Yb=2%; Er=-; Figure S6: Digital photocamera images of the xerogel (a) and glass-ceramic sample (b) under natural day light and of the glass-ceramic sample under 980 nm laser light spot (c).
Author Contributions
All the authors collaborated for the physical characterization and analysis of all the data: C.S. was involved in the sample preparation and FTIR measurements; C.R. was responsible for the morphological analysis by using transmission electron microscopy; A.R. was responsible for the EPR spectroscopy measurements; and M.S. was responsible for the optical properties (up-conversion luminescence) and XRD structural analysis. All the authors contributed to discussions and reviewed the manuscript. All authors have read and agreed to the published version of the manuscript.
Funding
This research was funded by the Romanian Ministry of Research, Innovation and Digitization through the grant Project PC3-PN23080303 Core Program of NIMP.
Institutional Review Board Statement
Not applicable.
Informed Consent Statement
Not applicable.
Data Availability Statement
The original contributions presented in this study are included in the article. Further inquiries can be directed to the corresponding author.
Acknowledgments
The help of Iulia Bogdan for assistance with FTIR-ATR measurements is gratefully acknowledged.
Conflicts of Interest
The authors declare no conflicts of interest.
References
- Fonseca, J. Nanoparticles embedded into glass matrices: Glass nanocomposites. Front. Mater. Sci. 2022, 16, 220607. [Google Scholar] [CrossRef]
- Gorni, G.; Velázquez, J.J.; Mosa, J.; Balda, R.; Fernández, J.; Durán, A.; Castro, Y. Transparent Glass-Ceramics Produced by Sol-Gel: A Suitable Alternative for Photonic Materials. Materials 2018, 11, 212. [Google Scholar] [CrossRef]
- Dimitriou, C.; Psathas, P.; Solakidou, M.; Deligiannakis, Y. Advanced Flame Spray Pyrolysis (FSP) Technologies for Engineering Multifunctional Nanostructures and Nanodevices. Nanomaterials 2023, 13, 3006. [Google Scholar] [CrossRef]
- Mangiarini, F. Flame Spray Pyrolysis for the Preparation of Upconverting Luminescent Nanostructured Materials. Ph.D Thesis, Concordia University, Montreal, QC, Canada, 2012. [Google Scholar]
- Choi, J.E.; Kim, H.K.; Kim, Y.; Kim, G.; Lee, T.S.; Kim, S.; Jang, H.S. 800 nm near-infrared light-excitable intense green-emitting Li(Gd,Y)F4:Yb, Er-based core/shell/shell upconversion nanophosphors for efficient liver cancer cell imaging. Mater. Des. 2020, 195, 108941. [Google Scholar] [CrossRef]
- Shin, J.; Kyhm, J.H.; Hong, A.R.; Song, J.D.; Lee, K.; Ko, H.; Jang, H.S. Multicolor Tunable Upconversion Luminescence from Sensitized Seed-Mediated Grown LiGdF4:Yb,Tm-Based Core/Triple-Shell Nanophosphors for Transparent Displays. Chem. Mater. 2018, 30, 8457–8464. [Google Scholar] [CrossRef]
- Oleynikova, E.I.; Morozov, O.A.; Korableva, S.L.; Pudovkin, M.S. LiGdxY1−xF4 and LiGdF4:Eu3+ Microparticles as Potential Materials for Optical Temperature Sensing. Ceramics 2024, 7, 276–290. [Google Scholar] [CrossRef]
- Xiong, Z.; Yang, Y.; Wang, Y. Enhanced upconversion luminescence and tuned red-to-green emission ratio of LiGdF4 nanocrystals via Ca2+ doping. RSC Adv. 2016, 6, 75664–75668. [Google Scholar] [CrossRef]
- Na, H.; Jeong, J.S.; Chang, H.J.; Kim, H.Y.; Woo, K.; Lim, K.; Mkhoyan, K.A.; Jang, H.S. Facile synthesis of intense green light emitting LiGdF4:Yb,Er-based upconversion bipyramidal nanocrystals and their polymer composites. Nanoscale 2014, 6, 7461–7468. [Google Scholar] [CrossRef]
- Banski, M.; Afzaal, M.; Cha, D.; Wang, X.; Tan, H.; Misiewicz, J.; Podhorodecki, A. Crystal phase transition in LixNa1−xGdF4 solid solution nanocrystals—Tuning of optical properties. J. Mater. Chem. C 2014, 2, 9911–9917. [Google Scholar] [CrossRef]
- Koshelev, A.V.; Artemov, V.V.; Arkharova, N.A.; Seyed Dorraji, M.S.; Karimov, D.N. Peculiarities of the Synthesis of LiRF4 Nanoparticles (R = Er − Lu) by High-Temperature Coprecipitation and Their Photoluminescent Properties. Crystallogr. Rep. 2024, 69, 239–247. [Google Scholar] [CrossRef]
- Lepoutre, S.; Boyer, D.; Fujihara, S.; Mahiou, R. Structural and optical characterizations of sol–gel based composites constituted of LiGdF4: Eu3+ nanocrystallites dispersed into a silica matrix. J. Mater. Chem. 2009, 19, 2784–2788. [Google Scholar] [CrossRef]
- Secu, C.; Bartha, C.; Radu, C.; Secu, M. Up-Conversion Luminescence and Magnetic Properties of Multifunctional Er3+/Yb3+-Doped SiO2-GdF3/LiGdF4 Glass Ceramics. Magnetochemistry 2023, 9, 11. [Google Scholar] [CrossRef]
- Mazur, M.; Poprac, P.; Valko, M. ‘U-spectrum’ type of Gd(III) EPR spectra recorded at various stages of TEOS-based sol–gel process. J. Sol-Gel Sci. Technol. 2016, 79, 220–227. [Google Scholar] [CrossRef]
- Antuzevics, A.; Rogulis, U.; Fedotovs, A.; Popov, A.I. Crystalline phase detection in glass ceramics by EPR spectroscopy. Low Temp. Phys. 2018, 44, 341–345. [Google Scholar] [CrossRef]
- Rada, M.; Culea, E.; Rada, S.; Pascuta, P.; Culea, M.; Dan, V.; Rusu, T.; Maties, V.; Bratu, I. The local structure of gadolinium-borate-tellurate vitroceramics investigated by FTIR and EPR spectroscopy. J. Phys. Conf. Ser. 2009, 182, 012074. [Google Scholar] [CrossRef]
- Rillings, K.W.; Roberts, J.E. A thermal study of the trifluoroacetates and pentafluoropropionates of praseodymium samarium and erbium. Thermochim. Acta 1974, 10, 285–298. [Google Scholar] [CrossRef]
- Yoshimura, C.Y.; Ohara, K. Thermochemical studies on the lanthanoid complexes of trifluoroacetic acid. J. Alloys Compd. 2006, 408–412, 573–576. [Google Scholar] [CrossRef]
- PDF-ICDD. Powder Diffraction File, PDF-4+ 2018 Software 4.18.0.2; International Centre for Diffraction Data: Newtown Square, PA, USA, 2011. [Google Scholar]
- Secu, C.; Bartha, C.; Secu, M. Unravelling the crystallization mechanism and structural evolution of Yb/Er-doped SiO2-GdF3 nano-glass ceramics. Mater. Adv. 2025, 6, 5877–5883. [Google Scholar] [CrossRef]
- Velázquez, J.J.; Mosa, J.; Gorni, G.; Balda, R.; Fernández, J.; Pascual, L.; Durán, A.; Castro, Y. Transparent SiO2-GdF3 sol–gel nano-glass cera mics for optical applications. J. Sol-Gel Sci. Technol. 2019, 89, 322–332. [Google Scholar] [CrossRef]
- Shannon, R.D. Revised effective ionic radii and systematic studies of interatomic distances in halides and chalcogenides. Acta Cryst. Sect. A 1976, 32, 751–767. [Google Scholar] [CrossRef]
- Chuai, X.; Liu, Z.; Liu, Y.; He, C.; Qin, W. Enhanced Near-Infrared Upconversion Luminescence of GdF3:Yb3+, Tm3+ by Li+. J. Nanosci. Nanotechnol. 2014, 14, 3687–3689. [Google Scholar] [CrossRef] [PubMed]
- Opata, Y.A.; Grivel, J.C. Synthesis and Thermal Decomposition Study of Dysprosium Trifluoroacetate. J. Anal. Appl. Pyrolysis 2018, 132, 40–46. [Google Scholar] [CrossRef]
- Fujihara, S.; Mochizuki, C.; Kimura, T. Formation of LaF3 microcrystals in sol–gel silica. J. Non-Cryst. Solids 1999, 244, 267–274. [Google Scholar] [CrossRef]
- Aguiar, H.; Serra, J.; Gonzalez, P.; Leon, J.B. Structural study of sol–gel silicate glasses by IR and Raman spectroscopies. Non-Cryst. Solids 2009, 355, 475–480. [Google Scholar] [CrossRef]
- Sosin, S.S.; Iafarova, A.F.; Romanova, I.V.; Morozov, O.A.; Korableva, S.L.; Batulin, R.G.; Zhitomirsky, M.; Glazkov, V.N. Microscopic Spin Hamiltonian for a Dipolar Heisenberg Magnet LiGdF4 from EPR Measurements. JETP Lett. 2022, 116, 771–778. [Google Scholar] [CrossRef]
- Brodbeck, C.M.; Iton, L.E. The EPR spectra of Gd3+ and Eu3+ in glassy systems. J. Chem. Phys. 1985, 83, 4285–4299. [Google Scholar] [CrossRef]
- Velázquez, J.J.; Gorni, G.; Balda, R.; Fernández, J.; Pascual, L.; Durán, A.; Pascual, M.J. Non-Linear Optical Properties of Er3+–Yb3+-Doped NaGdF4 Nanostructured Glass Ceramics. Nanomaterials 2020, 10, 1425. [Google Scholar] [CrossRef]
- Secu, M.; Secu, C.E. Up-conversion luminescence of Er3+/Yb3+ co-doped LiYF4 nanocrystals in sol-gel derived oxyfluoride glass-ceramics. J. Non-Cryst. Solids 2015, 426, 78–82. [Google Scholar] [CrossRef]
- de Pablos-Martín, A.; Méndez-Ramos, J.; del-Castillo, J.; Durán, A.; Rodríguez, V.D.; Pascual, M.J. Crystallization and up-conversion luminescence properties of Er3+/Yb3+-doped NaYF4-based nano-glass-ceramics. J. Eur. Ceram. Soc. 2015, 35, 1831–1840. [Google Scholar] [CrossRef]
- Georgescu, S.; Voiculescu, A.M.; Matei, C.; Secu, C.E.; Negrea, R.F.; Secu, M. Ultraviolet and visible up-conversion luminescence of Er3+/Yb3+ co-doped CaF2 nanocrystals in sol–gel derived glass-ceramics. J. Lumin. 2013, 143, 150–156. [Google Scholar] [CrossRef]
- Auzel, F. Upconversion and anti-stokes processes with f and d ions in solids. Chem. Rev. 2004, 104, 139–174. [Google Scholar] [CrossRef]
- Chen, J.; Zhao, J.X. Upconversion Nanomaterials: Synthesis, Mechanism, and Applications in Sensing. Sensors 2012, 12, 2414–2435. [Google Scholar] [CrossRef]
- Pollnau, M.; Gamelin, D.R.; Lüthi, S.R.; Güdel, H.U. Power dependence of upconversion luminescence in lanthanide and transition-metal-ion systems. Phys. Rev. B 2000, 61, 3337. [Google Scholar] [CrossRef]
- Wang, L.; Lan, M.; Liu, Z.; Qin, G.; Wu, C.; Wang, X.; Qin, W.; Huang, W.; Huang, L. Enhanced deep-ultraviolet upconversion emission of Gd3+ sensitized by Yb3+ and Ho3+ in β-NaLuF4 microcrystals under 980 nm excitation. J. Mater. Chem. C 2013, 1, 2485–2490. [Google Scholar] [CrossRef]
- Wisser, M.D.; Fischer, S.; Maurer, P.C.; Bronstein, N.D.; Chu, S.; Alivisatos, A.P.; Salleo, A.; Dionne, J.A. Enhancing Quantum Yield via Local Symmetry Distortion in Lanthanide-Based Upconverting Nanoparticles. ACS Photonics 2016, 3, 1523–1530. [Google Scholar] [CrossRef]
- Lee, C.K.; Kim, Y.J. Correlation between local lattice distortions and up-/down-conversion luminescence of (Y,Al)NbO4:Yb3+/Er3+. Ceram. Int. 2022, 48, 3985–3992. [Google Scholar] [CrossRef]
- Zhu, Y.; Zhao, S.; Zhou, B.; Zhu, H.; Wang, Y. Enhancing upconversion luminescence of LiYF4:Yb,Er nanocrystals by Cd2+ doping and Core–Shell structure. J. Phys. Chem. C 2017, 121, 18909–18916. [Google Scholar] [CrossRef]
- Wyss, C.; Lüthy, W.; Weber, H.P.; Rogin, P.; Hulliger, J. Energy transfer in Yb:Er:YLF. Optic Commun. 1997, 144, 31–35. [Google Scholar] [CrossRef]
- Bartha, C.; Secu, C.E.; Matei, E.; Secu, M. Crystallization kinetics mechanism investigation of sol–gel derived NaYF4:(Yb,Er) up-converting phosphors. Cryst. Eng. Comm. 2017, 19, 4992–5000. [Google Scholar] [CrossRef]
- Krause, W.; Nolze, G. PowderCell a program for the representation and manipulation of crystal structures and calculation of the resulting X-ray patterns. J. Appl. Cryst. 1996, 29, 301–303. [Google Scholar] [CrossRef]
Disclaimer/Publisher’s Note: The statements, opinions and data contained in all publications are solely those of the individual author(s) and contributor(s) and not of MDPI and/or the editor(s). MDPI and/or the editor(s) disclaim responsibility for any injury to people or property resulting from any ideas, methods, instructions or products referred to in the content. |
© 2025 by the authors. Licensee MDPI, Basel, Switzerland. This article is an open access article distributed under the terms and conditions of the Creative Commons Attribution (CC BY) license (https://creativecommons.org/licenses/by/4.0/).