Article

Reactive Crystallization of Lithium Carbonate from LiCl and Na2CO3: Effect of Polyacrylic Acid Monitored by Focused Reflectance Measurement

1
Facultad de Ingeniería y Arquitectura, Universidad Arturo Prat, Iquique 1110939, Chile
2
Departamento de Ingeniería Química y Procesos de Minerales, Facultad de Ingeniería, Universidad de Antofagasta, Antofagasta 1240000, Chile
3
Advanced Mining Technology Center (AMTC), Universidad de Antofagasta, Antofagasta 1240000, Chile
4
Escuela de Ingeniería Química, Pontificia Universidad Católica de Valparaíso, Valparaíso 2340000, Chile
*
Author to whom correspondence should be addressed.
Inorganics 2025, 13(11), 377; https://doi.org/10.3390/inorganics13110377
Submission received: 30 September 2025 / Revised: 11 November 2025 / Accepted: 14 November 2025 / Published: 19 November 2025

Abstract

The reactive crystallization of lithium carbonate (Li2CO3) from LiCl and Na2CO3 solutions was studied by Focused Beam Reflectance Measurement (FBRM) to evaluate the effect of polyacrylic acid (PAA) of different molecular weights (1800, 230,000, and 450,000 g/mol). In situ monitoring determined nucleation and growth rates, as well as the evolution of fine (<10 µm) and coarse (50–150 µm) particles. It was observed that maximum velocities occur in the first few seconds after mixing, decreasing subsequently due to the consumption of supersaturation. Increasing the initial LiCl concentration intensified nucleation and growth; however, at 4 M, massive nucleation and attrition predominated, resulting in an abundance of fines. Li2CO3 spherulites formed under all conditions, becoming more compact at higher LiCl concentrations. The addition of PAA significantly altered their size and morphology: the low-molecular-weight polymer inhibited spherulite formation, while the high-molecular-weight polymers reduced growth and promoted denser and more compact spherulites. SEM micrographs confirmed these trends, highlighting the role of PAA molecular weight as a key parameter modulating the kinetics and morphology of Li2CO3 in reactive crystallization processes.

1. Introduction

Lithium carbonate (Li2CO3) is one of the most significant lithium-derived compounds, with fundamental applications in the manufacture of cathodes for lithium-ion batteries, as well as in ceramics, adhesives, lubricants, and pharmaceutical products [1,2,3]. Demand for Li2CO3 is projected to continue increasing in the coming years, driven primarily by the expansion of the electric vehicle industry [4]. This growth raises the need to develop more efficient and reliable production processes.
Lithium resources are classified as primary and secondary [5]. Primary resources include pegmatites, seawater, continental brines, geothermal brines, brines associated with oil fields, as well as lithium-containing clays and zeolites [6]. Secondary resources correspond to artificial deposits, such as disused lithium-ion batteries [7,8,9]. Due to their lower operating costs, brines are currently the primary source of lithium at the industrial level [10], with Chile being one of the countries with the largest lithium reserves [11].
Obtaining Li2CO3 from brines is primarily accomplished through a precipitation process, in which lithium carbonate crystallizes from a purified lithium chloride (LiCl) solution by reacting with sodium carbonate. The precipitated solid is subsequently filtered, dried, and, in some cases, ground [12,13]. Alternatively, Li2CO3 can also be obtained from brines rich in lithium sulfate [14].
Several investigations have addressed the reactive crystallization of lithium carbonate. Sun et al. [15,16] investigated this process using LiCl and Na2CO3 solutions, evaluating the effects of variables such as temperature, stirring speed, and Na2CO3 feed rate on Li2CO3 supersaturation, both in systems seeded with Li2CO3 crystals and in unseeded systems. The authors observed that supersaturation decreased with increasing temperature and stirring speed, as well as with decreasing Na2CO3 feed rate. They also reported that supersaturation is reduced by the addition of salts such as NaCl, KCl, NaNO3, and NaBr, while it increases in the presence of Na2SO4, CH4N2O, NH4Cl, and (NH4)2SO4. For these studies, they utilized laser measurements and the focused beam reflectance resonance (FBRM) technique.
Aguilar and Graber [13] used calorimetric methods to determine kinetic parameters of the reactive crystallization of Li2CO3 from Li2SO4 and Na2CO3. Zhao et al. [17] investigated the kinetics and mechanisms of nucleation and growth of reactive Li2CO3 crystallization by measuring induction times as a function of initial supersaturation and temperature, finding that the nucleation mechanism depends on the initial supersaturation and that the growth mechanism is mediated by two-dimensional nucleation. In this study, response surface methodology revealed that solution concentration is the key factor controlling crystallization yield, while stirring speed primarily affects the size of Li2CO3 particles. Liu and Azimi [14] investigated the impact of temperature, stirring speed, reactant concentration, and feed rate on the crystallization of Li2CO3 in a batch reactor, with and without seeding, followed by CO purification. Their results showed that increasing the initial reaction concentration and temperature improves Li2CO3 recovery efficiency. However, crystal seeding, as well as stirring and feed rates, do not significantly influence product recovery or purity. The purity of Li2CO3 improved at high temperatures and with low concentration of reagents, achieving a recovery of 90.5% with a purity of 99%.
Chen et al. [18] studied Li2CO3 crystallization kinetics in a CSTR (Continuous Stirred-Tank Reactor), determining that crystal growth rate depends on supersaturation and that longer residence times promote crystal growth by lowering supersaturation. Their kinetic model suggests multidimensional growth, possibly influenced by aggregation phenomena.
Graber et al. [19] studied Li2CO3 crystallization from LiCl brines, finding faster kinetics than with Li2SO4. They reported homogeneous nucleation at high supersaturation, heterogeneous nucleation at low levels, and 2D nucleation-mediated growth. Temperature and concentration strongly affect crystal size, purity, and yield.
It is worth noting that, in addition to the traditional precipitation route using Na2CO3, alternatives for carbonation using gaseous CO2 have been explored. Sun et al. obtained Li2CO3 by gas–liquid crystallization in film reactors and falling-film columns, observing that parameters such as temperature and the use of ultrasound significantly influence the obtained particle size [20,21]. Similarly, Liu and Azimi applied CO2 in Li2CO3 purification steps, as mentioned above [14].
Most studies on Li2CO3 precipitation from LiCl or Li2SO4 with Na2CO3 focus on process conditions and product performance, but few analyze crystal size and shape. These features are key to downstream properties and depend on the relative growth of crystal faces [22]. Additives—particularly polymers—are often used to modulate this growth and tailor final properties [23,24,25]. Polymers influence crystallization by modifying crystal shape, size, distribution, and purity. They may adsorb selectively on crystal faces, alter nucleation/growth rates, or act as diffusion barriers. High-molecular-weight polymers exert more potent effects, promoting agglomeration via bridging, viscosity increase, or multisite adsorption [26].
Polymers are effective in controlling the crystallization of salts and minerals. Matahwa et al. [23] showed that PAA influences CaCO3 formation via face-selective adsorption, Ca2+ chelation, and stabilization of metastable phases. Watamura et al. [27] further demonstrated that PAA affects nucleation, phase selection, size, and morphology, depending on supersaturation and polymer molecular weight. Additionally, Nicoleau et al. [25] showed that PAA alters gypsum nucleation by forming complexes with Ca2+, reducing effective supersaturation, and delaying nucleation. Its adsorption onto prenuclear clusters blocks active growth sites, inhibiting homogeneous nucleation. Overall, PAA acts through multiple mechanisms—complexation, face-selective adsorption, and secondary nucleation inhibition—making it a versatile tool for controlling crystal properties.
Several authors have explored additive effects on Li2CO3 crystallization. Watamura et al. [27,28] found that polyacrylic acid (PAA) promotes the formation of elongated crystals with reduced agglomeration, while polyacrylamide (PAM) favors the formation of platelets. Taborga et al. [29] reported that polyethylene amine (PEI), polyethylene glycol (PEG), and poly(4-styrenesulfonic acid) (P4SA) increase crystal length, sodium dodecyl sulfate (SDS) reduces it, sodium dodecyl benzenesulfonate (SFBS) induces acicular morphologies, and PAA favors spherulite formation. Although all additives modify morphology, none alter Li2CO3 crystal structure. Differences between studies may stem from process conditions and PAA molecular weight. Yang et al. [30] showed that sodium hexametaphosphate (SHMP) promotes precursor-based agglomeration and inhibits secondary nucleation, increasing branching. Wang et al. [31] Also, SHMP and sodium tripolyphosphate (STPP) induce spherulitic growth via distinct core–shell pathways, depending on the level of supersaturation.
A particularly relevant aspect in crystallization studies is online process monitoring. The Focused Beam Reflectance Measurement (FBRM) technique enables real-time tracking of chord length distribution (CLD) and particle counts by detecting laser reflections from suspended solids. Widely applied in crystallization, FBRM allows monitoring of nucleation, growth, and size evolution, with CLD correlating statistically with particle size distribution (CSD) [32,33,34].
In one of the first studies, Tadayyon and Rohani [35] proposed a strategy to monitor size distribution in a KCl crystallizer by combining a turbidity sensor with an FBRM probe. Later, Kougoulos et al. [36] integrated FBRM into a continuous Mixed Suspension Mixed Product Removal (MSMPR) crystallizer, demonstrating that this technique enables monitoring of the steady-state size distribution and even the estimation of crystallization parameters. Since then, numerous studies have employed FBRM to monitor particle evolution in real time, identifying nucleation, growth, agglomeration, and breakage phenomena [37,38,39,40,41,42,43]. It is important to note that the FBRM probe measures chord lengths and not directly the physical diameters of particles. However, calibrations performed by Heath et al. [44] demonstrated that the weighted mean square of the CLD can approximate the average particle size obtained by traditional methods over typical crystallization ranges.
FBRM has also been coupled with population balance models and moment analysis. Trifkovic et al. [45] estimated secondary nucleation rates from the slope of particle counts over time. Albis et al. [33] combined supersaturation profiles with FBRM data during K2SO4 crystallization and applied a population balance model to extract kinetic parameters. They proposed that the zero-order moment approximates the true particle number, while noting limitations in converting CLD to CSD. These studies highlight FBRM’s value for estimating nucleation and growth rates from real-time measurements.
To the authors’ knowledge, no studies have used FBRM to analyze Li2CO3 crystallization with additives, particularly to distinguish kinetic behavior between fine and coarse particles. Likewise, the link between chord length distribution (CLD) evolution and crystallization kinetics remains unexplored. While PAA has been proposed to influence morphology and delay nucleation, the specific impact of its molecular weight on Li2CO3 crystallization remains unclear. This study addresses this gap by examining reactive crystallization from LiCl and Na2CO3 solutions at varying initial concentrations, using FBRM to assess how different PAA molecular weights affect crystal size, morphology, and kinetic profiles. These insights may support the design of more efficient precipitation steps for producing Li2CO3 with properties tailored to battery applications.

2. Materials and Methods

2.1. Materials

All reagents used were commercially available and of analytical grade: lithium chloride (≥99%, Winkler), sodium carbonate (≥99%, Loba Chemie PVT. Ltd., Bombay, India), and polyacrylic acid (PAA) with different molecular weights (P1: Mw 1800; P2: Mw 230,000; P3: Mw 450,000; Aldrich, Taufkirchen, Germany). These extreme molecular weights were intentionally selected to accentuate the differences in the polymer’s effect on crystallization. All solutions were prepared using deionized water.

2.2. Solution Preparation and Precipitation Tests

Li2CO3 crystallization was conducted in a 300 mL batch reactor at 65 °C, a temperature representative of industrial conditions. Stirring was maintained at 300 rpm to limit agglomerate breakage and minimize secondary nucleation by fragmentation. This setup enabled more precise observation of crystal growth dynamics using FBRM without significant interference from mechanical disruption.
In each test, 100 mL of LiCl solutions at initial concentrations of 2, 3, and 4 M was added to the reactor, followed by the addition of the additive at the corresponding dosage (see Table 1). Once the mixture temperature was stabilized, 100 mL of sodium carbonate solutions at concentrations of 1, 1.5, and 2 M, respectively, were rapidly added (in less than 5 s). This addition caused a temporary temperature drop of the mixture to approximately 45 °C, which returned to 65 °C within about 2 min due to the reactor’s thermostatic control. A rapid addition was chosen to generate a high supersaturation peak and thereby capture the initial massive nucleation event.
Crystallization was carried out for 1 h under controlled stirring and temperature conditions, with real-time monitoring via FBRM to track the system’s evolution. Crystals were recovered by vacuum filtration, dried at 60 °C, and characterized. Each test was duplicated, showing consistent trends. For presentation purposes, the graphs include a representative experiment; however, a 5-period moving average was applied to smooth out experimental noise and highlight the overall trend.

2.3. Data Analysis

Online monitoring was performed using a Particle Track S400A FBRM® probe (Mettler Toledo, Giessen, Germany) equipped with focused beam reflectance technology. The probe was inserted directly into the reactor, 2 cm from the bottom, avoiding interference with the impeller. CLD data was recorded every 2 s.
For analysis, particles with chord lengths < 10 µm were classified as fines (f), and those between 50 and 150 µm as coarse (c). These thresholds distinguish newly formed nuclei from growing crystals, consistent with the CLDs, which exhibit characteristic peaks at or above 10 µm and 50 µm.
The induction time was operationally defined as the interval between reagent mixing and the detection of an abrupt increase in particle count by the FBRM probe, indicating the onset of nucleation.
It should be noted that the CLD obtained by FBRM does not precisely correspond to the particle size distribution (PSD), as it measures optical chord lengths affected by particle shape and orientation. However, since all particles in this study exhibited similar spherulitic morphologies, the CLD accurately reflected size changes. This was supported by SEM images, which confirmed agreement in the fine/coarse particle proportions. Therefore, FBRM data provided reliable insights into both kinetic and morphological trends.

2.4. Characterization

The obtained Li2CO3 crystals were separated by filtration under reduced pressure and dried in a desiccator for 24 h. They were subsequently observed using optical microscopy and characterized by scanning electron microscopy (SEM) on a JEOL JSM-6360 LV instrument (JEOL Ltd., Tokyo, Japan). X-ray diffraction (XRD) patterns were collected using a Siemens D-5000 diffractometer equipped with a monochromator and Cu Kα1 radiation (λ = 0.15406 nm). All measurements were performed at room temperature.

3. Results

3.1. Effect of Initial LiCl Concentration on Crystal Shape and Size in the Absence of Additives

Figure 1 presents the time evolution of fine (f, <10 µm) and coarse (c, 50–150 µm) Li2CO3 particles detected by FBRM during crystallization from 2, 3, and 4 M LiCl solutions without additives. All cases show an initial surge in fines due to supersaturation, followed by a decline and a rise in coarse particles, indicating crystal growth and aggregation. At 2 and 3 M (Figure 1a,b), fines decrease steadily while coarse particles grow. At 4 M (Figure 1c), fines reappear in the later stages, likely due to attrition or secondary nucleation.
These results indicate that a higher LiCl concentration favors the initial formation of excess fine particles, limiting the sustained growth of coarse particles. The increase in the number of coarse particles reflects both individual crystal growth and the formation of aggregates. Under very high supersaturation conditions (4 M), competitive growth and attrition processes explain the coexistence of many fines with a significant fraction of coarse particles.
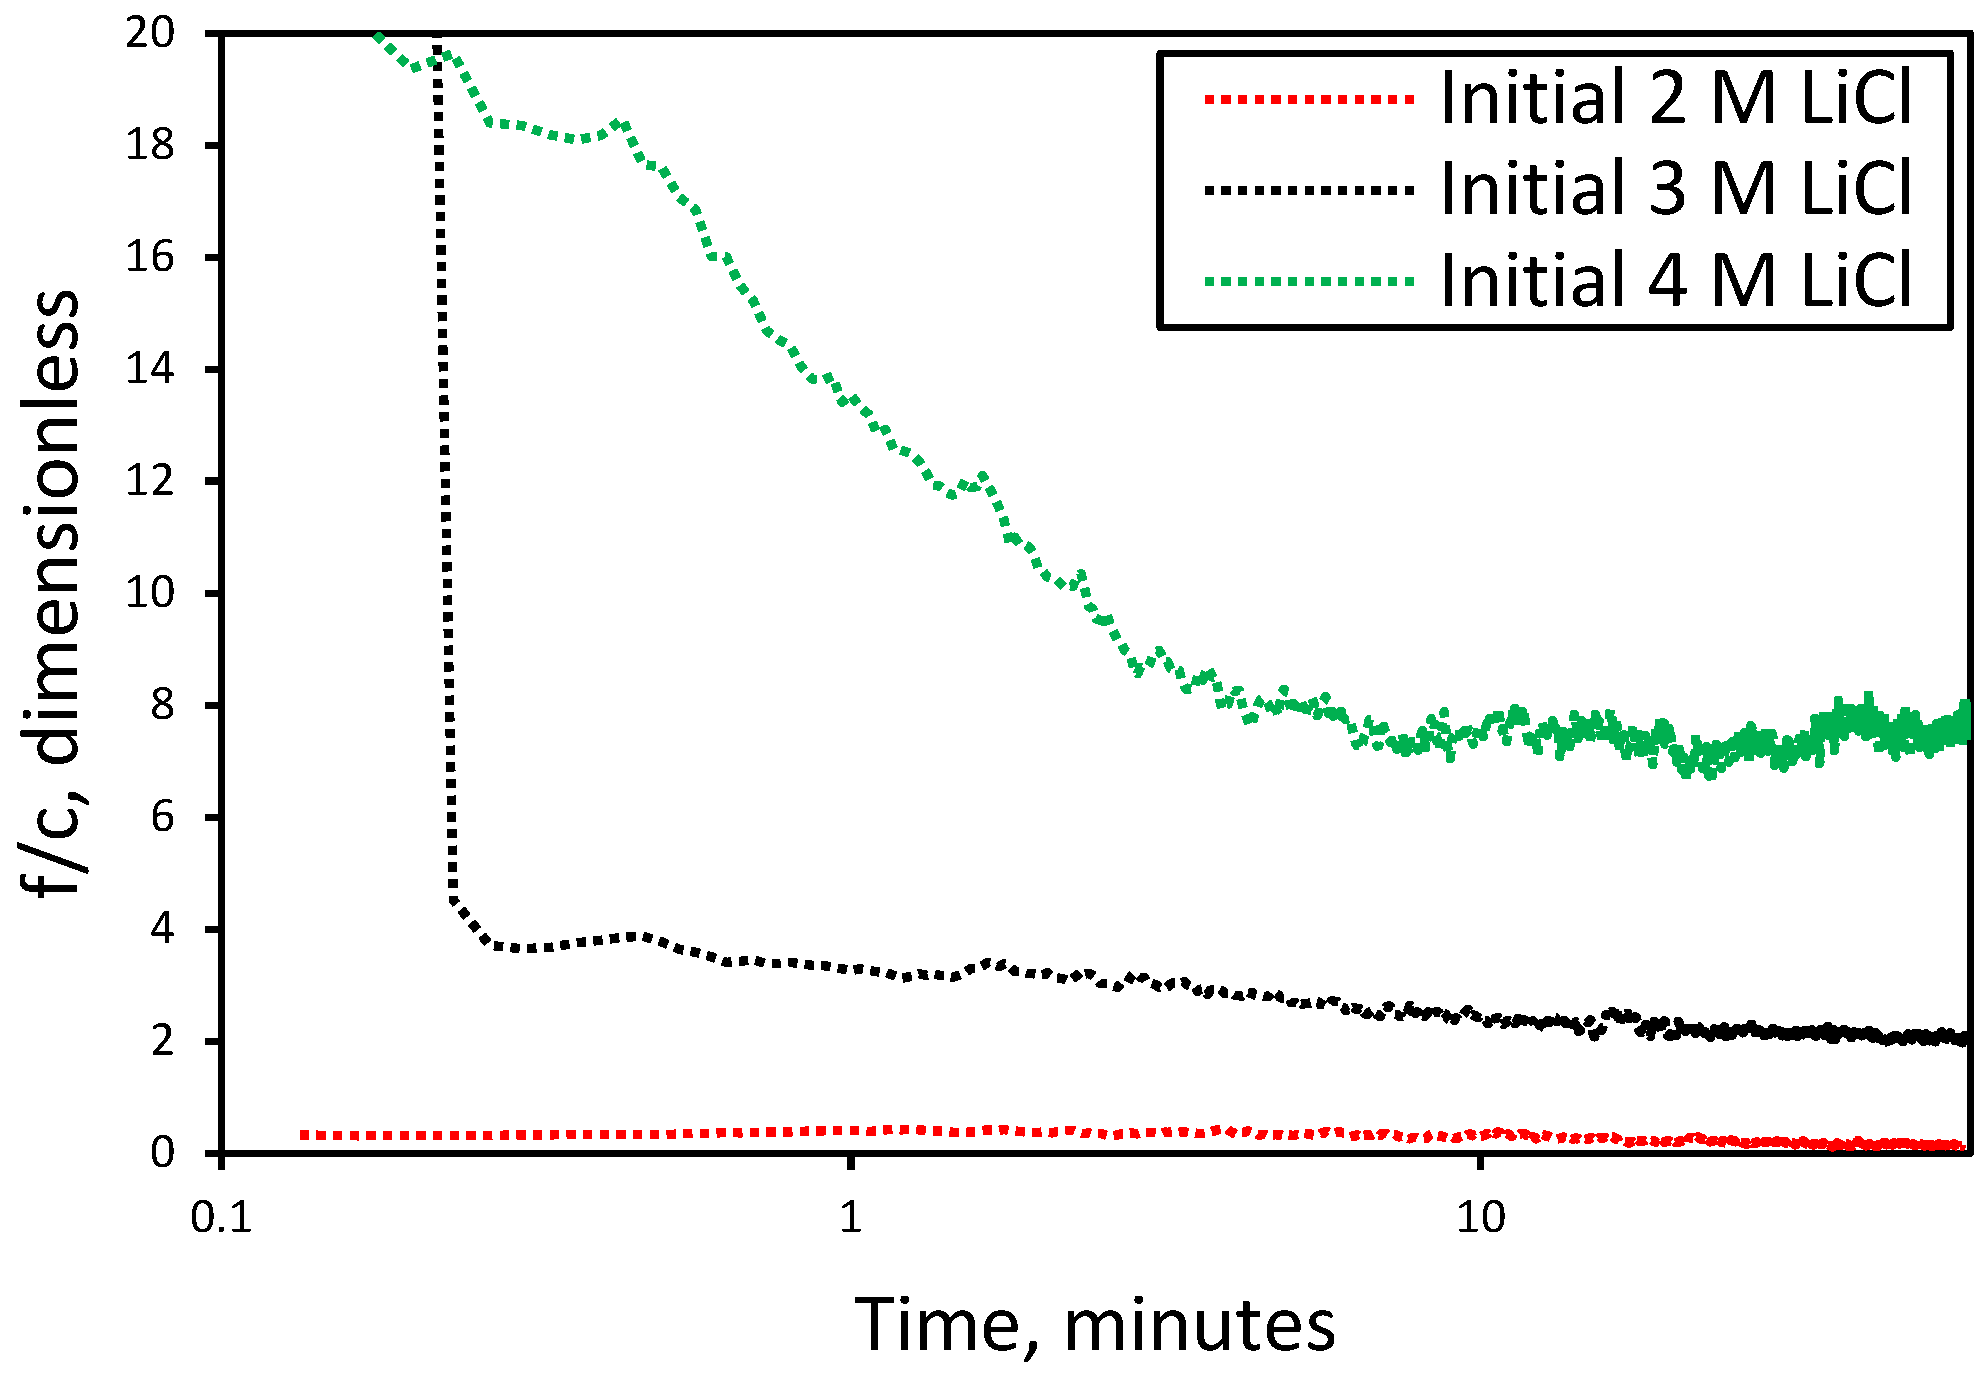
Figure 2 shows the temporal evolution of the fine-to-coarse particle ratio (f/c) for different initial LiCl concentrations, as a measure of the balance between nucleation and growth. At 2 M, f/c remains close to 1, indicating limited nucleation followed by predominant growth of a few crystals. At 3 M, f/c starts at a higher value (>1) due to more intense nucleation, but gradually decreases to ~1 as many of these nuclei grow into coarse particles. At 4 M, however, f/c reaches much higher values from the beginning and remains elevated, reflecting the massive generation of fines and their persistence through continued nucleation/attrition, without the dominance toward coarse particles being reversed. These results demonstrate that a higher initial supersaturation tilts the process toward abundant nucleation (many small crystals). In contrast, moderate supersaturation favors the sustained growth of a few crystals (a few large ones).
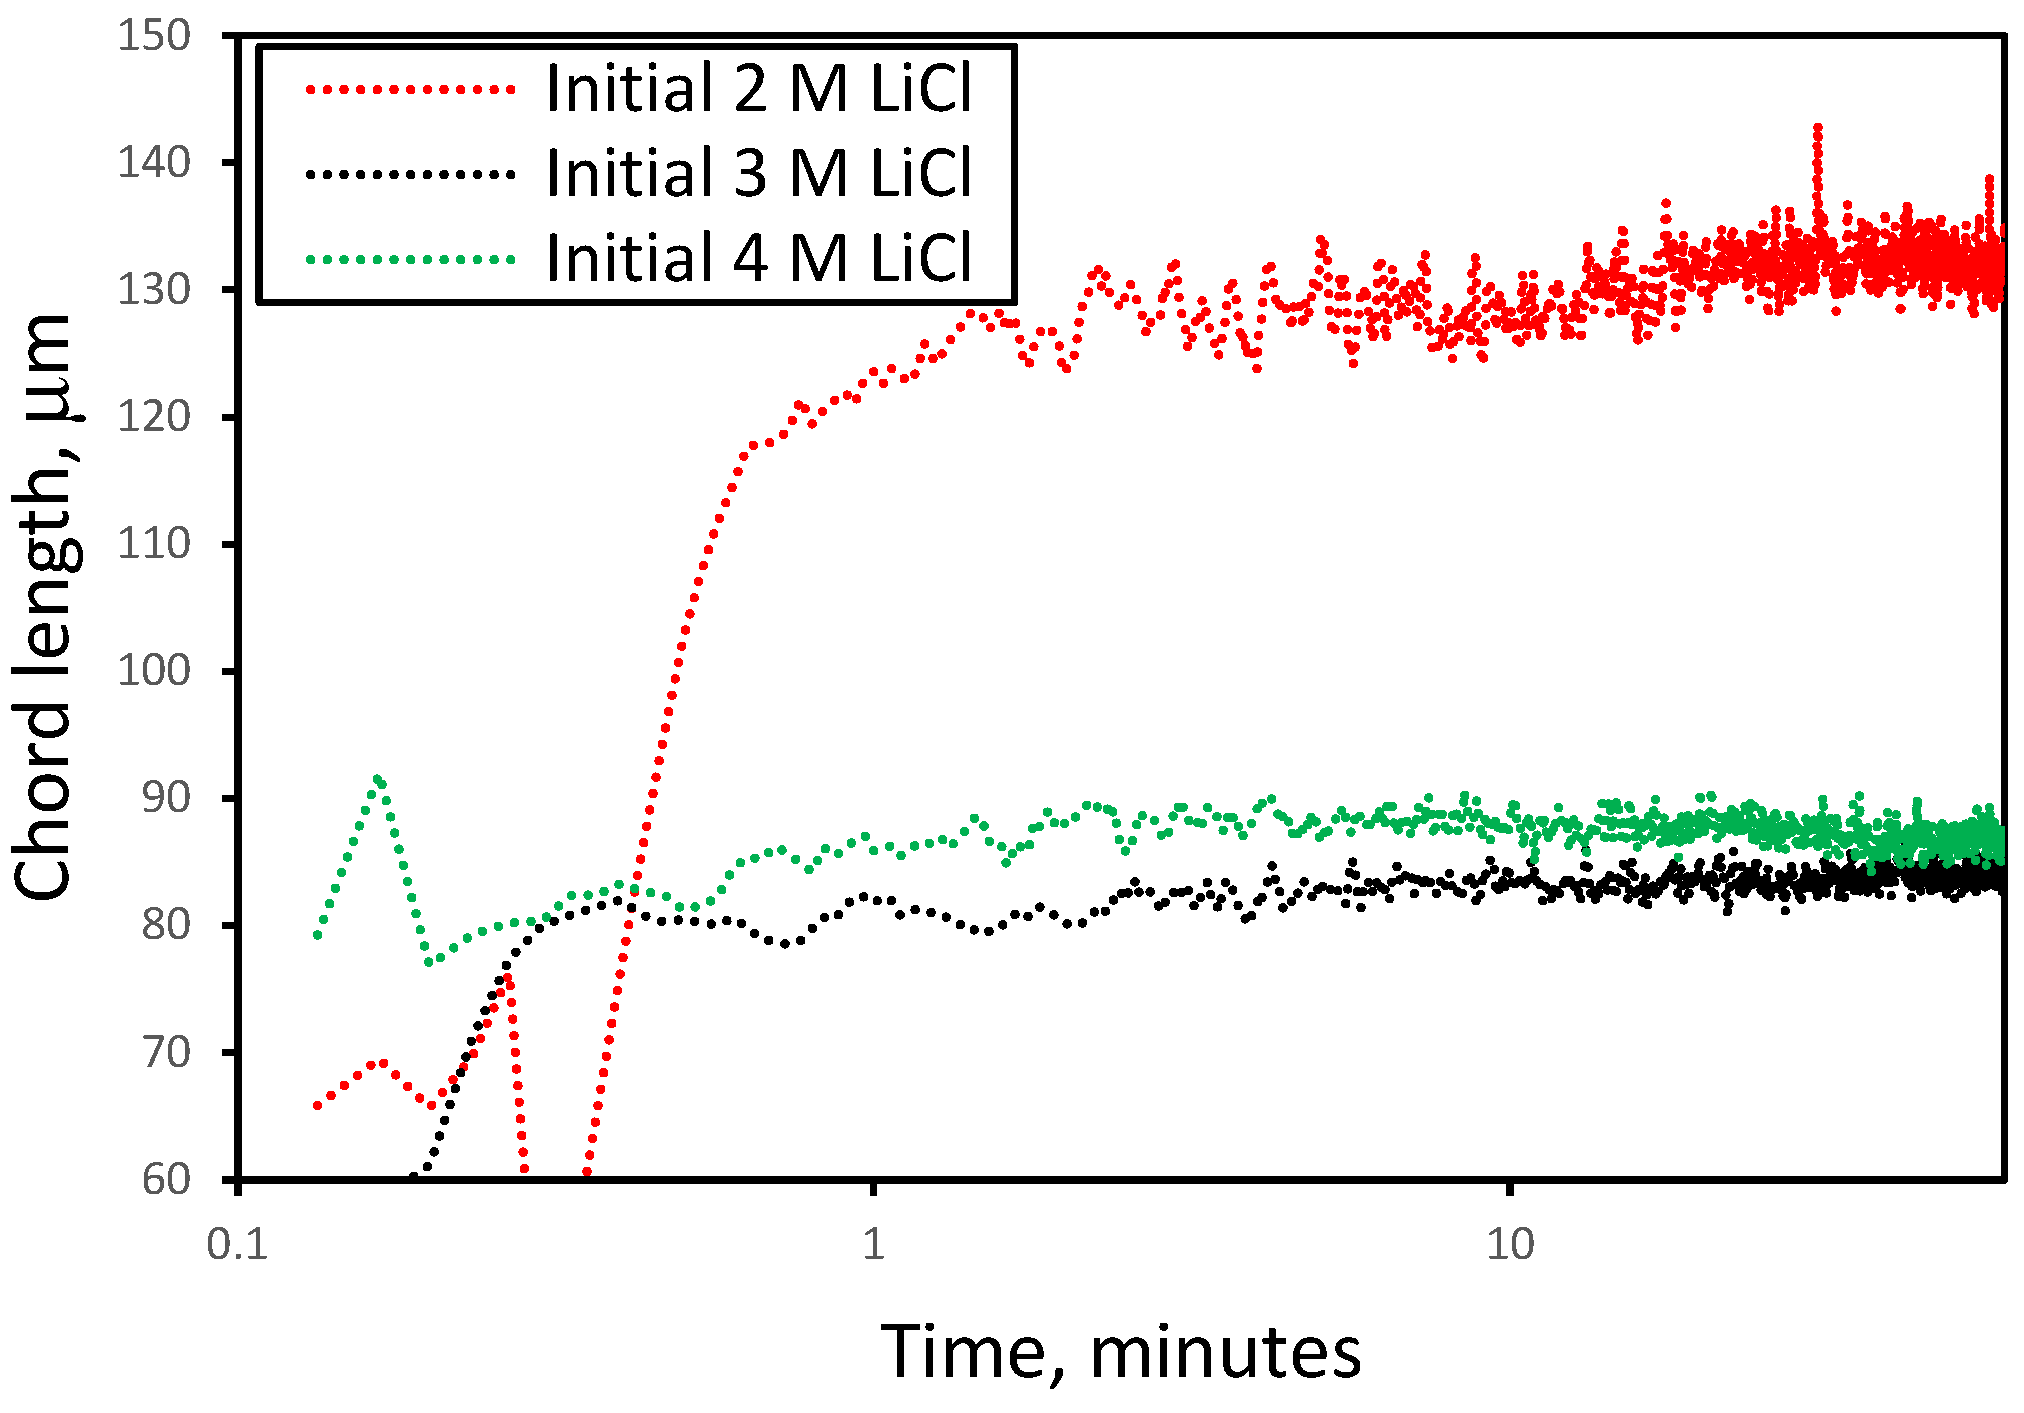
Figure 3 shows the evolution of the squared weighted mean size (MSW) for initial LiCl concentrations of 2, 3, and 4 M. In all cases, MSW rises sharply at early times, indicating rapid crystal growth after mixing. At 2 M, MSW continues increasing up to ~11 min, although coarse particles keep accumulating until 24 min (see Figure 1), suggesting a gradual stabilization of their influence on the mean. In contrast, MSW plateaus more quickly at 3 M and 4 M, with a higher value at 4 M. This is attributed to the presence of abundant ultrafine particles (~1–2 µm), which reduce the impact of intermediate sizes and amplify the relative contribution of coarse crystals to the weighted mean.
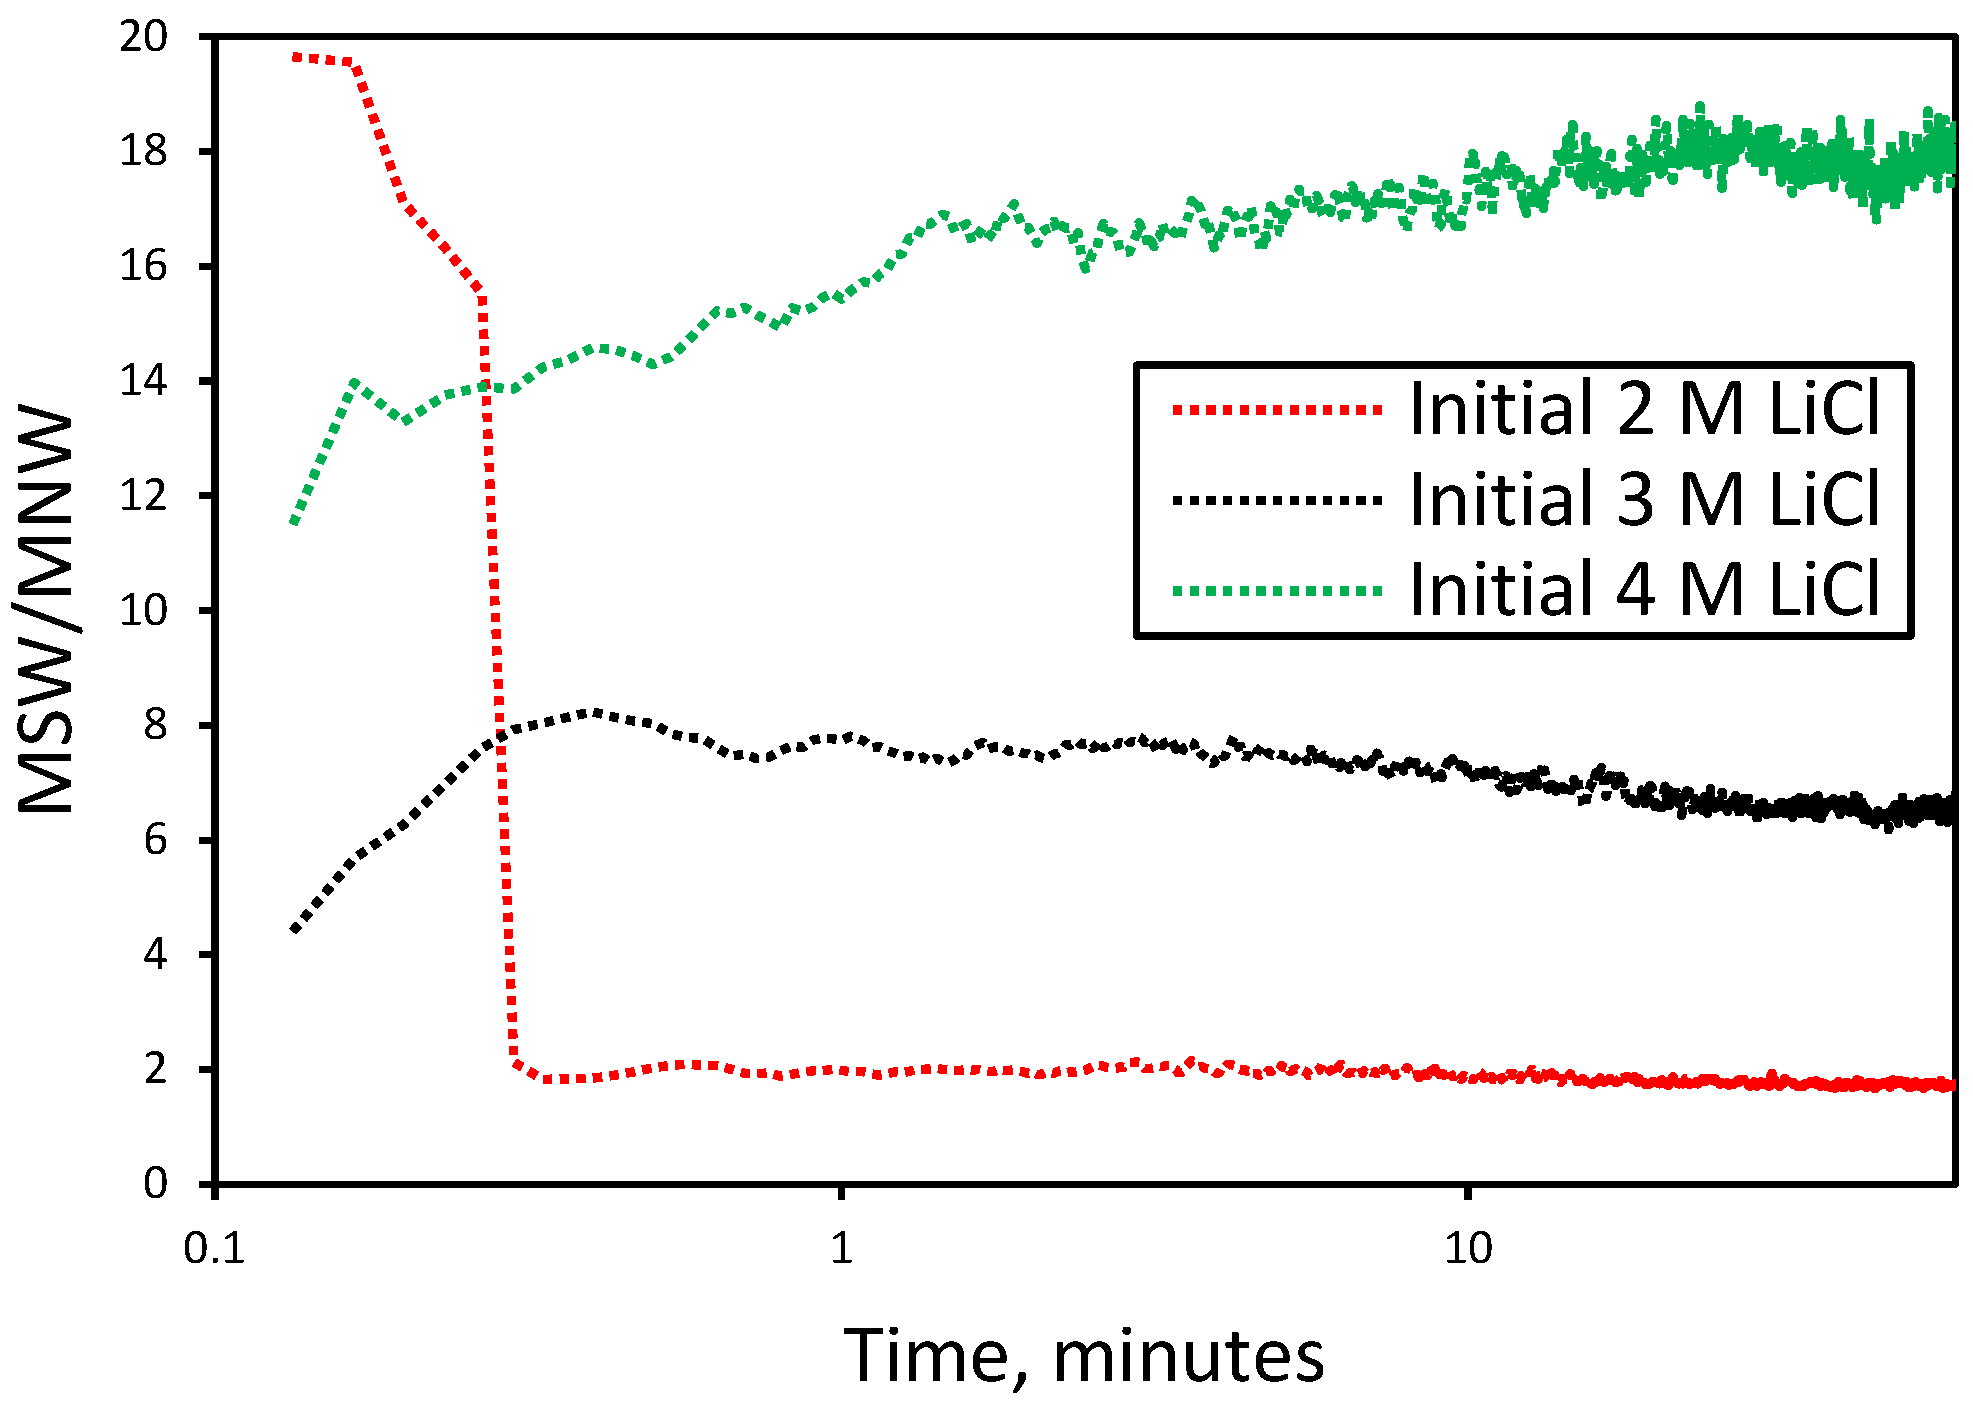
In the data obtained using the FBRM probe, two metrics are particularly relevant: the square-weighted mean chord length distribution (MSW) and the unweighted median (MNW). Their ratio (MSW/MNW) characterizes the shape of the size distribution and reveals tails skewed toward coarse particles. Values well above 1 indicate that a few large crystals or aggregates dominate the weighted mean, resulting in asymmetric or bimodal profiles. Conversely, values near 1 suggest a homogeneous distribution, consistent with uniform growth and the absence of atypical large particles.
In accordance with the above, Figure 4 shows that the MSW/MNW ratio was close to 1 under 2 M LiCl conditions, reflecting a narrow and homogeneous size distribution. At 3 M, MSW/MNW reached higher values (6–8 initially), indicating the presence of some crystals much larger than the population median. Finally, at 4 M, the MSW/MNW ratio reached its highest values (>10), confirming a strongly skewed distribution where numerous tiny crystals coexist with a few large ones. In this extreme case, although the majority are fine, the MSW is dominated by bulky, isolated crystals, resulting in a high MSW/MNW ratio. Taken together, these trends indicate that size uniformity decreases drastically with increasing supersaturation: low supersaturations produce crystals of more uniform size, whereas high supersaturations lead to bimodal or polydisperse populations consisting of fine and coarse crystals.
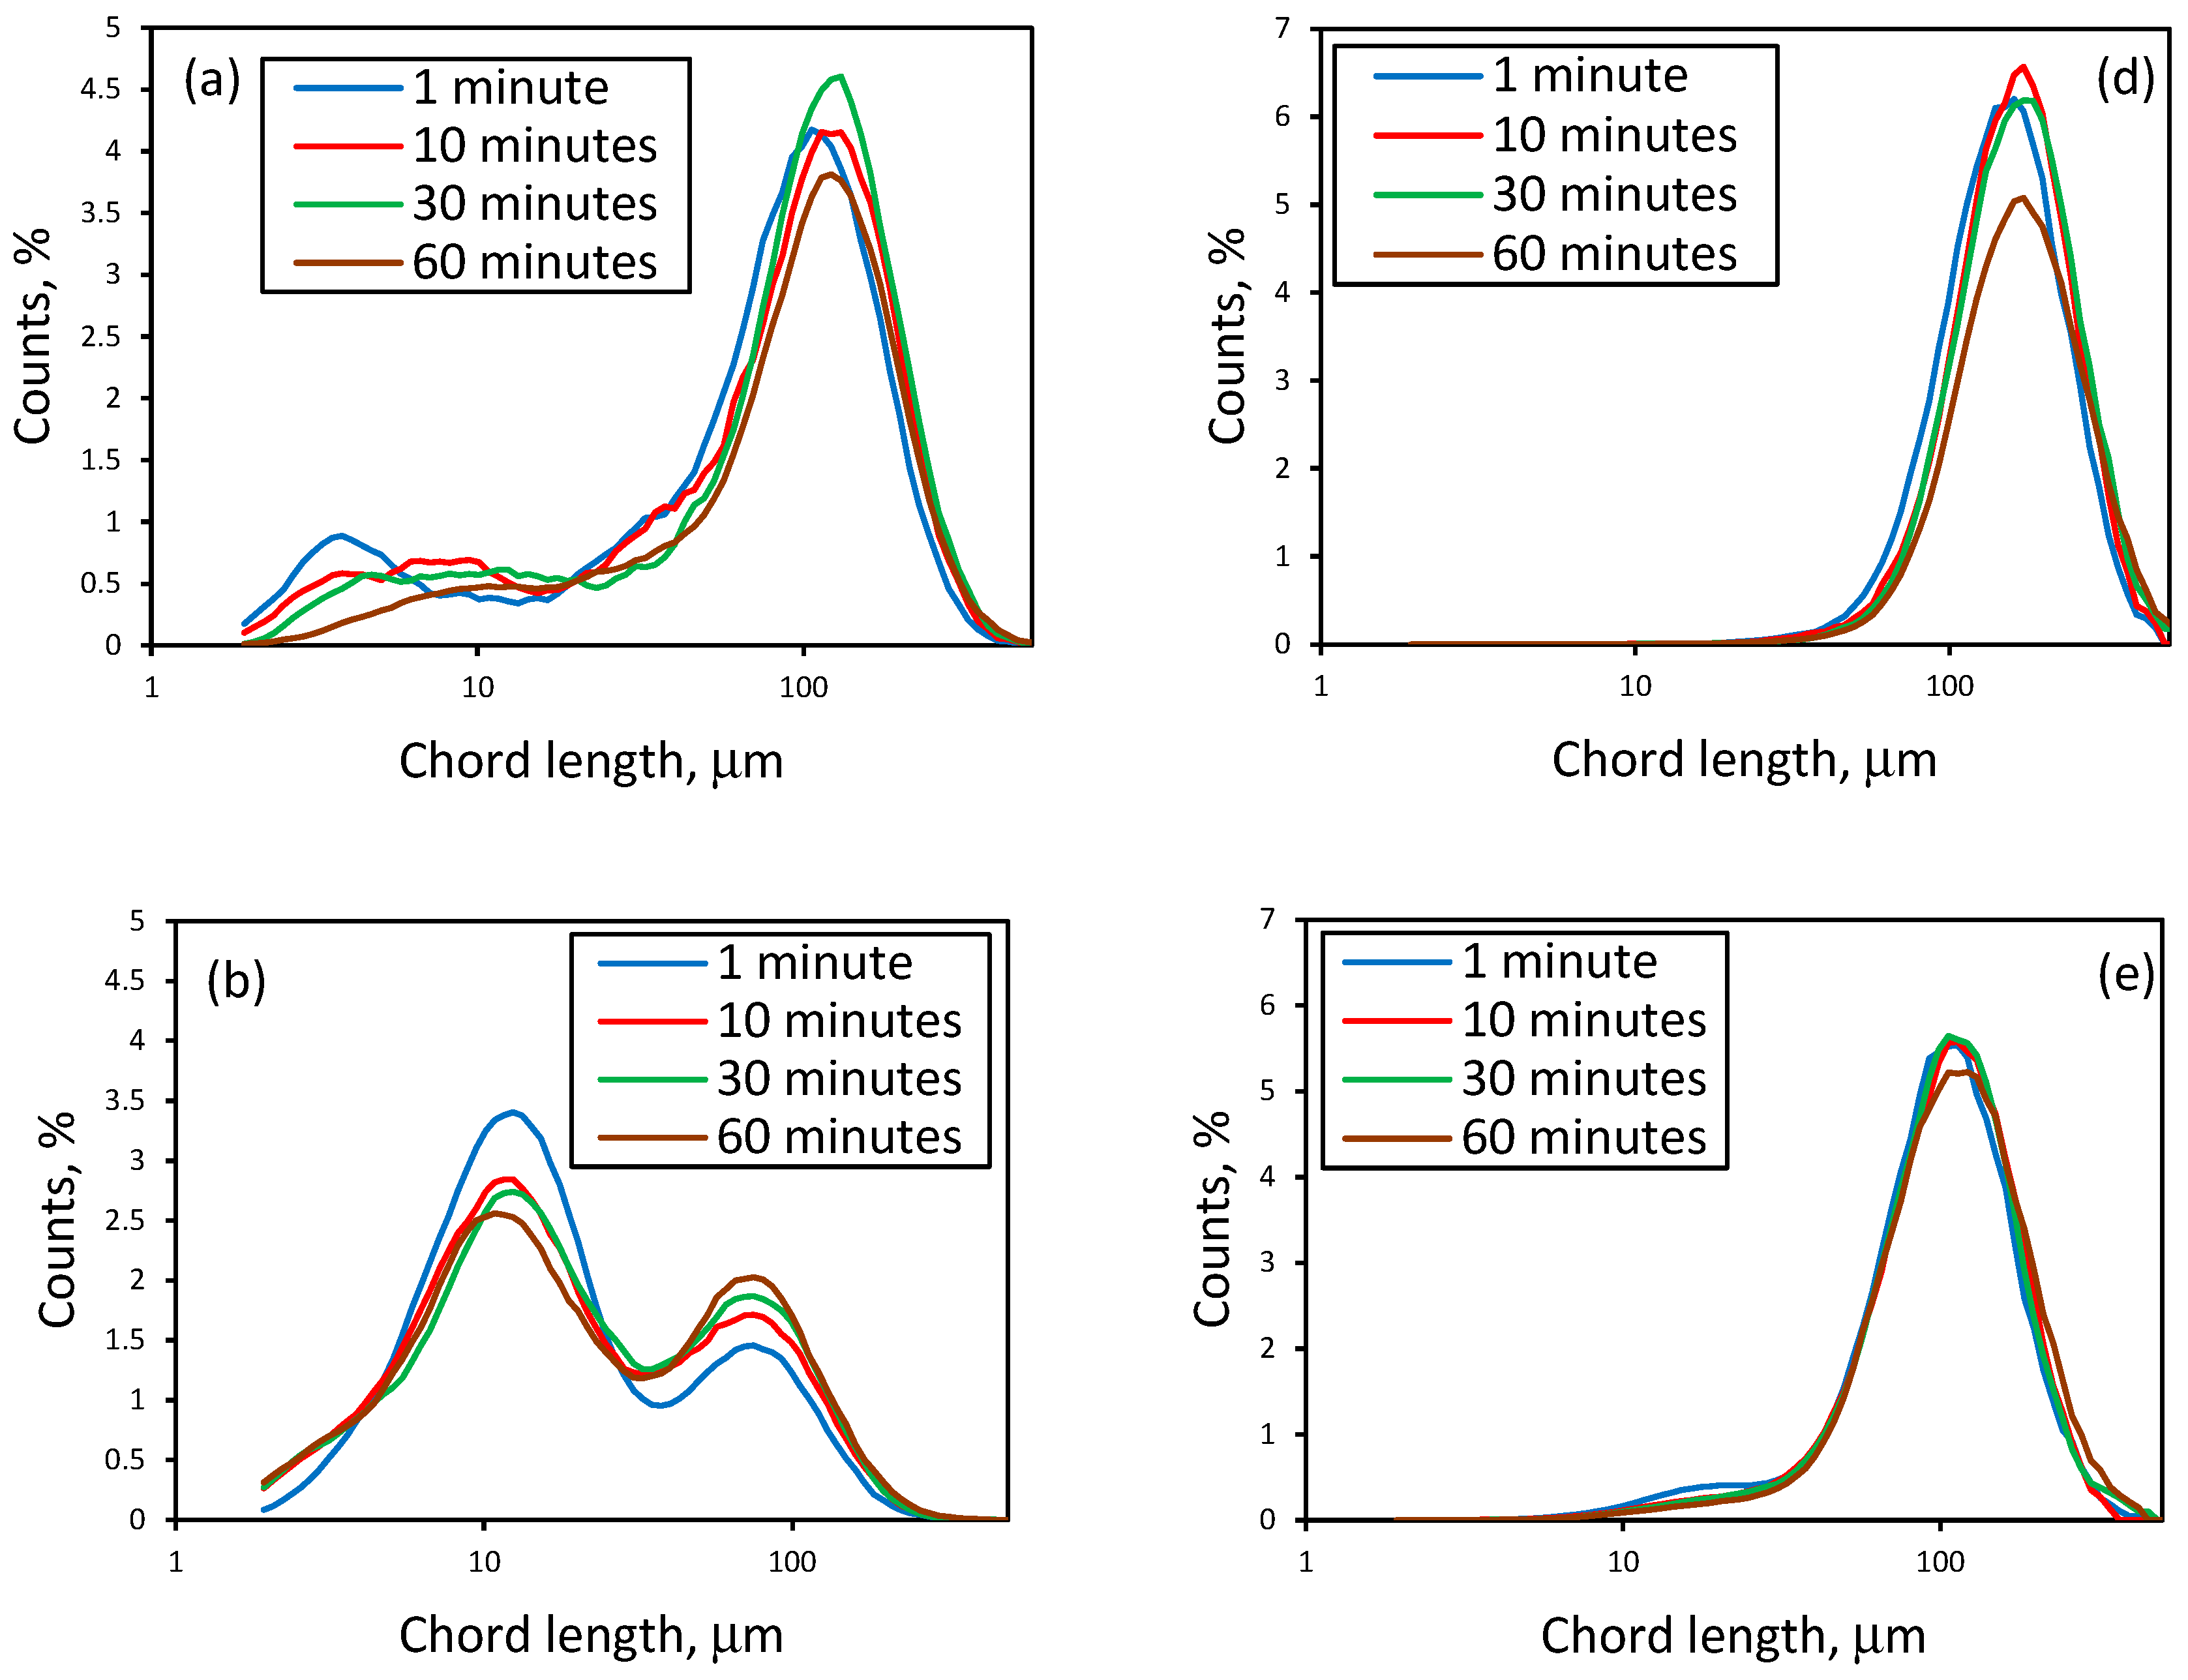
Figure 5 shows the temporal evolution of the unweighted and square-weighted chord length distributions (CLDs) for initial 2, 3, and 4 M LiCl solutions, recorded at 1, 10, 30, and 60 min.
At 2 M, the initial unweighted CLD is bimodal, with a small fines peak (<10 µm) and a dominant one near 100 µm, indicating early coexistence of small and large crystals. The low fines fraction suggests limited primary nucleation and dominant growth. Over time, the distribution becomes unimodal and shifts to larger sizes, reflecting growth and possible aggregation. In the square-weighted CLD, curves narrow and shift rightward, confirming growth- and aggregation-driven evolution with no significant secondary nucleation.
At 3 M, unweighted CLDs are bimodal from the start, with peaks around 10 µm (fines) and 100 µm (coarse). Higher initial supersaturation generates more fines than at 2 M, though large crystals persist, showing competition between nucleation and growth. Over time, the fines decrease while the coarse crystals increase, indicating the growth of small crystals. In the square-weighted CLD, coarse particles progressively dominate, with marginal fines. At 60 min, a slight left tail remains, but large crystals clearly prevail. Crystallization at 3 M involves more intense initial nucleation than at 2 M, followed by sustained growth and no evidence of attrition.
At 4 M, extreme supersaturation triggers intense primary nucleation, yielding abundant fines (2–3 µm) and few coarse crystals. The unweighted CLD shows a dominance of fines, while the square-weighted CLD indicates that coarse particles still set the average. Over time, coarse crystals increase, and ultrafine (<3 µm) particles emerge, suggesting attrition due to high solids and agitation, which explains the late spike in fines. Despite this, coarse particles remain dominant, though a slight drop between 30 and 60 min reflects attrition effects.
Overall, Figure 5 illustrates how the evolution of CLD reflects the effect of initial supersaturation on crystallization mechanisms. At 2 M, controlled and sustained growth predominates. At 3 M, a combination of intense initial nucleation followed by uniform growth is observed. At 4 M, the process is characterized by massive nucleation, partial growth, and attrition, resulting in the coexistence of extreme populations of fines and coarse particles.

3.2. Nucleation and Crystallization Growth Rates of Lithium Carbonate

The modal or mean value of the square-weighted chord length (MSW) is comparable to conventional particle sizing methods within the 50–400 µm range, as reported by Heath et al. [44]. Based on this, population density can be estimated and used in crystallization kinetic studies from CLD data, moments of order j (μj) [45]. However, the FBRM probe includes these moments directly, enabling real-time analysis. By applying the population balance equation, it is possible to formulate ordinary differential equations that allow for determining both nucleation and growth rates, as well as suspension density, as a function of time. To achieve this, the conversion of CLD data to squared weighted chord lengths is considered.
The nucleation rate ( B ) is estimated from the 0 th order moment 0 ( μ 0 ) obtained after the CLD conversion, according to the following expression [46]:
d μ 0 d t = B
The crystal growth rate ( G ) is determined from moments 0 and 1 , according to the following equation:
1 μ 0 d μ 1 d t = G
where μ 1 corresponds to the moment of order 1 .
Thus, using the real-time values of μ 0 and μ 1 by the FBRM, Equations (1) and (2) yield B ( t ) and G ( t ) throughout the experiment, reflecting the emergence of new particles and the average size increase, respectively. It should be noted that these rates correspond to apparent magnitudes based on particle counts and chord lengths (rather than the absolute number of crystals or the linear growth rate of specific crystal faces). Still, they are highly valuable for comparative kinetic analysis under varying conditions.
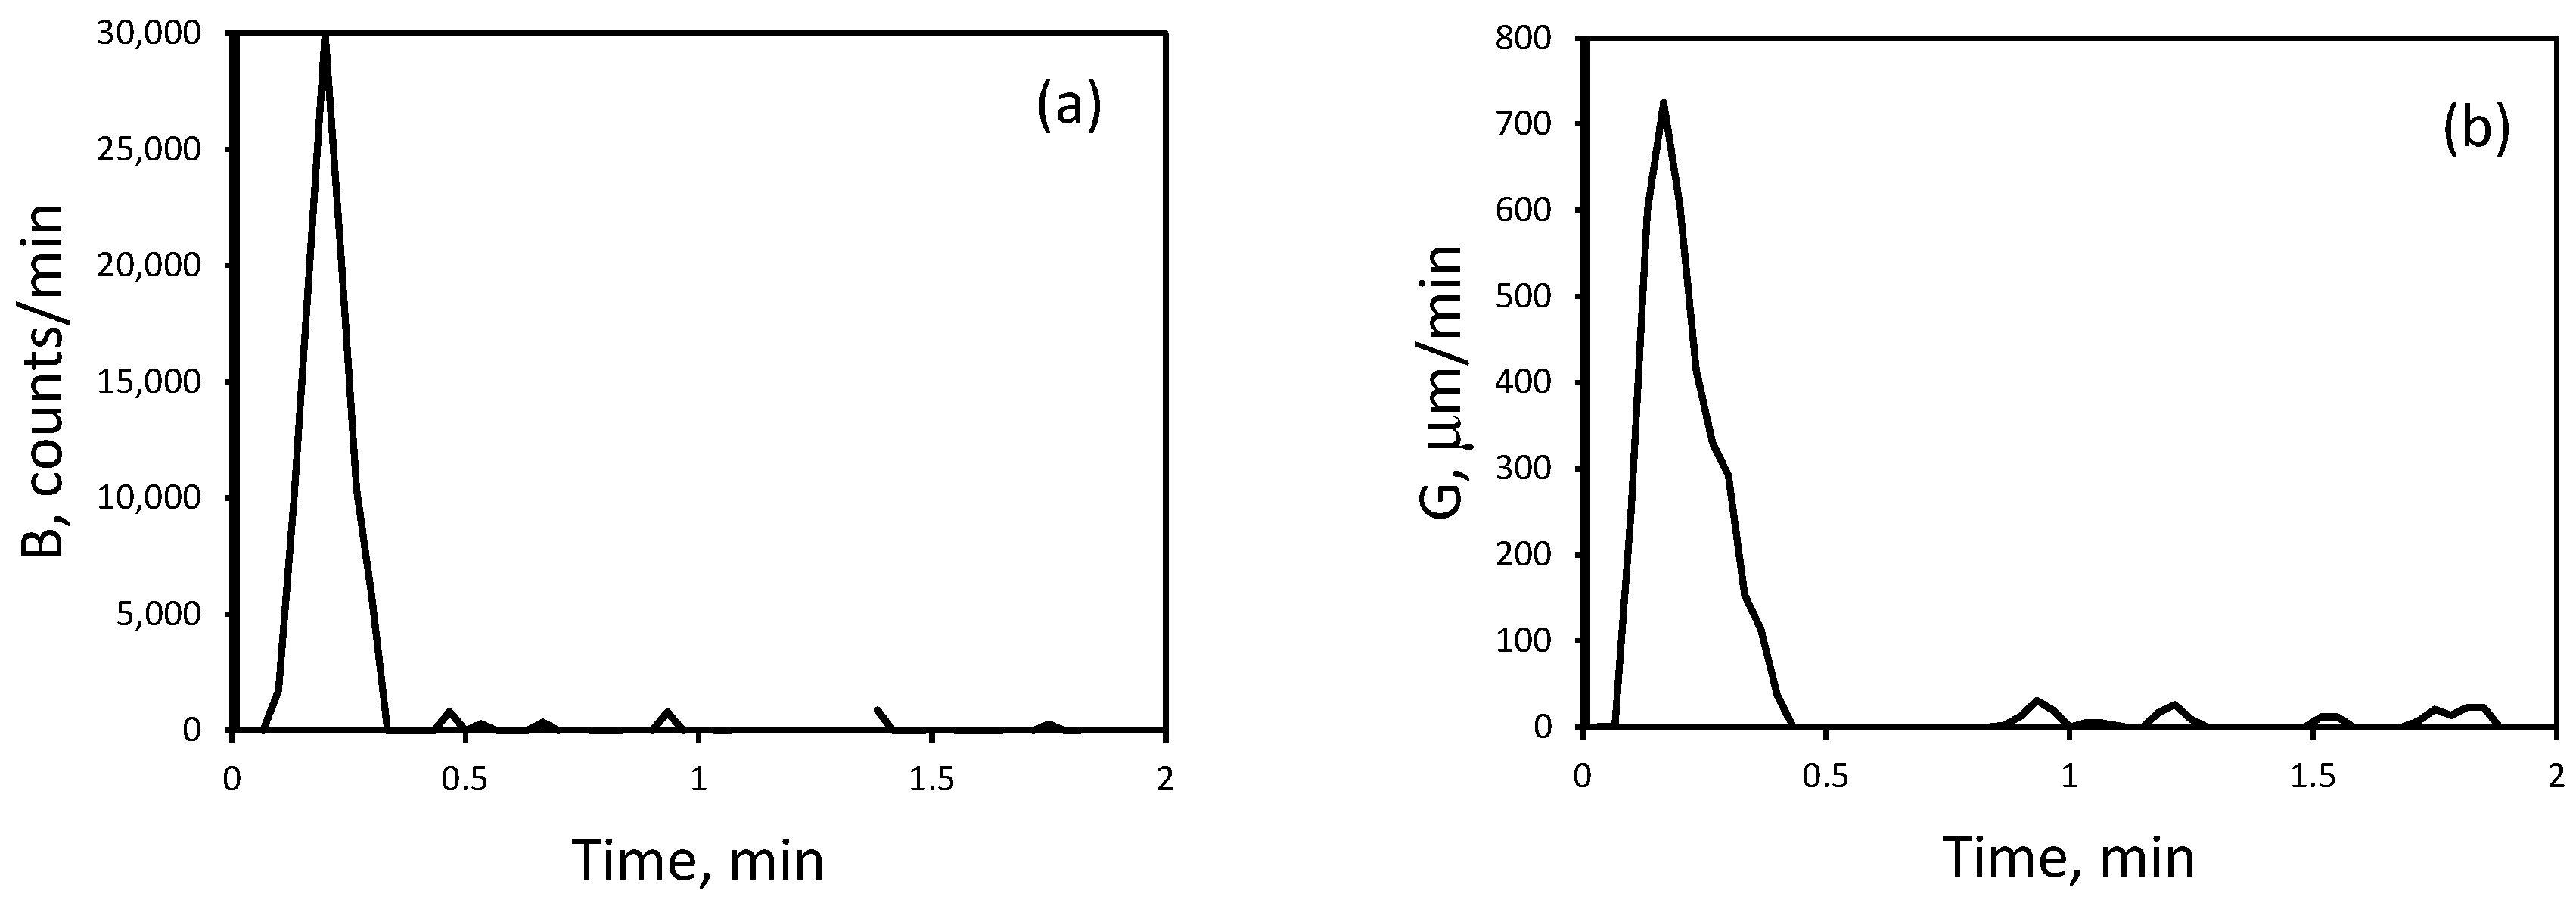
Figure 6 shows the Li2CO3 nucleation and growth rates at 2 M LiCl, calculated using Equations (1) and (2), with 2-s intervals and FBRM-derived moments. At 2 M, maximum rates reached ~30,000 counts/min (nucleation) and ~750 µm/min (growth), both around 10 s, reflecting very rapid kinetics. As summarized in Table 2, these values increase with LiCl concentration: ~60,000 counts/min and ~1500 µm/min at 3 M, and over ~100,000 counts/min and ~3000 µm/min at 4 M. Furthermore, it is observed that these rates are reached almost immediately upon mixing the solutions, in contrast to more dilute conditions, where growth is prolonged and crystals have more time to develop.
According to classical nucleation theory (CNT), higher supersaturation lowers the energy barrier and promotes primary nucleation [47]. Consequently, concentrated systems yield many small nuclei, while low supersaturation favors the growth of fewer crystals. Growth rate also depends on supersaturation. In the case of Li2CO3 in aqueous solution, the growth rate has been reported to be proportional to the square of the supersaturation [18]. Therefore, high supersaturation leads to rapid growth, whereas milder conditions result in fewer but larger crystals. A similar trend has been reported for CaCO3 [48].
Under all conditions, nucleation and growth rates peak early and then decline toward zero. This results from the supersaturation pulse generated by mixing LiCl and Na2CO3, driving the system into the unstable region with rapid primary nucleation, particularly at 4 M. As supersaturation is consumed by initial nucleation and growth, the system shifts to the metastable zone, where crystal growth prevails and, occasionally, secondary nucleation.
This trend has been confirmed in other reactive systems. Real-time FBRM data show that, after mixing, fine particle counts rise sharply and then stabilize or decrease as supersaturation drops. For Li2CO3, Han et al. [49] reported that, under high supersaturation, the count of particles <10 µm increased within 2.8 min, whereas in dilute systems, this occurred at 5.1 min, indicating slower nucleation. Afterwards, counts of small and medium particles plateaued, reflecting that nucleation and growth are strongest in the early stages.
Although the dominant pattern is a monotonous decrease in velocities after the initial maximum, Figure 6 also shows small secondary oscillations or spikes. These fluctuations can be attributed to various phenomena:
(i)
Mechanically induced secondary nucleation, resulting from collisions between particles, the impeller, or the reactor walls, which generate microscopic fragments capable of acting as new nuclei [50].
(ii)
Localized dissolution of very small or unstable crystals, followed by recrystallization on lower-energy surfaces, temporarily increases the particle count.
(iii)
External perturbations, such as variations in stirring speed, impurities, or thermal fluctuations, transiently alter the supersaturation and trigger additional nucleation or breakage events.
The findings are consistent with the principles of classical nucleation and growth theory, which state that higher initial supersaturation leads to faster and more abundant nucleation, resulting in numerous small crystals, as discussed in Section 3.1. In contrast, lower supersaturation results in slower and more limited nucleation, allowing for the sustained growth of fewer crystals. Indeed, at high concentration (4 M), the low nucleation barrier triggered the rapid formation of numerous tiny nuclei, quickly depleting the solute and leaving little material for subsequent growth. Conversely, at a lower concentration (2 M), nucleation was less intense, and supersaturation was primarily consumed through extended crystal growth, resulting in larger particles. This inverse relationship between crystal number and size as a function of supersaturation is a well-established principle in crystallization and is clearly validated in the Li2CO3 system studied.

3.3. Effect of the Presence of Additives on the Reactive Crystallization of Lithium Carbonate

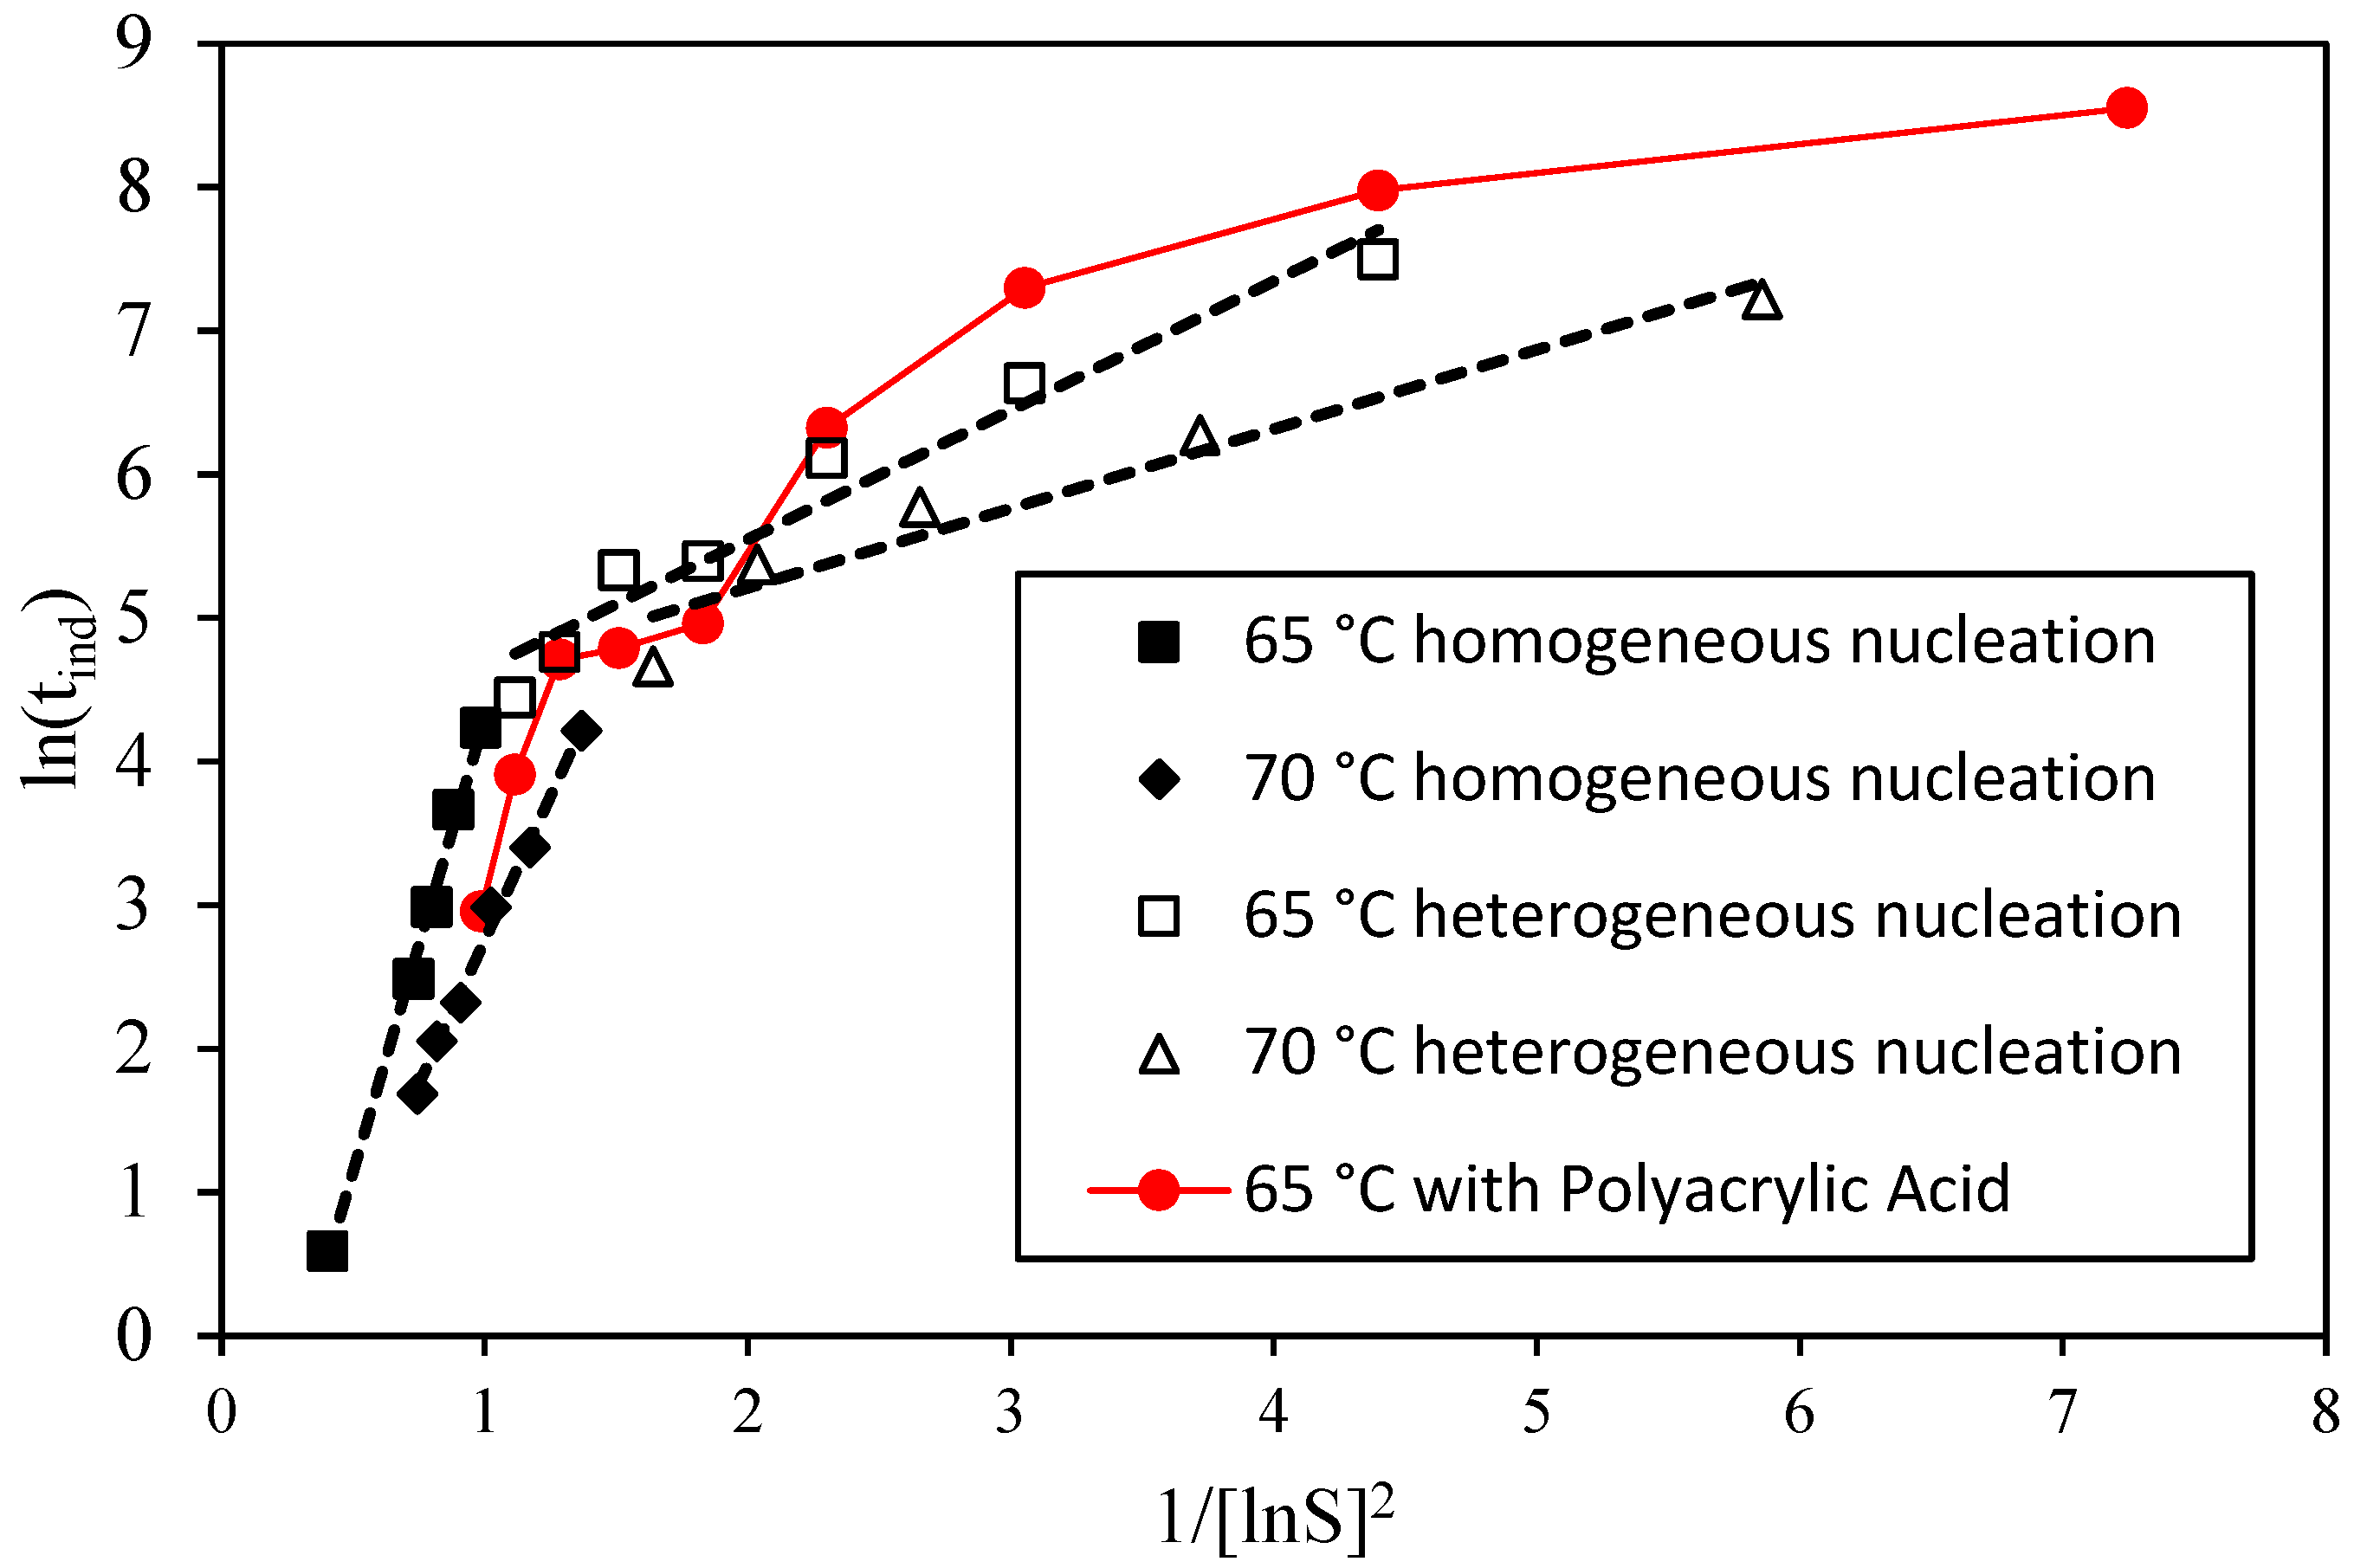
Classical nucleation theory (CNT) predicts a linear relationship between the logarithm of induction time and the inverse of the logarithm of squared relative supersaturation when stable nuclei govern the process [51]. High supersaturation promotes homogeneous nucleation, while low supersaturation favors heterogeneous mechanisms—trends confirmed for Li2CO3 by Zhao et al. [17] and Graber et al. [19]. In this study, tests at 65 and 70 °C with varying LiCl concentrations align with CNT (Figure 7). However, adding polyacrylic acid (Mw 230,000 g/mol) at 65 °C led to deviations, suggesting a modified nucleation mechanism, which is consistent with the findings of McDonald et al. [52].

3.4. Effect of Additives on Size and Size Distribution

Polyacrylic acid (PAA) additives affect both crystal morphology and Li2CO3 nucleation/growth kinetics, depending on their molecular weight. PAA can act by selectively adsorbing onto crystal faces, complexing solution ions, and altering particle agglomeration, with the extent of each mechanism linked to polymer chain length [26]. This section analyzes the influence of three PAA molecular weights (P1: 1800 Da; P2: 230,000 Da; P3: 450,000 Da on the reactive crystallization of Li2CO3 from LiCl and Na2CO3 at varying concentrations. The study examines their effect on (i) fine particle count (< 10 mm), (ii) coarse particle count (50–150 mm), (iii) fines/coarse ratio, (iv) squared weighted mean size (MSW), (v) MSW/MNW ratio, (vi) unweighted chord length distribution (CLD) and (vii) squared weighted CLD.
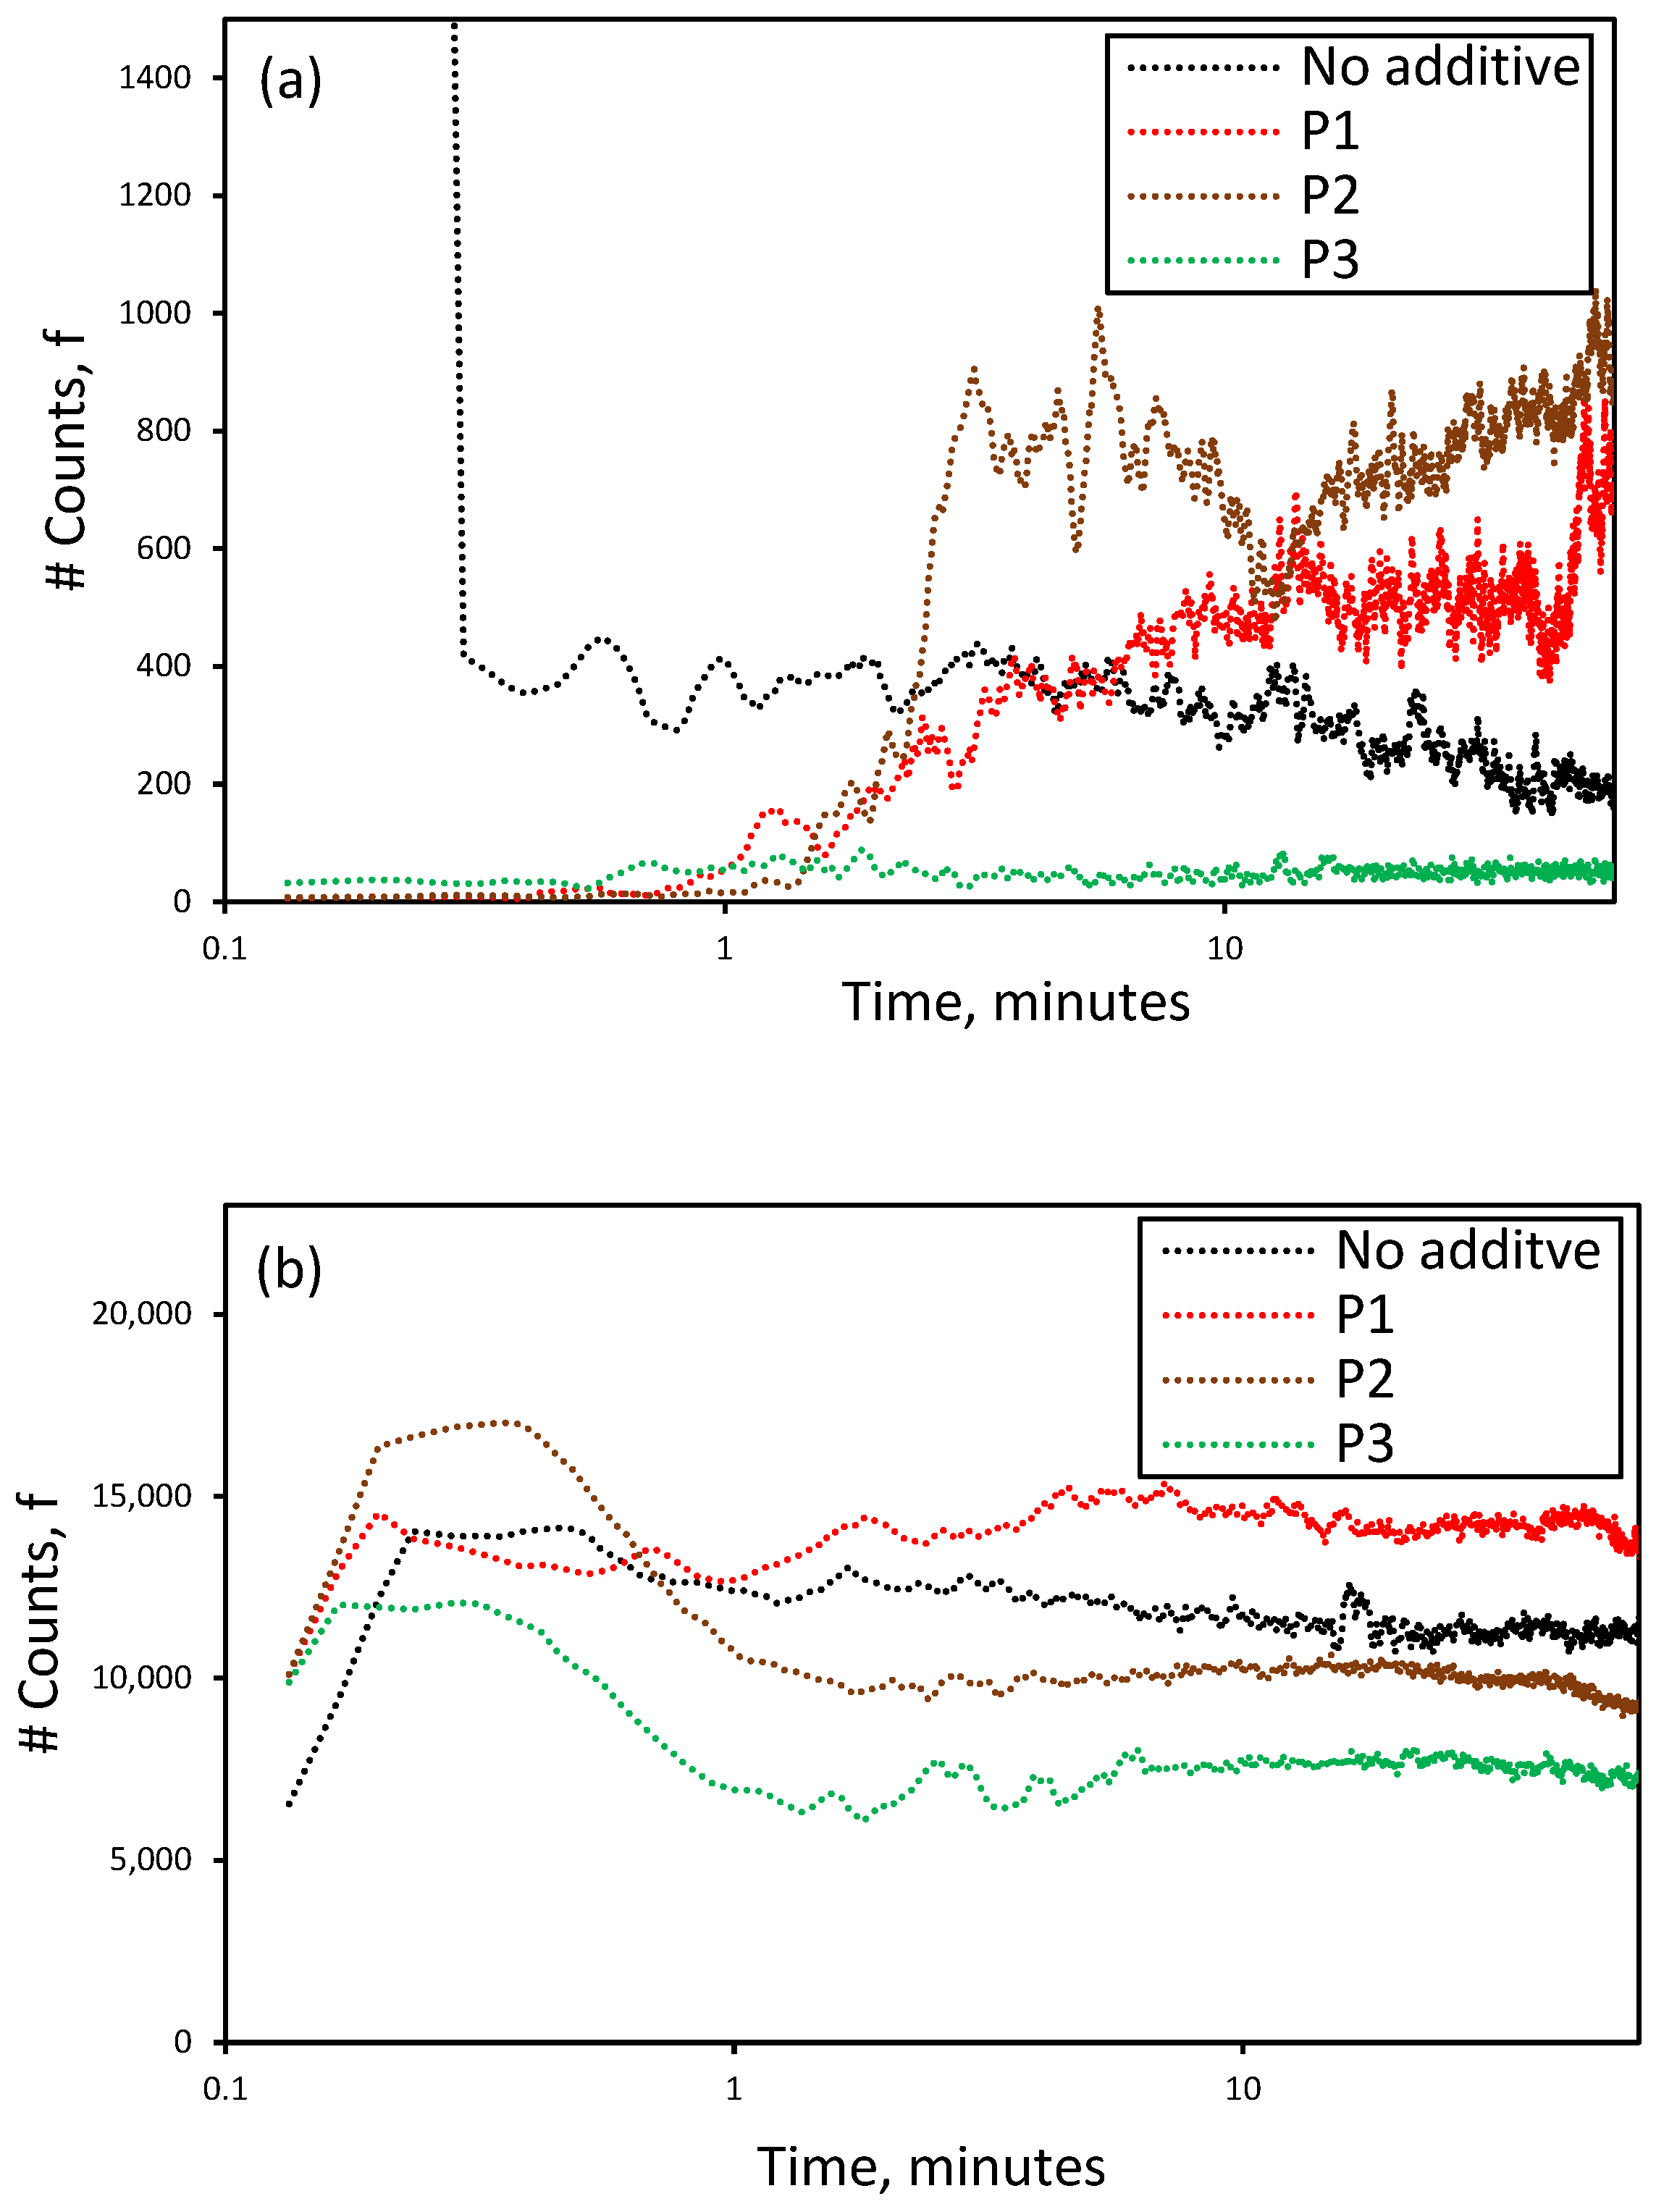
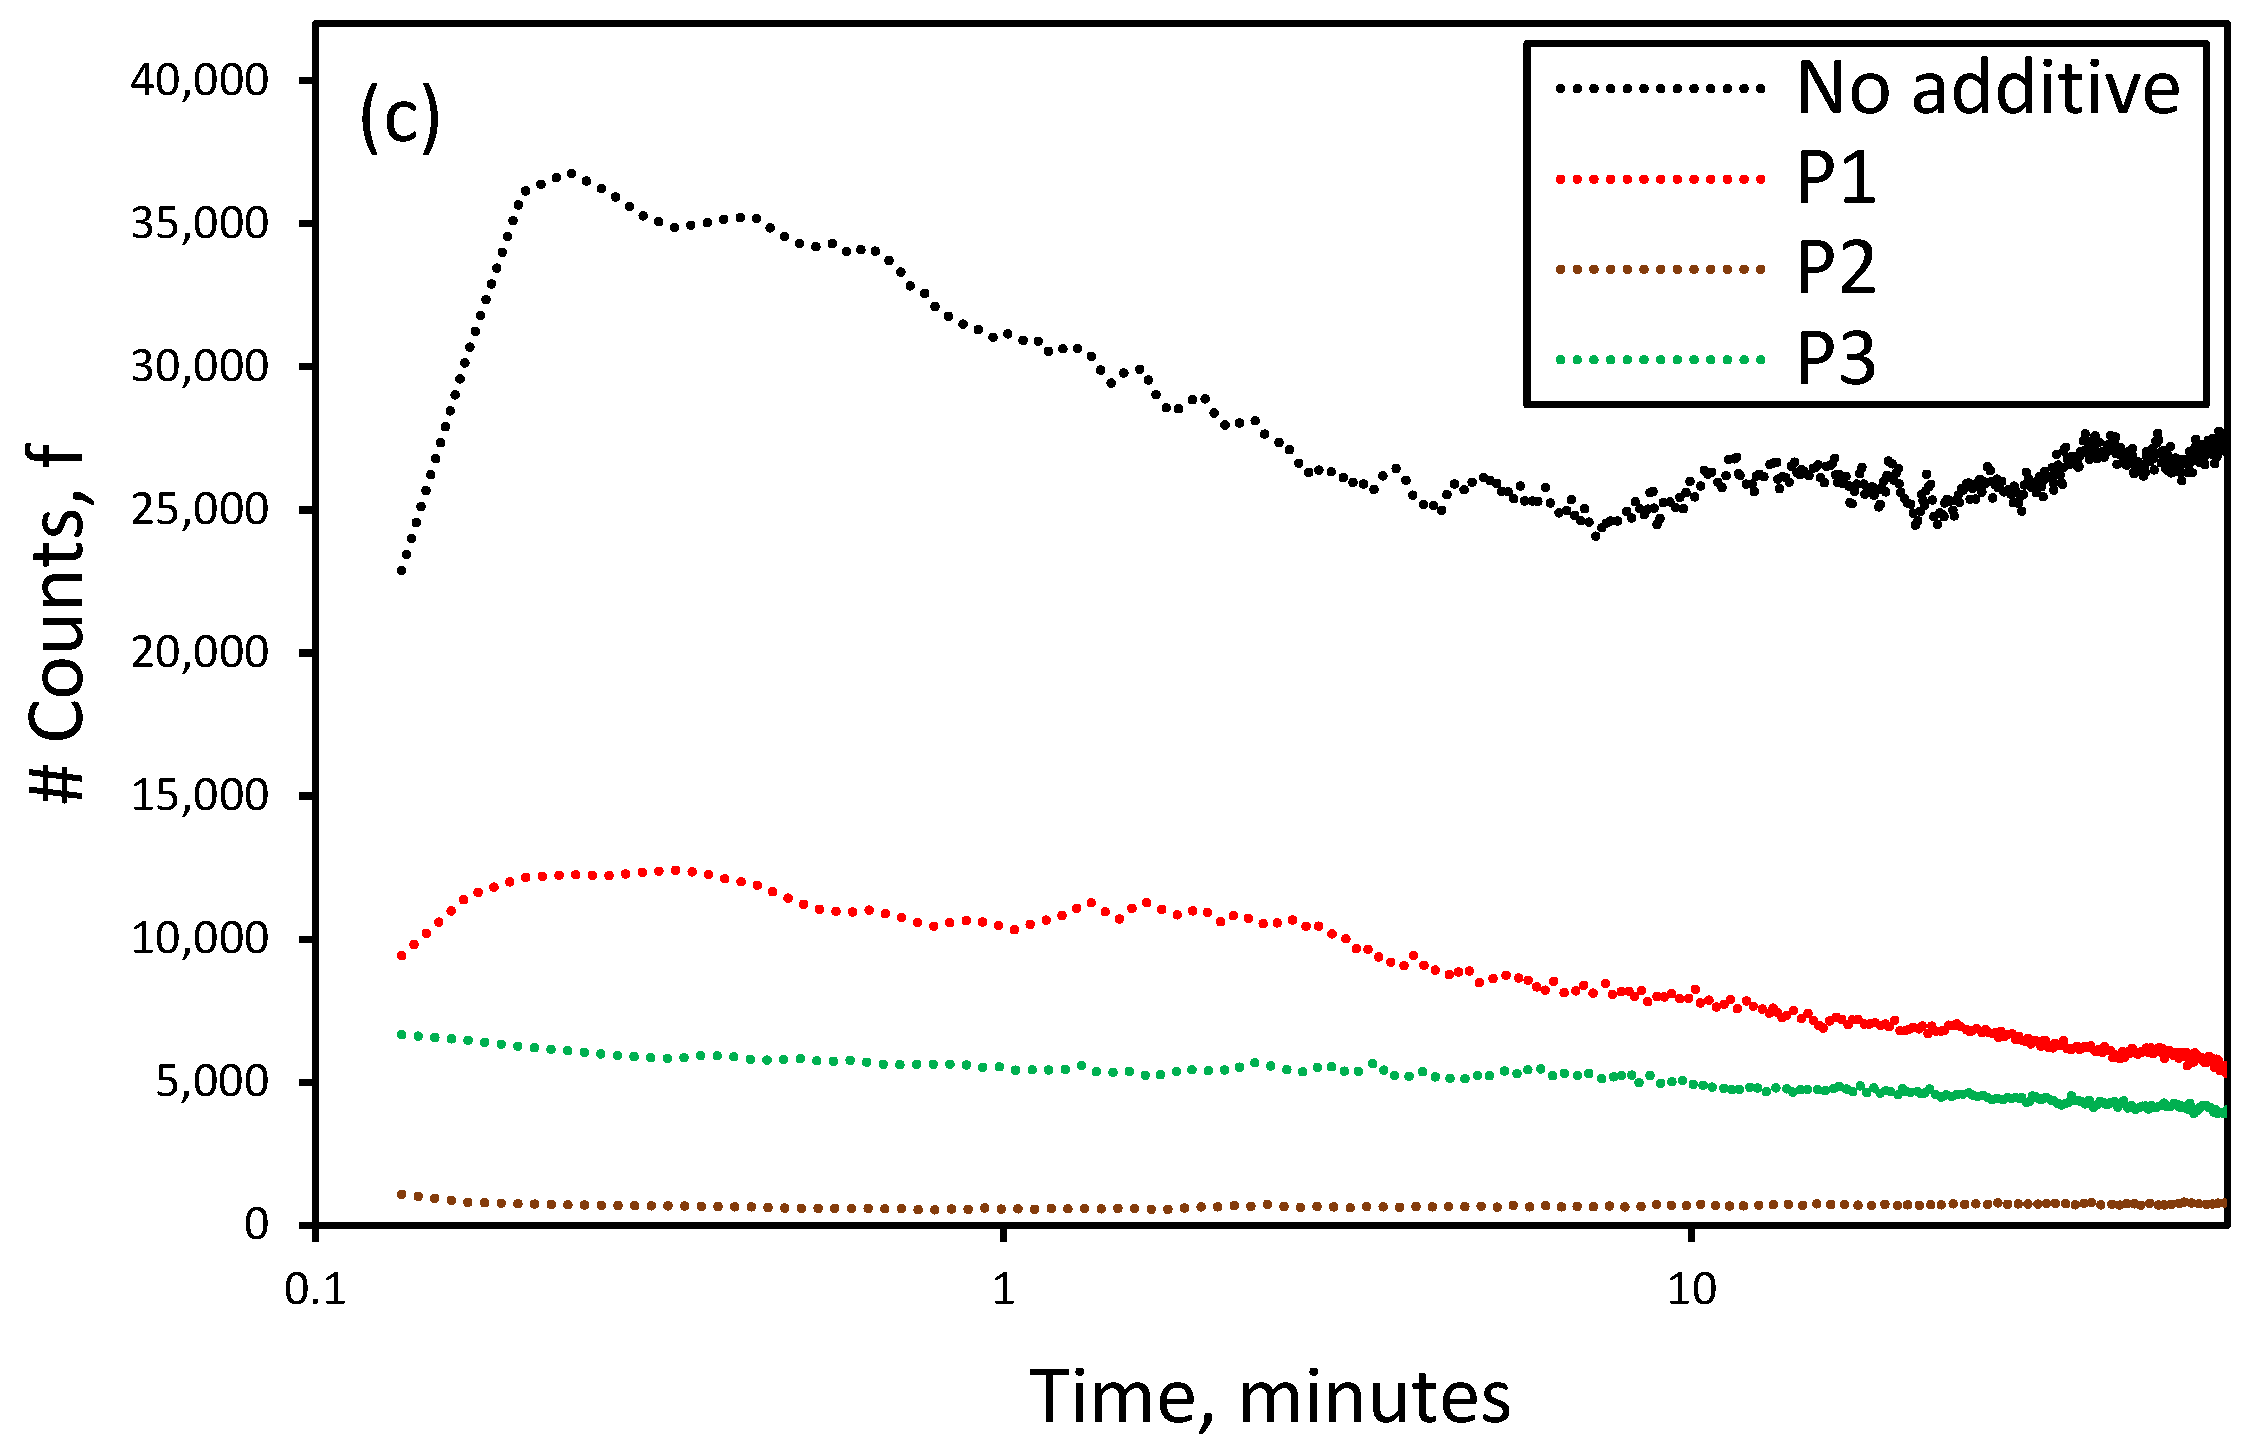
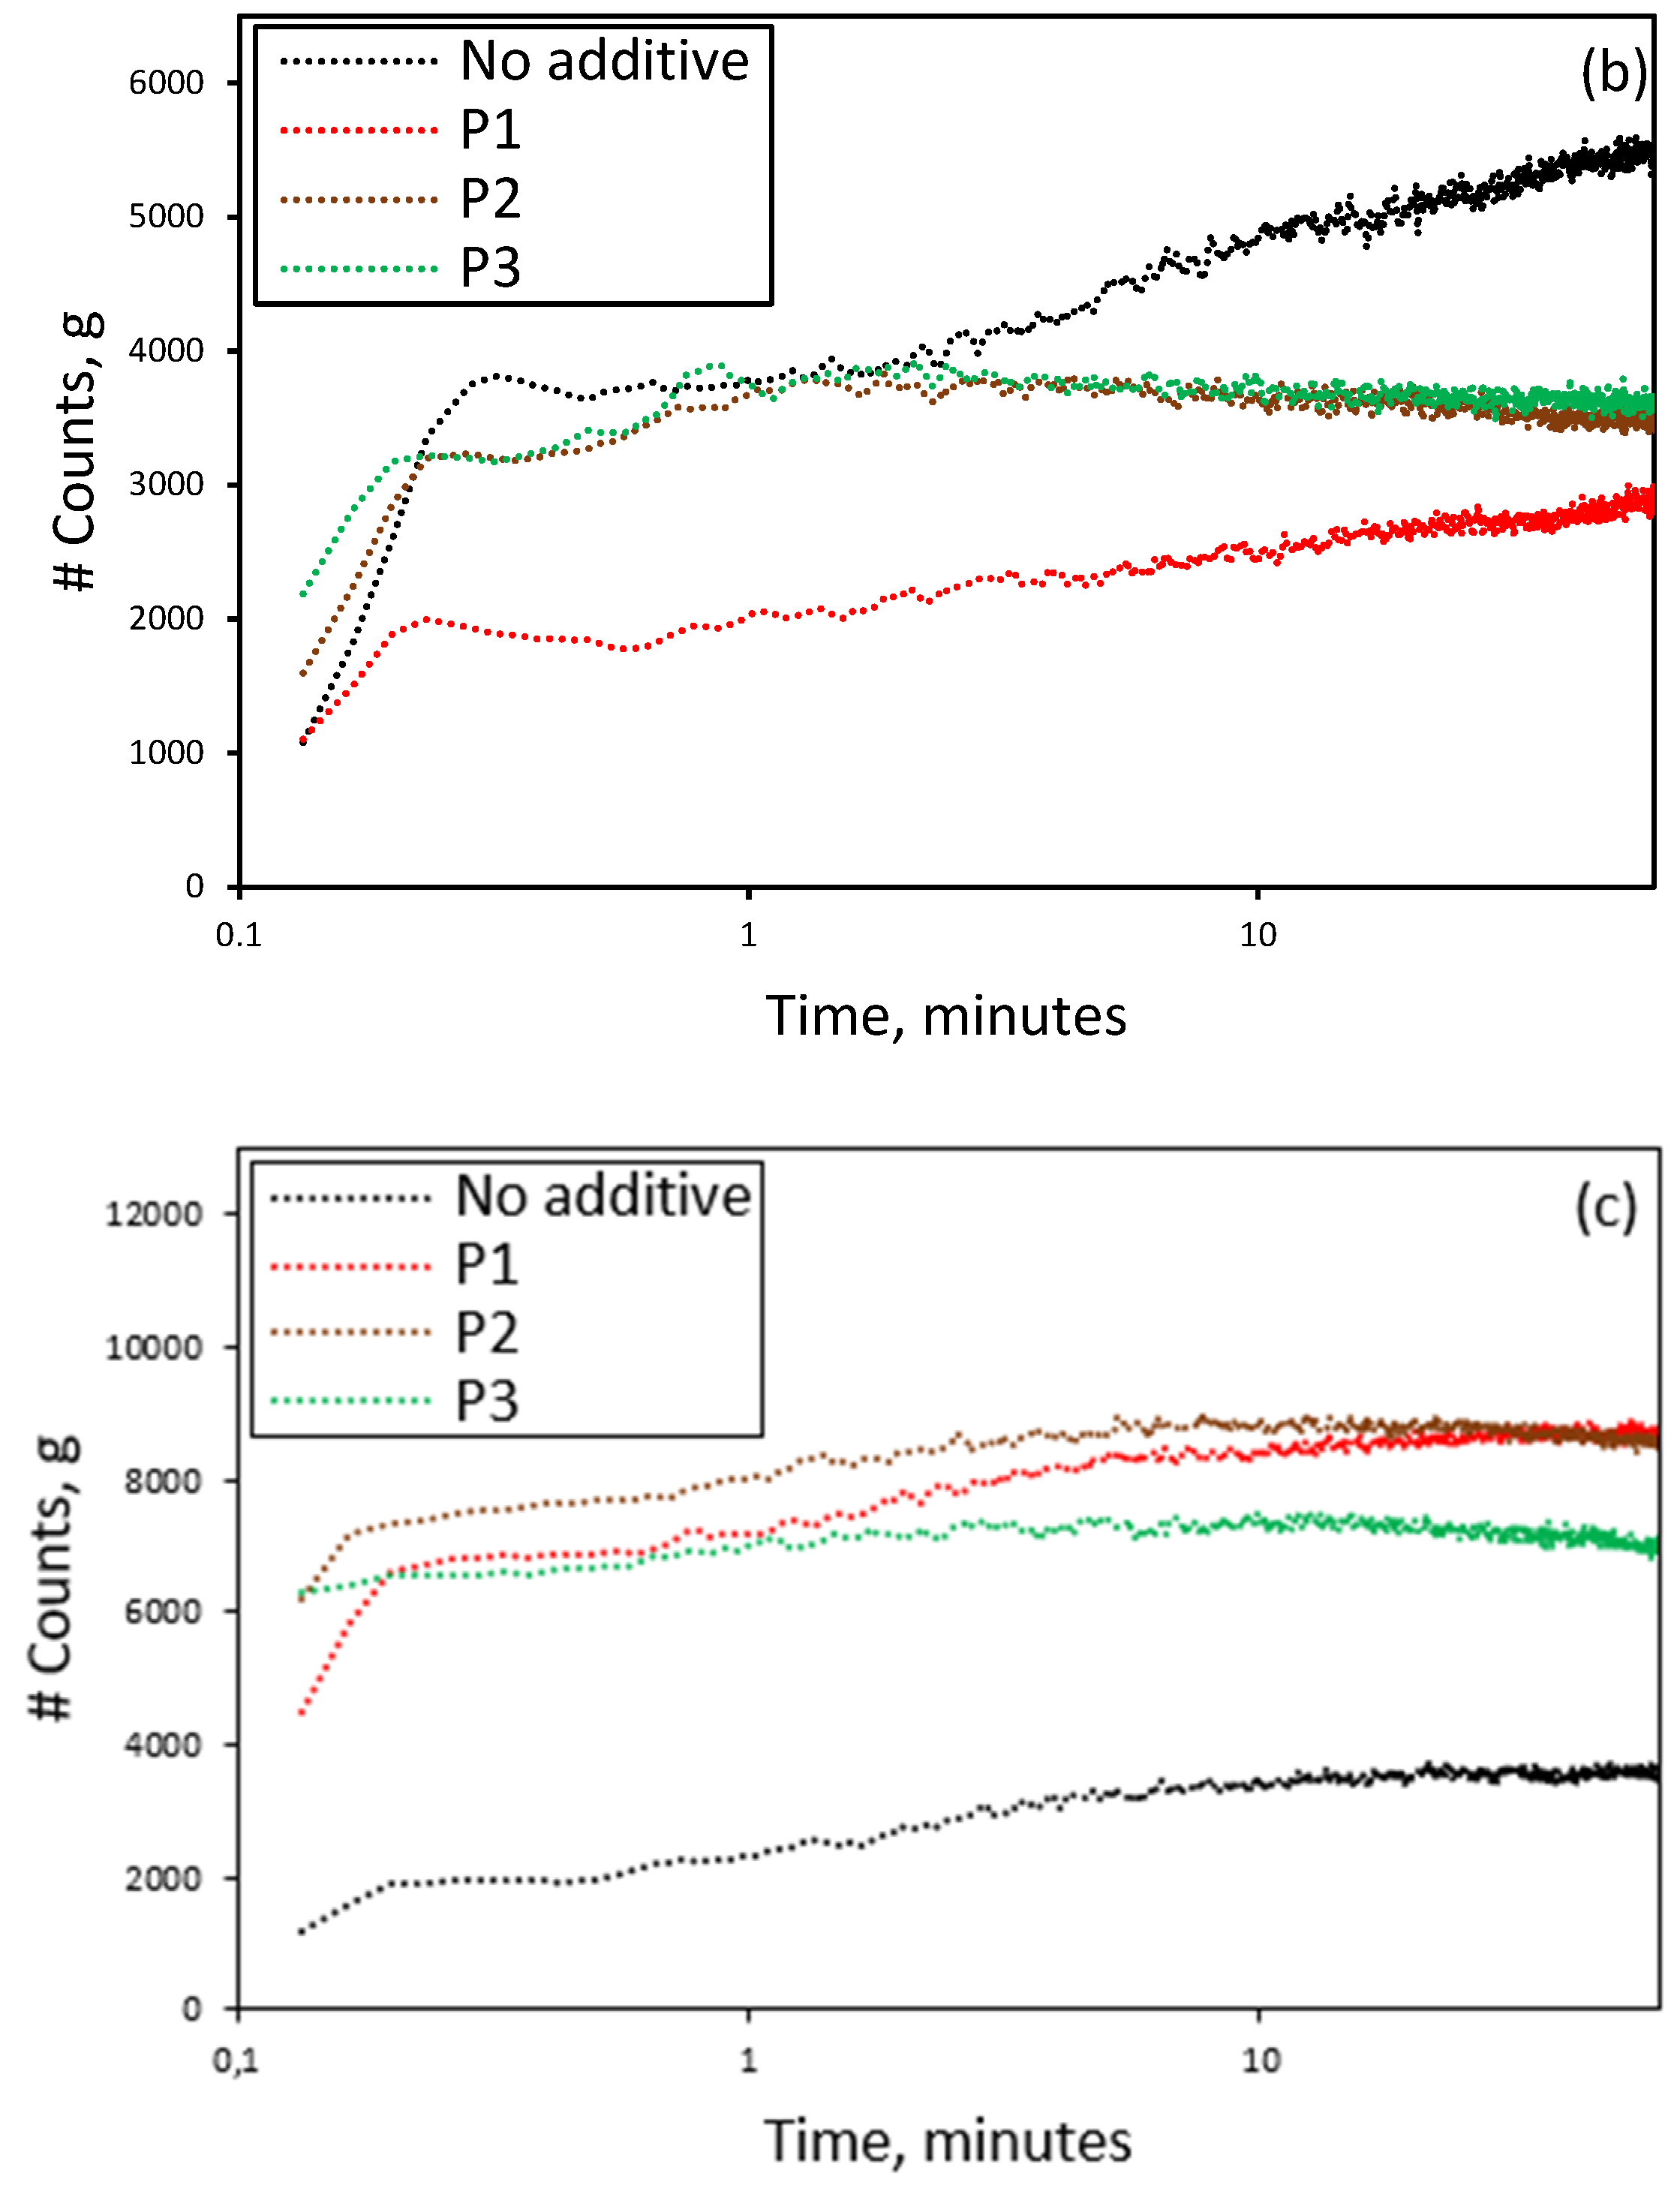
Figure 8 shows the number of Li2CO3 fines (≤10 µm) measured by FBRM in the presence of PAA with different molecular weights. The additive has a significant effect on fine formation under all conditions. At 2 M, P1 (1800 Da) and P2 (230,000 Da) increase the fine count compared to the additive-free case, while P3 (450,000 Da) keeps it low. A similar pattern is observed at 3 M. In contrast, at 4 M, fine counts drop, with P2 and P3 showing the strongest inhibition. The increase in fines with P1 and P2 suggests enhanced nucleation or stabilization of small nuclei. Conversely, P3 (and P2 at 4 M) appears to exert stronger inhibition, likely due to more effective adsorption on active crystal faces, which limits nucleation and reduces fine populations.
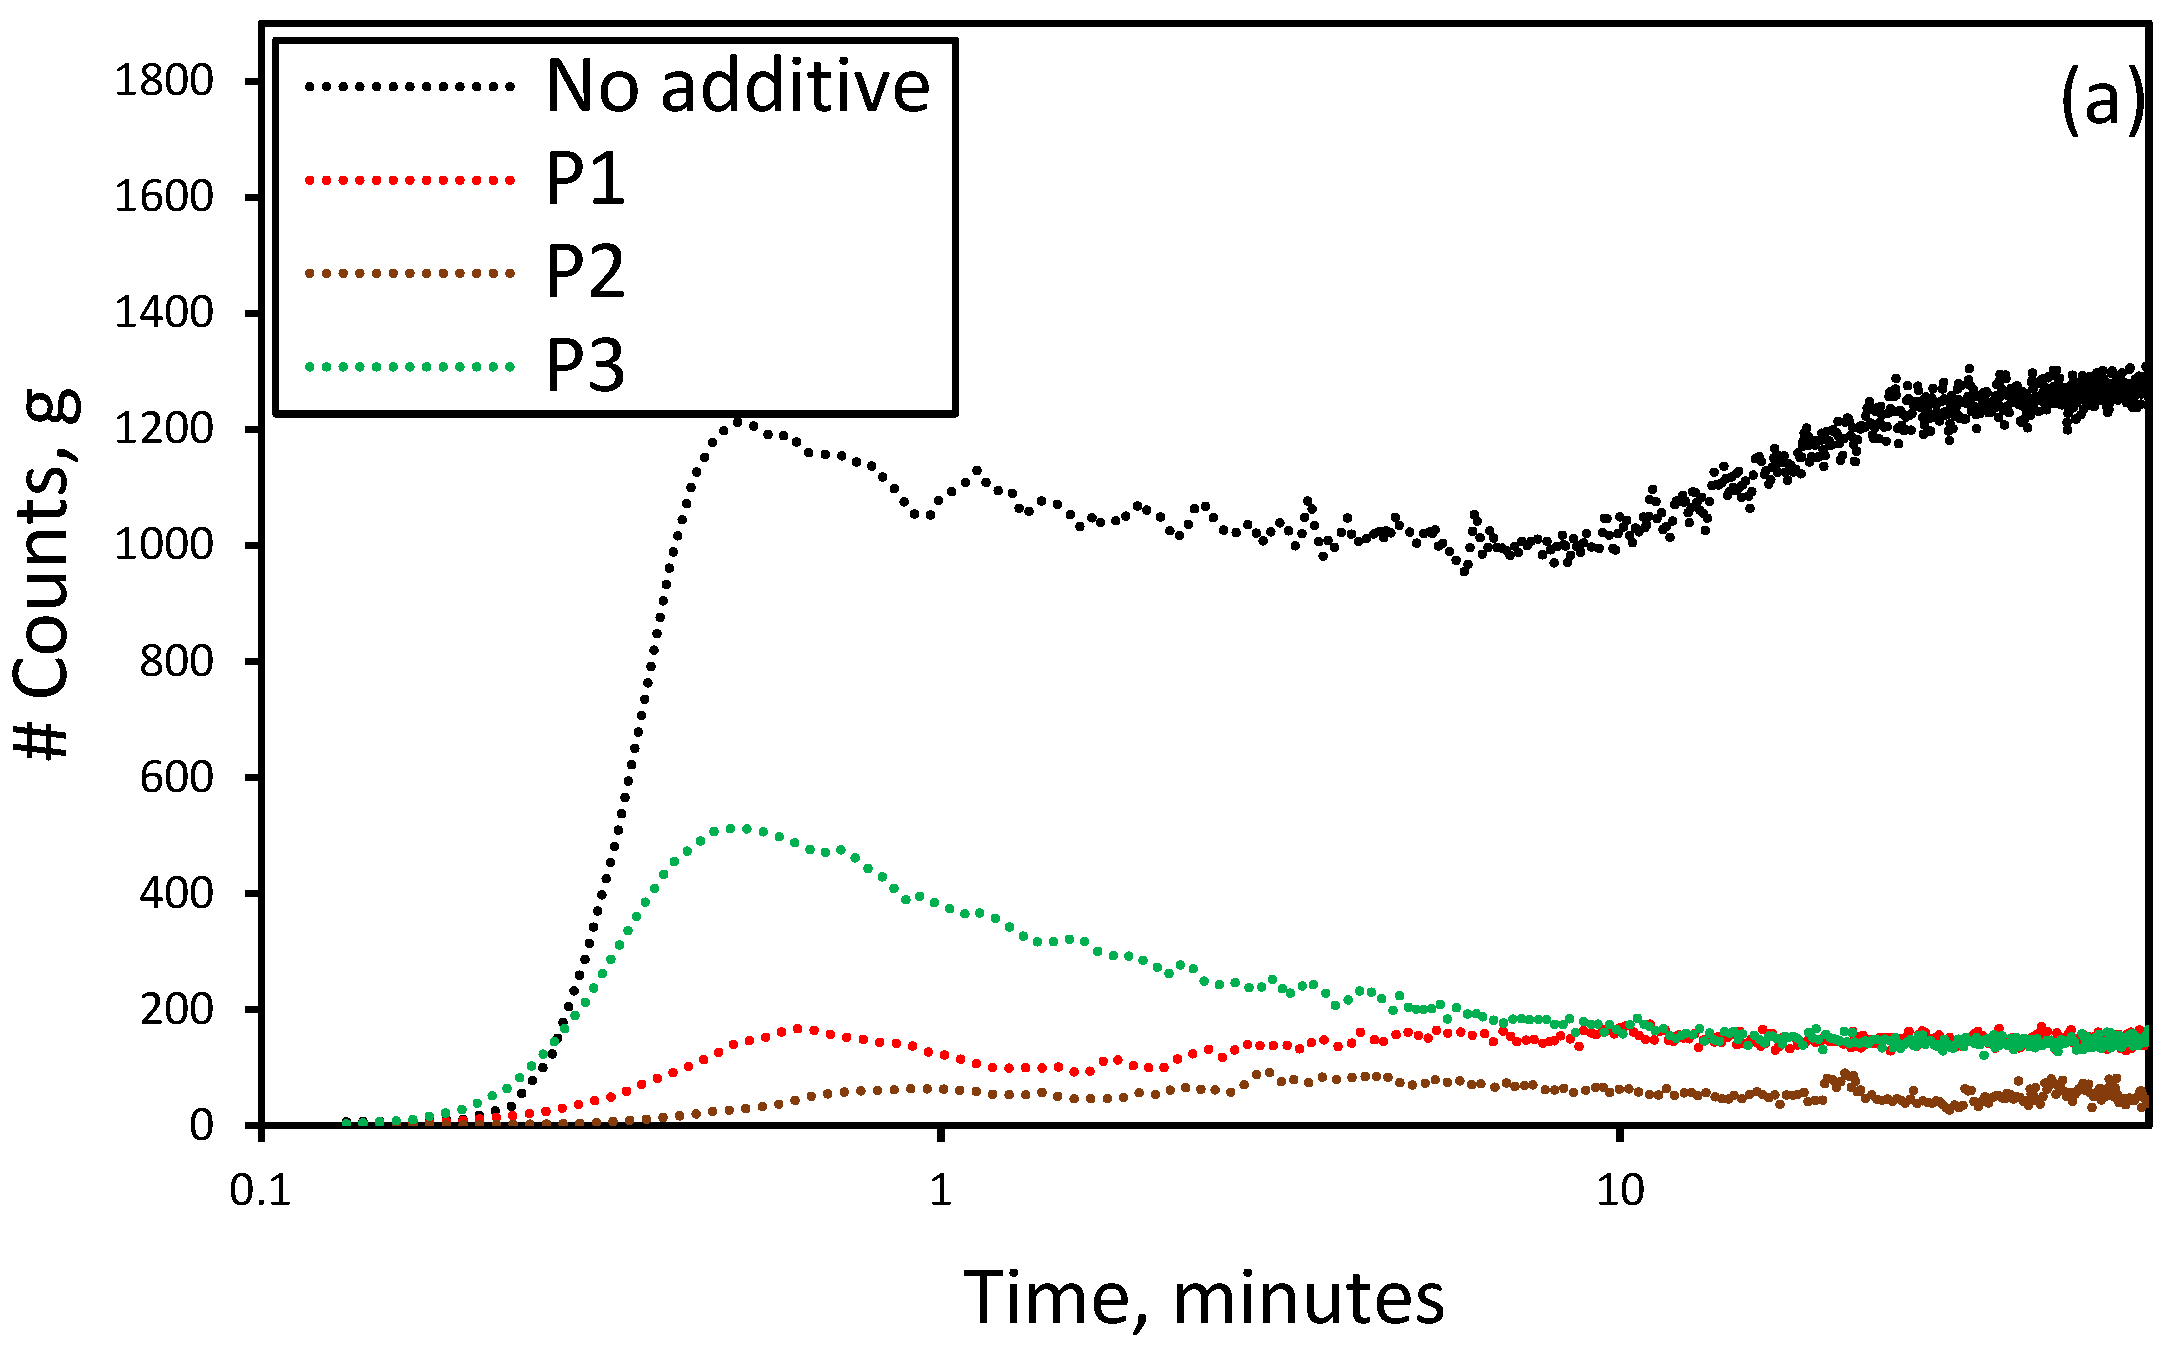
Figure 9 shows the evolution of coarse crystals (50–150 µm) in the presence of PAA with different molecular weights. The additive’s effect varies with LiCl concentration. At 2 M, the coarse count drops from ~1200 (no additive) to <200 with any PAA, with P2 showing the strongest inhibition. At 3 M, P1 causes the greatest initial reduction, but the count rises over time, suggesting delayed growth. In contrast, P3 steadily decreases from ~500 to ~200. At 4 M, the trend reverses: all additives increase coarse counts, with P3 yielding the highest values during most of the test. This suggests that under high supersaturation, PAA may promote agglomeration or secondary growth rather than inhibit crystal development.
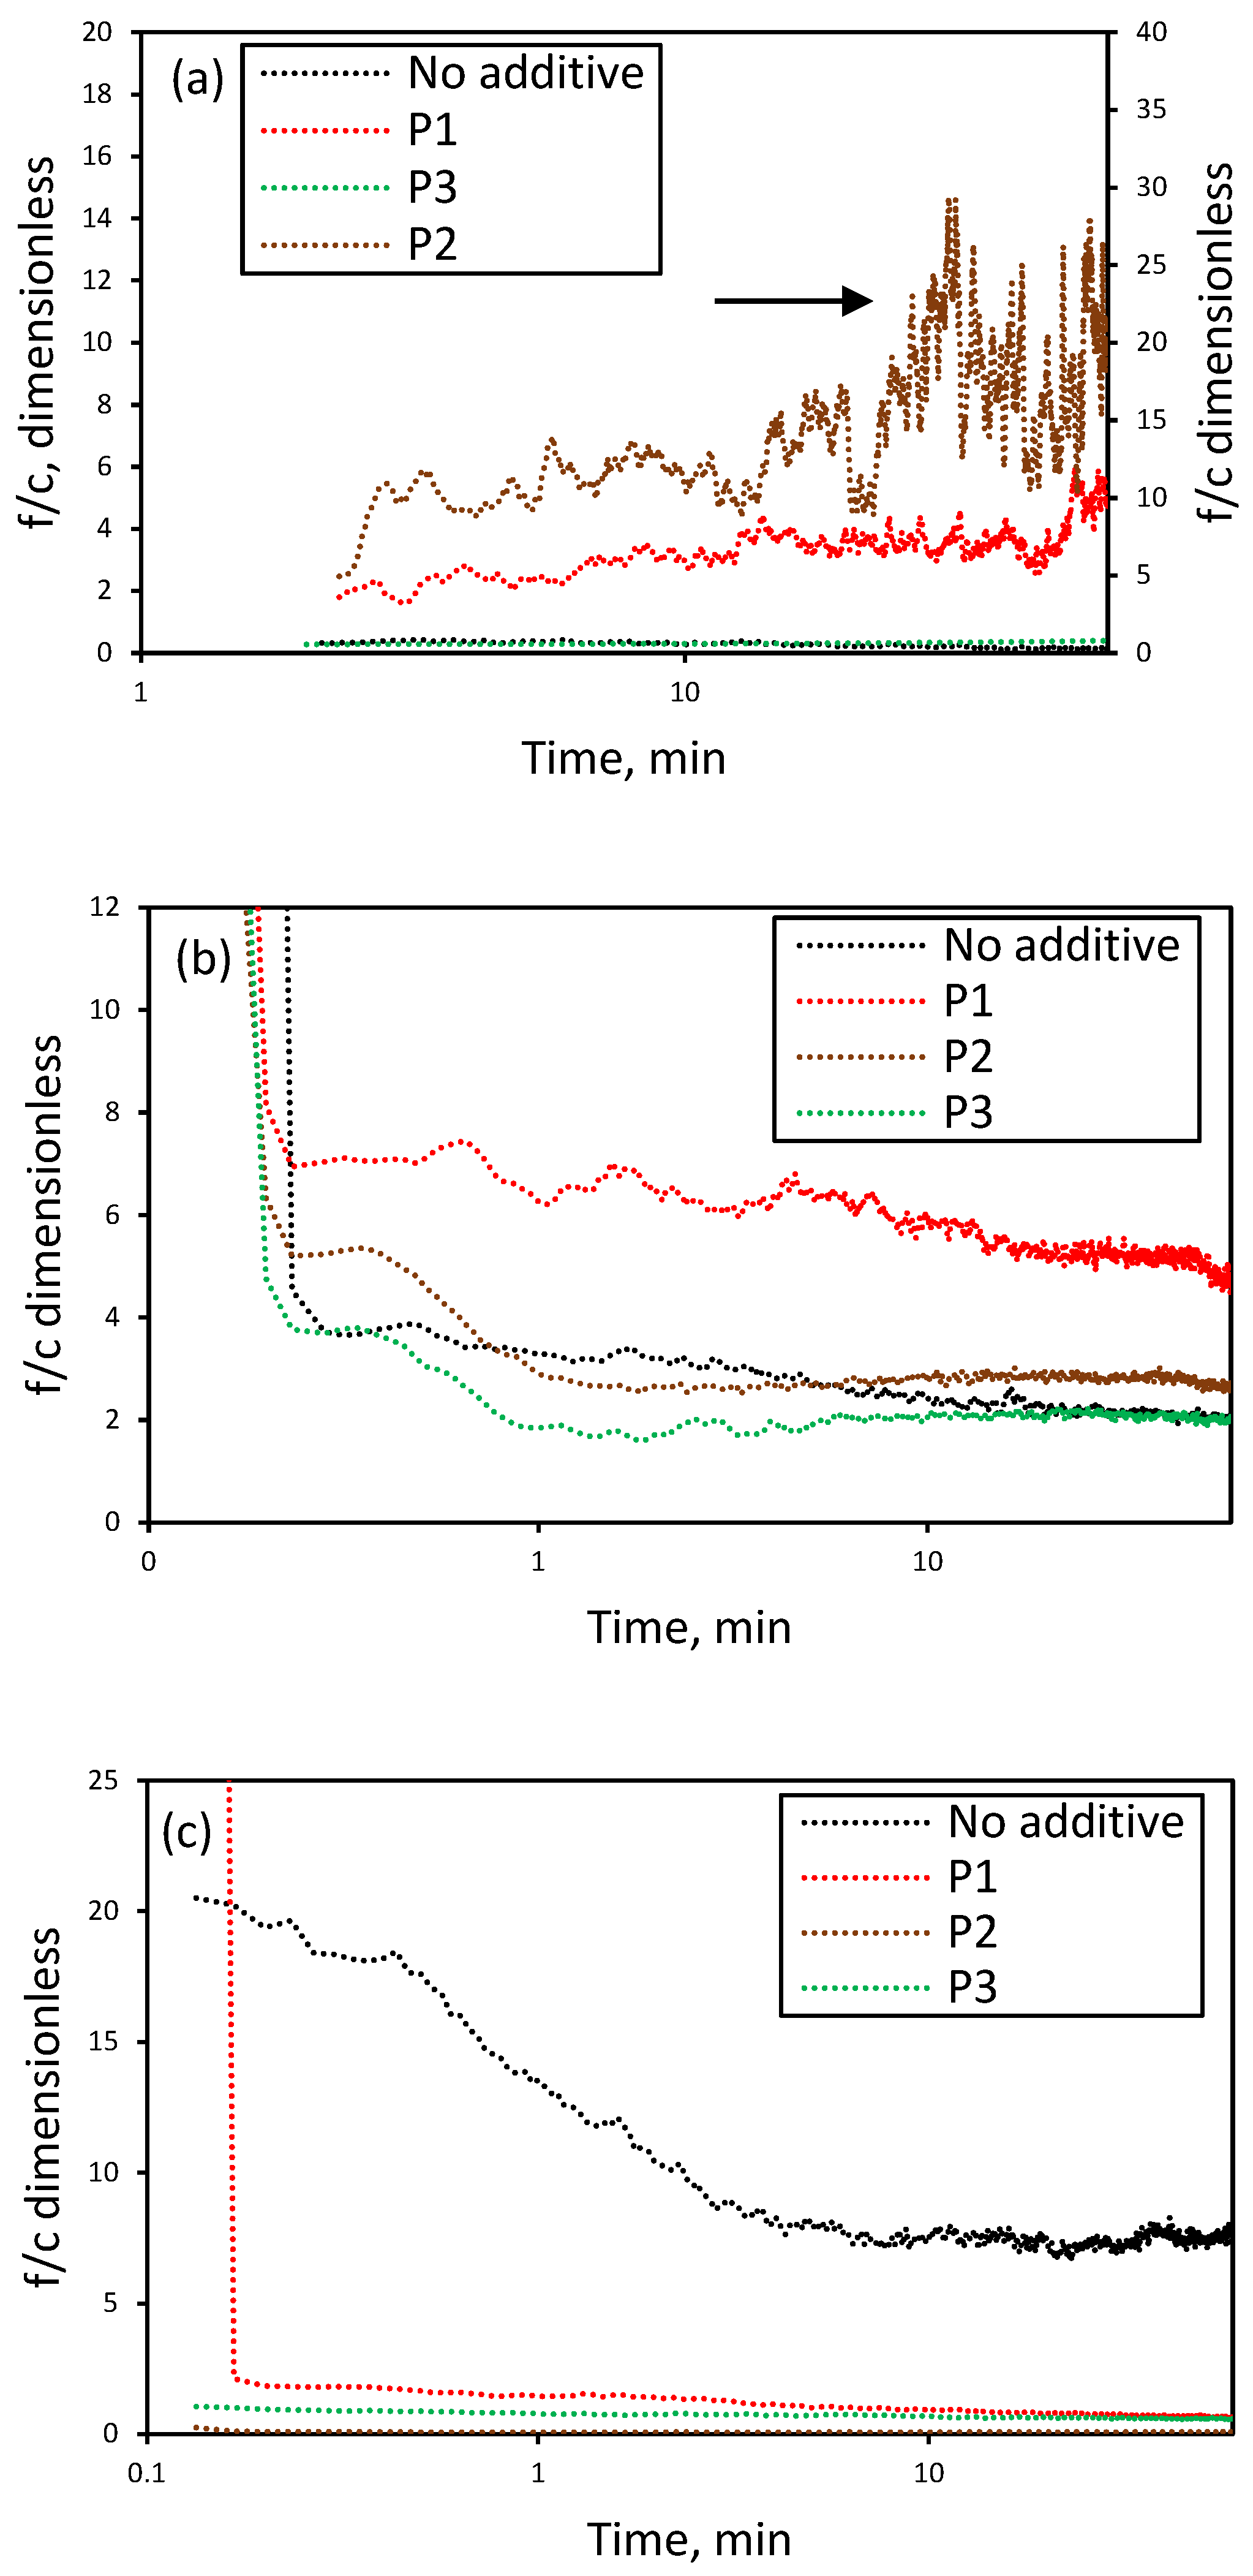
Figure 10 presents the evolution of the fine-to-coarse particle ratio (f/c), defined as the number of particles ≤10 µm over those between 50 and 150 µm, in the presence of polyacrylic acid (PAA) of varying molecular weights and initial LiCl concentrations. This metric captures the balance between nucleation and growth, highlighting the regulatory role of PAA.
At 2 M, additives notably increase the f/c ratio, with P2 (Mw 230,000) showing the highest effect—up to 200-fold—alongside a rising trend, indicating sustained fine particle accumulation. P1 also raises the ratio, while P3 maintains values near the reference, suggesting dominance of coarse particles. At 3 M, P1 shows the highest f/c ratio but with a declining trend, consistent with fines transitioning to larger sizes. P2 and P3 show lower ratios, indicating relatively fewer fines. At 4 M, the trend reverses: f/c decreases with all additives, pointing to suppressed nucleation and a shift toward coarse particle formation via growth or agglomeration. Overall, the effect of PAA on f/c depends on both the polymer’s molecular weight and the system’s supersaturation.
It is confirmed that the effect of PAA on the fine/coarse particle ratio depends on both the molecular weight of the polymer and the initial supersaturation of the system. At low and moderate concentrations (2–3 M), the additives—especially P1 and P2—tend to stabilize the fine particles. In comparison, at high concentrations (4 M), PAA favors the formation of coarse particles, significantly altering the balance between nucleation and growth.
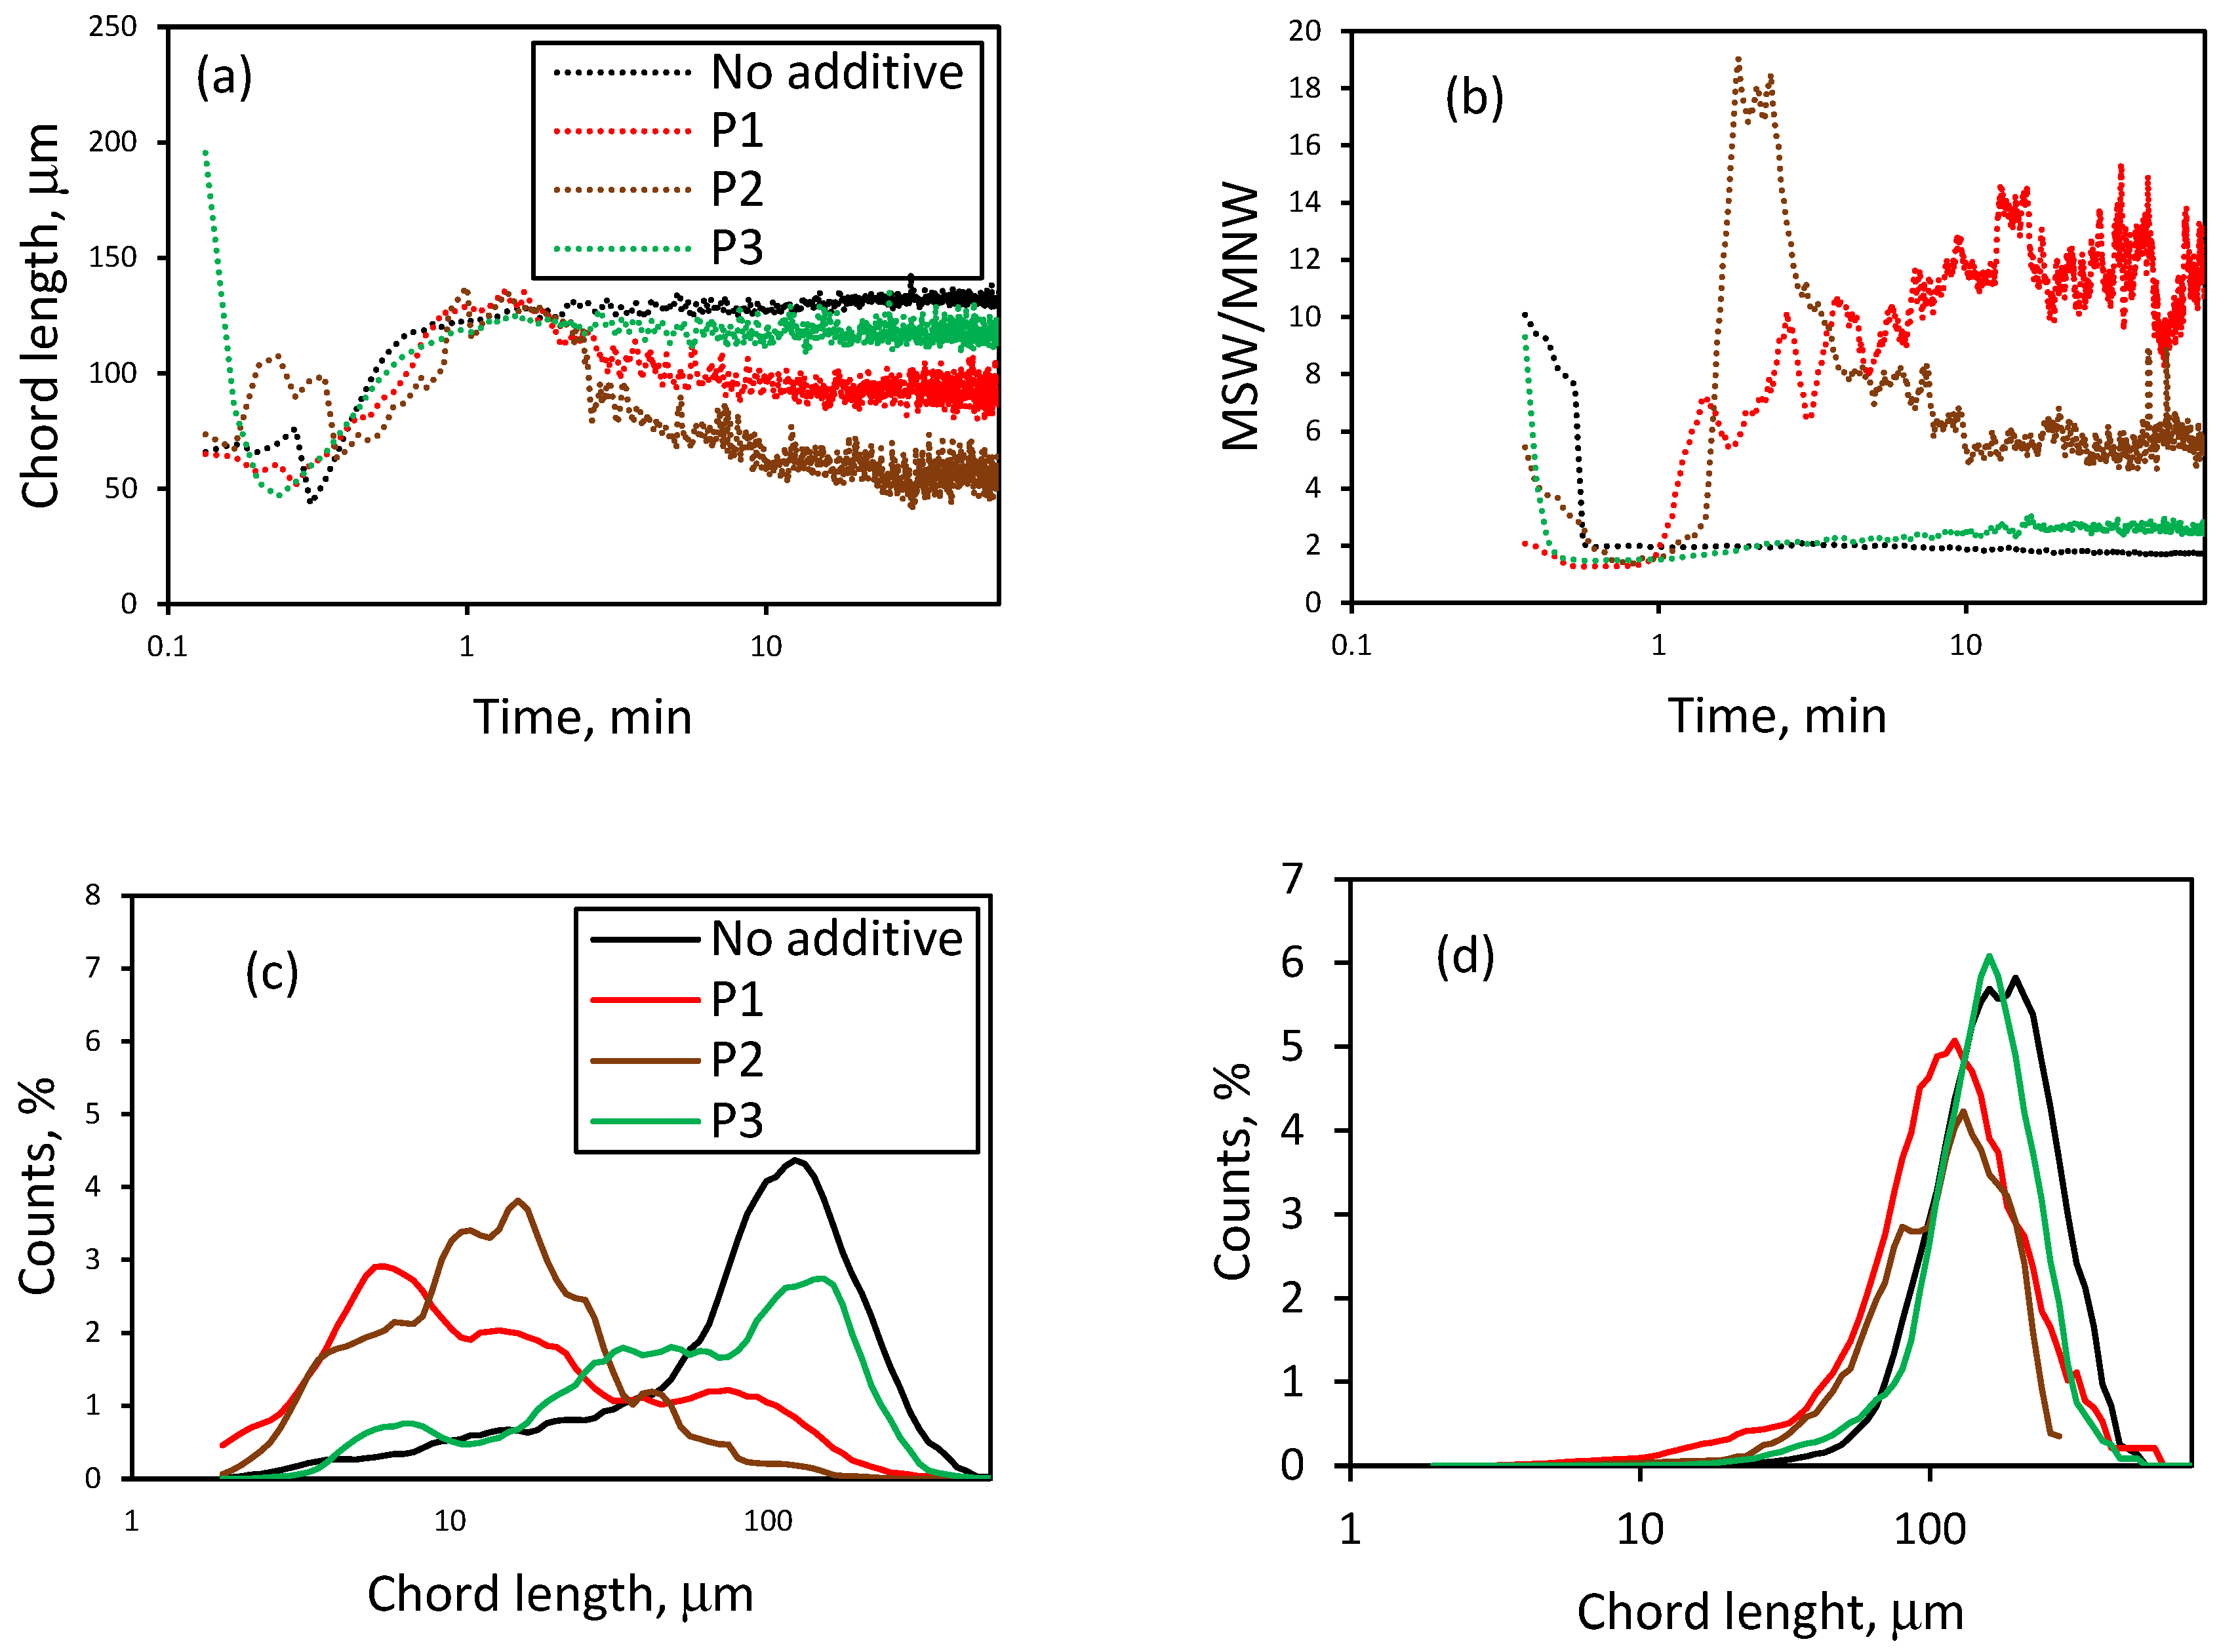
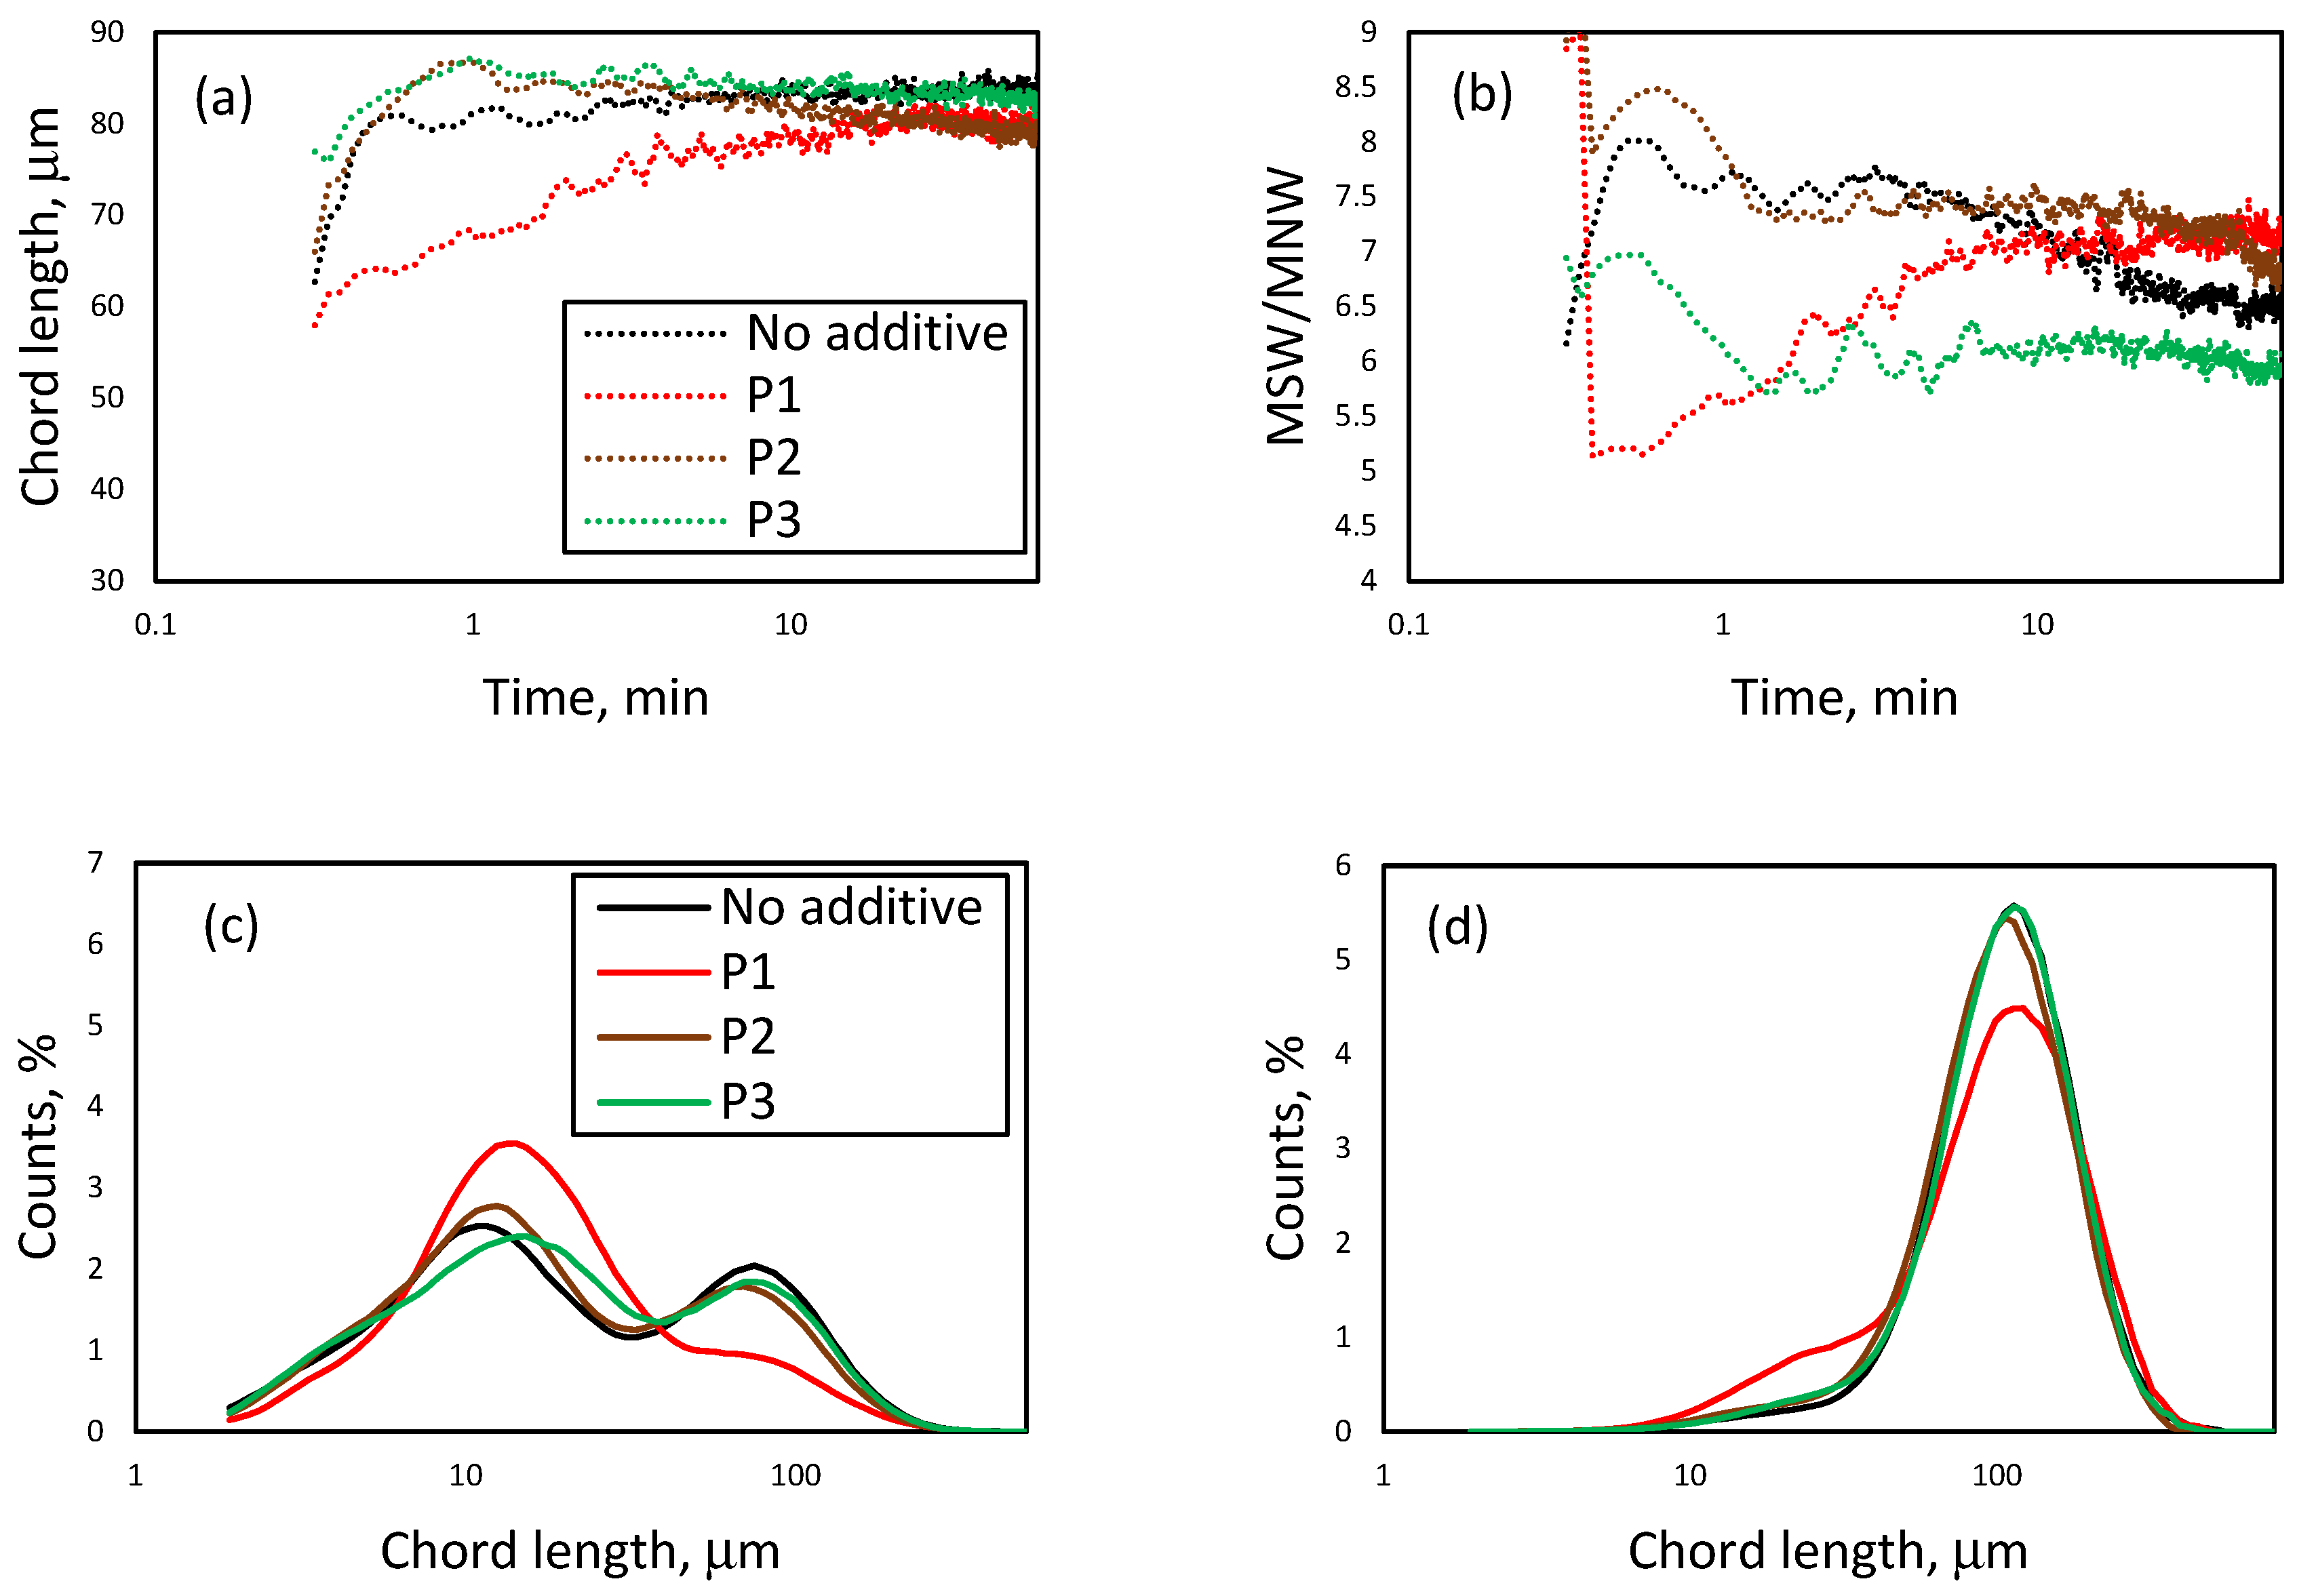
Figure 11 displays the evolution of the squared weighted mean size (MSW), the MSW/MNW ratio, and chord length distributions (CLD) of Li2CO3 crystals from 2 M LiCl solutions with PAA of varying molecular weights, all on a semi-logarithmic scale. Initially, crystal growth occurs under all conditions. Without additives, MSW gradually increases, while in the presence of PAA—particularly P1 and P2—it decreases over time, suggesting inhibition of large particle growth or morphological restructuring.
The MSW/MNW ratio indicates size uniformity; values near 1 reflect homogeneity, while high values suggest large particles dominate the volume average. With P2, the ratio peaks early and declines to ~6, suggesting reduced coarse particle dominance. With P1, it rises to ~12, implying increasing but heterogeneous coarse contributions. Unweighted CLD shows more fines with P1 and P2, while the additive-free condition exhibits more coarse particles. The squared-weighted CLD confirms this; the additive-free curve shifts rightward, P3’s is narrower and left-shifted, and P1 and P2 display broader profiles, with fewer coarse particles and a left tail in P1 indicating additional fines.
Figure 12 presents the evolution of the squared weighted mean size (MSW), MSW/MNW ratio, and chord length distributions (CLD) for Li2CO3 crystals formed at 3 M LiCl with various PAA molecular weights, in semi-logarithmic scale. By the end, the additive-free condition yields a slightly higher MSW. However, with P2 and P3, the size stabilizes earlier and is initially larger than without additives. For P2, MSW declines after the first minute, indicating rapid early growth followed by reorganization or surface adsorption. In contrast, P1 shows delayed stabilization (~25 min), reflecting slower but more sustained growth.
The MSW/MNW ratio exhibits distinct trends. Without additives, the ratio decreases, suggesting an increase in the median (MNW) due to the gradual addition of coarse crystals, which is consistent with the particle counts. With P1, the ratio increases steadily, reflecting the higher fines content seen in the CLD. In contrast, P2 and P3 show a decline in the final 10 min, indicating a growing intermediate fraction and reduced dominance of coarse particles. The unweighted CLD is bimodal, with P1 exhibiting more fines and fewer coarse particles, whereas the additive-free case is skewed toward coarser sizes. The weighted CLD confirms this, with P1 showing a strong tail toward smaller sizes and lower coarse particle frequency.
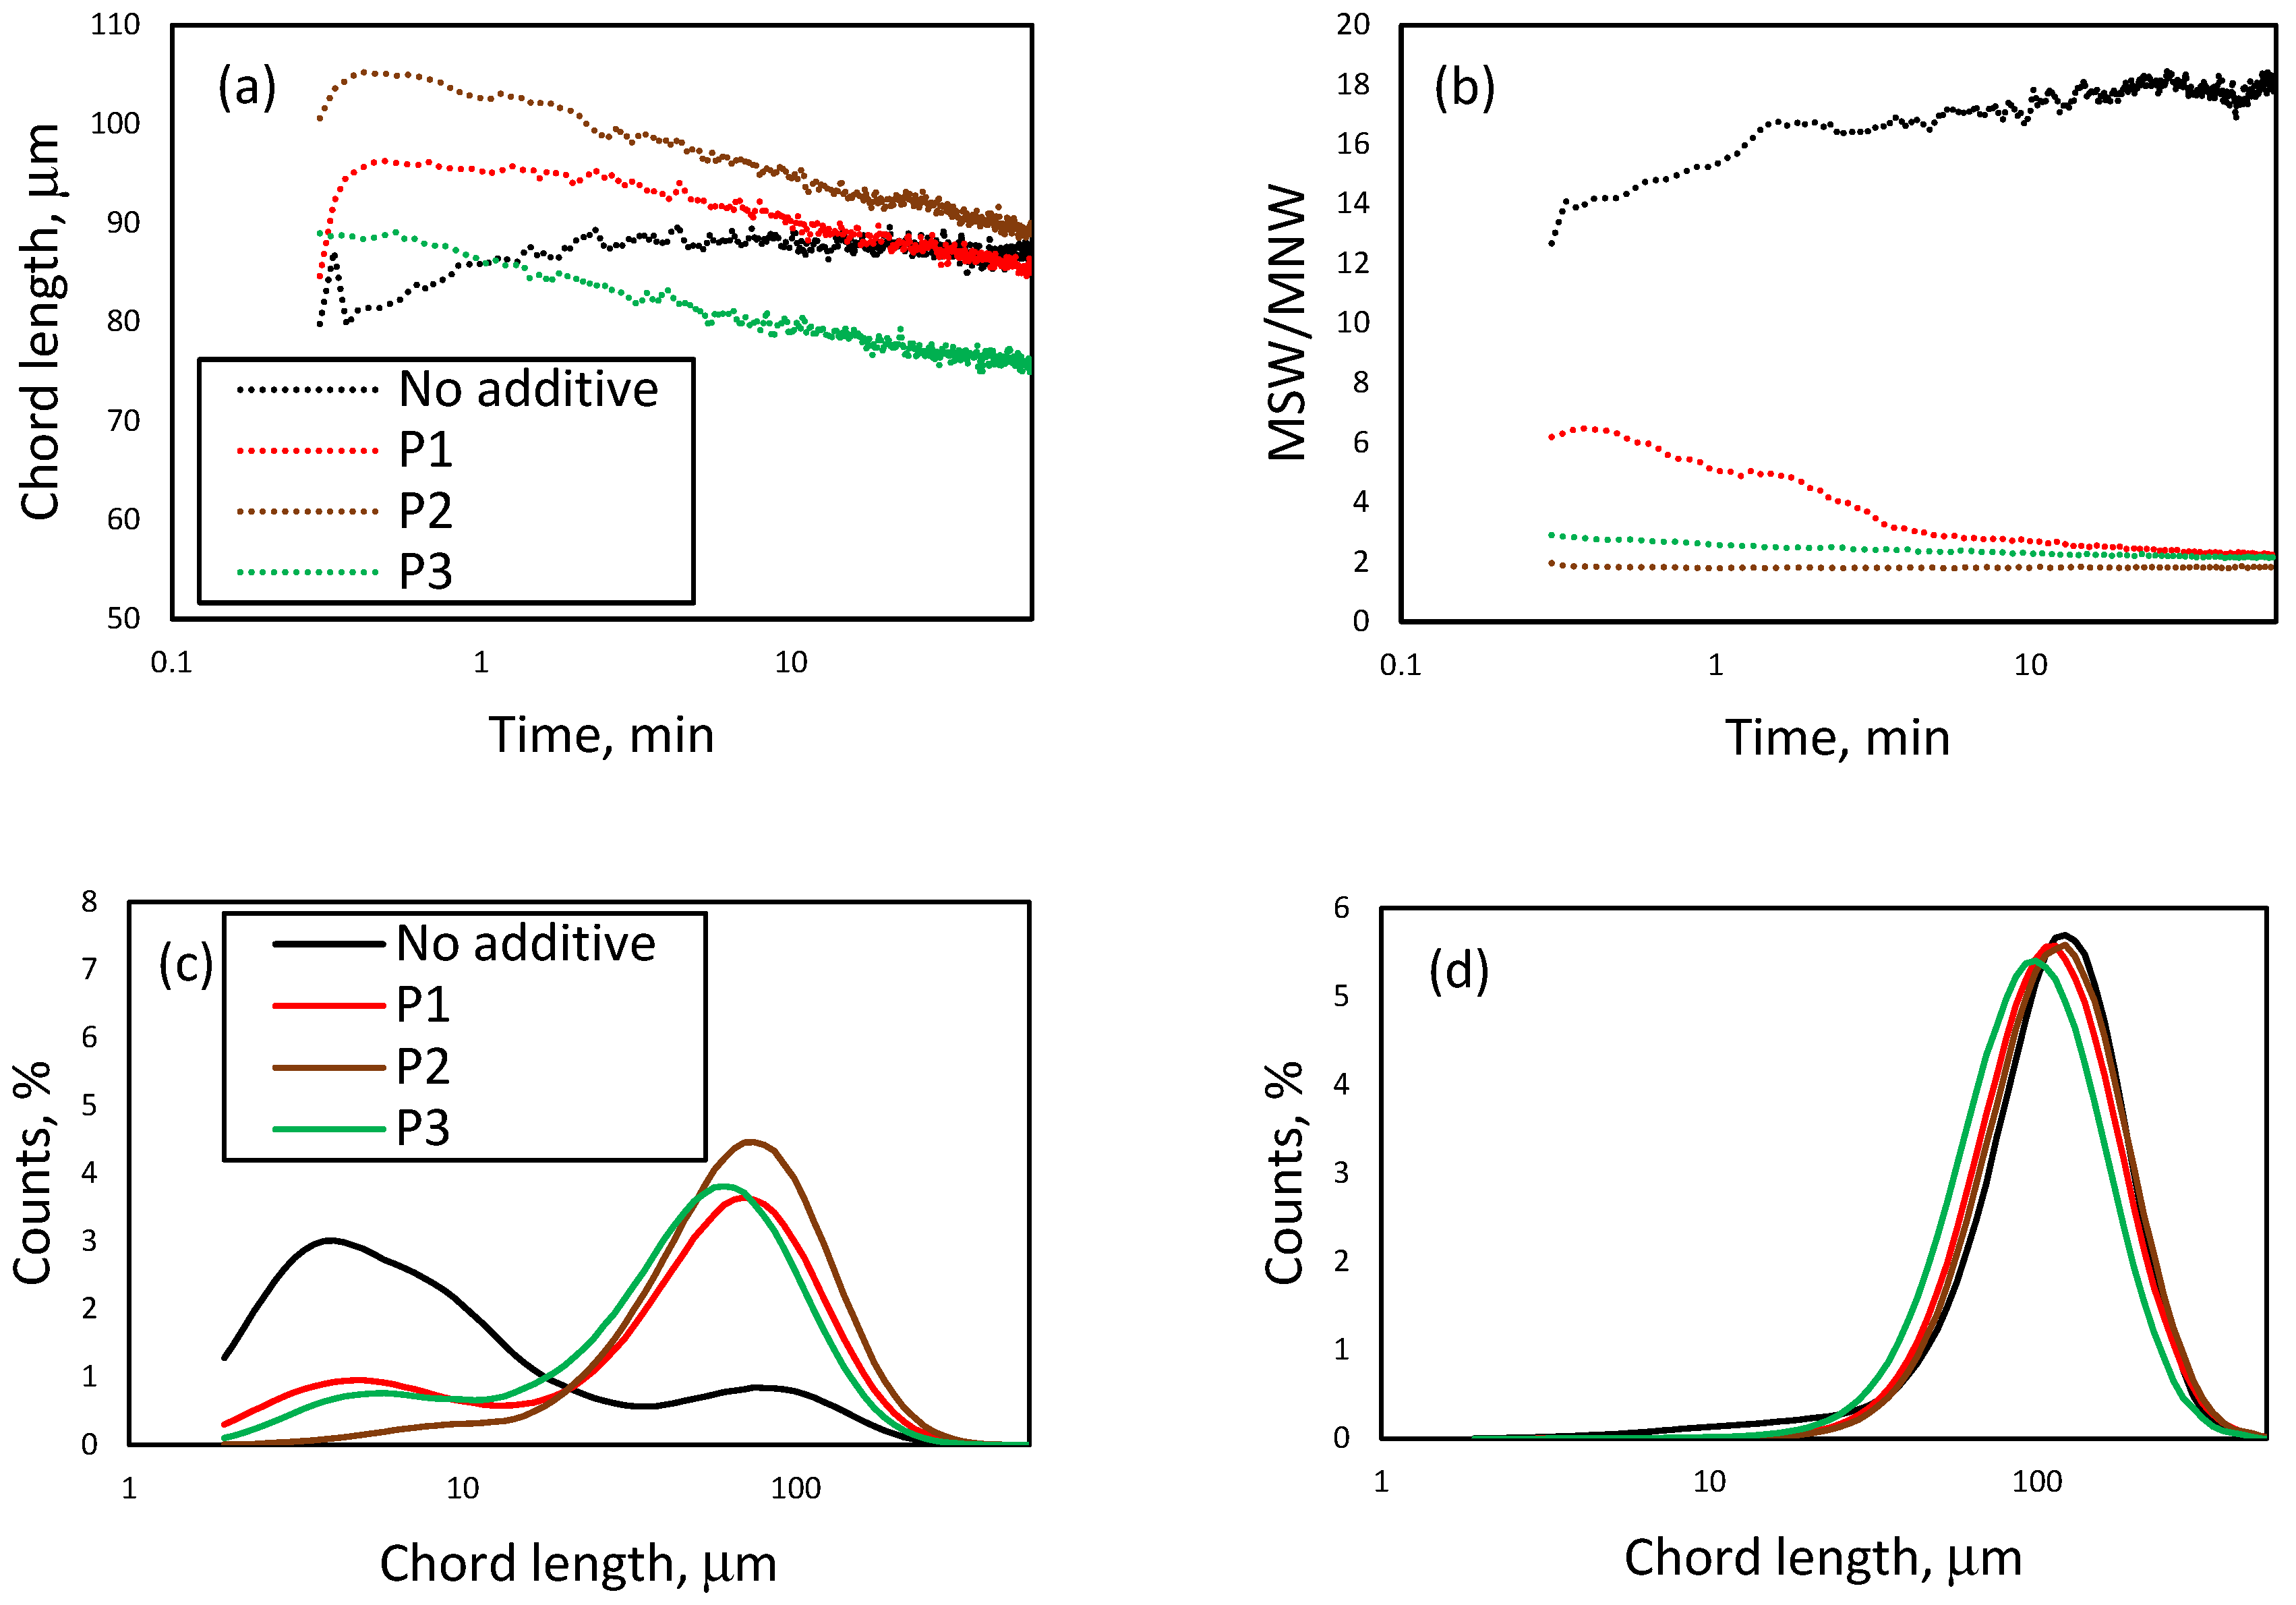
Figure 13 presents the evolution of the squared weighted mean size (MSW), the MSW/MNW ratio, and the chord length distributions (CLD) of Li2CO3 crystals from 4 M LiCl solutions with polyacrylic acid (PAA) of varying molecular weights. Without additives, MSW increases steadily during the first 10 min and stabilizes around 90 µm, indicating sustained growth. With PAA, MSW rises sharply at the beginning but then decreases in all cases, revealing a distinct behavior. P2 yields larger crystals than the additive-free condition, while P3 results in smaller sizes, confirming a molecular weight-dependent modulation.
The MSW/MNW curves support these findings. In the absence of additives, the ratio reaches high values despite the presence of fines, as these are extremely small (peak < 3 µm), causing coarse crystals to dominate the volume average. With PAA, the ratio decreases significantly, indicating more uniform distributions. Notably, P1 starts around 5 and drops to ~2, reflecting a decline in fines and consolidation of coarse crystals. The unweighted CLDs with additives exhibit attenuated bimodality, with a higher relative share of coarse particles and reduced fines, particularly with P2. The squared weighted CLDs confirm this trend, indicating a dominance of coarse particles in all cases. In P3, the peak shifts slightly left with a lower share of coarse particles, while the additive-free condition shows a right-shifted peak and a leftward tail, indicating coexistence of fines.
The progressive MSW decline observed with PAA, despite no major increase in fines or a sharp decrease in coarse particles, suggests it is not due to explosive nucleation or attrition, but rather to morphological reorganization and aggregate compaction. Branched initial structures yield high chord lengths that decrease as they evolve into more compact forms, reducing FBRM-measured average size. This behavior mirrors that described by Leyssens et al. [38] for needle-like particles, where initial growth was followed by a drop attributed to shape redistribution without secondary nucleation.
Watamura et al. [28] showed that PAA can bind selectively to Li2CO3 crystal faces, altering habit and reducing agglomeration, while allowing accelerated growth along other axes. Yang et al. [30] proposed that early “lump” signals from FBRM may represent precursor aggregates that later reorganize or partially dissolve, lowering average size without significantly changing particle count. This aligns with studies showing that polymers can stabilize prenucleation species or nascent nuclei [24,25,53]. Teychené et al. [54] further noted that additive effects depend on kinetic stage, mixing, and supersaturation dynamics, which could explain why PAA promotes early formation of large crystals but restricts later expansion.
The addition of polyacrylic acid (PAA) significantly alters Li2CO3 crystallization, influencing average size, particle distribution, and nucleation/growth dynamics. At 2 M and 3 M LiCl, PAA promotes fines by selectively adsorbing on active faces and stabilizing nuclei, slowing crystal growth. At 4 M, under extreme supersaturation, the system without additives exhibits massive nucleation and attrition, resulting in the production of abundant fines. In contrast, PAA, despite partial chain collapse due to ionic strength, continues to inhibit secondary nucleation, promoting the consolidation of coarse particles. However, the average size may decrease due to morphological compaction.
PAA’s effectiveness depends on its molecular weight. Long chains with dense carboxylate groups strongly adsorb on crystal surfaces, blocking growth sites and enhancing inhibition [26]. Short chains show weaker and less persistent adsorption. In Li2CO3, high-molecular-weight PAA promotes elongated crystals, whereas low-molecular-weight forms induce tabular habits [27,28]. Similar findings in CaCO3 show increased inhibition with molecular weight until saturation is reached [55].
PAA also interferes with nucleation via:
(i)
Ion complexation, which raises interfacial energy and nucleation barriers [24,25,26,27,28].
(ii)
Stabilization of amorphous nuclei: Long-chain PAA can stabilize amorphous phases, such as calcium carbonate nanoparticles, either within hydrogels [56] or in oriented aggregation of nanoclusters instead of ion-to-ion growth [57]. In Li2CO3, this implies the presence of polymer-bound amorphous precursors requiring more time or specific conditions to crystallize, explaining the longer induction times [24,25,58,59].
(iii)
Increase in heterogeneous or secondary nuclei: Although dissolved, long-chain PAA can form microaggregates that serve as nucleation surfaces. In CaCO3, high-molecular-weight PAA increases nucleation sites for amorphous phases [60], consistent with the rise in fines observed for P2 at 2 M LiCl, where numerous small amorphous nuclei crystallize nearly simultaneously [24,25,27,28,53].
The molecular weight of PAA governs its crystallization effect. Short-chain adsorbents adsorb weakly and primarily act as dispersants, with minimal influence on nucleation or growth. In contrast, long chains, with a higher carboxylate density, strongly anchor to nuclei and crystal faces, stabilize subcritical precursors, and block active sites. Thus, high-molecular-weight PAA functions as a kinetic inhibitor, reducing both the number and size of crystals by limiting growth and promoting more fragmented morphologies.

3.5. Effect of Additives on the Nucleation and Crystallization Growth Rates of Lithium Carbonate

Table 3 summarizes the maximum nucleation ( B m a x ) and growth ( G m a x ) rates of Li2CO3 for initial LiCl concentrations of 2, 3, and 4 M, with and without polyacrylic acid (PAA) of different molecular weights (P1, P2, and P3), based on CLD moments from the FBRM probe. At 2 M, B m a x is reduced by about one order of magnitude with PAA, while G m a x remains comparable. At 3 M, both B m a x and G m a x are of the same order of magnitude across all conditions, indicating that the additives do not significantly alter the initial kinetics. At 4 M, B m a x shows a slight reduction with PAA, whereas G m a x decreases markedly with increasing polymer molecular weight, from 106 µm/min without additive to 10 with P3, confirming strong growth inhibition.
These results confirm that, under high supersaturation (4 M), higher molecular weight polymers (P2 and P3) exert the strongest inhibitory effect on crystal growth, consistent with face-selective PAA adsorption and reduced agglomeration previously reported for Li2CO3 [28]. Conversely, the observed decrease in B m a x at 2 and 4 M may result from cation sequestration, local supersaturation modulation, and/or stabilization of amorphous precursors that delay effective nucleation [25,58].
The kinetic profile, characterized by an initial peak followed by a rapid decline, reflects the supersaturation pulse and its rapid depletion, coupled with polymer-induced inhibition of surface kinetics. Similar trends have been observed in cooling crystallization and in systems with needle-like crystals, where statistical CLD analysis via FBRM distinguishes stages of rapid nucleation, early growth, and slower maturation [38].
The fact that the highest molecular weight PAA (P3) reduces the crystal growth rate even under elevated supersaturation suggests a strong polymer–crystal interaction. Long chains bearing numerous –COO groups can simultaneously adsorb onto multiple sites on the Li2CO3 crystal surface, forming a persistent inhibitory layer even when the driving force for growth is high. This multivalent adsorption effectively blocks solute incorporation sites, slowing down crystal expansion beyond what would be expected based solely on thermodynamic considerations.

3.6. SEM Images and X-Ray Diffraction

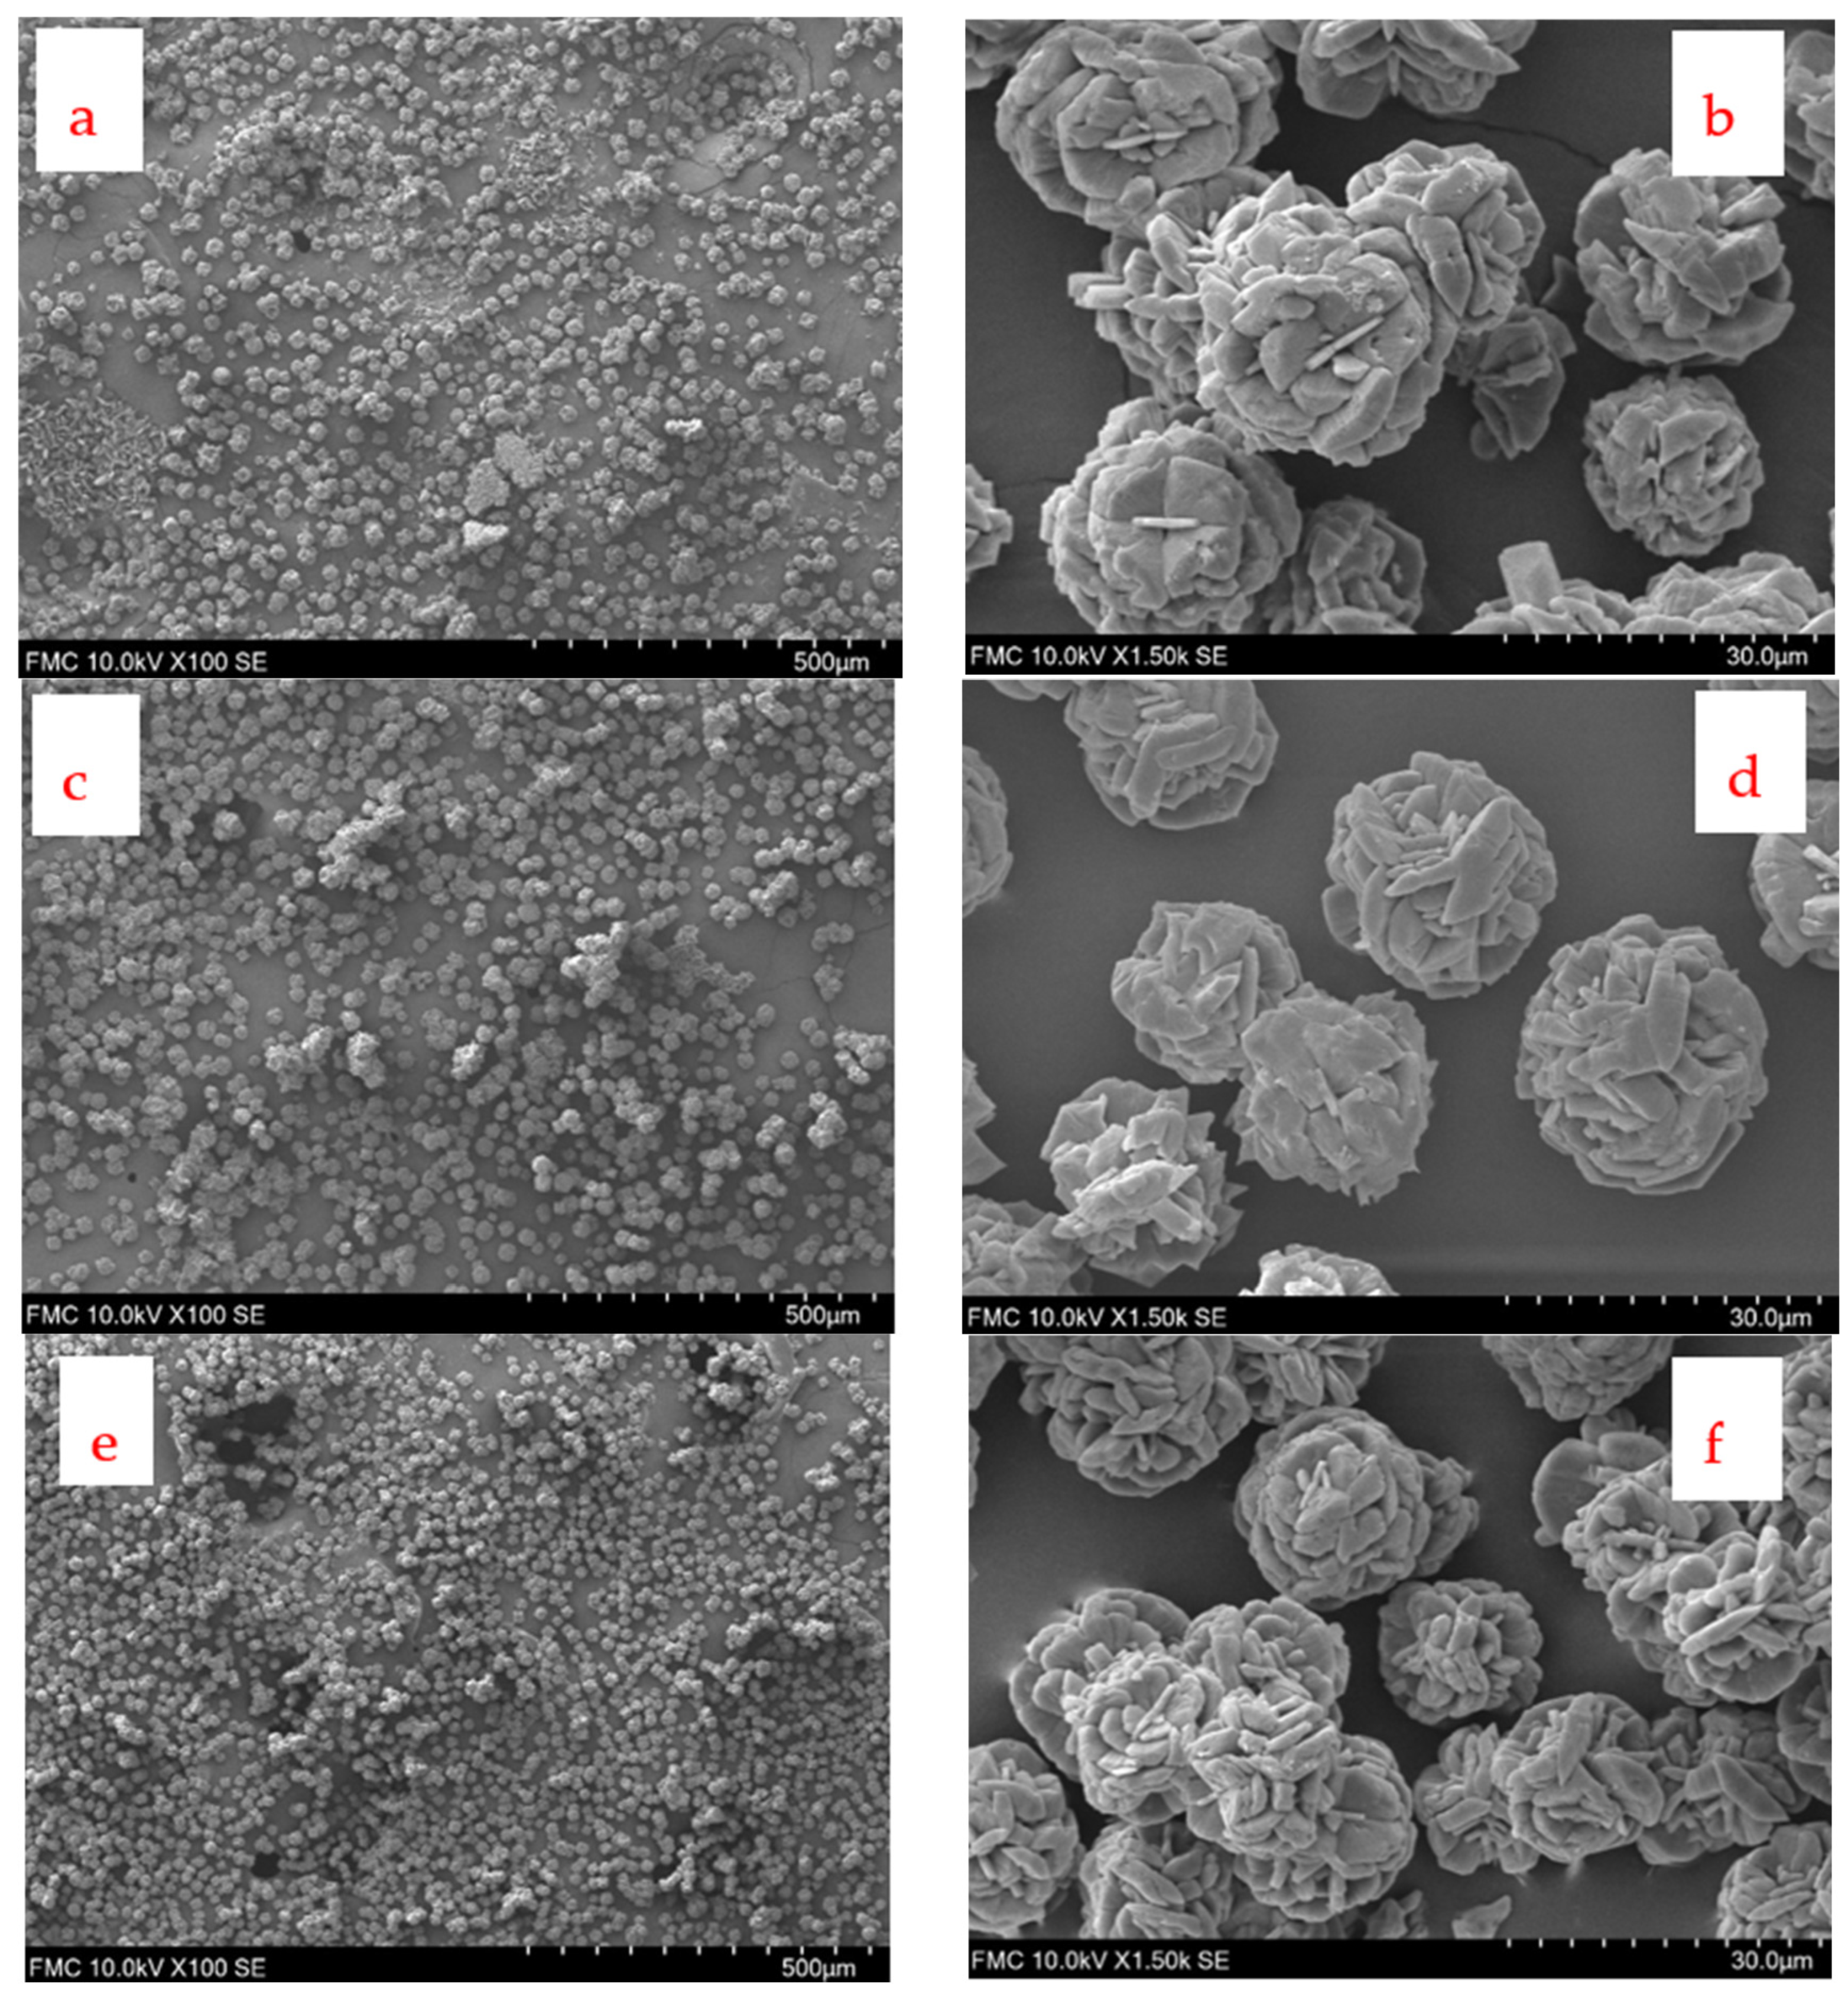
Figure 14 shows SEM images of Li2CO3 particles obtained at different initial concentrations of LiCl and Na2CO3. At 2 M, spherulites formed by flat plates with radial growth are observed, with a broad size distribution, where particles larger than 30 µm predominate. At 3 M, the spherulites maintain their radial structure but are more compact, with thicker plates. In this case, numerous fine particles coexist with larger local agglomerates, consistent with the high MSW values discussed previously. Finally, at 4 M, smaller, densely packed spherulites with a cauliflower-like morphology are formed, accompanied by a high proportion of fines (<20 µm), including numerous particles smaller than 10 µm.
The change in morphology and compaction with increasing initial LiCl concentration reflects the effect of supersaturation on nucleation and growth. At low concentrations (2 M), moderate supersaturation favors radial growth in open structures, with coexistence of fines and coarse particles. At 3 M, the higher supersaturation induces more intense nucleation, which explains the abundance of fines and the thickening of the plates, possibly associated with accelerated growth in specific crystallographic directions. Under extreme conditions (4 M), initial massive nucleation is followed by reorganization, producing compact, cauliflower-like aggregates of smaller average size.
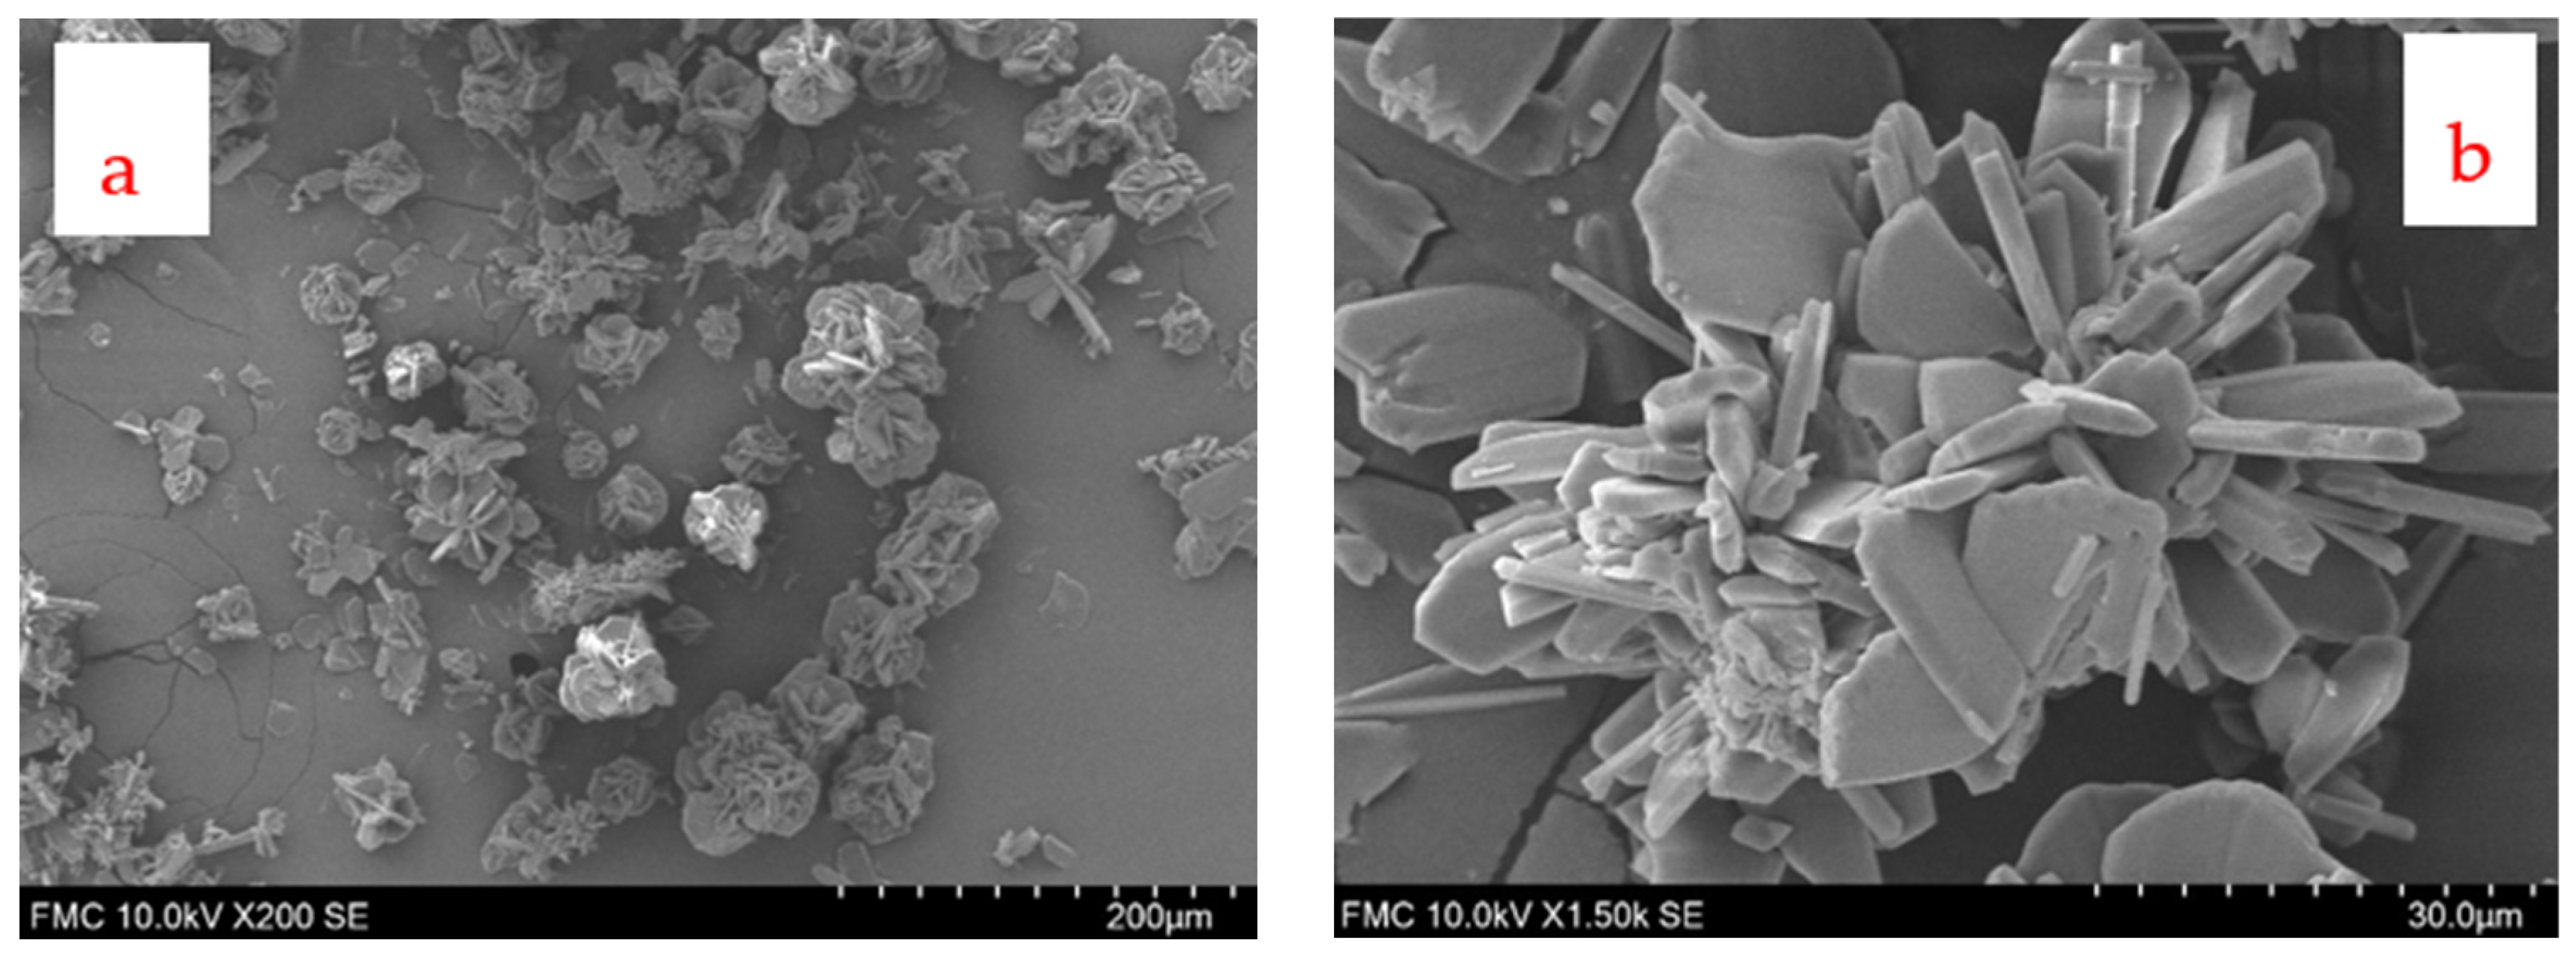
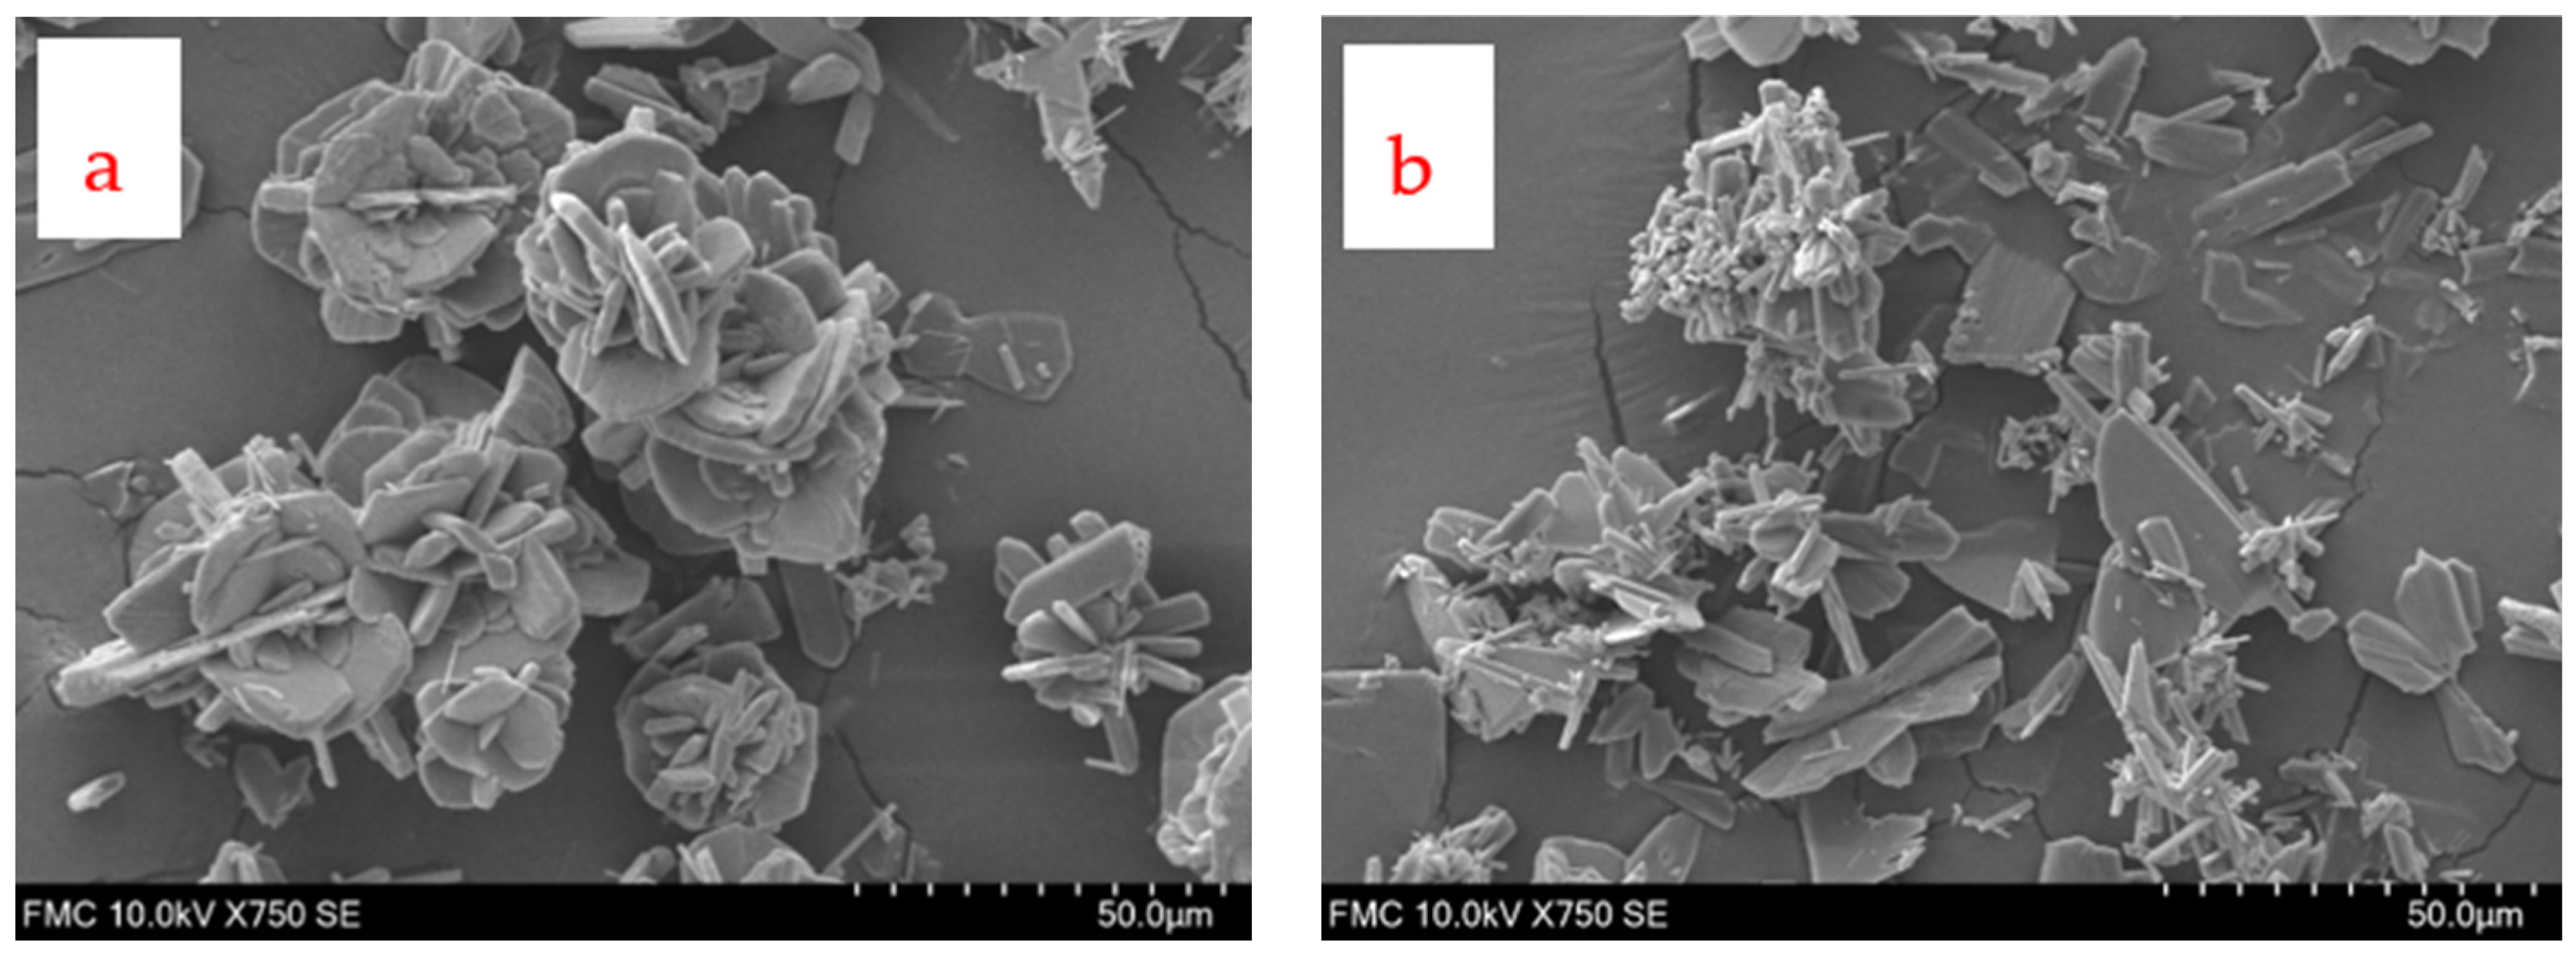
Figure 15 presents SEM images of Li2CO3 crystals obtained at 2 M LiCl in the presence of low-molecular-weight polyacrylic acid (PAA) (1800 Da). Under these conditions, plate-shaped crystals are observed, with a lower degree of agglomeration than in the condition without additives, in addition to dispersed acicular crystals. The agglomerates retain the typical radial morphology, composed of flat plates, like that obtained without additives.
The incorporation of low-molecular-weight PAA partially modifies morphology, reducing plate agglomeration and allowing the appearance of acicular crystals. This result is consistent with that reported by Watamura et al. [27,28], who demonstrated that PAA can selectively adsorb on specific crystal faces, inhibiting their growth and promoting elongated morphologies. However, at low molecular weights, the inhibitory effect is limited: the polymer reduces the tendency toward agglomeration but still allows the plaques to grow and organize radially.
Studies in analogous systems, such as CaCO3, confirm that lower molecular weight PAA induces less drastic morphological changes [24,55]. In this case, the behavior of P1 does not completely inhibit the formation of radial plaques, suggesting partial surface adsorption.
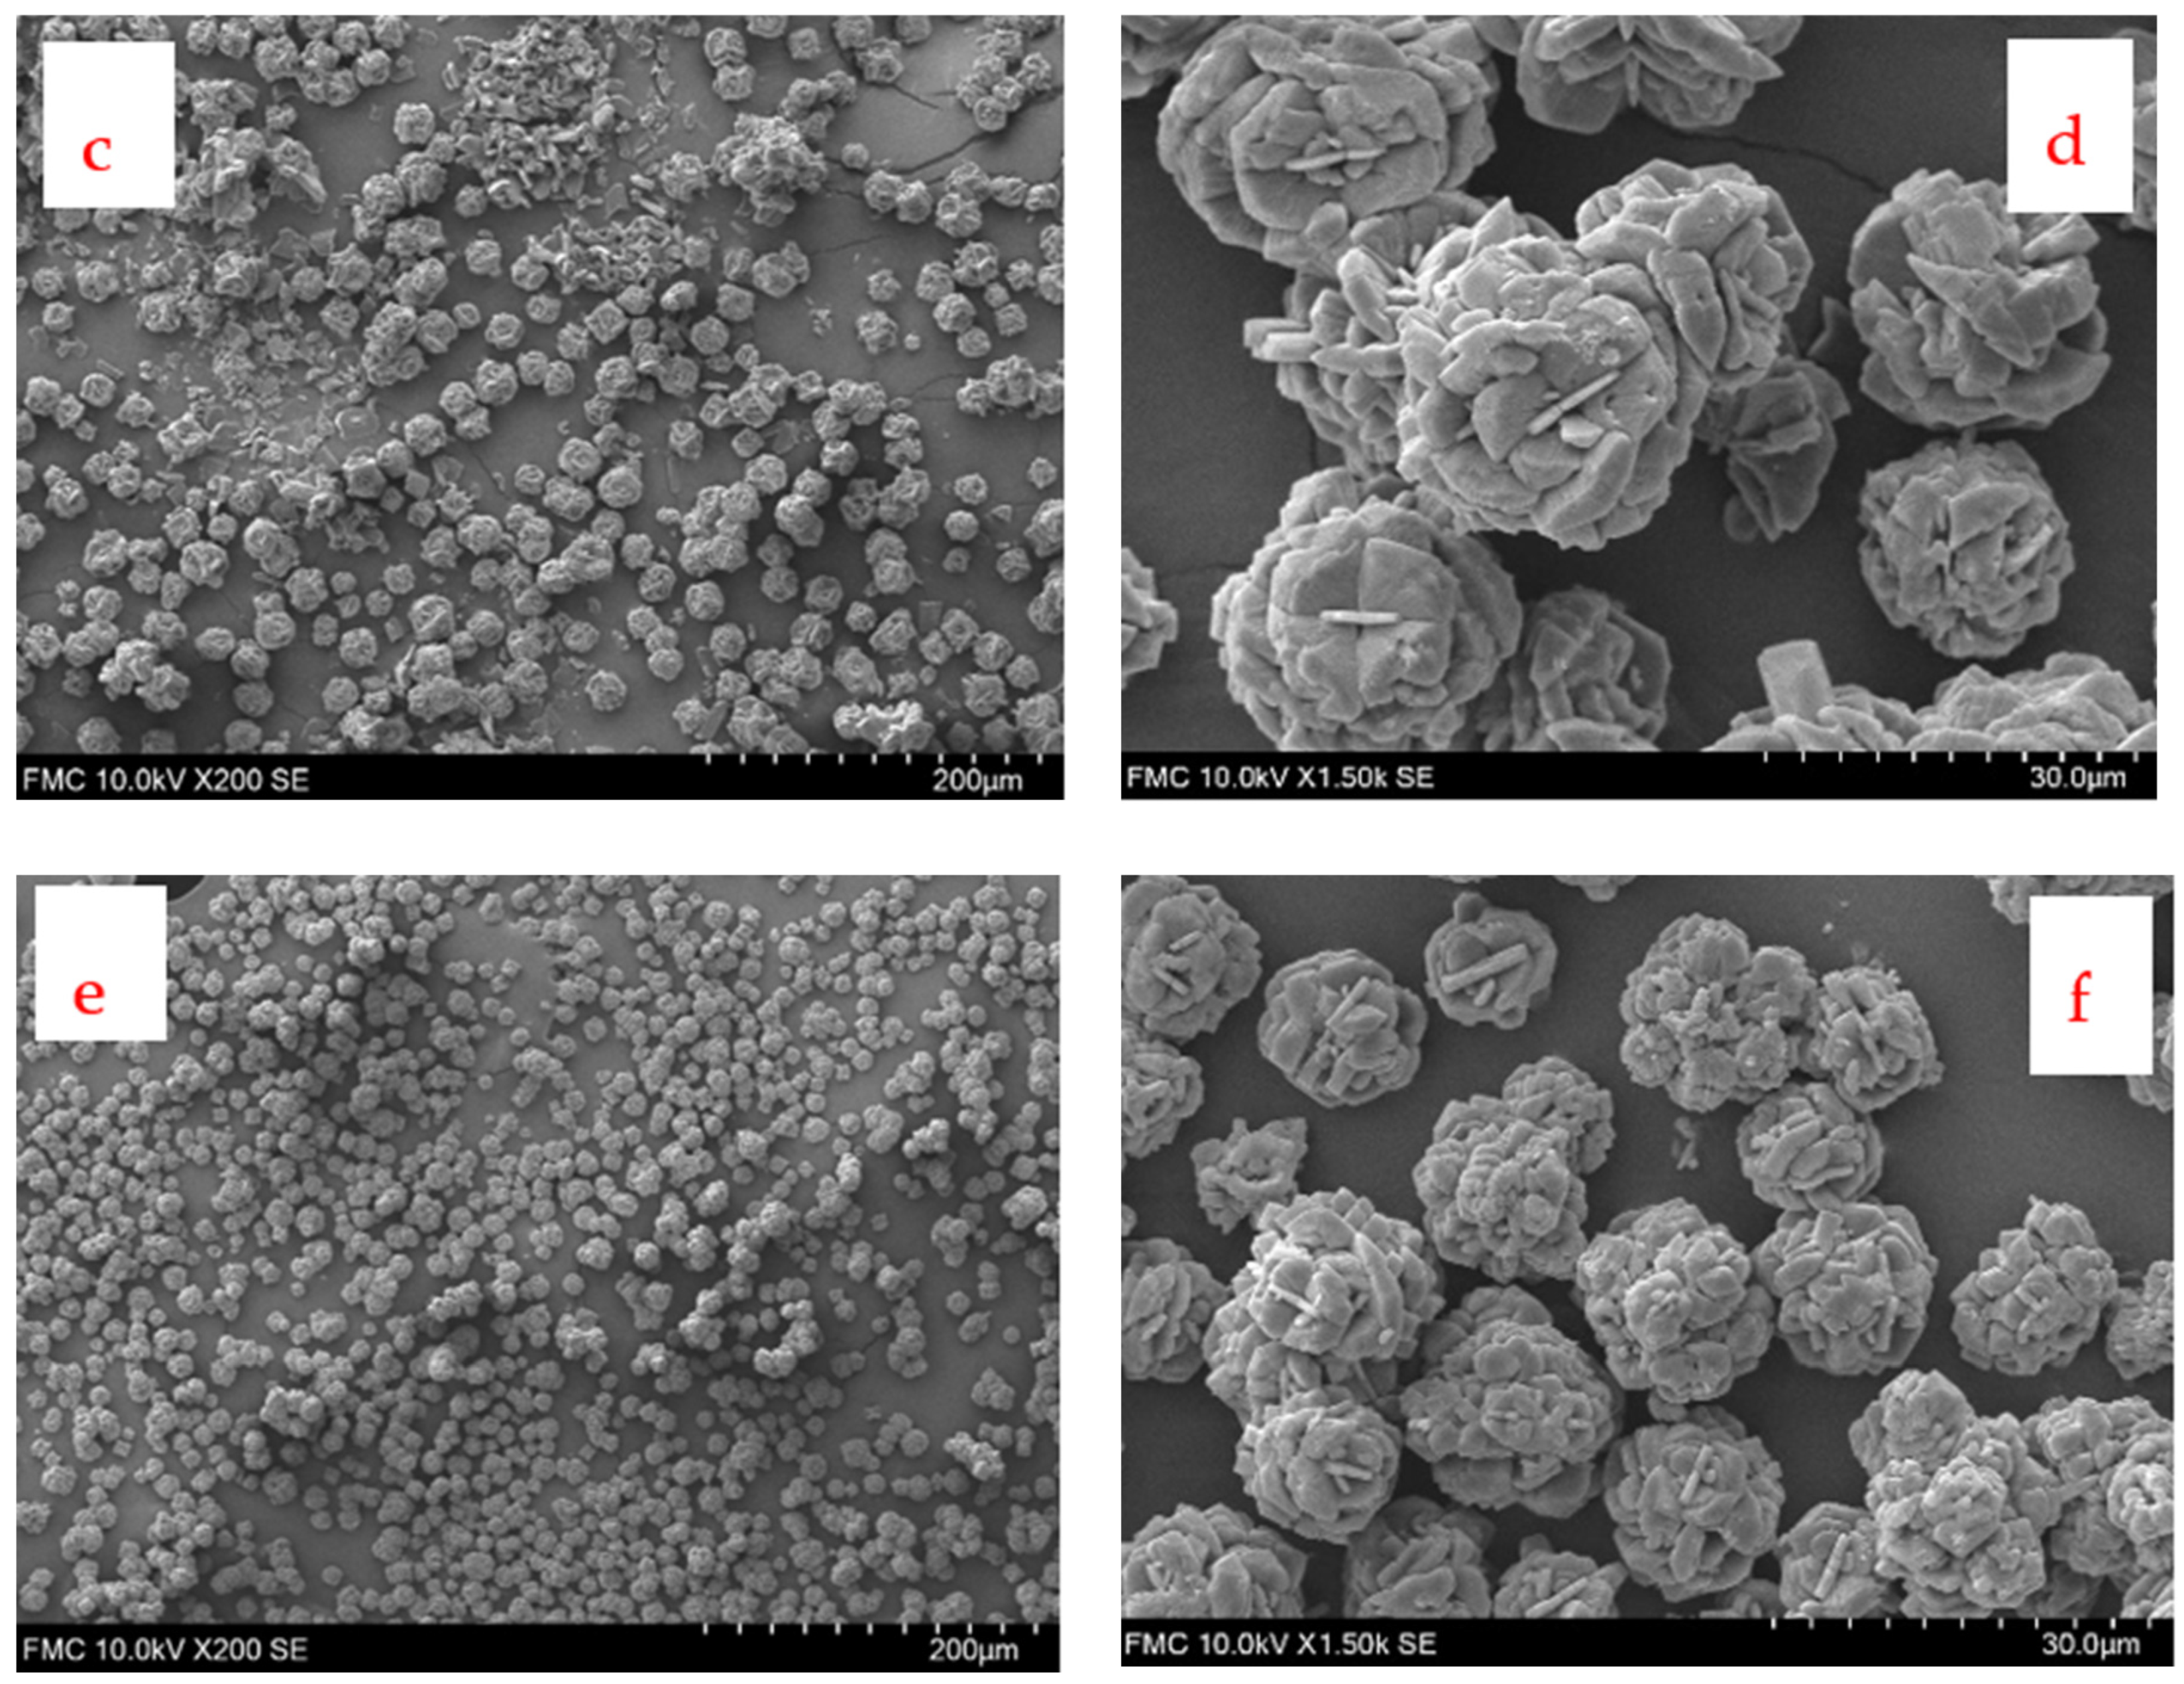
Figure 16 shows SEM images of Li2CO3 crystals obtained at 3 M LiCl in the presence of high-molecular-weight polyacrylic acid (PAA) (P2: 230,000 Da and P3: 450,000 Da). In all cases, compact spherulites consisting of radial plates formed denser than those observed without additives, where larger spherulites predominated and extensive agglomerates coexisted. P3 showed a higher proportion of fine particles (<10 µm), consistent with the trends recorded by FBRM in the fine particle count. The main difference between P2 and P3 lies in the microstructure: in P3, the spherulites are composed of thinner and more numerous plates, suggesting a fragmentation of radial growth compared to P2. However, these differences are relatively subtle at higher LiCl concentrations (e.g., 3 M), where the system exhibits enhanced nucleation and growth rates regardless of the additive’s presence, possibly masking more pronounced polymer-induced effects that are observable at lower concentrations.
These results confirm that the molecular weight of PAA modulates both the overall size and the internal organization of the spherulites. Longer chain length polymers, such as P3, possess more carboxylate groups capable of adsorbing multiple crystal faces, blocking active sites, and fragmenting the morphology into smaller plates. This promotes the formation of a greater number of radial nuclei that grow simultaneously, rather than allowing the expansive growth of a few plates, which generates more compact spherulites with a higher proportion of fines.
This behavior is consistent with the findings of Watamura et al. [27,28] in Li2CO3 and with the results of Huang et al. [55] in CaCO3, where increasing molecular weight intensified growth inhibition and diversified the morphology toward finer, more dense structures. Overall, the transition from large, unfilled spherulites to more compact structures with P2 and, primarily, P3 reflects a nonclassical polymer-assisted nucleation mechanism, where the stabilization of multiple nuclei and the adsorption of long chains favor smaller and denser microstructures, consistent with kinetic and CLD analyses obtained using FBRM.
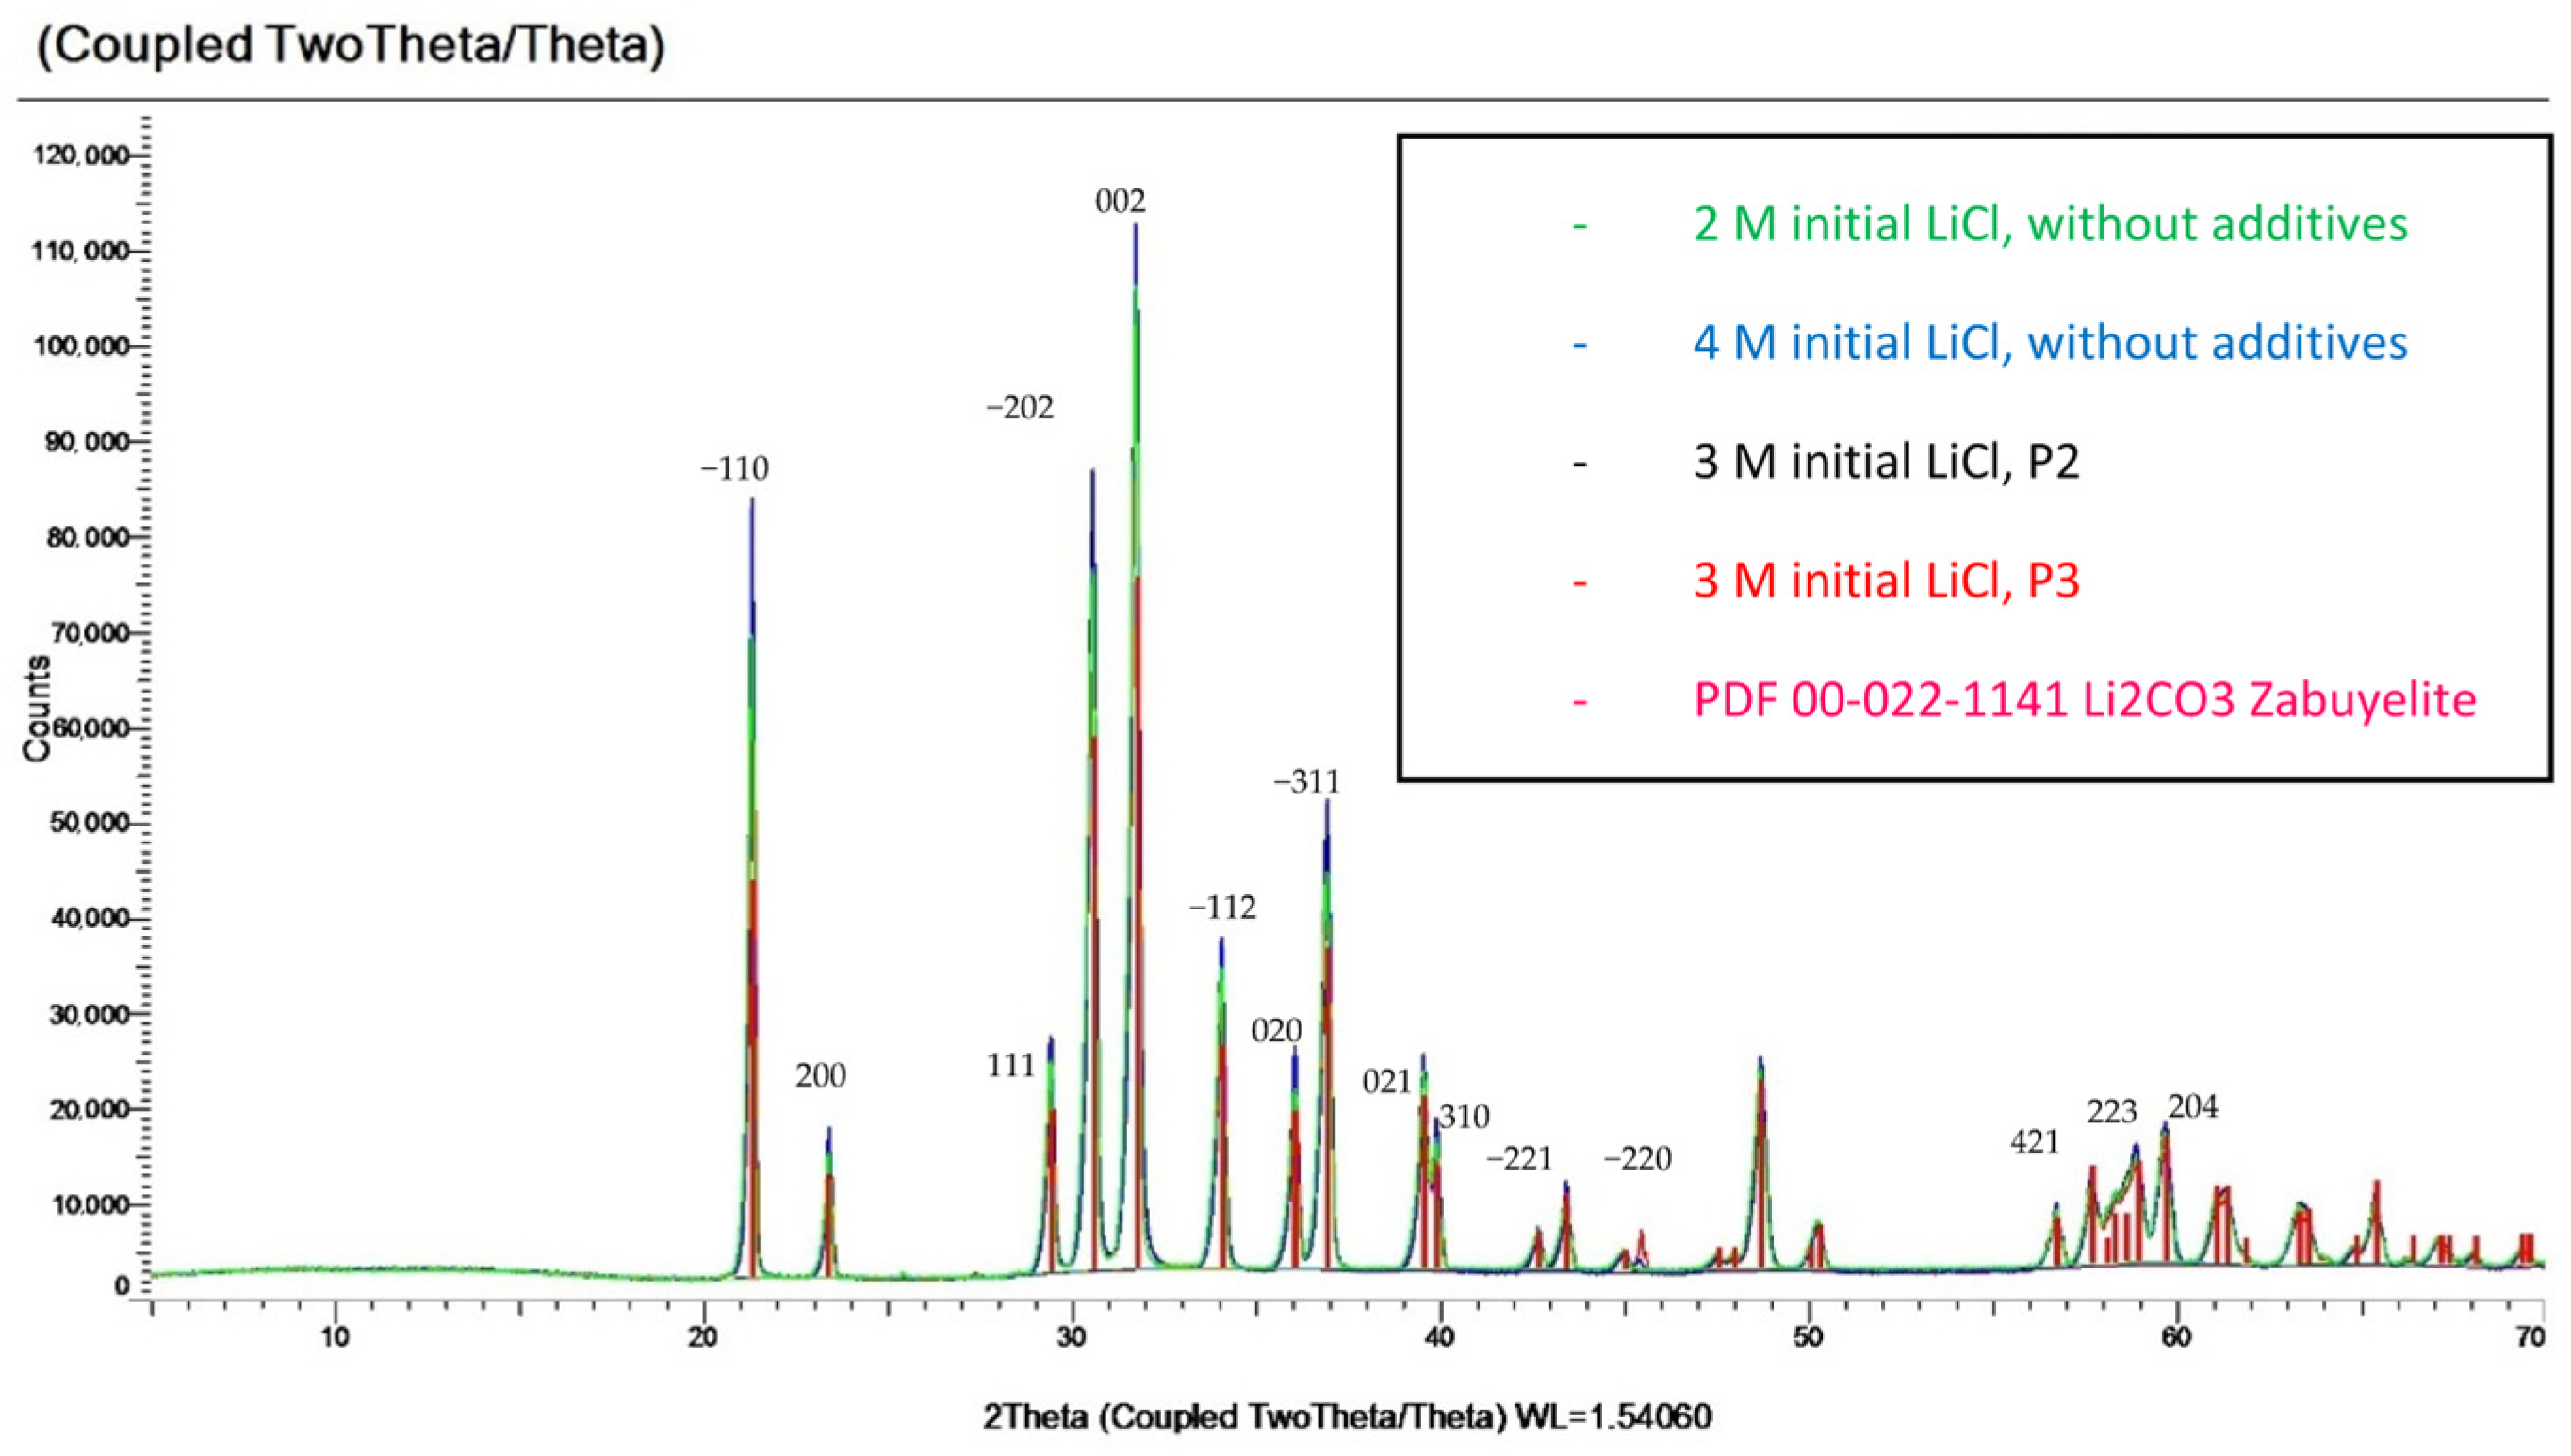
Figure 17 presents the X-ray diffraction (XRD) patterns of Li2CO3 crystals obtained under various conditions. In all cases, the diffraction peaks correspond to the Li2CO3 phase (zabuyelite) and match the characteristic positions and relative intensities reported in the literature for this phase (e.g., Taborga et al., 2017 [29], Han et al., 2020 [49]. No additional peaks or systematic shifts were detected because of variations in LiCl concentration or the presence of PAA. This clearly indicates that neither the initial supersaturation nor the polymeric additive induced changes in the crystal structure of the product. All precipitated solids are well-crystallized Li2CO3, regardless of differences in size or morphology. Therefore, the effects of LiCl concentration and PAA are confined to kinetic and morphological domains, influencing how and how fast Li2CO3 crystallizes—and in what form—but without altering its phase or internal crystallographic ordering. This outcome aligns with previous studies [27,28,29,30], which report that organic additives can modify the shape and size distribution of salt crystals without altering their lattice structure.

4. Conclusions

This study demonstrates that the reactive crystallization of Li2CO3 from LiCl and Na2CO3, monitored by FBRM, is characterized by very rapid experimental nucleation and growth, with maximum rates reached within the first seconds, followed by a subsequent decline as supersaturation is consumed. The initial LiCl concentration dictated the relative proportion of fine and coarse crystals. At 2 M, the growth of larger crystals predominated; at 3 M, stable bimodal populations were observed; and at 4 M, the high supersaturation led to massive nucleation, a significant presence of fines, and attrition phenomena.
The incorporation of polyacrylic acid (PAA) modified both kinetics and morphology, with molecular weight emerging as a critical factor. At low molecular weight (1800 Da), the formation and stabilization of fines were promoted. In contrast, at higher molecular weights (230,000 Da and 450,000 Da), crystal growth was limited, resulting in reduced formation of coarse crystals at 2–3 M but enhancing their presence under high supersaturation conditions (4 M). Analyses of the mean square-weighted chord length (MSW), the MSW/median no-weighted chord length (MNW) ratio, and the CLD confirmed that higher-chain polymers induced more heterogeneous distributions, resulting in increased morphological compaction and finer microstructures.
SEM analyses corroborate these trends. In the absence of additives, the spherulites were larger and more open. With low-molecular-weight PAA, agglomeration was reduced, and acicular crystals appeared. In contrast, high-molecular-weight PAA promoted the formation of more compact spherulites with thinner plates and an abundance of fines. These findings suggest that PAA simultaneously modulates primary nucleation and suppresses secondary nucleation, in agreement with both classical and nonclassical mechanisms reported in the literature.
It is recommended to extend the study to a broader range of molecular weights and polymer concentrations to identify threshold values for the inhibitory effect. Complementary in situ techniques such as PVM are also suggested to validate the morphological reorganization phenomena indicated by the FBRM data. Another proposed direction is the development of kinetic models coupled with population balance equations that incorporate agglomeration and attrition terms in the presence of additives. Finally, extrapolating these results to semi-continuous or continuous operating conditions, closer to industrial practice, would be valuable, as controlling the size and morphology of Li2CO3 is critical for high-energy-density battery applications.

Author Contributions

Conceptualization, E.P. and T.A.G.; methodology, E.P.; validation, T.A.G., R.I.J. and P.R.; formal analysis, R.I.J.; investigation, E.P.; resources, P.R.; data curation, E.P.; writing—original draft preparation, E.P.; writing—review and editing, P.R. and R.I.J.; visualization, T.A.G.; supervision, T.A.G. and R.I.J.; project administration, R.I.J.; funding acquisition, R.I.J. All authors have read and agreed to the published version of the manuscript.

Funding

This research was funded by ANID/Fondecyt/1221702.

Institutional Review Board Statement

Not applicable.

Informed Consent Statement

Not applicable.

Data Availability Statement

The original contributions presented in the study are included in the article, further inquiries can be directed to the corresponding author.

Acknowledgments

Eder Piceros acknowledges the infrastructure and support of the Programa de Doctorado en Ingeniería de Procesos de Minerales of the Universidad de Antofagasta. Ricardo I. Jeldres thanks Centro CRHIAM Project ANID/Fondap/1523A0001 and the AFB230001 ANID project. Pedro Robles thanks the Pontificia Universidad Católica de Valparaíso and ANID/Fondecyt/1221702 for the support provided.

Conflicts of Interest

The authors declare no conflicts of interest.

References

  1. Swain, B. Recovery and recycling of lithium: A review. Sep. Purif. Technol. 2017, 172, 388–403. [Google Scholar] [CrossRef]
  2. Tan, J.; Wang, Q.; Lin, Y.; Xiang, X. Direct preparation of battery-grade lithium carbonate via a nucleation–crystallization isolating process intensified by a micro-liquid film reactor. Can. J. Chem. Eng. 2022, 101, 870–882. [Google Scholar] [CrossRef]
  3. Ulrichsen, A.; Hampsey, E.; Taylor, R.H.; Gadelrab, R.; Strawbridge, R.; Young, A.H. Comparing measurements of lithium treatment efficacy in people with bipolar disorder: Systematic review and meta-analysis. BJPsych Open 2023, 9, e98. [Google Scholar] [CrossRef]
  4. Gao, Z.-W.; Lan, T.; Yin, H.; Liu, Y. Development and Commercial Application of Lithium-Ion Batteries in Electric Vehicles: A Review. Processes 2025, 13, 756. [Google Scholar] [CrossRef]
  5. Baudino, L.; Santos, C.; Pirri, C.F.; La Mantia, F.; Lamberti, A. Recent Advances in the Lithium Recovery from Water Resources: From Passive to Electrochemical Methods. Adv. Sci. 2022, 9, e2201380. [Google Scholar] [CrossRef]
  6. Szlugaj, J.; Radwanek-Bąk, B. Lithium sources and their current use. Gospod. Surowcami Miner.-Miner. Resour. Manag. 2022, 38, 61–88. [Google Scholar] [CrossRef]
  7. Ma, X.; Meng, Z.; Bellonia, M.V.; Spangenberger, J.; Harper, G.; Gratz, E.; Olivetti, E.; Arsenault, R.; Wang, Y. The evolution of lithium-ion battery recycling. Nat. Rev. Clean Technol. 2025, 1, 75–94. [Google Scholar] [CrossRef]
  8. Saleem, U.; Wilhelms, A.; Sottmann, J.; Knuutila, H.K.; Bandyopadhyay, S. Direct lithium extraction (DLE) methods and their potential in Li-ion battery recycling. Sep. Purif. Technol. 2025, 361, 131315. [Google Scholar] [CrossRef]
  9. Yuan, X.; Jiang, T.; Duan, C.; He, Y.; Wang, H.; Zhang, G. Multiple components synergistic separation and high-efficiency lithium extraction from spent lithium ion battery. Process. Saf. Environ. Prot. 2025, 197. [Google Scholar] [CrossRef]
  10. Kavanagh, L.; Keohane, J.; Garcia Cabellos, G.; Lloyd, A.; Cleary, J. Global Lithium Sources—Industrial Use and Future in the Electric Vehicle Industry: A Review. Resources 2018, 7, 57. [Google Scholar] [CrossRef]
  11. Cabello, J. Reservas, recursos y exploración de litio en salares del norte de Chile. Andean Geol. 2022, 49, 297–306. [Google Scholar] [CrossRef]
  12. Boryta, D.A.; Kullberg, T.F.; Thurston, A.M. Production of Lithium Compounds Directly from Lithium Containing Brines. U.S. Patent 7449161B2, 28 June 2007. [Google Scholar]
  13. Aguilar, P.G.; Graber, T.A. Determination of the Reaction Kinetic Parameters for Li2CO3 Crystallization from Li2SO4 and Na2CO3 Solutions Using Calorimetric Measurements. Ind. Eng. Chem. Res. 2018, 57, 4815–4823. [Google Scholar] [CrossRef]
  14. Liu, H.; Azimi, G. Process analysis and study of factors affecting the lithium carbonate crystallization from sulfate media during lithium extraction. Hydrometallurgy 2021, 199, 105532. [Google Scholar] [CrossRef]
  15. Sun, Y.; Song, X.; Wang, J.; Luo, Y.; Yu, J. Unseeded Supersolubility of Lithium Carbonate: Experimental Measurement and Simulation with Mathematical Models. J. Cryst. Growth 2009, 311, 4714–4719. [Google Scholar] [CrossRef]
  16. Sun, Y.; Song, X.; Wang, J.; Luo, Y.; Yu, J. Determination of seeded supersolubility of lithium carbonate using FBRM. J. Cryst. Growth 2010, 312, 294–300. [Google Scholar] [CrossRef]
  17. Zhao, S.; Gao, J.; Ma, S.; Li, C.; Ma, Y.; He, Y.; Gong, J.; Zhou, F.; Zhang, B.; Tang, W. Mechanism and Modelling of Reactive Crystallization Process of Lithium Carbonate. Processes 2019, 7, 248. [Google Scholar] [CrossRef]
  18. Chen, P.-C.; Jhuang, J.-H.; Tseng, C.-E.; Lin, Z.-Y. Crystallization Kinetics of Lithium Carbonate in a Continuous Stirred-Tank Crystallizer. Crystals 2024, 14, 1021. [Google Scholar] [CrossRef]
  19. Graber, T.A.; Taboada, M.E.; Cortés, L.; Piceros, E.; Meruane, G.; Aguilar, P. Reactive Crystallization Process of Li2CO3 from LiCl and Na2CO3 Mechanism and Modeling. Ind. Eng. Chem. Res. 2024, 63, 10299–10308. [Google Scholar] [CrossRef]
  20. Sun, Y.; Song, X.; Wang, J.; Yu, J. Preparation of Li2CO3 by gas-liquid reactive crystallization of LiOH and CO2. Cryst. Res. Technol. 2012, 47, 437–442. [Google Scholar] [CrossRef]
  21. Sun, Y.-Z.; Song, X.-F.; Jin, M.-M.; Jin, W.; Yu, J.-G. Gas–Liquid Reactive Crystallization of Lithium Carbonate by a Falling Film Column. Ind. Eng. Chem. Res. 2013, 52, 17598–17606. [Google Scholar] [CrossRef]
  22. Lovette, M.A.; Browning, A.R.; Griffin, D.W.; Sizemore, J.P.; Snyder, R.C.; Doherty, M.F. Crystal Shape Engineering. Ind. Eng. Chem. Res. 2008, 47, 9812–9833. [Google Scholar] [CrossRef]
  23. Matahwa, H.; Ramiah, V.; Sanderson, R. Calcium carbonate crystallization in the presence of modified polysaccharides and linear polymeric additives. J. Cryst. Growth 2008, 310, 4561–4569. [Google Scholar] [CrossRef]
  24. Gebauer, D.; Cölfen, H.; Verch, A.; Antonietti, M. The Multiple Roles of Additives in CaCO3Crystallization: A Quantitative Case Study. Adv. Mater. 2009, 21, 435–439. [Google Scholar] [CrossRef]
  25. Nicoleau, L.; Van Driessche, A.E.; Kellermeier, M. A kinetic analysis of the role of polymers in mineral nucleation: The example of gypsum. Cem. Concr. Res. 2019, 124, 105837. [Google Scholar] [CrossRef]
  26. Lemanowicz, M.; Mielańczyk, A.; Walica, T.; Kotek, M.; Gierczycki, A. Application of Polymers as a Tool in Crystallization—A Review. Polymers 2021, 13, 2695. [Google Scholar] [CrossRef]
  27. Watamura, H.; Sonobe, Y.; Hirasawa, I. Polyacrylic Acid-Assisted Crystallization Phenomena of Carbonate Crystals. Chem. Eng. Technol. 2014, 37, 1422–1426. [Google Scholar] [CrossRef]
  28. Watamura, H.; Marukawa, H.; Hirasawa, I. Polyelectrolyte effects on the crystallization phenomena of the lithium carbonate. J. Cryst. Growth 2013, 373, 111–117. [Google Scholar] [CrossRef]
  29. Taborga, P.; Brito, I.; Graber, T. Effect of additives on size and shape of lithium carbonate crystals. J. Cryst. Growth 2017, 460, 5–12. [Google Scholar] [CrossRef]
  30. Yang, W.; Zhou, L.; Dai, J.; Zhou, L.; Zhang, M.; Xie, C.; Hao, H.; Hou, B.; Bao, Y.; Yin, Q. Crystallization of Lithium Carbonate from Aqueous Solution: New Insights into Crystal Agglomeration. Ind. Eng. Chem. Res. 2019, 58, 18448–18455. [Google Scholar] [CrossRef]
  31. Wang, Y.; Du, S.; Wang, X.; Sun, M.; Yang, Y.; Gong, J. Spherulitic growth and morphology control of lithium carbonate: The stepwise evolution of core-shell structures. Powder Technol. 2019, 355, 617–628. [Google Scholar] [CrossRef]
  32. Li, X.; Xu, D.; Yang, J.; Yan, Z.; Luo, T.; Li, X.; Zhang, Z.; Wang, X. Utilization of FBRM and PVM to analyze the effects of different additives on the crystallization of ammonium dihydrogen phosphate. J. Cryst. Growth 2021, 576, 126378. [Google Scholar] [CrossRef]
  33. Albis, A.; Jiménez, Y.P.; Graber, T.A.; Lorenz, H. Reactive Crystallization Kinetics of K2SO4 from Picromerite-Based MgSO4 and KCl. Crystals 2021, 11, 1558. [Google Scholar] [CrossRef]
  34. Al Nasser, W.N.; Al Salhi, F.H. Kinetics determination of calcium carbonate precipitation behavior by inline techniques. Powder Technol. 2015, 270, 548–560. [Google Scholar] [CrossRef]
  35. Tadayyon, A.; Rohani, S. Control of fines suspension density in the fines loop of a continuous KCl crystallizer using transmittance measurement and an FBRM® probe. Can. J. Chem. Eng. 2000, 78, 663–673. [Google Scholar] [CrossRef]
  36. Kougoulos, E.; Jones, A.; Jennings, K.; Wood-Kaczmar, M. Use of focused beam reflectance measurement (FBRM) and process video imaging (PVI) in a modified mixed suspension mixed product removal (MSMPR) cooling crystallizer. J. Cryst. Growth 2005, 273, 529–534. [Google Scholar] [CrossRef]
  37. Martos, C.; Coto, B.; Peña, J.; Rodríguez, R.; Merino-Garcia, D.; Pastor, G. Effect of precipitation procedure and detection technique on particle size distribution of CaCO3. J. Cryst. Growth 2010, 312, 2756–2763. [Google Scholar] [CrossRef]
  38. Leyssens, T.; Baudry, C.; Hernandez, M.L.E. Optimization of a Crystallization by Online FBRM Analysis of Needle-Shaped Crystals. Org. Process. Res. Dev. 2011, 15, 413–426. [Google Scholar] [CrossRef]
  39. Zhang, D.; Liu, L.; Xu, S.; Du, S.; Dong, W.; Gong, J. Optimization of cooling strategy and seeding by FBRM analysis of batch crystallization. J. Cryst. Growth 2018, 486, 1–9. [Google Scholar] [CrossRef]
  40. Al Nasser, W.N.; Al Salhi, F.H. Scaling and aggregation kinetics determination of calcium carbonate using inline technique. Chem. Eng. Sci. 2013, 86, 70–77. [Google Scholar] [CrossRef]
  41. Xue, J.; Liu, C.; Luo, M.; Lin, M.; Jiang, Y.; Li, P.; Yu, J.; Rohani, S. Secondary nucleation and growth kinetics of aluminum hydroxide crystallization from potassium aluminate solution. J. Cryst. Growth 2019, 507, 232–240. [Google Scholar] [CrossRef]
  42. Serpa, F.S.; Silva, G.M.; Freitas, L.F.; Filho, E.B.M.; Nascimento, J.F.; Pereira, L.S.; Salazar-Banda, G.R.; Borges, G.R.; Dariva, C.; Franceschi, E. An experimental study of calcium carbonate precipitation with hydrate inhibitor in MEG recovery unit. Upstream Oil Gas Technol. 2022, 8, 100061. [Google Scholar] [CrossRef]
  43. Rasteiro, M.G.; Koponen, A. Monitoring Aggregation Processes in Multiphase Systems: A Review. Powders 2024, 3, 77–110. [Google Scholar] [CrossRef]
  44. Heath, A.R.; Fawell, P.D.; Bahri, P.A.; Swift, J.D. Estimating Average Particle Size by Focused Beam Reflectance Measurement (FBRM). Part. Part. Syst. Charact. 2002, 19, 84. [Google Scholar] [CrossRef]
  45. Trifkovic, M.; Sheikhzadeh, M.; Rohani, S. Kinetics Estimation and Single and Multi-Objective Optimization of a Seeded, Anti-Solvent, Isothermal Batch Crystallizer. Ind. Eng. Chem. Res. 2008, 47, 1586–1595. [Google Scholar] [CrossRef]
  46. Tavare, N.S.; Gaikar, V.G. Precipitation of salicyclic acid: Hydrotropy and reaction. Ind. Eng. Chem. Res. 1991, 30, 722–728. [Google Scholar] [CrossRef]
  47. Liu, Y.; Xiao, M.; Huang, X.; Park, J.; Hoffman, M.E.; Feng, Y.; An, A.K.; Li, Q.; Hoek, E.M.V.; Jassby, D. Mitigating CaCO3 crystal nucleation and growth through continuous ion displacement via alternating electric fields. Nat. Commun. 2025, 16, 35. [Google Scholar] [CrossRef] [PubMed]
  48. Zhu, G.; Li, H.; Li, S.; Hou, X.; Xu, D.; Lin, R.; Tang, Q. Crystallization behavior and kinetics of calcium carbonate in highly alkaline and supersaturated system. J. Cryst. Growth 2015, 428, 16–23. [Google Scholar] [CrossRef]
  49. Han, B.; Haq, R.A.U.; Louhi-Kultanen, M. Lithium carbonate precipitation by homogeneous and heterogeneous reactive crystallization. Hydrometallurgy 2020, 195, 105386. [Google Scholar] [CrossRef]
  50. Ahn, B.; Bosetti, L.; Mazzotti, M. Secondary Nucleation by Interparticle Energies. III. Nucleation Rate Model. Cryst. Growth Des. 2022, 22, 3625–3636. [Google Scholar] [CrossRef]
  51. Söhnel, O.; Mullin, J.W. Interpretation of crystallization induction periods. J. Colloid Interface Sci. 1988, 123, 43–50. [Google Scholar] [CrossRef]
  52. McDonald, M.A.; Salami, H.; Harris, P.R.; Lagerman, C.E.; Yang, X.; Bommarius, A.S.; Grover, M.A.; Rousseau, R.W. Reactive crystallization: A review. React. Chem. Eng. 2021, 6, 364–400. [Google Scholar] [CrossRef]
  53. Gebauer, D. How Can Additives Control the Early Stages of Mineralisation? Minerals 2018, 8, 179. [Google Scholar] [CrossRef]
  54. Teychené, S.; Rodríguez-Ruiz, I.; Ramamoorthy, R.K. Reactive crystallization: From mixing to control of kinetics by additives. Curr. Opin. Colloid Interface Sci. 2020, 46, 1–19. [Google Scholar] [CrossRef]
  55. Huang, S.-C.; Naka, K.; Chujo, Y. Effect of Molecular Weights of Poly (acrylic acid) on Crystallization of Calcium Carbonate by the Delayed Addition Method. Polym. J. 2008, 40, 154–162. [Google Scholar] [CrossRef]
  56. Sun, S.; Mao, L.; Lei, Z.; Yu, S.; Cölfen, H. Hydrogels from Amorphous Calcium Carbonate and Polyacrylic Acid: Bio-Inspired Materials for “Mineral Plastics”. Angew. Chem. Int. Ed. Engl. 2016, 55, 11765–11769. [Google Scholar] [CrossRef]
  57. Donnet, M.; Aimable, A.; Lemaître, J.; Bowen, P. Contribution of Aggregation to the Growth Mechanism of Seeded Calcium Carbonate Precipitation in the Presence of Polyacrylic Acid. J. Phys. Chem. B 2010, 114, 12058–12067. [Google Scholar] [CrossRef] [PubMed]
  58. Anwar, J.; Boateng, P.K.; Tamaki, R.; Odedra, S. Mode of Action and Design Rules for Additives That Modulate Crystal Nucleation. Angew. Chem. 2009, 121, 1624–1628. [Google Scholar] [CrossRef]
  59. Jehannin, M.; Rao, A.; Cölfen, H. New Horizons of Nonclassical Crystallization. J. Am. Chem. Soc. 2019, 141, 10120–10136. [Google Scholar] [CrossRef] [PubMed]
  60. Tang, Q.; Nie, J.; Fang, W.; Xie, H.; Wang, W.; Wang, H.; Ping, H.; Li, B.; Fu, Z. Effects of Polyacrylic Acid with Different Molecular Weights on Stress Generation through Regulating the Growth of Calcium Carbonate within Collagen. ACS Appl. Bio Mater. 2025, 8, 2386–2396. [Google Scholar] [CrossRef] [PubMed]
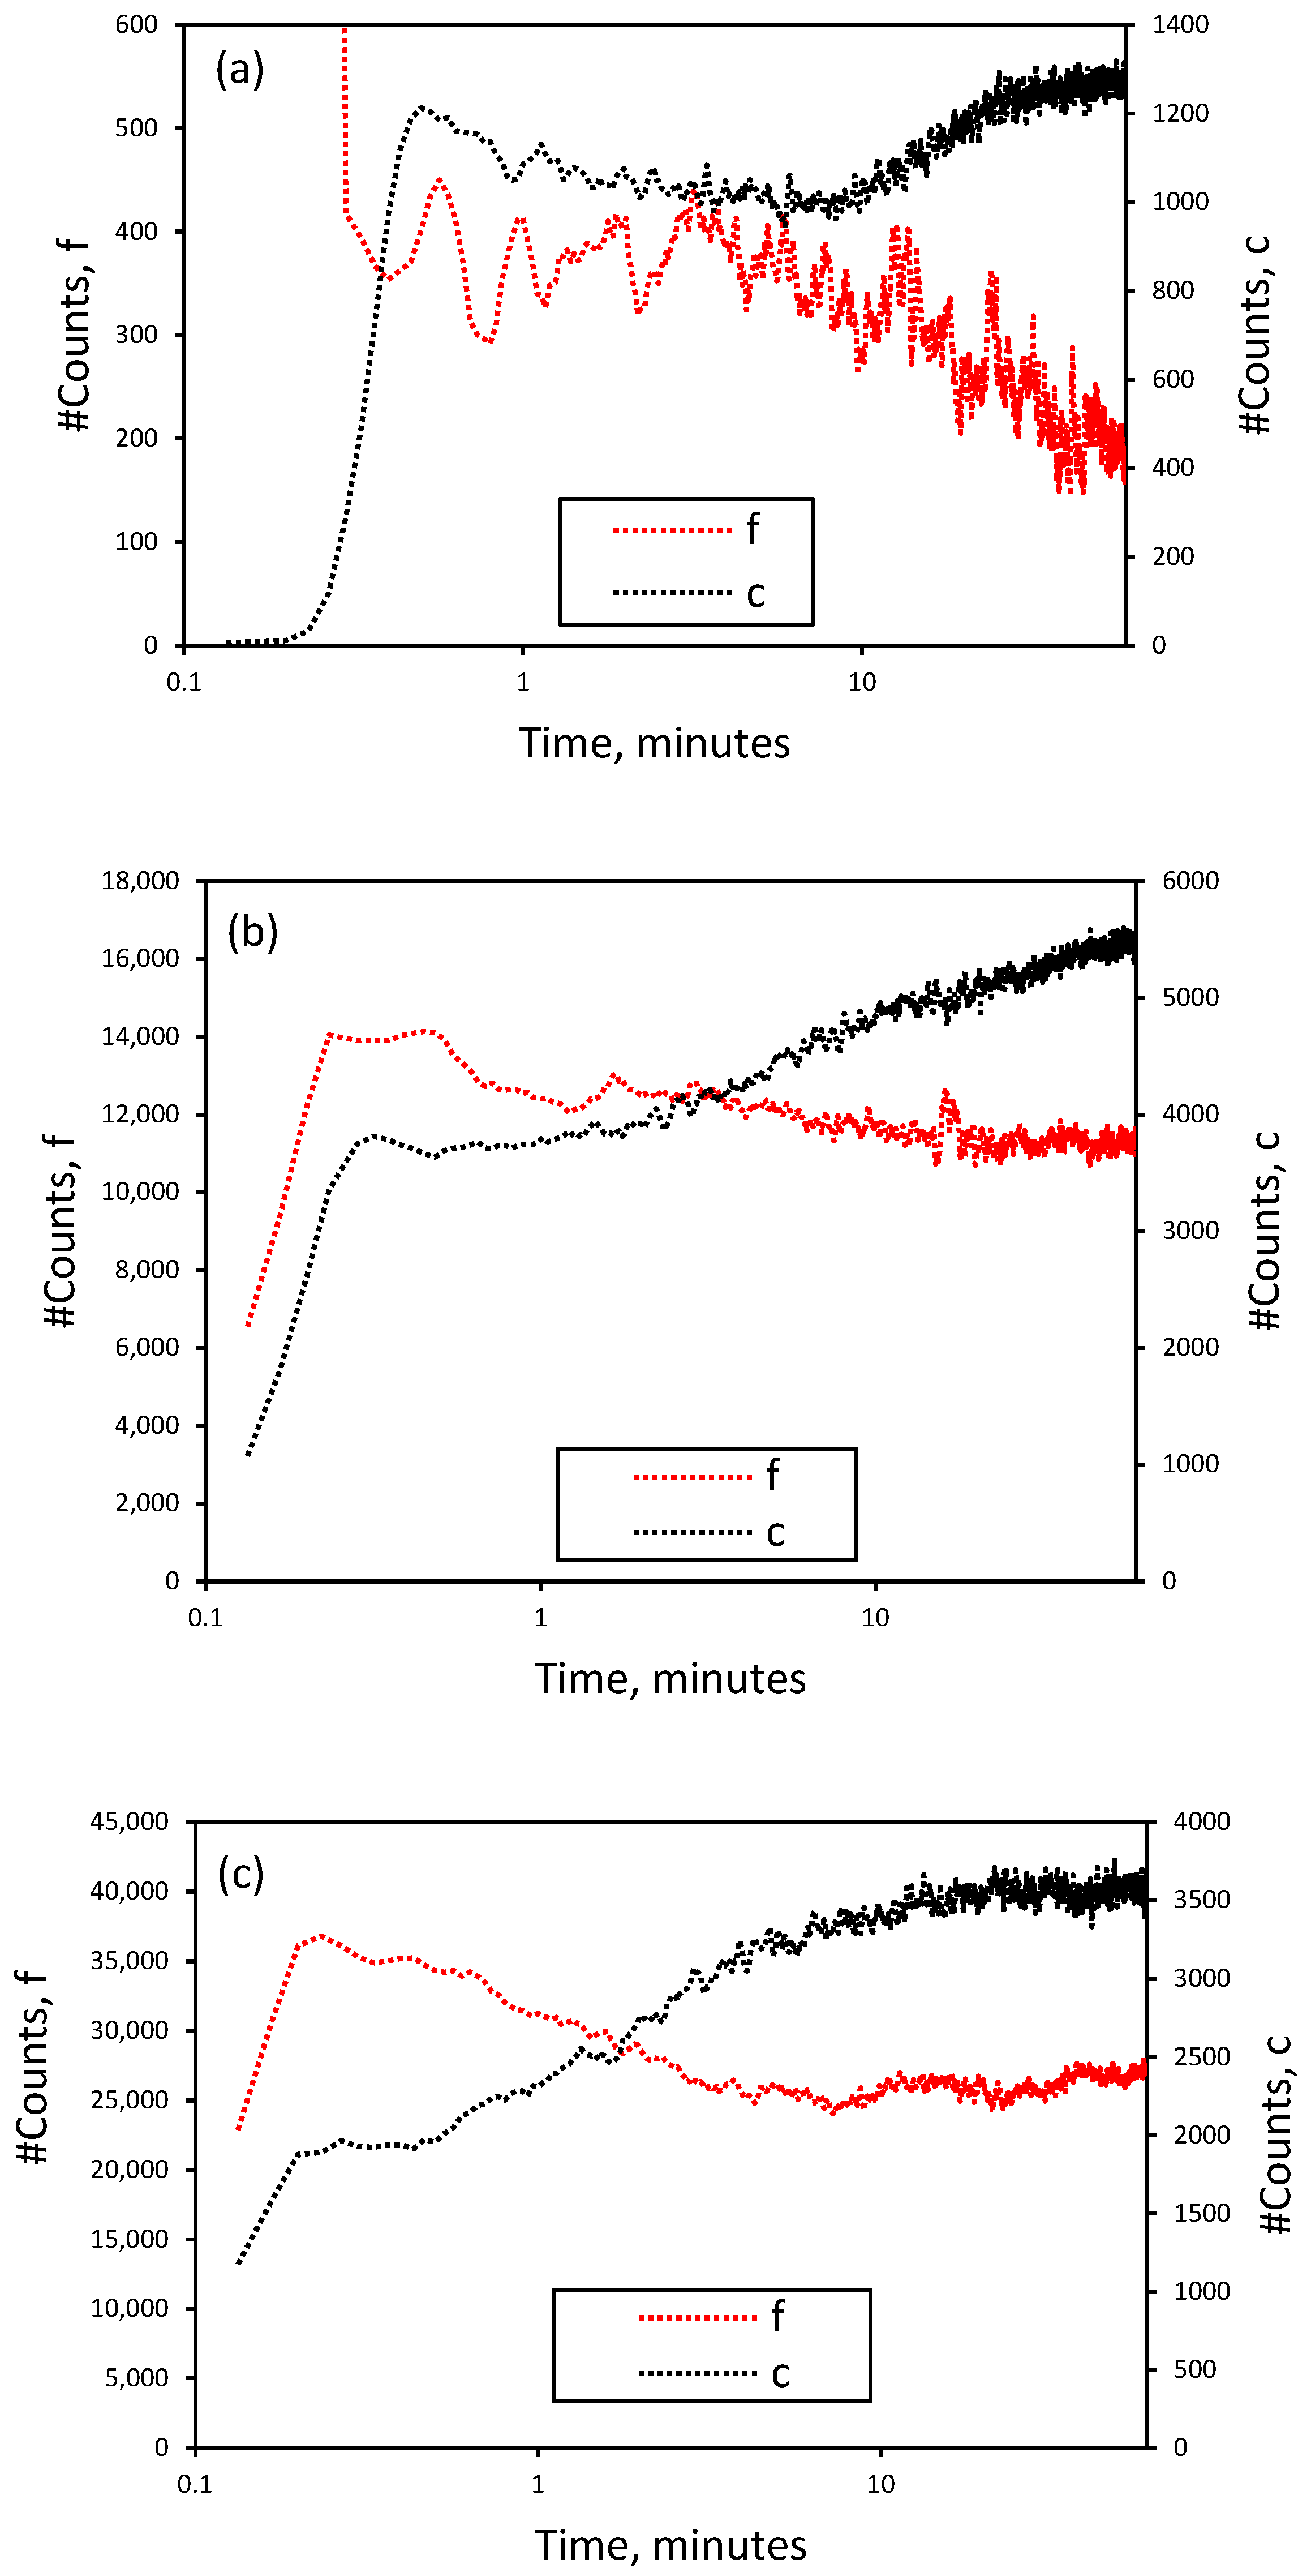
Figure 1. Count of chord length of lithium carbonate crystals obtained for different initial LiCl concentrations. (a) 2 M, (b) 3 M, (c) 4 M. f: fines and c: coarses. Curves are presented on a semi-logarithmic scale to appreciate the first moments better.
Inorganics 13 00377 g001
Figure 2. Ratio of fine to coarse particles at different initial lithium carbonate concentrations. Curves are presented on a semi-logarithmic scale to understand the initial moments better.
Inorganics 13 00377 g002
Figure 3. Time evolution of the mean square-weighted chord length (MSW) of lithium carbonate crystals at different initial LiCl concentrations. Curves are presented on a semi-logarithmic scale to appreciate the initial moments better.
Inorganics 13 00377 g003
Figure 4. Ratio between the mean square-weighted chord length and the median no-weighted chord length of lithium carbonate crystals obtained at different initial LiCl concentrations, determined by FBRM. Curves are presented on a semi-logarithmic scale to understand the initial moments better.
Inorganics 13 00377 g004
Figure 5. Chord length distribution (CLD) of lithium carbonate crystals at different times and initial LiCl concentrations, measured with an FBRM probe. (a) No-weighted, 2 M initial LiCl, (b) No-weighted, 3 M initial LiCl, (c) No-weighted, 4 M initial LiCl, (d) Square weighted, 2 M initial LiCl, (e) Square weighted, 3 M initial LiCl, (f) Square weighted, 4 M initial LiCl.
Inorganics 13 00377 g005aInorganics 13 00377 g005b
Figure 6. Nucleation and growth rates of Li2CO3 for an initial LiCl concentration of 2 M: (a) nucleation rate, (b) growth rate.
Inorganics 13 00377 g006
Figure 7. Plot of log(tind) versus (logS)−2 for Li2CO3 crystallization.
Inorganics 13 00377 g007
Figure 8. Chord length counts of lithium carbonate crystals ≤ 10 μm at different initial lithium chloride concentrations in the presence of polyacrylic acid: (a) 2 M, (b) 3 M, (c) 4 M. (P1, P2, and P3 correspond to polyacrylic acid with molecular weights of 1800, 230,000, and 450,000 Da, respectively).
Inorganics 13 00377 g008aInorganics 13 00377 g008b
Figure 9. Chord length counts of coarse lithium carbonate crystals (50–150 μm) at different initial lithium chloride concentrations in the presence of polyacrylic acid: (a) 2 M, (b) 3 M, (c) 4 M. (P1, P2, and P3 correspond to polyacrylic acid with molecular weights of 1800, 230,000, and 450,000 Da, respectively).
Inorganics 13 00377 g009aInorganics 13 00377 g009b
Figure 10. Ratio of fine (≤10 mm) to coarse (50–150 mm) lithium carbonate crystals at different initial LiCl concentrations and in the presence of polyacrylic acid. (a) 2 M, (b) 3 M, (c) 4 M. (P1, P2, and P3 correspond to polyacrylic acid with molecular weights of 1800, 230,000, and 450,000 Da, respectively). The arrow indicates that the P2 curve is plotted on the right-hand y-axis.
Inorganics 13 00377 g010
Figure 11. Length and chord length distribution of lithium carbonate crystals obtained from LiCl solution with an initial concentration of 2 M: (a) mean squared-weighted chord length, (b) MSW/MNW ratio, (c) no-weighted chord length distribution, (d) squared-weighted chord length distribution. (P1, P2, and P3 correspond to polyacrylic acid with molecular weights of 1800, 230,000, and 450,000 Da, respectively).
Inorganics 13 00377 g011
Figure 12. Length and chord length distribution of lithium carbonate crystals obtained from LiCl solution with an initial concentration of 3 M: (a) mean squared-weighted chord length, (b) MSW/MNW ratio, (c) no-weighted chord length distribution, (d) squared-weighted chord length distribution. (P1, P2, and P3 correspond to polyacrylic acid with molecular weights of 1800, 230,000, and 450,000 Da, respectively).
Inorganics 13 00377 g012
Figure 13. Length and chord length distribution of lithium carbonate crystals obtained from LiCl solution with an initial concentration of 4 M: (a) mean squared-weighted chord length, (b) MSW/MNW ratio, (c) no-weighted chord length distribution, (d) squared-weighted chord length distribution. (P1, P2, and P3 correspond to polyacrylic acid with molecular weights of 1800, 230,000, and 450,000 Da, respectively).
Inorganics 13 00377 g013
Figure 14. SEM images of lithium carbonate obtained at different initial lithium chloride concentrations: (a,b) 2 M initial LiCl, (c,d) 3 M initial LiCl, (e,f) 4 M initial LiCl.
Inorganics 13 00377 g014aInorganics 13 00377 g014b
Figure 15. SEM images of lithium carbonate obtained at an initial LiCl concentration of 2 M: (a) in the absence of additives, (b) in the presence of 0.025 g/L polyacrylic acid, Mw: 1800.
Inorganics 13 00377 g015
Figure 16. SEM images of lithium carbonate crystals obtained at an initial LiCl concentration of 3 M under different additive conditions: (a,b) in the absence of additives, (c,d) with 0.025 g/L polyacrylic acid, Mw: 230,000, (e,f) with 0.025 g/L polyacrylic acid, Mw: 450,000.
Inorganics 13 00377 g016
Figure 17. XRD patterns of Li2CO3 obtained in the presence of polyacrylic acid.
Inorganics 13 00377 g017
Table 1. Reagent concentration and additive dosage (additive dosage fixed at 25 mg L−1 is per volume of lithium chloride solution).
[LiCl]0
(mol/L)
[Na2CO3]0 (mol/L)No
Additive
PAA
(Mw 1800)
PAA
(Mw 230,000)
PAA
(Mw 450,000)
2.01.0Test 1Test 4Test 7Test 10
3.01.5Test 2Test 5Test 8Test 11
4.02.0Test 3Test 6Test 9Test 12
Table 2. Maximum nucleation and growth rates of lithium carbonate for different initial lithium chloride concentrations.
ExperimentBmax, [Counts/min]Gmax, [μm/min]
Initial LiCl concentration of 2 M3.00 × 1047.50 × 102
Initial LiCl concentration of 3 M6.73 × 1052.97 × 105
Initial LiCl concentration of 4 M9.67 × 1051.36 × 106
Table 3. Maximum nucleation rate ( B m a x ) and growth rate ( G m a x ) of lithium carbonate at different initial lithium chloride concentrations. Units: B m a x in c o u n t s / m i n , G m a x in [μm/min].
2 M Initial LiCl3 M Initial LiCl4 M Initial LiCl
BmaxGmaxBmaxGmaxBmaxGmax
No additive 3.00 × 10 4 7.50 × 10 2 6.73 × 10 5 2.97 × 10 5 9.67 × 10 5 1.36 × 10 6
P1 1.04 × 10 3 1.34 × 10 3 7.49 × 10 5 6.66 × 10 5 6.40 × 10 5 1.04 × 10 4
P2 8.65 × 10 3 8.74 × 10 2 7.68 × 10 5 1.04 × 10 5 6.42 × 10 5 9.03 × 10 2
P3 5.47 × 10 3 8.26 × 10 2 6.68 × 10 5 4.72 × 10 3 4.87 × 10 5 6.64 × 10 1
Disclaimer/Publisher’s Note: The statements, opinions and data contained in all publications are solely those of the individual author(s) and contributor(s) and not of MDPI and/or the editor(s). MDPI and/or the editor(s) disclaim responsibility for any injury to people or property resulting from any ideas, methods, instructions or products referred to in the content.