Abstract
The alloy TiFe is widely used as hydrogen storage material. However, the first hydrogenation is difficult. It was found that the addition of zirconium greatly improves the kinetic of first hydrogenation, but the mechanism is not well understood. In this paper, we report the use of scanning photoemission microscopy to investigate the composition and chemical state of the various phases present in this alloy and how they change upon hydrogenation/dehydrogenation. We found the presence of different oxide phases that were not seen by conventional SEM investigation. The nature of these oxides phases seems to change upon hydrogenation/dehydrogenation cycle. This indicates that oxide phases may play a more significant role in the hydrogen absorption as what was previously believed.
1. Introduction
Intermetallic TiFe-compounds are attractive hydrogen storage materials due to their low cost, elemental abundance, and near ambient temperature and mild hydrogen pressure absorption. In recent years, their use has been demonstrated to be successful in a number of large-scale stationary applications [1,2,3,4]. The main disadvantage is the slow activation (first hydrogenation) properties of TiFe, requiring high temperatures (about 400 °C) and pressure of ca. 50 bars [5]. Usually, the first hydrogenation has a long incubation period that may vary with alloy composition and pressure/temperature conditions. This behaviour is associated with an oxide surface passivation layer. Improvement of activation could be achieved in many ways. One is mechanical activation through ball milling, high-pressure torsion and other severe plastic deformation techniques [6,7,8,9,10]. Presently, the most common solution for better first hydrogenation and cycle life is to partly substitute Fe by Mn. This result in the formation of secondary phases reactive to hydrogen that enhances the first hydrogenation properties [11].
Recently it was shown that TiFe with 4 wt.% Zr greatly improved the first hydrogenation kinetics, after processing the sample via ball milling [12]. The faster hydrogenation kinetics of the processed samples compared to the as-cast sample has been attributed to the reduction of crystallite sizes and formation of new grain boundaries (increase of their relative volume) with longer ball milling times. However, the ball milled samples also showed a decreased hydrogen storage capacity compared to the as-cast sample, likely due to the formation of grain boundaries that enhanced hydrogen diffusion but did not store hydrogen in their structures. Analysis concluded that the improved kinetics was not related to the rate-limiting step of the first hydrogenation, since all samples fitted well with a 3D growth, with the growth interface velocity of diffusion decreasing with time.
Another effective approach to improve the activation of TiFe is via element substitution using transition metals (TMs), such as Mn, Cr, and Zr [13,14]. Doing this also affects kinetics, thermodynamics and cyclability of the TiFe-based materials. Substituents can influence the structural properties of the alloys, for instance via formation of secondary phases [15,16,17], or altering hydride phase stability. Studies have shown that the first hydrogenation of TiFe was achieved at room temperature by adding Zr [18,19,20].
Previous investigation has shown that the TiFe + 4 wt.% Zr alloy is composed of a TiFe main phase with a Zr-rich secondary phase [12,18,20,21,22]. This mechanism is somewhat similar to the one seen for the Ti (Fe, Mn) alloys [11]. In this paper, we investigate the role of the composition of the phases in the hydrogenation behaviour. Our hypothesis is that the improvement in kinetics is caused by the specific microstructure [21] and chemical composition of the secondary phase. The zirconium-rich phase acts as a gateway for hydrogen to reach the TiFe phase and thus makes the hydrogenation much faster than in pure TiFe. Additionally, the variation of composition at the interface matrix/secondary phase may play an important role in the transfer of hydrogen from the secondary phase to the matrix.
2. Results and Discussion
2.1. As-Cast Sample
Figure 1 shows a survey spectrum of the cast TiFe + 4 wt.% Zr. Beside the constituent elements oxygen indicates oxidation at the surface and there is a small amount of carbon contamination coming from handling the sample. As the fine chemical state, e.g., oxide vs. metallic, cannot be distinguished in such a survey, in the following, we will focus on the detailed core level spectra.
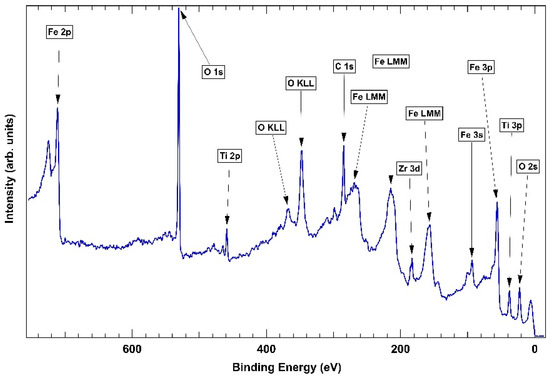
Figure 1.
Survey spectrum of as-cast TiFe + 4 wt.% Zr.
The elemental distribution of as-cast TiFe + 4 wt.% Zr is shown in Figure 2. From previous investigations it is known that this alloy is made of two phases: a main TiFe phase along with a Zr-rich secondary phase [20,22]. This is confirmed by the present measurement. It should be pointed out that the region of interest was selected to mainly investigate the secondary phase. Therefore, these mappings do not reflect the true relative abundance of the main (TiFe) and secondary phase. The figure shows that iron is relatively uniformly distributed through the alloy while titanium abundance is slightly reduced in the TiFe phase. The most interesting feature is the higher abundance of zirconium at the edge of the secondary phase.
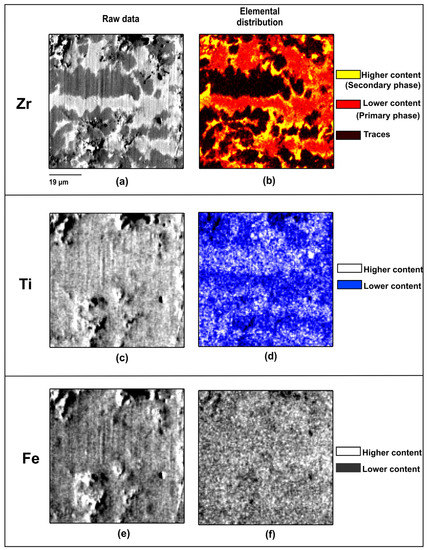
Figure 2.
Element distribution in as-cast TiFe + 4 wt.% Zr. Zr (a,b), Ti (c,d), Fe (e,f). Raw data: (a,c,e), Elemental distribution (b,d,f).
The abundance of zirconium at the edge of the secondary phase was quantified in a previous investigation [19]. Figure 3 is a typical micrograph and table of element concentration in the different regions. The matrix is TiFe phase (Space group Pm-3 m, structure type CsCl) with small amount of Zr substituting for Fe. The grey secondary phase is also close to the TiFe phase with more zirconium replacing iron. At the edge of the secondary phase, the bright area contains zirconium and also more titanium. This is in agreement with Figure 2.
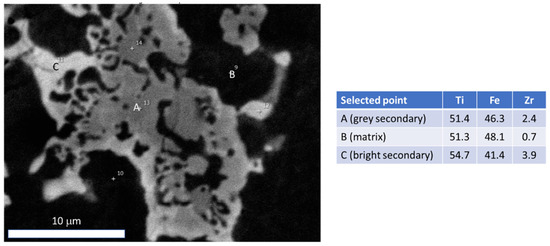
Figure 3.
Element distribution in as-cast TiFe + 4 wt.% Zr. (adapted with permission from ref. [19], 2016, Elsevier).
This concentration of zirconium at the edge of the secondary phase is most likely due to the metastable state of the alloy. As shown by Patel et al., after heat treatment at 1173 K for 24 h, the secondary phase is more concentrated in zirconium while the amount of zirconium in the TiFe phase is almost zero [23]. The secondary phase was also found to be uniform with no sign of zirconium concentration at the edges. They also show that the first hydrogenation was practically impossible for the heat-treated alloy. Therefore, the metastable state and the variation of composition at the interface matrix/secondary phase may play an important role in the transfer of hydrogen from the secondary phase to the matrix. The exact crystal structure of the secondary phase is under investigation. Preliminary results from neutron diffraction points toward a hexagonal MgZn2-type structure.
As the bulk composition of the matrix and secondary phases are relatively close, it is important to probe the electronic structure of each element in these phases to see if there is a difference (for instance if the chemical state of iron is different when it is situated in the matrix or in the secondary phase).
The ESCA (Electron Spectroscopy for Chemical Analysis) microscopy measurements have been performed to accurately measure the element’s concentration at the boundary between these two phases and also to probe the chemical state of each element. This will possibly help us understand if zirconium-rich phase can act as a gateway for hydrogen to reach the TiFe phase and thus making the hydrogenation much faster than in pure TiFe.
The measurements showed that a good spatial resolution was achieved and that the chemical state of the elements could be verified, with the chemical state of iron being different when situated in the matrix or in the zirconium-rich secondary phase. Zirconium content changes within the zirconium-rich phase, with more zirconium at the edge between the bright phase and TiFe phase.
2.2. As Cast Powder
Figure 4 shows the SPEM (scanning photoemission microscope) analysis of the as-cast powder; images in the first column (panels (a), (e) and (i)) show the photoemission maps recorded by collecting photoelectrons at the Zr 3d, Ti 2p and Fe 2p core levels, respectively. The three maps appear very similar because the contrast is dominated by the topography of the powder sample. In the second column (panels (b), (f) and (j)) the corresponding background subtracted maps are shown (see experimental section). They represent the elemental concentration of each atomic species in the probed area. The brighter the region, the higher the concentration of elements. The areas at the left and right side appearing very dark in the contrast are regions completely shadowed where the applied algorithm is not able to properly remove the topographic contribution. They should not be considered in the analysis.
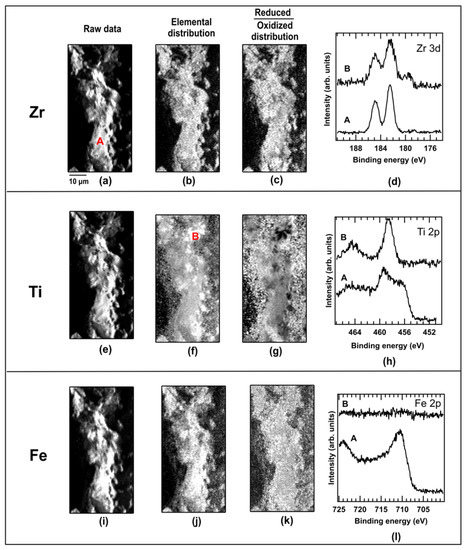
Figure 4.
Element distribution and spectra of Ti, Fe and Zr in as-cast TiFe + 4 wt.% Zr. Zr (a–d), Ti (e–h), Fe (i–l). Raw data: (a,e,i), Elemental distribution (b,f,j). Reduced/oxidized distribution (c,g,k). Spectra (d,h,l).
Point A shows the presence of all three elements. This could be associated with TiFe alloy with a small amount of Zr as was seen in a previous investigation. In the case of point B, only Zr and Ti were detected. This is a somewhat puzzling observation because a Zr-Ti phase has not been detected in previous investigations of TiFe + x wt.% Zr. However, as Ti and Zr are totally miscible, this is possible. As Fe could not enter in solid solution in Zr but Ti is miscible, it is reasonable to consider that the Zr-rich region may have more Ti than Fe, especially at the very edge of the secondary phase.
The map in panel (b) shows an uneven distribution of the Zr; the change of the signal intensity between the darker and brighter areas is about 25%. The Zr 3d spectra acquired at positions A and B, labelled in panels (a) and (f), show two different surfaces chemical compositions. The spectrum at position A appears as a single typical Zr 3d spin-orbit doublet with the Zr 3d5/2 peak centered at 182.5 eV binding energy (BE) while the spectrum at position B is the convolution of the same component at 182.5 eV BE with a less intense one with its Zr 3d5/2 peak centered at 179 eV BE. Due to the presence of well-separated convoluted components, the peaks of spectrum B are broader. The peak at lower binding energy can be associated with reduced Zr in the 0/+1 valence state while the main component corresponds to Zr in the +3/+4 valence state typical of chemically stable zirconium oxide phases [24].
The Zr 3d spectra acquired at positions A and B, labelled in panels (a) and (f), show two different surfaces chemical compositions. As the reduced and oxidized components of Zr were well separated in energy, it was possible to select the energy windows of the two chemical states and calculate the ratio of the corresponding images. The map in panel (c) shows the ratio between reduced and oxidized Zr; despite the Zr is everywhere mostly fully oxidized, brighter/darker areas indicate a lower/higher presence of a weak reduced Zr, as shown by the Zr 3d core level spectra in panel (d).
The background subtracted map of Ti 2p shown in panel (f) evidences large changes in the concentration of titanium; the intensity in the brightest areas is twice that in the darker ones. To some extent, the Ti and Zr maps (panels (f) and (b), respectively) are complementary, i.e., regions with a higher Zr content show less Ti (e.g., region B). The Ti 2p core level spectra acquired at points A and B show two chemically different environments; spectrum B has the typical line shape of the TiO2 with the Ti 2p3/2 centered at 458.6 eV in good agreement with literature references [25]. The spectrum acquired at position A has an additional shoulder at 455.8 eV binding energy compatible with a +2 valence state [26]. As done for the Zr in panel (c), the image corresponding to the ratio between reduced and oxidized Ti is shown in panel (g). The changes in the contrast suggest an uneven distribution of the ratio, with a higher local amount of Ti resulting in a higher contribution of the +4 oxidation state.
Finally, the same analysis is proposed for Fe. Panel (j) shows the distribution of this element on the surface of the probed area. As also evidenced by the two spectra acquired in points A and B, reported in panel (l), regions with and without Fe are present. Spectrum A is dominated by a peak centered at 710.8 eV binding energy corresponding to Fe2O3 [27]. The image with the ratio of the reduced and oxidized Fe is shown in panel (k) indicating a rather uniform contrast except in the regions where there is no iron.
Taking into account that the beam penetration is only of the order of 1 or 2 nm for Zr and Ti and even less for Fe the absence of Fe may be due to small migration of Fe upon oxidation of the edge of the secondary phase.
2.3. Hydrided Sample
Figure 5 shows the elemental distribution and spectrum of Ti, Fe and Zr on a fully hydrogenated sample. Before discussing these results, we should point out that the sample was kept under hydrogen until close to the measurement in order to keep its hydrided state. However, the time delay between hydrogenation and the measurement and also the fact that the measurement is performed under high vacuum under intense beam means that some phases of the sample may no longer be in a hydrided state. Therefore, caution should be exercised in the analysis of these results.
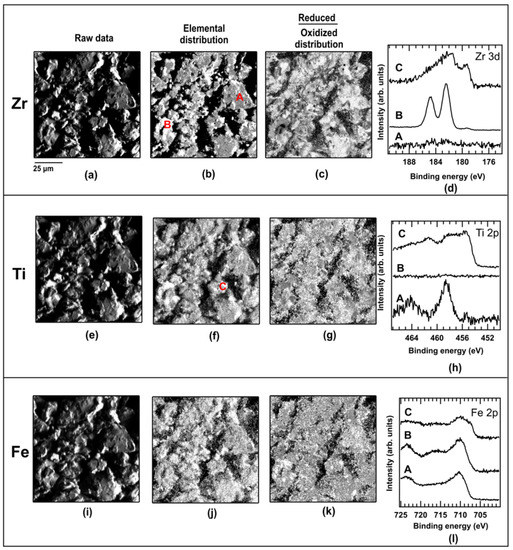
Figure 5.
Element distribution and spectra of Ti, Fe and Zr in hydrogenated TiFe + 4 wt.% Zr. Zr (a–d), Ti (e–h), Fe (i–l). Raw data: (a,e,i), Elemental distribution (b,f,j). Reduced/oxidized distribution (c,g,k). Spectra (d,h,l).
Three different points have been probed. Point A consists only of Ti and Fe atoms. This is in agreement with the main TiFe phase. The spectra of Ti and Fe do not show any shift in energy. This is consistent with the fact that this phase is most probably dehydrided. Point B only shows Zr and Fe signals. The Zr spectrum is fully oxidized but there is a small bump in the Fe spectrum at 717 eV. This may be an indication of the formation of a Zr-Fe-H phase. Raj et al. have shown that the high temperature phase Zr2Fe could form the intermetallic hydride Zr2FeHx hydride at a temperature as low as 250 K under hydrogen pressure less than 0.5 atm [28]. Oxygen-containing compounds could also be hydrided as demonstrated by Zavaliy et al. on the hydrogenation of for example Ti4-xZrxFe2Oy [29]. Regarding point C, the three elements are present, but their spectra show an oxidation state.
2.4. Dehydrided Sample
The dehydrided elemental distribution and spectra are shown in Figure 6. Point A is TiFe alloy with basically no Zr present. This is associated with the main TiFe phase. The Ti and Fe spectra are mostly oxidized. Point B is Ti-Zr phase as seen in the as-cast alloy, however there are main differences. In the as-cast alloy both Ti and Zr in this phase showed some state of oxidation but here, oxidation is apparent only in the Zr spectrum. The Ti spectrum of points A and B indicates a TiO2 phase. Finally, point C is only Zr precipitate that is also oxidized.
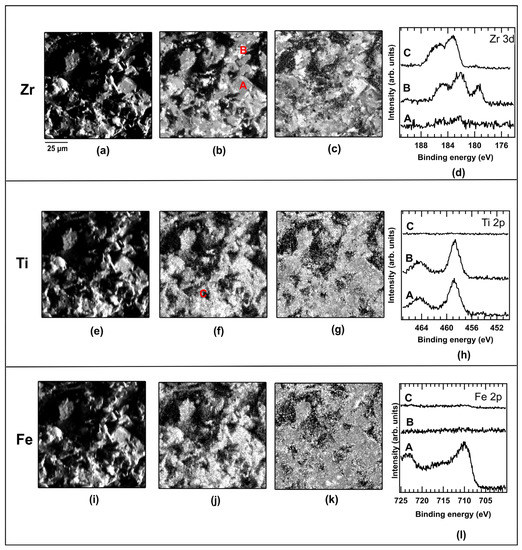
Figure 6.
Element distribution and spectra of Ti, Fe and Zr in dehydrogenated TiFe + 4 wt.% Zr. Zr (a–d), Ti (e–h), Fe (i–l). Raw data: (a,e,i), Elemental distribution (b,f,j). Reduced/oxidized distribution (c,g,k). Spectra (d,h,l).
3. Materials and Methods
The as-cast sample of composition TiFeZr0.05 (TiFe + 4 wt.% Zr) was synthesized by arc melting. Details are given in ref. [12]. After synthesis, a part of the alloy was cut and polished for the as-cast investigations. The other part was crushed in an argon-filled glove box. The crushed powder was then hydrogenated at room temperature under 20 bars of hydrogen pressure using a home-made Seivert apparatus. After hydrogenation a part of the sample was taken out of the reactor. This fully hydrided sample is thereafter identified as hydrided hydrogenated TiFe + 4 wt.% Zr. The remaining part was desorbed at room temperature under dynamic vacuum for a period of two hours. This sample is identified as dehydrided TiFe + 4 wt.% Zr.
Photoemission measurements were performed by using the scanning photoemission microscope (SPEM) hosted at the ESCA Microscopy beamline at Elettra synchrotron facility (Trieste, Italy) [30]. A SPEM uses a direct approach to obtain spatial resolution consisting in the focalization of the incoming X-ray beam with Fresnel Zone Plate (ZP) optics. The X-ray microprobe can reach a dimension of 120 nm. The optical setup is completed by an Order Sorting Aperture (OSA) positioned between the sample and the ZP selecting the first diffraction order and removing the undesired orders. Photoelectrons are collected by a SPECS PHOIBOS 100 hemispherical electron analyzer provided with a 48-channels electron detector.
The SPEM can operate in two modes: imaging and submicron-spectroscopy. In the first mode, the distribution of an atomic element or chemical state is mapped by synchronized scanning the sample with respect to the focused photon beam and collecting photoelectrons within a selected electron kinetic energy window, corresponding to the electron energy level of the element of interest. The multichannel electron detector, where each channel measures electrons with a specific kinetic energy, defined by the selected energy window, allows the simultaneous collection of 48 images. This adds a spectro-imaging option, i.e., the reconstruction of the spectrum corresponding to the covered energy window from a selected area from subdomains of the main map [31]. The second mode is the microprobe spectroscopy providing spectroscopic information from the selected spot onto the sample with a higher spectral resolution.
Contrast in the photoemission maps reflect the intensity variations of the number of photoelectrons detected at each specific position in the image and for an 8 eV binding energy window centered around the given energy. Such number depends on the number of atoms associated with the specific core level acquired in the illuminated spot, their chemical state and the surface topography. The photoemission yield increases/decreases if the probed surface is more normal/grazing to the electron analyzer axis. In order to remove the topographical contribution from the maps, an algorithm was applied consisting in dividing the map acquired at a specific core level by that collected at its higher kinetic energy background. The resulting so-called “peak/background” map will show only the chemical contribution [31]. Exceptions are the areas completely shadowed where the low count rates generate fake values.
Measurements were carried out using 650 eV photon energy and an overall spectral energy resolution of 220 meV in microspot spectroscopy and 490 meV in imaging mode. More details on the multi-channel data acquisition and processing can be found in ref. [31].
4. Conclusions
In this paper the microstructure and microchemistry of TiFe + 4 wt.% Zr was investigated in detail. The photoemission map of the as-cast alloy confirmed the higher abundance of zirconium at the edge of the zirconium-rich secondary phase. The edge is also the site of a Zr-Ti phase that was not detected using conventional SEM. The reduced/oxidized ratio was determined for all elements. It was found that, for zirconium, this ratio is higher in the zirconium-rich region while for titanium it is higher in the region with low content of titanium. In the case of iron, the reduced/oxidized ratio is constant.
The hydrided sample showed the presence of a possible Zr-Fe hydride phase. There is also a Zr-Fe-O phase that could be a hydride. In the dehydrided sample the TiFe phase was not oxidized, and in the Ti-Zr phase, oxidation is only on Zr.
The general conclusion is that in the TiFe + 4 wt.%Zr alloy there is a wide range of different oxides. As the nature of the various oxide phases change upon hydrogenation/dehydrogenation, it may indicate that these oxides play a more important role in the hydrogenation than what was previously believed.
Author Contributions
Conceptualization, S.S. and J.H.; methodology, M.A. and L.G.; validation, S.S., M.A., L.G. and J.H.; formal analysis, S.S., M.A., L.G. and J.H.; investigation, S.S., M.A., L.G. and J.H.; writing—original draft preparation, S.S. and J.H.; writing—review and editing, M.A., L.G., N.K. and E.H.J. All authors have read and agreed to the published version of the manuscript.
Funding
This research was funded in part by a Discovery grant from the Natural Sciences and Engineering Research Council of Canada (NSERC). S.S. acknowledges the financial support from the European Union’s Horizon 2020 research and innovation program, under Grant Agreement No. 951815.
Data Availability Statement
Not applicable.
Acknowledgments
We acknowledge Elettra Sincrotrone Trieste for providing access to its synchrotron radiation facilities. The authors would like to thank Patrick Zeller for help in data acquisition.
Conflicts of Interest
The authors declare no conflict of interest.
References
- Endo, N.; Suzuki, S.; Goshome, K.; Maeda, T. Operation of a bench-scale TiFe-based alloy tank under mild conditions for low-cost stationary hydrogen storage. Int. J. Hydrogen Energy 2017, 42, 5246–5251. [Google Scholar] [CrossRef]
- HyCARE focuses on large-scale, solid-state hydrogen storage. Fuel Cells Bull. 2019, 2019, 11. [CrossRef]
- Endo, N.; Shimoda, E.; Goshome, K.; Yamane, T.; Nozu, T.; Maeda, T. Operation of a stationary hydrogen energy system using TiFe-based alloy tanks under various weather conditions. Int. J. Hydrogen Energy 2020, 45, 207–215. [Google Scholar] [CrossRef]
- Endo, N.; Saita, I.; Nakamura, Y.; Saitoh, H.; Machida, A. Hydrogenation of a TiFe-based alloy at high pressures and temperatures. Int. J. Hydrogen Energy 2015, 40, 3283–3287. [Google Scholar] [CrossRef]
- Reilly, J.J.; Wiswall, R.H. Formation and Properties of Iron Titanium Hydride. Inorg. Chem. 1974, 13, 218–222. [Google Scholar] [CrossRef]
- Vega, L.E.R.; Leiva, D.R.; Lean Neto, R.M.; Silva, W.B.; Silva, R.A.; Ishikawa, T.T.; Kiminami, C.S.; Botta, W.J. Mechanical activation of TiFe for hydrogen storage by cold rolling under inert atmosphere. Int. J. Hydrogen Energy 2018, 43, 2913–2918. [Google Scholar] [CrossRef]
- Edalati, K.; Matsuda, J.; Iwaoka, H.; Toh, S.; Akiba, E.; Horita, Z. High-pressure torsion of TiFe intermetallics for activation of hydrogen storage at room temperature with heterogeneous nanostructure. Int. J. Hydrogen Energy 2013, 38, 4622–4627. [Google Scholar] [CrossRef]
- Edalati, K.; Matsuda, J.; Yanagida, A.; Akiba, E.; Horita, Z. Activation of TiFe for hydrogen storage by plastic deformation using groove rolling and high-pressure torsion: Similarities and differences. Int. J. Hydrogen Energy 2014, 39, 15589–15594. [Google Scholar] [CrossRef]
- Emami, H.; Edalati, K.; Matsuda, J.; Akiba, E.; Horita, Z. Hydrogen storage performance of TiFe after processing by ball milling. Acta Mater. 2015, 88, 190–195. [Google Scholar] [CrossRef]
- Romero, G.; Lv, P.; Huot, J. Effect of ball milling on the first hydrogenation of TiFe alloy doped with 4 wt% (Zr + 2Mn) additive. J. Mater. Sci. 2018, 53, 13751–13757. [Google Scholar] [CrossRef]
- Dematteis, E.M.; Dreistadt, D.M.; Capurso, G.; Jepsen, J.; Cuevas, F.; Latroche, M. Fundamental hydrogen storage properties of TiFe-alloy with partial substitution of Fe by Ti and Mn. J. Alloys Compd. 2021, 874, 12. [Google Scholar] [CrossRef]
- Lv, P.; Guzik, M.N.; Sartori, S.; Huot, J. Effect of ball milling and cryomilling on the microstructure and first hydrogenation properties of TiFe+4 wt.% Zr alloy. J. Mater. Res. Technol. 2019, 8, 1828–1834. [Google Scholar] [CrossRef]
- Dematteis, E.M.; Berti, N.; Cuevas, F.; Latroche, M.; Baricco, M. Substitutional effects in TiFe for hydrogen storage: A comprehensive review. Mater. Adv. 2021, 2, 2524–2560. [Google Scholar] [CrossRef]
- Zeaiter, A.; Chapelle, D.; Cuevas, F.; Maynadier, A.; Latroche, M. Milling effect on the microstructural and hydrogenation properties of TiFe0.9Mn0.1 alloy. Powder Technol. 2018, 339, 903–910. [Google Scholar] [CrossRef]
- Lv, P.; Huot, J. Hydrogenation improvement of TiFe by adding ZrMn2. Energy 2017, 138, 375–382. [Google Scholar] [CrossRef]
- Patel, A.K.; Duguay, A.; Tougas, B.; Neumann, B.; Schade, C.; Sharma, P.; Huot, J. Study of the Microstructural and First Hydrogenation Properties of TiFe Alloy with Zr, Mn and V as Additives. Processes 2021, 9, 1217. [Google Scholar] [CrossRef]
- Gosselin, C.; Huot, J. First Hydrogenation Enhancement in TiFe Alloys for Hydrogen Storage Doped with Yttrium. Metals 2019, 9, 242. [Google Scholar] [CrossRef]
- Jain, P.; Gosselin, C.; Huot, J. Effect of Zr, Ni and Zr7Ni10 alloy on hydrogen storage characteristics of TiFe alloy. Int. J. Hydrogen Energy 2015, 40, 16921–16927. [Google Scholar] [CrossRef]
- Lv, P.; Huot, J. Hydrogen storage properties of Ti0.95FeZr0.05, TiFe0.95Zr0.05 and TiFeZr0.05 alloys. Int. J. Hydrogen Energy 2016, 41, 22128–22133. [Google Scholar] [CrossRef]
- Gosselin, C.; Huot, J. Hydrogenation Properties of TiFe Doped with Zirconium. Materials 2015, 8, 7864–7872. [Google Scholar] [CrossRef]
- Patel, A.K.; Tougas, B.; Sharma, P.; Huot, J. Effect of cooling rate on the microstructure and hydrogen storage properties of TiFe with 4 wt% Zr as an additive. J. Mater. Res. Technol. 2019, 8, 5623–5630. [Google Scholar] [CrossRef]
- Gosselin, C.; Santos, D.; Huot, J. First hydrogenation enhancement in TiFe alloys for hydrogen storage. J. Phys. D Appl. Phys. 2017, 50, 375303. [Google Scholar] [CrossRef]
- Patel, A.K.; Sharma, P.; Huot, J. Effect of annealing on microstructure and hydrogenation properties of TiFe + X wt% Zr (X = 4, 8). Int. J. Hydrogen Energy 2018, 43, 6238–6243. [Google Scholar] [CrossRef]
- Azdad, Z.; Marot, L.; Moser, L.; Steiner, R.; Meyer, E. Valence band behaviour of zirconium oxide, Photoelectron and Auger spectroscopy study. Sci. Rep. 2018, 8, 16251. [Google Scholar] [CrossRef] [PubMed]
- Bharti, B.; Kumar, S.; Lee, H.N.; Kumar, R. Formation of oxygen vacancies and Ti(3+) state in TiO2 thin film and enhanced optical properties by air plasma treatment. Sci. Rep. 2016, 6, 32355. [Google Scholar] [CrossRef] [PubMed]
- Biesinger, M.C.; Lau, L.W.M.; Gerson, A.R.; Smart, R.S.C. Resolving surface chemical states in XPS analysis of first row transition metals, oxides and hydroxides: Sc, Ti, V, Cu and Zn. Appl. Surf. Sci. 2010, 257, 887–898. [Google Scholar] [CrossRef]
- Yang, H.H.; Shi, B.F.; Wang, S.L. Fe Oxides Loaded on Carbon Cloth by Hydrothermal Process as an Effective and Reusable Heterogenous Fenton Catalyst. Catalysts 2018, 8, 207. [Google Scholar] [CrossRef]
- Raj, P.; Suryanarayana, P.; Sathyamoorthy, A.; Shashikala, K.; Iyer, R.M. Zr2FeHx System Hydrided at Low-Temperatures—Structural Aspects by Mossbauer and X-ray-Diffraction Studies. J. Alloys Compd. 1992, 178, 393–401. [Google Scholar] [CrossRef]
- Zavaliy, I.Y.; Denys, R.V.; Koval’Chuck, I.V.; Riabov, A.B.; Delaplane, R.G. Hydrogenation of Ti4−xZrxFe2Oy alloys and crystal structure analysis of their deuterides. Chem. Met. Alloy. 2009, 2, 59–67. [Google Scholar] [CrossRef]
- Abyaneh, M.K.; Gregoratti, L.; Amati, M.; Dalmiglio, M.; Kiskinova, M. Scanning Photoelectron Microscopy: A Powerful Technique for Probing Micro and Nano-Structures. e-J. Surf. Sci. Nanotec. 2011, 9, 158–162. [Google Scholar] [CrossRef]
- Gregoratti, L.; Barinov, A.; Benfatto, E.; Cautero, G.; Fava, C.; Lacovig, P.; Lonza, D.; Kiskinova, M.; Tommasini, R.; Mahl, S.; et al. 48-Channel electron detector for photoemission spectroscopy and microscopy. Rev. Sci. Instrum. 2004, 75, 64–68. [Google Scholar] [CrossRef]
Disclaimer/Publisher’s Note: The statements, opinions and data contained in all publications are solely those of the individual author(s) and contributor(s) and not of MDPI and/or the editor(s). MDPI and/or the editor(s) disclaim responsibility for any injury to people or property resulting from any ideas, methods, instructions or products referred to in the content. |
© 2023 by the authors. Licensee MDPI, Basel, Switzerland. This article is an open access article distributed under the terms and conditions of the Creative Commons Attribution (CC BY) license (https://creativecommons.org/licenses/by/4.0/).