Abstract
In this paper, a single humidity sensor for water vapor and heavy oxygen water vapor detection is presented. The sensor is based on tunable diode laser absorption spectroscopy (TDLAS) and thus has high sensitivity, good selectivity, and a short response time. A 1372 nm distributed feedback (DFB) diode laser is utilized as the light source, the wavelength tuning range of which covers the absorption lines of water vapor and heavy oxygen water vapor. A Herriott gas cell with 12 m optical length is designed for signal-to-noise ratio (SNR) enhancement. The sensor can distinguish between water vapor and heavy oxygen water vapor effectively. The accuracy of water detection is within ±0.5% RH. The accuracy of heavy oxygen water vapor detection is within ±1.0% RH.
1. Introduction
Heavy oxygen water is an isotope of water, which is widely used in diverse fields such as disease diagnoses, organ function research, and new drug developments [1,2,3]. Conventional humidity sensors such as wet and dry bulb hygrometers, humidity-sensitive capacitors, and chilled mirror dew point meters are used to detect heavy oxygen water vapor [4,5]. However, these methods are unable to distinguish between water vapor and heavy oxygen water vapor due to their similar physical and chemical characteristics. They can only provide the total concentration of water vapor and heavy oxygen water vapor rather than their respective concentrations. Heavy oxygen water vapor is always coexistent with water vapor in practice. Hence, a single humidity sensor with good selectivity is an attractive alternative to conventional humidity sensors.
Optical gas sensing is drawing increasing attention with regards to application in gas detection. Gas sensors based on non-dispersive infrared (NDIR), photoacoustic spectroscopy (PAS), cavity ring-down spectroscopy (CRDS), and tunable diode laser absorption spectroscopy (TDLAS) are well-established [6]. Furthermore, some novel high-sensitivity and miniaturized spectroscopic gas sensors have been developed. Kassa-Baghdouche et al. proposed slotted photonic crystal waveguides as refractive index sensing devices, which obtained a sensitivity of more than 1150 per refractive index unit (RIU) with an insertion loss level of −0.3 dB [7]. In Reference [8], an optimized photonic crystal microcavity for a spectroscopic gas sensor was realized. The device has a Q of 104 and a detection limit as low as 10−4 RIU. NDIR sensors are composed of a broadband light source, light path, optical filters, and detectors. They have high sensitivity, low cost, and ease of implementation [9]. The selectivity of NDIR sensors is not adequate to distinguish between water vapor and heavy oxygen water vapor because of the broadband light source and the limited filter width. The wavelength spacing of the water vapor absorption line and the heavy oxygen water vapor absorption line is within 1 nm, which is an order smaller than the filter width. In PAS, periodic optical absorption will excite the periodic acoustic pressure propagating in the sample due to the photoacoustic effect. The propagating pressure results in a sound wave, which can be detected with an acoustic transducer. PAS is an indirect absorption spectroscopy technology with immunity to the background, thus leading to high sensitivity. PAS sensors suffer from the vibrations of the surrounding environment [10]. The cavity of a CRDS sensor has two reflectors with ultra-high reflectivity (~99.999%) to achieve an optical length of tens or even hundreds of kilometers. The minimum detection limit of CRDS sensors can reach the ppb or even ppt levels. Given their high cost and susceptibility to shaking, CRDS sensors are not under consideration in this paper [11]. A TDLAS sensor is equipped with a diode laser in which the linewidth is two orders of magnitude lower than the absorption lines. The narrowband light source, as well as the fingerprint characteristics of infrared absorption spectroscopy contribute to the outstanding selectivity of TDLAS [12,13,14]. Consequently, TDLAS has a natural advantage in the detection of isotopes. In References [15,16], Kireev et al. achieved high 13CO2 measuring accuracy and the simultaneous boundary 13CO2/12CO2 ratio was consistent in the expiratory air. Ghorbani R proposed a TDLAS sensor with an ICL light source. The sensor was applied to real-time detection of 12CO and 13CO in the air and exhaled breath [17].
In this paper, we propose a humidity sensor based on TDLAS. The motivation for this work is to improve the sensing dynamic range so that it can meet the requirements of both water vapor detection and heavy oxygen water vapor detection. The absorption amplitude of heavy oxygen water vapor is two orders lower than that of water vapor in the near-infrared region. As a result, a large dynamic of 40 dB is necessary. We adopt direct absorption spectroscopy (DAS) for water vapor detection and wavelength modulation spectroscopy (WMS) for heavy oxygen water vapor detection, which extends the dynamic range to 40 dB [15,18]. In addition, a Herriott gas cell is designed for the signal-to-noise ratio (SNR) enhancement.
2. Experimental Setup and Theoretical Analysis
The experimental setup for the proposed humidity sensor is depicted in Figure 1a. A distributed feedback (DFB) diode laser (Sichuan light source optoelectronic, model: LT-LD-1372-20-1.5-FA) is employed as the light source, in which the wavelength covers the absorption lines of both water vapor and heavy oxygen water vapor. The diode laser is controlled by a temperature controller and a current controller. The temperature controller is designed on the basis of a MAX1978 for the Peltier thermoelectric cooler (TEC) module in the diode laser. The current controller consists of a DC current source, a triangle signal generator, and a sinusoidal signal generator. The diode laser has a tail fiber, of which the output light is coupled to a collimator (OPEAK, model: FC37). The collimated light acts as an incident light for the Herriott gas cell. The transmitted light through the gas cell is detected by a photodetector (Lightsensing, model: LSIPD-1S), which transforms the light signal into a current signal. A trans-impedance amplifier (TIA) with low noise changes the current signal to a voltage signal. The TIA contains multiple channels for feedback resistor selection according to the amplifier gain setting. The voltage signal is amplified and then acquired by a 12-bit analog-to-digital conversion (ADC) (Analog Devices, model: AD7366). A lock-in amplifier is used to improve the SNR of the system. The function of the microcontroller unit (MCU) is to process signals, to set parameters, and to communicate with a computer via RS232. The temperature controller, the current controller, the TIA, the ADC, the lock-in amplifier, and the MCU are integrated into the homemade circuit, as shown in Figure 1b.
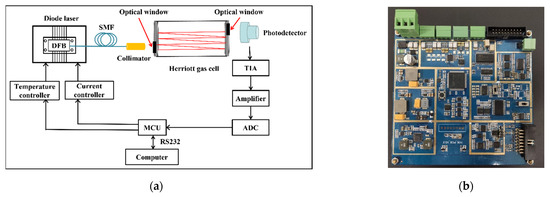
Figure 1.
Experimental setup for the proposed humidity sensor. (a) Schematic diagram of the experimental setup; (b) picture of the homemade circuit.
2.1. Light Source Property
The central wavelength of the DFB diode laser depends on its temperature and driving current. A proportional-integral-derivative (PID) is carried out on the temperature controller. The current controller generates a triangle signal and a sinusoidal signal as the modulation signal, for which the frequency and amplitude vary with parameters set by the MCU. As is shown in Figure 2, for wavelength tuning, the diode laser has a temperature tuning coefficient of 0.080 nm/°C and a current tuning coefficient of 0.015 nm/mA. Therefore, we process with temperature tuning for coarse tuning and current tuning for fine tuning.
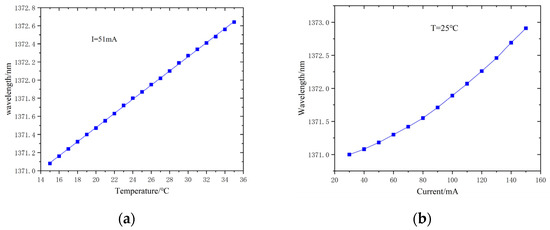
Figure 2.
Wavelength tuning property of the diode laser: (a) wavelength varies with temperature; (b) wavelength varies with driving current.
The light wavelength should be fixed at the strong absorption line of the target gas without interference. Absorption lines at 1372.10 nm for water vapor detection and 1372.53 nm for heavy oxygen water vapor detection are chosen according to the HITRAN database [19]. The property of the selected absorption lines is described in Figure 3. Temperature is set according to the specified wavelength of the target absorption line. Water vapor detection is set by tuning the laser temperature to . Heavy oxygen water vapor detection is set by tuning the laser temperature to The central wavelength of the diode laser scans across the target absorption line so that it is within the measured range. The maximum light power is 20 mW.
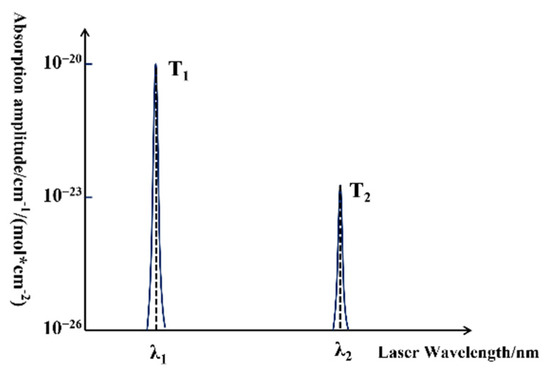
Figure 3.
Target absorption lines of water vapor and heavy oxygen water vapor.
2.2. Optical Length Enhancement
Light with a specified wavelength can be absorbed when passing through the gas to be measured, which is a uniform medium. Light with 1372.10 nm can be absorbed by water vapor. Light with 1372.53 nm can be absorbed by heavy oxygen water vapor. The Beer–Lambert law expresses the relationship between the transmitted intensity and the incident intensity , as follows [20,21]:
where , , and are the absorption coefficient, the gas concentration, and the optical length, respectively. In the sensing system, , therefore , is given by the following:
The absorbed intensity is represented by the following:
The absorbed intensity is proportional to the concentration of target gas when the absorption line is fixed. For this reason, the minimum detection limit of the sensor increases as the optical length enhances. Two concave mirrors (Thorlabs, model: CM508-200EH4-M02) are utilized for the Herriott cell. The structural parameters of the gas cell are determined by optimizing the optical path model, which is sketched in Figure 4a. A Gaussian light source serves as the incident light in the model, in which the diameter is set to 3 mm. The optical length reaches the maximum when the distance between two mirrors is set to 223 mm. The number of reflections in each mirror is 28.
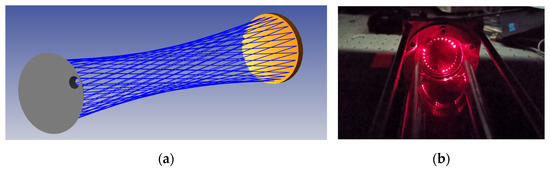
Figure 4.
The designed Herriott gas cell. (a) The optical path model; (b) light spots in the mirror.
The output light of the diode laser is collimated and then coupled to the designed Herriott cell. The light is reflected by the two mirrors tens of times, for optical length enhancement. Red laser light is inputted into the gas cell as an indicating light. The length of the gas cell is 220 mm and the optical length, obtained by multiple reflections, is 12 m. An image of light spots in one mirror is shown in Figure 4b.
2.3. Direct Detection and Harmonic Detection
A 1372 nm DFB diode laser is commercially available, which offers the light source for the proposed humidity sensor. A DFB diode laser has a narrow linewidth and high optical power density. Nevertheless, the output intensity of the diode laser, which is the incident intensity of the Herriott cell, drifts due to variations in environmental temperature, driving current, and mechanical fluctuations [22]. Figure 5a shows the light power of the diode laser varying with the driving current, where the linear fitting is carried out as illustrated by the red solid line and the coefficient of determination is . In DAS-TDLAS mode, the incident intensity is acquired by linear fitting of the transmitted intensity when the light is absorbed by the target gas. Therefore, the influence of the incident intensity fluctuation is effectively eliminated due to the good linearity of the laser power. In Figure 5b, the blue solid line shows the transmitted intensity. The red dotted line depicts the linear fitting of the blue line. The absorption intensity is obtained when the fitting line subtracts the absorption intensity, as is illustrated in Figure 5c.
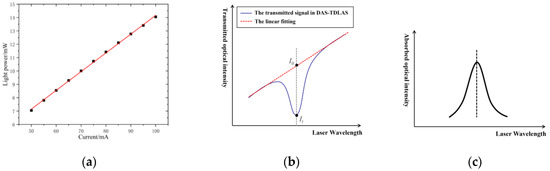
Figure 5.
DAS-TDLAS detection: (a) the light power of the diode laser varies with driving current; (b) the transmitted optical intensity varies with laser wavelength and its linear fitting; (c) the absorbed optical intensity varies with laser wavelength.
As for the equivalent concentration, heavy oxygen water vapor absorption is two orders weaker than water vapor absorption. DAS is incapable of detecting absorptions as weak as the system noise. A sinusoidal modulation is added for harmonic detection to extract the weak signal induced by the absorption of heavy oxygen water vapor. A homemade lock-in amplifier is used for harmonic detection, which enhances the SNR effectively. In WMS-TDLAS, the laser wavelength modulated by a sinusoidal signal is expressed as follows:
where is the center wavelength of the diode laser, is the wavelength modulation depth, and is the modulation frequency.
The absorption line can be approximated as a Voigt profile at room temperature and atmospheric pressure. The profile is represented by the following:
where , , , , and are the half width at half maximum (HWHM) of the Doppler and Lorentz profiles, respectively [23].
According to Fourier analysis, the second harmonic signal of the transmitted light can be given by the following:
where and are constants.
The first harmonic signal of the transmitted light can be given by the following:
where is a constant. It is indicated that the ratio of the second harmonic signal and the first harmonic signal is proportional to the gas concentration, which is free from the influence of the light output intensity [24]. The ratio is given by the following:
3. Experiments and Results
3.1. Water Vapor Detection
The humidity sensor operates in DAS-TDLAS mode for water vapor detection. The central wavelength of the diode laser scans across the water vapor absorption line by scanning the driving current with a triangle signal. The voltage signal varying with the driving current is logged, shown in Figure 6. A commercial humidity sensor (Rotronic, HP32) is utilized to acquire relative humidity of detected gas, in which the precision is ±0.5% RH. The measured relative humidity of the water vapor samples is 1.95% RH, 2.60% RH, 3.25% RH, 3.90% RH, 4.55% RH, 5.20% RH, 5.85% RH, 6.50% RH, 18.26% RH, 58% RH, 76% RH, and 88% RH, respectively. Curves with different colors present the results of the different relative humidity mentioned above. It is noted that the signal profiles are consistent with each other and that the absorption is more obvious when a higher relative humidity sample is detected.
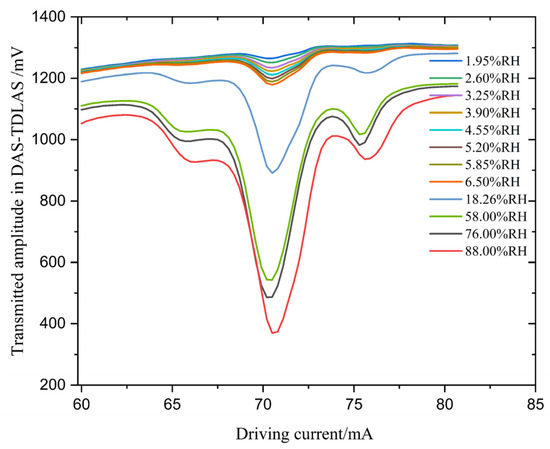
Figure 6.
Transmitted amplitude in the DAS-TDLAS mode.
Figure 7 presents the maximum absorption signal as a function of the relative humidity, which is proportional to the water vapor concentration. Linear fitting of the curves is performed. The residual sum of squares is 19.59, and the coefficient of determination is . The sensitivity for water vapor detection is 9.64 mV/%RH. It is concluded that the proposed sensor has good linearity and that the measuring accuracy is within ±0.5% RH for water vapor measurement.
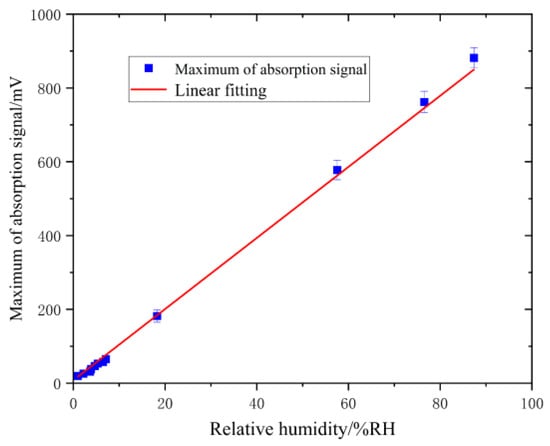
Figure 7.
Relative humidity measured in DAS-TDLAS.
3.2. Heavy Oxygen Water Vapor Detection
The performance of the proposed humidity sensor for heavy oxygen water vapor detection is evaluated in the WMS-TDLAS mode. The driving current scans so that the central wavelength scans across the absorption line. A triangle signal and a sinusoidal signal modulate the driving current simultaneously. The frequency of the triangle signal is 100 Hz, and the frequency of the sinusoidal signal is 10 kHz. The modulation depth is optimized. The second harmonic signals measured at different relative humidity are shown in Figure 8. The same humidity sensor (Rotronic, HP32) used for water vapor detection is used to acquire relative humidity. The measured relative humidity of the heavy oxygen water vapor samples is 3.4% RH, 6.8% RH, 10.2% RH, 13.6% RH, and 17% RH, respectively. The profiles are consistent with each other and reach their maximums at the center of the absorption lines.
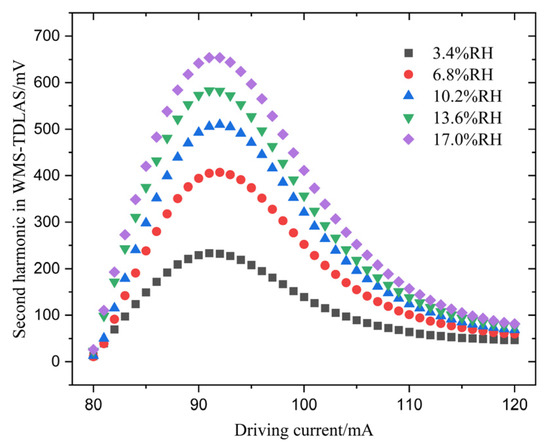
Figure 8.
Second harmonic detection in the WMS-TDLAS mode.
The concentration of heavy oxygen water vapor is proportional to the second harmonic of the transmitted intensity in the WMS-TDLAS mode. The relative humidity is a function of the maximum of the second harmonic. Figure 9 represents the linear fitting. The residual sum of squares is 11.03, and the coefficient of determination is . The sensitivity for heavy oxygen water vapor detection is 30.91 mV/%RH. The proposed sensor has good linearity, and the measuring accuracy is within ±1.0% RH for heavy oxygen water vapor detection.
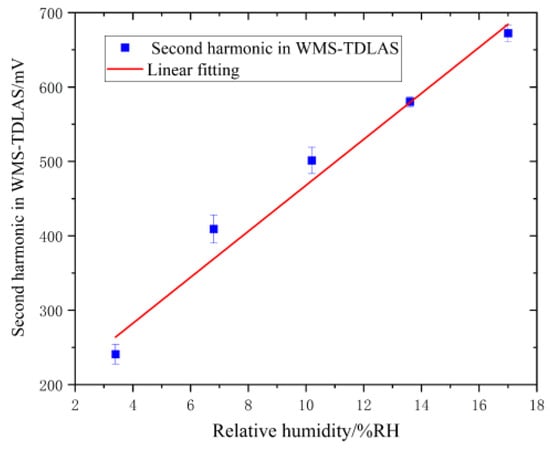
Figure 9.
Relative humidity measured in WMS-TDLAS.
4. Conclusions
A single humidity sensor for water vapor detection and heavy oxygen water vapor detection is described in this paper. The sensor is based on TDLAS, which is an attractive alternative for the distinguishment of isotopes. A single 1372 nm DFB diode laser is utilized as the light source, for which the wavelength tuning range covers the absorption lines of both water vapor and heavy oxygen water vapor. A Herriott gas cell with 12 m optical length is designed for SNR enhancement, which increases the optical length by ~60 times. Water vapor is detected in the DAS-TDLAS mode, and the accuracy of water vapor detection is within ±0.5% RH. Heavy oxygen water vapor is detected in the WMS-TDLAS mode, and the accuracy of heavy oxygen water vapor detection is within ±1.0% RH.
Author Contributions
Conceptualization, L.X.; methodology, P.G.; validation, P.G., J.Z., Z.E. and Y.J.; formal analysis, J.Z.; investigation, P.G.; data curation, J.Z.; writing—original draft preparation, P.G.; writing—review and editing, P.G.; project administration, L.X.; All authors have read and agreed to the published version of the manuscript.
Funding
This research was funded by the National Natural Science Foundation of China, grant number U1930205.
Institutional Review Board Statement
Not applicable.
Informed Consent Statement
Not applicable.
Conflicts of Interest
The authors declare no conflict of interest.
References
- Magomedbekov, E.P.; Selivanenko, I.L.; Kulov, N.N.; Veretennikova, G.V. Conditioning Heavy-Oxygen Water by Rectification under Vacuum. Theor. Found. Chem. Eng. 2019, 53, 719–724. [Google Scholar] [CrossRef]
- Kutus, B.; Shalit, A.; Hamm, P.; Hunger, J. Dielectric response of light, heavy and heavy-oxygen water: Isotope effects on the hydrogen-bonding network’s collective relaxation dynamics. Phys. Chem. Chem. Phys. 2021, 23, 5467–5473. [Google Scholar] [CrossRef] [PubMed]
- Nagano, Y.; Miyazaki, Y.; Matsuo, T.; Suga, H. Heat capacities and enthalpy of fusion of heavy oxygen water. J. Phys. Chem. 1993, 97, 6897–6901. [Google Scholar] [CrossRef]
- Whipple, F. The wet-and-dry-bulb hygrometer: The relation to theory of the experimental researches of Awbery and Griffiths. Proc. Phys. Soc. 1933, 45, 307–319. [Google Scholar] [CrossRef]
- Khelifa, N. Effect of Measurement of Dew Point Temperature in Moist Air on the Absorption Line at 1392.53 nm of Water Vapor. Int. J. Opt. 2019, 2019, 3424172. [Google Scholar] [CrossRef]
- Hodgkinson, J.; Tatam, R.P. Optical gas sensing: A review. Meas. Sci. Technol. 2013, 24, 012004. [Google Scholar] [CrossRef]
- Kassa-Baghdouche, L.; Cassan, E. Mid-infrared refractive index sensing using optimized slotted photonic crystal waveguides. Photonics Nanostruct.-Fundam. Appl. 2018, 28, 32–36. [Google Scholar] [CrossRef]
- Kassa-Baghdouche, L. High-sensitivity spectroscopic gas sensor using optimized H1 photonic crystal microcavities. J. Opt. Soc. Am. B 2020, 37, A227–A284. [Google Scholar] [CrossRef]
- Jha, R.K. Non-Dispersive infrared gas sensing technology: A review. IEEE Sens. J. 2022, 22, 6–15. [Google Scholar] [CrossRef]
- Sgobba, F.; Sampaolo, A.; Patimisco, P.; Giglio, M.; Menduni, G.; Ranieri, A.C.; Hoelzl, C.; Rossmadl, H.; Brehm, C.; Mackowiak, V.; et al. Compact and portable quartz-enhanced photoacoustic spectroscopy sensor for carbon monoxide environmental monitoring in urban areas. Photoacoustics 2022, 25, 100318. [Google Scholar] [CrossRef]
- Song, Z.; Xu, L.; Xie, H.; Cao, Z. Random vibration-driven continuous-wave CRDS system for calibration-free gas concentration measurement. Opt. Lett. 2020, 45, 746–749. [Google Scholar] [CrossRef] [PubMed]
- Zhao, W.S.; Xu, L.J.; Huang, A. A WMS Based TDLAS Tomographic System for Distribution Retrievals of both Gas Concentration and Temperature in Dynamic Flames. IEEE Sens. J. 2020, 20, 4179–4188. [Google Scholar] [CrossRef]
- Liang, W.; Wei, G.; He, A.; Shen, H. A novel wavelength modulation spectroscopy in TDLAS. Infrared Phys. Technol. 2021, 114, 103661. [Google Scholar] [CrossRef]
- Xie, Y.; Chang, J.; Chen, X.; Sun, J.; Zhang, Q.; Wang, F.; Zhang, Z.; Feng, Y. A DFB-LD Internal Temperature Fluctuation Analysis in a TDLAS System for Gas Detection. IEEE Photonics J. 2019, 11, 1–8. [Google Scholar] [CrossRef]
- Kireev, S.V.; Kondrashov, A.A.; Shnyrev, S.L. Application of the Wiener filtering algorithm for processing the signal obtained by the TDLAS method using the synchronous detection technique for the measurement problem of 13CO2 concentration in exhaled air. Laser Phys. Lett. 2019, 16, 085701. [Google Scholar] [CrossRef]
- Kireev, S.V.; Kondrashov, A.A.; Shnyrev, S.L. Improving the accuracy and sensitivity of 13C online detection in expiratory air using the TDLAS method in the spectral range of 4860–4880 cm−1. Laser Phys. Lett. 2018, 15, 105701. [Google Scholar] [CrossRef]
- Ghorbani, R.; Schmidt, F.M. ICL-based TDLAS sensor for real-time breath gas analysis of carbon monoxide isotopes. Opt. Express 2017, 11, 12743–12752. [Google Scholar] [CrossRef]
- Li, J.; Peng, Z.; Ding, Y. Wavelength modulation-direct absorption spectroscopy combined with improved experimental strategy for measuring spectroscopic parameters of H2O transitions near 1.39 μm. Opt. Lasers Eng. 2020, 126, 105875. [Google Scholar] [CrossRef]
- The Hitran Molecular Spectroscopic Database. Available online: https://www.spectralcalc.com (accessed on 10 July 2021).
- Swinehart, S.F. The Beer-Lambert law. J. Chem. Educ. 1962, 39, 333. [Google Scholar] [CrossRef]
- Žitnik, M.; Krušič, Š.; Bučar, K.; Mihelič, A. Beer-Lambert law in the time domain. Phys. Rev. A 2018, 97, 063424. [Google Scholar] [CrossRef]
- Xia, H.; Kan, R.; Xu, Z.; He, Y.; Liu, J.; Chen, B.; Yang, C.; Yao, L.; Wei, M.; Zhang, G. Two-step tomographic reconstructions of temperature and species concentration in a flame based on laser absorption measurements with a rotation platform. Opt. Lasers Eng. 2017, 90, 10–18. [Google Scholar] [CrossRef]
- De Labachelerie, M.; Nakagawa, K.; Awaji, Y.; Ohtsu, M. High frequency-stability laser at 1.5 μm using Doppler-free molecular lines. Opt. Lett. 1995, 20, 572–574. [Google Scholar] [CrossRef] [PubMed]
- Sun, K.; Xie, L.; Ju, Y.; Wu, X.; Hou, J.; Han, W.; Wang, X.; Man, J.; Liu, Y.; Yuan, H.; et al. Compact fiber-optic diode-laser sensor system for wide-dynamic-rang relative humidity measurement. Chin. Sci. Bull. 2011, 56, 3486–3492. [Google Scholar] [CrossRef][Green Version]


Publisher’s Note: MDPI stays neutral with regard to jurisdictional claims in published maps and institutional affiliations. |
© 2022 by the authors. Licensee MDPI, Basel, Switzerland. This article is an open access article distributed under the terms and conditions of the Creative Commons Attribution (CC BY) license (https://creativecommons.org/licenses/by/4.0/).