Abstract
The Fourier transform is a popular method for analyzing and processing interference data in which spectrum leakage occurs. Generally, window function (also called apodization function) weighting is employed to limit spectrum leakage. A rectangular window with optimal main-lobe performance and the Rife-Vincent (R-V) window were introduced to improve the window function performance, resulting in the establishment of a quasi-trapezoidal window function. Based on the experimental interference data, the quasi-trapezoidal window function was used in the spectral restoration process. The experimental results show that when the apodization degree of the quasi-trapezoidal window was 1.06, the spectral resolution was improved by 17.46% compared with that of the Hanning window; when the apodization degree was 2.71, the spectral signal-to-noise ratio (SNR) was improved by 130.09% compared with that of the Blackman-Harris window function. In the propane (C3H8) and ethylene (C2H4) gas concentration inversion experiment, when the apodization degree was increased from 1.06 to 2.58, the inversion precision was increased by 6.94% for C3H8 gas and 23.93% for C2H4 gas. Through the parameter adjustment, the quasi-trapezoidal window may achieve a high SNR or high-resolution spectral restoration, which can improve the accuracy of gas concentration inversion to some extent.
1. Introduction
Fourier transform infrared spectroscopy has been widely employed in the petroleum industry, biomedicine, aerospace, environmental science, and many other research fields in recent years [1,2]. The processing of interference data is the core of spectral restoration technology in Fourier infrared multicomponent gas analyzers, which affect the accuracy of gas concentration inversion [3,4]. Since the actual interferometer can only provide a limited optical path difference, the direct application of the Fourier transform will result in spectrum leakage during the process of spectrum restoration. Consequently, the interference signal must be processed using a suitable apodization function [5,6].
Several researchers have undertaken in-depth and extended studies on processing interference signals with the window function in recent years. Norton et al. [7] came up with a suitable window function for the Fourier spectrum and went into detail about three specific functions. Based on this work, Naylor et al. [8] proposed a way to figure out the optimal coefficient of a cosine-combined window function for getting the best spectral resolution when the sidelobe performance is known. The window function determined by the Naylor method is easy to implement and calculate, and it can be used to study the tradeoff between spectral SNR and resolution. Justo J.F. et al. [9] proposed the Generalized Adaptive Polynomial (GAP) window function, which allows fitting the expansion coefficients to optimize a certain desirable property in time or frequency domains, such as the main lobe’s width, and sidelobe attenuation. Chen Jiejing et al. [10] analyzed the optimal inversion outcomes of interferograms with varying SNRs processed by apodization functions with varied linewidths using the Monte Carlo method. He Qian et al. [11] obtained an optimized spectral resolution by adopting a high-order self-convolution window based on the fact that spectral power is concentrated in the main lobe. Currently, there are two main ways to construct new window functions: one is to construct window functions with different frequency-domain performances by adjusting the coefficients or parameters of classical window functions, such as a cosine-combined window with different terms or coefficients [12], a Kaiser window [13], etc.; the other is to construct the convolution window by convoluting the classical window function in the time domain [14], which improves the performance of the frequency-domain sidelobe. However, the adjustment of classical window coefficients or parameters can only improve the main-lobe or sidelobe performance of the window function to a certain extent [15]. Although the time-domain convolution operation can greatly improve the sidelobe performance, it will widen the main lobe of the window function and reduce its flexibility.
Therefore, a quasi-trapezoidal window function with convenient parameter adjustments was proposed [16,17] by comprehensively considering the classical window function coefficients’ adjustment and the time-domain convolution window function. Based on the analysis of various classical window functions [18,19], the R-V window was chosen as the parent window, and the self-convolution R-V window function with dramatically improved sidelobe performance was constructed using time-domain self-convolution. Then, a rectangular window with the best main-lobe performance was introduced to improve the main-lobe characteristics of the self-convolution R-V window, resulting in the establishment of a quasi-trapezoidal window function with adjustable parameters, and its time-frequency characteristics were investigated. On this basis, the quasi-trapezoidal window function was applied to the process of spectral restoration and gas concentration inversion. The spectral restoration effect [20,21] and gas concentration inversion accuracy under different apodization degrees were studied by adjusting the parameters of the quasi-trapezoidal window function.
2. Principle
The basic formula of the Fourier transform spectrometer principle is:
where I(x) is the spectrometer’s actual interference signal; R and T are the reflection coefficients and transmission of the beam splitter, respectively; B0(ν) is the infrared radiation spectrum; B(ν) is the restored spectrum; ν is the spectral wavenumber; and x is the optical path difference.
Equations (1) and (2) show that after detecting the interference data, the Fourier transform must be performed to obtain the final spectral data. The integral interval of the Fourier transform must be infinite in theory to obtain the complete spectrum. However, the integral interval is restricted in the actual instrument due to the interferometer’s scanning distance constraint. The actual interference signal is obtained by multiplying the ideal interference signal by a rectangular truncation function D(x), and it is expressed in the frequency domain as the convolution of the actual spectrum and sinc function:
If M is the maximum scanning optical path difference of the interferometer, there are:
Its Fourier transform spectrum is in the form of a sinc function:
The sinc function is an oscillatory convergence function, with the first sidelobe reaching 22% of the main peak’s intensity. The strong positive and negative sidelobes not only mask the true weak spectral information nearby but also introduce spurious spectral signals, as shown in Figure 1. Therefore, these sidelobes must be suppressed, a process known as apodization. Apodization processing is the process of multiplying the actual measured interference signal by a window function to reduce the sidelobe and alleviate the discontinuities in the interference signal.
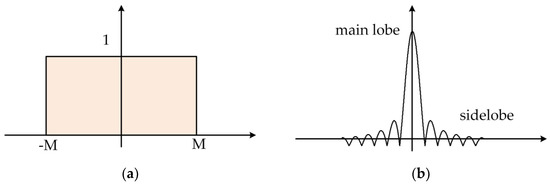
Figure 1.
(a) Time-domain diagram of a rectangular window function; (b) spectrum diagram of a rectangular window function.
The spectral performance will be affected by the window function. One reason is that the main-lobe width of the window function will affect the spectral resolution; the full width at half maximum (FWHM) criterion of the spectral resolution states that the broader the main lobe is, the lower that the recovered spectral resolution is. The other reason is that the spectral SNR will be affected by the sidelobe performance of the window function, where the positive sidelobe may produce a false peak signal, while the negative sidelobe will weaken or submerge the adjacent weak signal, resulting in the decline of the spectral SNR. In addition, the faster that the sidelobe attenuation speed is, the smaller the sidelobe value is, and the higher the SNR of the restored spectrum is. Therefore, the selection of an appropriate window function is of great significance to spectral restoration.
In this study, a new window function is proposed and established that allows a very flexible trade-off between the width of the main lobe and the height of the sidelobe and is suitable for different spectral restoration occasions. First, the R-V window function was chosen as the parent function by analyzing the classical window function, and the parent function was convoluted in the time domain to construct a self-convolution window function with significantly improved sidelobe performance. Second, the adjustable parameter and rectangular window function were introduced to improve the self-convolution R-V window function and establish the quasi-trapezoidal window function.
3. Methods
3.1. Parent Window Function
To reduce the effect of spectral leakage on spectral SNR, a window function with a small peak level and a large attenuation rate of the sidelobe should be chosen to process the interference signal. The R-V window function is a cosine combination window with a small peak sidelobe level and excellent sidelobe attenuation performance. It is written in the time domain as:
where M is the number of terms in the window function; n = 1, 2, …, N − 1; and bm should satisfy the constraints: . Table 1 gives the five-term R-V window function coefficients, and Table 2 gives the sidelobe properties of the five-term R-V window function and other commonly used window functions.

Table 1.
The five-term R-V window function coefficients.
Table 2.
The sidelobe properties of window functions.
In practical calculations, the time-domain truncation is equivalent to adding a rectangular window function, which belongs to the zero-order power window function of the time variable. A rectangular window function has concentrated main-lobe energy, small main-lobe width, and high peak sidelobe level, which cannot well suppress the effects caused by spectral leakage. The triangle window function, which is a simple modification of rectangular window functions, is the first-order power window function. Its main lobe was twice as wide as the rectangular window function, but the peak sidelobe level was much lower. The Hanning window function, an ascending cosine window, is equivalent to the spectral algebraic sum of three rectangular window functions. Its main-lobe width was equivalent to that of the triangular window function, while the peak sidelobe level was more significantly reduced and could better suppress the effects of spectral leakage. The peak sidelobe level of the Hamming window function was lower when compared with that of the Hanning window function, but the sidelobe attenuation rate was slower. The Blackman window function had a low peak sidelobe level of −57 dB and a sidelobe attenuation rate that was similar to that of the Hanning window function. The Blackman-Harris window function was a cosine combination window with a wider main lobe and a peak sidelobe level of −92 dB, and its sidelobe attenuation rate was similar to that of the Hamming window. The peak sidelobe level of the five-item R-V window function was a little higher than that of the Blackman-Harris window function, and the rate of sidelobe attenuation was fast. Since spectral reconstruction requires a high SNR, using a five-item R-V window function to process interference signals can give better results.
3.2. Self-Convolution Window Function
The p-order self-convolution R-V window function has the following time-domain expression:
where p is the number of basic windows involved in the convolution, called the order of the function.
The sidelobe performance of the self-convolution R-V window function improved as the order of convolution (p) increased. The peak sidelobe level and sidelobe attenuation rate were proportional to the order of convolution (p).
3.3. Quasi-Trapezoidal Window Function
Based on the time-domain expression of the p-order self-convolution R-V window function, the adjustable parameter rT and a rectangular window function were introduced to improve the self-convolution R-V window function to establish the quasi-trapezoidal window function. The expression of the quasi-trapezoidal window function in the time domain is:
where , N is the window function length, and rT is the scaling factor. To guarantee the basic quasi-trapezoidal shape, .
When N = 256, p = 1, and rT = 0.08, the quasi-trapezoidal window function and its amplitude-frequency response are shown in Figure 2.
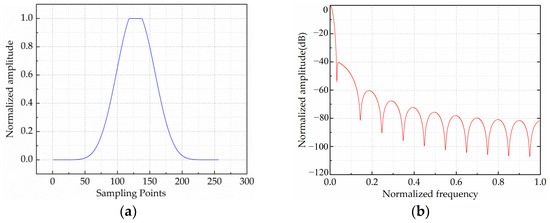
Figure 2.
(a) The quasi-trapezoidal window function time-domain waveform; (b) the quasi-trapezoidal window function amplitude-frequency response.
3.4. Parameter Analysis
When the time-domain length N was held constant, the frequency-domain properties of the quasi-trapezoidal window function were influenced not only by the scaling factor rT but also by the convolution order p. Assuming N = 256, the relationship between the frequency characteristics of the quasi-trapezoidal window function and parameters (rT, p) was studied.
3.4.1. The Effect of the Scaling Factor (rT)
Table 3 shows the peak sidelobe level and the main-lobe width of the quasi-trapezoidal window function when p = 1 was held constant and the scaling factor rT changed.
Table 3.
The effect of rT on the frequency characteristics.
As demonstrated in Figure 3a, the normalized main-lobe width of the quasi-trapezoidal window function is positively correlated with rT. The main-lobe performance improved dramatically as rT increased. While main-lobe performance improved, there was a certain decrease in the sidelobe performance. The peak sidelobe level of the quasi-trapezoidal window function is negatively correlated with rT, as shown in Figure 3b. As rT increased, there was a decreasing trend in the sidelobe performance.
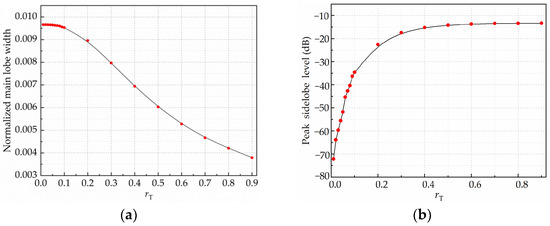
Figure 3.
(a) Relationship between normalized main-lobe width and rT; (b) relationship between peak sidelobe level and rT.
As shown in Table 3 and Figure 3, when N = 256, p = 1, and rT ∈ (0, 0.03), it was found that the quasi-trapezoidal window function achieved a lower peak sidelobe level. When rT approached zero, the peak sidelobe level approached that of the R-V window function, and the sidelobe attenuation rate was the same as that of the R-V window function. When rT = 0.07, the trapezoidal window’s peak sidelobe level was similar to that of the Hamming window function; the main-lobe width was smaller than that of the Hamming window function; and the sidelobe attenuation rate was slightly lower than that of the Hanning window function.
3.4.2. The Effect of the Convolution Order (p)
Table 4 shows the peak sidelobe level and the normalized main-lobe width of the quasi-trapezoidal window function when rT = 0.008 was held constant and the order of convolution (p) changed.
Table 4.
The effect of p on the frequency characteristics.
The peak sidelobe level of the quasi-trapezoidal window function was strongly correlated with the number of convolution orders, as shown in Table 4. Therefore, as the number of convolution orders increased, the performance of the sidelobes improved significantly.
The above analysis is summarized as follows: the quasi-trapezoidal window function was greatly improved in terms of main-lobe width and peak sidelobe level, where the required main-lobe width could be achieved by adjusting rT and the required main-lobe width could be achieved by adjusting p. Since the quasi-trapezoidal window function makes window function engineering applications more flexible, it can be used in different situations.
3.5. Evaluation Method
The apodization degree (AD), which means the ratio of the FWHM of the symmetric water vapor spectrum after apodization to that without apodization, can be varied by adjusting rT and p in the quasi-trapezoidal window function. The AD can be changed to obtain different spectral restoration effects (spectral resolution and SNR).
The accuracy includes precision and correctness, which are used to evaluate the inversion result of the gas concentration. Relative accuracy (RE) and standard deviation (SD) were selected to calculate the correctness (meaning the degree of coincidence between the average value of multiple determinations and the true value under the same condition) and precision (meaning the degree of consistency of repeated analysis under the same condition), shown in Equations (9) and (10), respectively:
where yi represents inversion concentration, y represents true gas concentration, and represents the average value (AVG) of inversion concentration.
4. Spectral Restoration Experiment
4.1. Spectral Restoration Experiment
The main-lobe width and the peak sidelobe level of the window function can directly affect the resolution and SNR of the recovered spectrum. Since the quasi-trapezoidal window function was used to alter the main-lobe width and peak sidelobe level by adjusting parameters, we will look at how the spectral resolution and SNR were affected by the adjustment parameters of the quasi-trapezoidal window function.
The experimental interference data were collected by a self-developed Fourier transform infrared spectrometer, the working schematic of which is shown in Figure 4, and whose core device (the interferometer system) is made up of a beam splitter, moving mirrors, and stationary mirrors. The main parameters of the experimental instrument are as follows: the spectral range was 500–5000 cm−1; the scanning velocity was 0.2875 cm/s; the detector was mercury cadmium telluride (MCT). Stirling refrigeration was adopted for MCT, and the maximum optical path difference was 0.01 m. Since the spectral resolution of the experimental instrument was less than 0.5 cm−1, the full width at half maxima (FWHM) of the symmetric water vapor spectrum (spectral range: 1900~1700 cm−1) was calculated, which is called the resolution of the recovered spectrum.
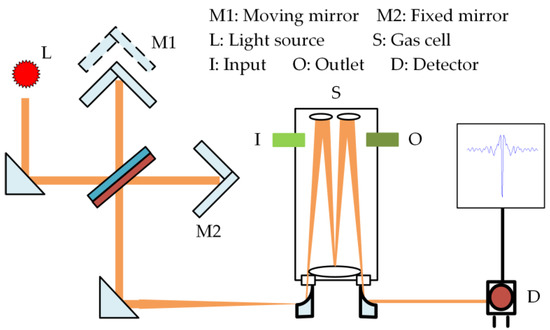
Figure 4.
Working principle of portable Fourier transform infrared spectrometer.
4.2. Spectral Resolution and SNR
Several classical window functions were used to process the collected interference data, and the SNR and resolution of the restored spectrum are shown in Table 5.
Table 5.
Spectral resolution and SNR based on classical window functions.
The interference data was processed by adjusting the parameters of the quasi-trapezoidal window function, and the SNR and resolution of the restored spectrum are shown in Table 6.
Table 6.
Spectral resolution and SNR based on the quasi-trapezoidal window function.
When rT = 0.8 and p = 1, the AD of the quasi-trapezoidal window function was 1.06, which resulted in a 17.46% improvement in spectral resolution compared with that of the Hanning window function; when rT = 0 and p = 4, the AD of the quasi-trapezoidal window function was 2.71, which resulted in a 130.09% improvement in spectral SNR compared with that of the Blackman-Harris window function.
The trend of spectral resolution with rT and the trend of spectral SNR with p are depicted in Figure 5, and it can be observed that the spectral resolution was positively correlated with rT, and the larger rT was, the higher the spectral resolution was; the spectral SNR was positively correlated with p, and the larger p was, the higher the spectral SNR was. By changing rT and p of the quasi-trapezoidal window function, it was possible to get the spectral SNR and resolution that were needed.
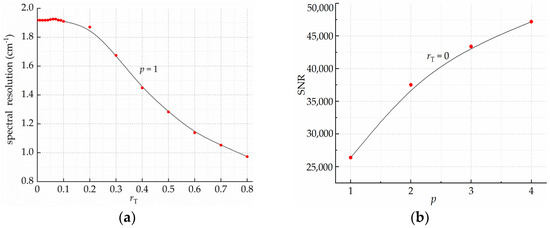
Figure 5.
(a) Trend plots of spectral resolution as a function of rT; (b) trend plots of spectral SNR as a function of p.
5. Gas Concentration Inversion
5.1. Gas Experiments
To study the effect of the quasi-trapezoidal window function on gas concentration inversion accuracy, C3H8 with a broad FWHM absorption feature and C2H4 with a narrow FWHM absorption feature, which are the main components of petrochemical catalytic cracking, were selected as experiment sample gases. The different concentrations of multicomponent gas samples used in the experiments were obtained from a standard gas through a dynamic multi-component partition gas device. Each sample was a mixed gas of C3H8 and C2H4, where the C3H8 concentration was 209 mmol × mol−1 (ppm) and the C2H4 concentration was 199 mmol × mol−1 (ppm).
A self-developed portable Fourier transform infrared spectrometer was used to collect interference data. The experiment started by passing the sample gas into the gas cell to expel the air, followed by carrying out an infrared interference experiment and saving the interference data. There were 240 sets of interference data collected in the middle, and the average was taken for every eight sets. This made 30 sets of interference data.
The 30 sets of interference data were processed by the quasi-trapezoidal window function with different parameters in ten groups (as shown in Table 7, where AD means the apodization degree), and the processed interference data were imported into the FTIR spectrum automatic quantitative analysis software, which adopted a nonlinear least-squares quantitative analysis method based on the synthesized background spectrum. The gas inversion concentration was acquired by FTIR spectroscopy automatic quantitative analysis software.
Table 7.
The parameters of the quasi-trapezoidal window function.
5.2. Spectral Features
The concentration inversion band of C3H8 gas was set at 2900–3040 cm−1. The FWHM of its standard absorbance spectrum (from the QASOFT infrared standard database) was about 32 cm−1. The comparison between the spectra of C3H8 with different apodization degrees and the C3H8 standard absorbance spectrum is shown in Figure 6. Figure 6 shows that the C3H8 spectrum had a broad FWHM with no sharp absorption peaks, and the higher the apodization degree was, the smoother the spectral curve was. The detailed changes in the spectrum with small apodization degrees were consistent, and spectral absorption was a little weaker when the apodization degree was high. When the apodization degree was 2.58, the details of the C3H8 absorption spectra were distinctly different, but the change trends were consistent.
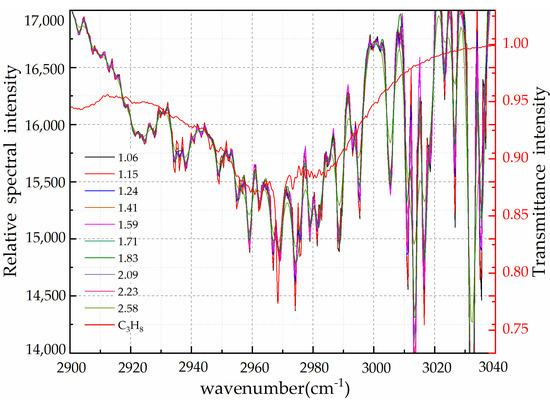
Figure 6.
The C3H8 spectrum with different apodization degrees and the C3H8 standard transmissivity spectrum.
The concentration inversion band of C2H4 gas was set at 905–960 cm−1. The FWHM of its standard absorbance spectrum was about 1.24 cm−1. The comparison between the spectra of C2H4 with different apodization degrees and the C2H4 standard absorbance spectrum is shown in Figure 7. Figure 7 shows that the C2H4 spectrum had a narrow FWHM, but the absorption peaks were single and concentrated; the spectral resolution decreased as the apodization degree increased and the spectral curve with lower resolution was smoother. When the apodization degree reached 2.58, a portion of the C2H4 absorption spectrum’s features were lost, and the intensity of the primary peak was dramatically reduced.
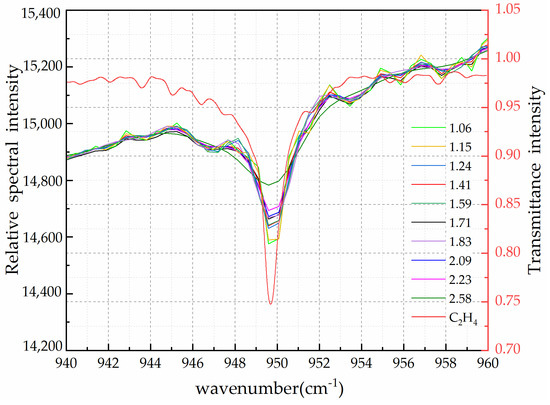
Figure 7.
The C2H4 spectrum with different apodization degrees and the C2H4 standard transmissivity spectrum.
5.3. Analytical Method
The concentration inversion method of FTIR automatic quantitative analysis software is the nonlinear least squares (NLLS) analysis method based on the synthetic background spectrum. The inversion method involves getting the background spectrum and doing the NLLS analysis.
5.3.1. Synthetic Background Spectrum
The first step is to obtain the background spectrum. The background spectrum acquisition method is as follows: choose some data points in the spectrum with weak absorption, and use the polynomial filtering method to fit a smooth curve as the background spectrum.
The specific calculation process is as follows: first, filter the measured spectrum Im; second, compare the relative spectral intensity IF obtained after filtering with the corresponding spectral intensity Im before filtering one by one; third, replace the value of Im smaller than IF with IF to construct a new relative intensity vector I0; and fourth, repeat the above process for I0 until the cycle stops to obtain the background spectrum I0. The process is shown in Figure 8.
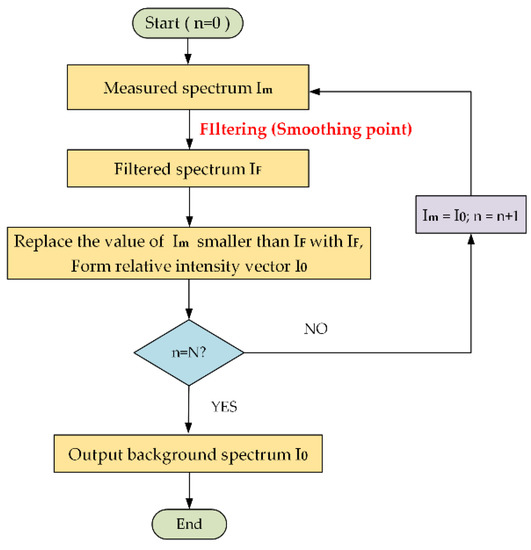
Figure 8.
The background spectrum acquisition method.
5.3.2. NLLS Analysis
The Beer–Lambert law expresses the relationship between the absorbance and concentration of an absorbing sample as follows:
where Im is the measured spectrum, I0 is the background spectrum, L is the optical path length, σi is the cross-section of component i, Ci is the concentration of component i, and ν is the wavenumber.
The spectral database, such as NIST, HITRAN, and QASOFT, contains spectroscopic parameters for absorption line positions and strengths for multiple molecules, including the pressure parameters’ broadening effect fL(ν) and the temperature parameter broadening effect fG(ν).
The integrated line strengths are tabulated in HITRAN database at 296 K and must be corrected to the temperature of the measurement as follows:
The cross section σ0(ν) is the convolution of the integrated line strength and the line shape contributions of two kinds of broadening. It is expressed as
In practice, it should be considered not only the environmental effects (pressure and temperature) but also the line shape ILS(ν) effects (resolution, window function, etc.). The cross section σ(ν) is expressed as
Define the merit function χ2, and calculate its minimum value to determine the best fitting parameters. The form of χ2 is:
For simplicity, was used to represent the coefficient vector, which comprises the concentration, environmental parameters, and instrument parameters. Equation (16) could then be rewritten as follows:
where Ii is the value of each corresponding frequency, and the standard spectrum of gas absorbance can be obtained from databases, such as NIST, HITRAN, and QASOFT.
Equation (16) shows that this is a NLLS-fitting process for multiple parameters in the broad band. Because the undetermined parameter vector here is dependent on the nonlinear model, the minimum value of χ2 must be solved by iteration. The undetermined parameter vector was initially assigned an experimental value, and then a calculation process was designed to optimize the initial experimental value. This procedure was repeated until there was no significant growth. The fitting of the standard spectrum and the measured spectrum was finished when the difference between the calculated spectrum and the measured spectrum was close to the acceptable minimum value. That is to say, the concentration information of the target gas could be obtained from the best-fitting spectrum.
For a set of fitting parameters with given initial values, the iterative process based on the Marquardt nonlinear least squares method is shown in Figure 9, where λ is the step length and is the convergence value.
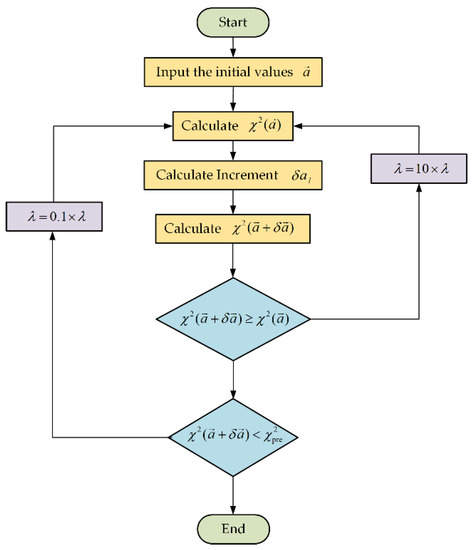
Figure 9.
Flow chart of the Marquardt NLLS algorithm.
5.4. Inversion Results and Analysis
Since the gas cell length where the hybrid gas entered the infrared spectrometer was 0.02 m, the concentrations of C3H8 and C2H4 were 4.18 ppm*m and 3.98 ppm*m, respectively.
The concentration inversion data for the gas acquired by the FTIR spectroscopy automatic quantitative analysis software was used to calculate the average value (AVG), SD, and RE of the gas concentration to characterize the accuracy of the gas inversion, shown in Table 8. Table 8 shows that when the apodization degree changed, the correctness and precision change trend of the inversion concentration were inconsistent for C3H8 and C2H4. That should result from the different absorption characteristics of C3H8 and C2H4. Therefore, the inversion concentration result needs to be discussed separately.
Table 8.
Concentration inversion results of C3H8 and C2H4.
5.4.1. C3H8 with a Broad FWHM
Figure 10a depicts the relationship between different apodization degrees and the precision of the C3H8 concentration inversion. It shows that with the improvement of the apodization degree, the spectral SNR and the precision of propane concentration inversion were improved. When the AD was 2.58, the SD was the smallest, and it was only 0.804, meaning the precision was the highest. Figure 10b depicts the relationship between the different apodization degrees and the AVG of the C3H8 concentration inversion. It shows that when the apodization degree increased, the RE of the C3H8 concentration inversion was within 3%, which was stable, but the value had an obvious downward trend. For the C3H8 gas concentration inversion, when the apodization degree was increased from 1.06 to 2.58, the precision was improved by 6.94%, and the correctness was unchanged.
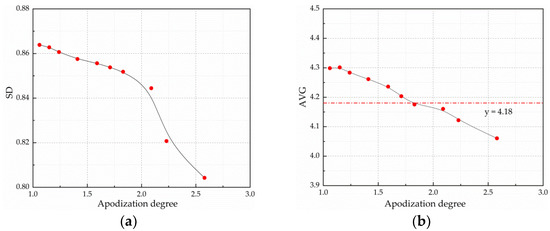
Figure 10.
(a) The precision of C3H8 concentration inversion; (b) the AVG of C3H8 concentration inversion.
5.4.2. C2H4 with a Narrow FWHM
Figure 11a depicts the relationship between different apodization degrees and the precision of the C2H4 concentration inversion. It shows that as the apodization degree increased, the spectral SNR and the precision of C2H4 concentration inversion was improved. When the AD was 2.58, the SD was the smallest, and it was just 0.429, which indicated the greatest precision. Figure 11b depicts the relationship between different apodization degrees and the AVG of the C2H4 concentration inversion. It shows that when the apodization degree was 1.06~2.09, the RE of the C2H4 concentration inversion was within 3%, which was essentially steady; when the apodization degree reached 2.58, the AVG of the C2H4 concentration inversion had an obvious decline, and the RE was 9.28%. For C2H4 gas concentration inversion, when the apodization degree was increased from 1.06 to 2.58, the precision was improved by 23.93%, while the correctness decreased dramatically. In this situation, we could correct the actual inversion concentration to ensure correctness.
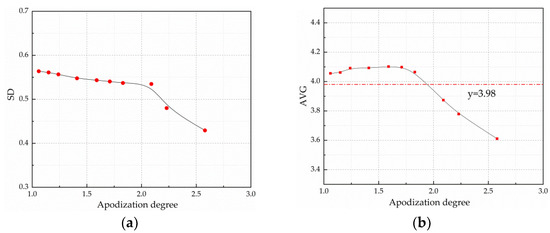
Figure 11.
(a) The precision of C2H4 concentration inversion; (b) the AVG of C2H4 concentration inversion.
To sum up, for gases whose spectrum has a broad FWHM or a narrow FWHM with a single and concentrated absorption peak, it is unnecessary to pursue excessive spectral resolution in concentration inversion. Using a quasi-trapezoidal window function to lower resolution and increase SNR can improve the inversion accuracy to a certain extent.
6. Discussion
In this study, the apodization principle of the infrared multicomponent gas analyzer’s interference signal was examined, and the quasi-trapezoidal window function was proposed. Based on analyzing the basic window function, the adjustable parameters rT and p were introduced to construct the quasi-trapezoidal apodization function, and the parameter characteristics of the quasi-trapezoidal apodization function were studied and had a wide adjustment range of main-lobe width and peak sidelobe level. When the quasi-trapezoidal window function was used to restore spectra, the parameters could be changed to get restored spectrum with different SNRs and resolutions. When the apodization degree was 1.06, the spectral resolution was improved by 17.46% compared with that of the Hanning window function; when the apodization degree was 2.71, the spectral SNR was improved by 130.09% compared with that of the Blackman-Harris window function. The C3H8 and C2H4 gas concentration inversion experiments showed that when the apodization degree was increased from 1.06 to 2.58, the inversion precision was increased by 6.94% for C3H8 gas and 23.93% for C2H4 gas, while the correctness decreased dramatically for C2H4 gas.
7. Conclusions
The engineering application of the quasi-trapezoidal window is flexible. When it is not necessary to pursue excessive spectral resolution, using a quasi-trapezoidal window function to lower the resolution and improve the SNR can improve the gas concentration inversion accuracy to a certain extent.
Author Contributions
Y.Q.: conceptualization, investigation, methodology, writing—original draft, and writing—review and editing. X.L.: writing—review and editing. X.H.: investigation. J.T.: investigation. M.G.: writing—review and editing. All authors have read and agreed to the published version of the manuscript.
Funding
This work was supported by the National Key Research and Development Project of China (grant no. 2022YFC3700503); the National Natural Science Foundation of China (grant no. 42075135); key research and development projects in Anhui Province (grant nos. 202104a05020026 and 2022l07020023); and key research and development projects in Zhejiang Province (grant no. 2021C03165).
Informed Consent Statement
Not applicable.
Data Availability Statement
Not applicable.
Conflicts of Interest
The authors declare no conflict of interest.
References
- Sanders, J.D.; Butalewicz, J.P.; Clowers, B.H.; Brodbelt, J.S. Absorption Mode Fourier Transform Ion Mobility Mass Spectrometry Multiplexing Combined with Half-Window Apodization Windows Improves Resolution and Shortens Acquisition Times. Anal. Chem. 2021, 93, 9513–9520. [Google Scholar] [CrossRef] [PubMed]
- Chen, N.; Wang, Y.; Liu, T.; Xia, Y. Fourier transform infrared nano-spectroscopy: Mechanism and applications. Appl. Spectrosc. Rev. 2021, 56, 531–552. [Google Scholar] [CrossRef]
- Schwiegerling, J. Optical transfer function optimization based on linear expansions. In Novel Optical Systems Design & Optimization XVIII; International Society for Optics and Photonics: San Diego, CA, USA, 2015. [Google Scholar] [CrossRef]
- Kalinowski, H.J.; Fabris, J.L.; Bock, W.J.; Maruyama, F.; Kishi, M.; Hotate, K. Brillouin optical correlation domain reflectometry with temporal gating scheme and apodization scheme. In Proceedings of the 24th International Conference on Optical Fibre Sensors, Curitiba, Brazil, 28 September–2 October 2015. [Google Scholar] [CrossRef]
- Reddy, A.; Sagar, D.K.; Khonina, S.N. Asymmetric apodization for the comma aberrated point spread function. Comput. Opt. 2017, 41, 484–488. [Google Scholar] [CrossRef]
- Compaleo, J.; Gupta, I.J. Spectral Domain Sparse Representation for DOA Estimation of Signals with Large Dynamic Range. Sensors 2021, 21, 5164. [Google Scholar] [CrossRef] [PubMed]
- Norton, R.H.; Beer, R. New apodizing functions for Fourier spectrometry. J. Opt. Soc. Am. 1976, 66, 419. [Google Scholar] [CrossRef]
- Naylor, D.A.; Tahic, M.K. Apodizing functions for Fourier transform spectroscopy. J. Opt. Soc. Am. A Opt. Image Sci. Vis. 2007, 24, 3644–3648. [Google Scholar] [CrossRef] [PubMed]
- Justo, J.F.; Beccaro, W. Generalized Adaptive Polynomial Window Function. IEEE Access 2020, 8, 187584–187589. [Google Scholar] [CrossRef]
- Chen, J.; Feng, Y.; Hu, B.; Li, J.; Sun, J.; Hao, X.; Bai, Q. Window Function Optimization in Atmospheric Wind Velocity Retrieval with Doppler Difference Interference Spectrometer. Acta Opt. Sin. 2017, 37, 0207002. [Google Scholar] [CrossRef]
- Reeg, J.; Oelze, M.L. Improving lateral resolution in ultrasonic Imaging by utilizing nulls in the beampattern. In Proceedings of the 2015 IEEE International Ultrasonics Symposium (IUS), Taipei, Taiwan, 21–24 October 2015. [Google Scholar] [CrossRef]
- Qu, J.W.; Gong, M.F.; Wang, X.Y. Harmonic Analysis Based on Blackman-Harris Self-Convolution Window. Appl. Mech. Mater. 2013, 330, 977–980. [Google Scholar] [CrossRef]
- He, Q.; Jiang, H.; Wang, Z.; Ye, S.; Shang, X.; Li, T.; Tang, L. Spatial resolution enhancement of DFT-BOTDR with high-order self-convolution window. Opt. Fiber Technol. 2020, 57, 102188. [Google Scholar] [CrossRef]
- Krishna, B.T.; Chandrasekhar, P. Reduction of sidelobe level using convolutional windows. In Proceedings of the 2012 1st International Conference on Emerging Technology Trends in Electronics, Communication & Networking, Surat, India, 19–21 December 2012. [Google Scholar] [CrossRef]
- Li, Z.; Shi, H.; Luo, H.; Xiong, W. Study on the Relationship between Apodization Function and Signal-to-Noise Ratio of Hyperspectral Spatial Interferogram. Spectrosc. Spectr. Anal. 2020, 40, 29. [Google Scholar] [CrossRef]
- Tian, K.; Chen, G.-X.; Song, Q.-Y. A two-step scanning-mask exposure method for the fabrication of arbitrary apodized fiber gratings. Opt. Int. J. Light Electron Opt. 2017, 141, 24–31. [Google Scholar] [CrossRef]
- Kilgour, D.; Orden, S.V. Absorption mode Fourier transform mass spectrometry with no baseline correction using a novel asymmetric apodization function. Rapid Commun. Mass Spectrom. 2015, 29, 1009–1018. [Google Scholar] [CrossRef] [PubMed]
- Deng, J.; Tong, J.; Gao, M.; Li, X.; Li, Y.; Han, X.; Liu, W. Improved Triangular Window Apodization Function Based on Zero-Order Bessel Function. Acta Opt. Sin. 2020, 40, 0307001. [Google Scholar] [CrossRef]
- Desbiens, R.; Tremblay, P. A new efficient approach to the design of parametric windows with arbitrary sidelobe profiles. Signal Process. 2006, 86, 3226–3239. [Google Scholar] [CrossRef]
- Han, Y.; Suwinski, L.; Tobin, D.; Chen, Y. Effect of self-apodization correction on Cross-track Infrared Sounder radiance noise. Appl. Opt. 2015, 54, 10114–10122. [Google Scholar] [CrossRef] [PubMed]
- Simon, B.; Köstler, H. Improving the sensitivity of FT-NMR spectroscopy by apodization weighted sampling. J. Biomol. NMR 2019, 73, 155–165. [Google Scholar] [CrossRef] [PubMed]
Publisher’s Note: MDPI stays neutral with regard to jurisdictional claims in published maps and institutional affiliations. |
© 2022 by the authors. Licensee MDPI, Basel, Switzerland. This article is an open access article distributed under the terms and conditions of the Creative Commons Attribution (CC BY) license (https://creativecommons.org/licenses/by/4.0/).