Abstract
We have numerically investigated the dynamics of frequency shifts in semiconductor lasers under the injection of a frequency comb. We have studied the effect of comb spacing on the locking bandwidth. Frequency comb spacing was found to play an important role in the boundaries of the locking bandwidth as well as in the frequency shift of the SL peak.
1. Introduction
Frequency combs have been used in semiconductor lasers since 1992 []. In terms of optically injected semiconductor lasers, frequency combs have been studied in different aspects, including comb generation [,,,,], selective amplification of the comb [], producing low-noise microwave signals [,], optoelectronic millimeter-wave synthesis [] and full-duplex coherent optical system []. As a key component in communication systems, the investigation of the frequency and its stabilization in semiconductor lasers has been under investigation since 1988 [,]. One of the major techniques to stabilize the frequency in semiconductor lasers is optical injection locking []. We have previously reported the dynamics of semiconductor lasers under dual optical injection [,]. The additional signal was found to enhance the chaos and control the stability map. Arfan et al. [] have shown that the injected laser can lock to equipartition points in frequencies between two adjacent modes or each individual frequency of the master laser. In 2014, analytical and numerical calculations were performed for a semiconductor laser under the injection of a frequency comb []. The study found that the locking depends on the separation of the comb and the identification of three major regions of unique amplifications. Later on, another study identified important criteria to maximize the frequency locking range of the semiconductor laser under the injection of a frequency comb []. It was also found that the slave laser under the injection of a frequency comb undergoes two different mechanisms, in which the output of the frequency comb separation is decreased []. The study also found that the relaxation oscillations of the injected laser can lock to the harmonics of the injected optical comb, generating extra tones in the optical comb around the slave laser’s frequency. Recently, a comprehensive theoretical and experimental study investigated the variety of nonlinear dynamics exhibited by a single-frequency semiconductor laser subjected to optical injection from a frequency comb []. By varying the comb parameters (number of lines and comb spacing), a rich variety of nonlinear dynamics was identified including wave mixing and irregular chaotic pulsing. In this study, we numerically investigate the effect of frequency comb spacing on the locking bandwidth and on the frequency shift of the slave laser. The locking maps for different comb spacings are drawn and discussed. The frequency shifts are extracted from the maps and analyzed.
2. Materials and Methods
Our model is based on Lang’s approach [], where the system is described by three differential equations for electric field amplitude, phase and carrier density. Before we elaborate on the model, let us introduce the frequency comb, which will be injected inside the cavity of the slave laser (SL). Our SL is assumed to be a single-mode DFB laser. The frequency comb consists of five peaks as shown in Figure 1. The central peak is f3 and the spacing between the peaks is ∆, which is constant in each case as will be shown later. The intensity of the peaks (and hence the injection level) is equal.
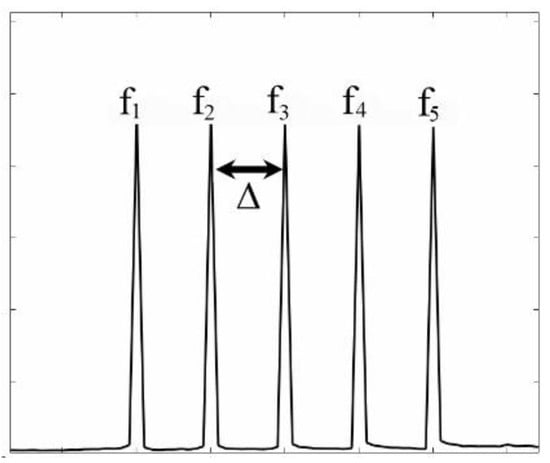
Figure 1.
The frequency comb used in our simulation.
The rate equation for the SL for electric field amplitude, phase and carrier density, can be expressed respectively, as follows:
where Eo (t) is the electric field of the SL, GN is the material gain coefficient, ΔN(t) is the population inversion (N–Nth) where N is the carrier density and Nth is its value at threshold, η is the coupling coefficient, m represents the order of the frequency in the comb (m = 1, 2, 3, 4, 5), , where (the angular frequency detuning between the free-running SL laser and the master signals MLm), ϕο(t) is the SL phase, α is the linewidth enhancement factor and No is transparent carrier density. J is the injected current density and τs is the lifetime for spontaneous emission and non-radiative recombination. The injection strength Km, can be defined as the ratio of the injected field (Em) to the free-running SL field (Eos), which is given by , where τp is the photon lifetime. Note that throughout our simulation the injection level of the comb peaks is kept equal. In terms of the locking map, the map is drawn considering the detuning and injection level of the central peak (i.e., f3). We numerically perform full integration for the rate Equations (1)–(3) using Runge–Kutta method. The theoretical power spectra were obtained through fast Fourier transform (FFT). The dominant peak is then recorded to determine the dynamic of the system (locking, pulling, pushing, etc.). The parameters used in our simulation are obtained through experimental characterization of the SL [], and are shown in Table 1.

Table 1.
Parameters used in our simulation.
3. Results and Discussion
In order to study the dynamics of the frequency shift, we first draw the locking map of the system. The master frequency comb MLm (with the spacing ∆ = 0.2 GHz) is injected inside the cavity of the SL. Its central peak (f3) is then swapped from −20 GHz to +20 GHz at each injection level (from 0 to 0.7) to draw the map shown in Figure 2. We record the SL peak position at each point so that the map shows the frequency shift all over the map. The inset on the right shows the general characteristics of the locking map. The map looks like a typical injection locking map but it appears wider than the case in a single injection and that is obviously because the injected signal consists of five peaks. Inside the locking region (marked locked in the inset), the SL is unstably locked to the comb signals. The stability condition is that the side peak, including the relaxation oscillation frequency (ROF), should be lower than −20 dB []. This condition is not fulfilled in this case and the map showed only the unstable locking region. Therefore, the frequency shifts of the SL (inside the locking region) have the same frequency detuning value, meaning that the SL is locked to the ML.
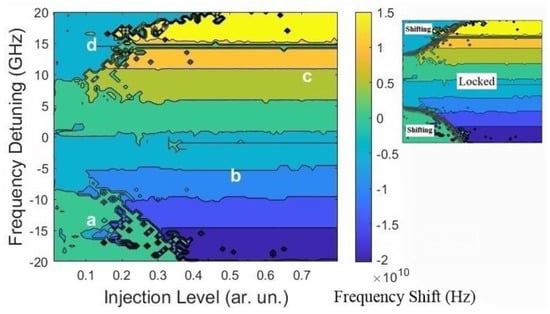
Figure 2.
The locking map of the SL under the injection of a frequency comb with ∆ = 0.2 GHz. The inset shows the general characteristics of the map. The labels (a–d) indicate the operation points at which the stability maps in Figure 4 are taken.
It can also be seen that the lower boundary of the locking bandwidth has a clear intermittency in the locking shown by the small locking islands outside the band. This region was previously reported as having chaotic behavior in the case of a single optical injection []. In terms of the frequency shifts, we observe frequency pushing outside the locking bandwidth. That is to say, the SL shift is positive when the comb is injected in the negative detuning side (outside the locking bandwidth) and vice versa. In this region, we have previously reported the frequency-pulling effect that leads to the secondary locking region (SLR) in semiconductor lasers under single and dual optical injections []. This behavior was attributed to the carrier density dynamics []. Frequency pushing was also reported before for single [] and dual [] optical injections. This pushing was found in the low injection region and was also attributed to the variation in carriers’ density. We shall elaborate on this pushing later on. To show the locking and pushing described before, we recorded the power spectra of the SL at four different points (a, b, c, and d) shown in Figure 2. The corresponding spectra are shown in Figure 3.
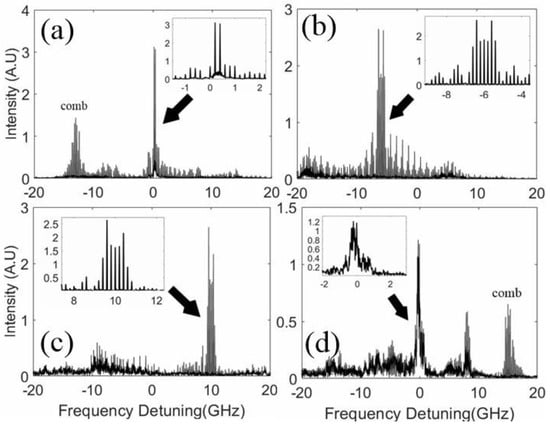
Figure 3.
Power spectra of the system at the points marked in Figure 2. The insets are magnification part of the spectra as indicated by the arrows.
In Figure 3a, the comb is injected outside the locking region (at label a in Figure 2, ∆f = −13 GHz and K = 0.1). The SL is not locked to the comb but rather pushed to the positive detuning side as shown in the inset. However, due to the gain inside the cavity, the comb number and power largely altered according to their position relative to the SL peak. Figure 3b shows the spectra when the comb is injected inside the locking bandwidth (at label b in Figure 2, ∆f = −6 GHz and K = 0.5). The SL is locked to the comb with the generation of many small combs (four-wave mixing FWM) around the SL peaks with the same spacing value. The same behavior is observed when the comb is injected in the positive detuning side (at label c in Figure 2, ∆f = 10 GHz and K = 0.7). The spectra of such behavior are shown in Figure 3c. Finally, when the comb is injected outside the locking region in the positive detuning side (at label d in Figure 2, ∆f = 15 GHz and K = 0.1), the SL is pushed towards the negative detuning side as shown in Figure 3d. Note here that the cavity mode spacing in our model is about 0.3 nm according to our characterization []. Since our laser is assumed to be a single-mode DFB laser and is driven far above the threshold (see Table 1), the effect of mode spacing can be neglected. This spacing is believed to play a major role in the dynamics if the SL is driven near the threshold where the Amplified Spontaneous Emission can be noticed.
To see the effect of the comb on the locking map, we generate the locking map for different comb spacing (∆ = 0.2, 0.4, 0.6 and 0.8 GHz), as shown in Figure 4. As can be seen in the figure, the main effect of the comb spacing on the map appears on the boundaries of the map, especially on the negative detuning side. As the spacing increases, the intermittency at the boundary of the map is enhanced. At higher spacing (0.6 and 0.8 GHz), this intermittency appears inside the locking bandwidth in the negative detuning side and at high-frequency detuning, as shown in Figure 4c,d. There are many spots at which the SL is not locked to the comb but pushed (the green spot inside the locking bandwidth). This clearly indicates that the comb spacing has a crucial effect on the locking map. This can be attributed to the fact that higher spacing provides a better opportunity for the FWM and other nonlinear dynamics to occur in the negative detuning side, where chaos is reported in the single optical injection case [].
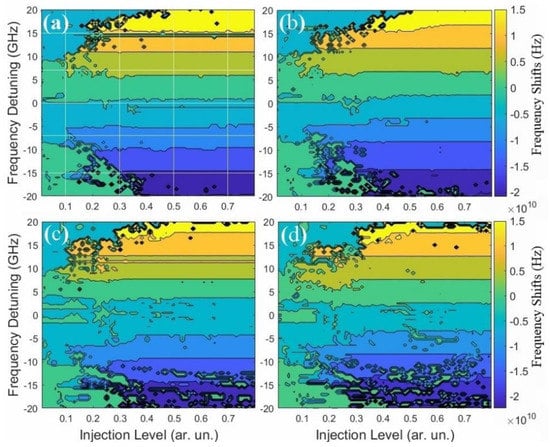
Now, we investigate the frequency shifts extracted from the maps above. We first scan the shift as a function of frequency detuning at constant injection levels (0.1, 0.3, 0.5 and 0.7), as shown by the vertical white lines in Figure 4a. The extracted frequency shifts are shown in Figure 5. As expected, the frequency shift is more evident with a low injection level (at 0.1, i.e., Figure 5a). In this case, the SL peak experiences first frequency pushing when the comb is injected far away from the free-running SL. As the injected comb approaches the locking bandwidth, the SL peak is pulled toward the injected signals. These behaviors are attributed to the dynamics of carrier density inside the cavity of the SL.
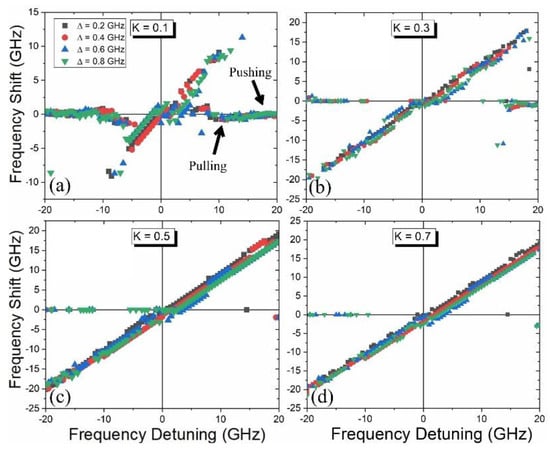
Figure 5.
Frequency shifts vs. frequency detuning at different injection levels for the four cases of the frequency comb: (a) K = 0.1, (b) K = 0.3, (c) K = 0.5 and (d) K = 0.7.
As the injection level increases (to 0.3, i.e., Figure 5b), the frequency shift is clearly damped due to the carriers’ suppression. For higher injection levels (0.5 and 0.7, i.e., Figure 5c,d), the maps are covered by the locking region so that the frequency shift is always equal to the frequency detuning except for a few points here and there, especially at higher comb spacings.
We have also scanned the frequency shift horizontally in the maps as a function of the injection levels at constant frequency detunings (the horizontal white lines in Figure 4a, at ∆f = 15, 7, 0, −7, −15 GHz). The extracted shifts are shown in Figure 6. At ∆f = −15 GHz, both frequency pushing and pulling are observed, as shown in Figure 6a. However, at ∆f = +15 GHz, we only observed frequency pushing, as shown in Figure 6b. This is probably due to the asymmetric characteristics originating from the value of the linewidth enhancement factor (LEF) as reported before in the case of a single optical injection [].
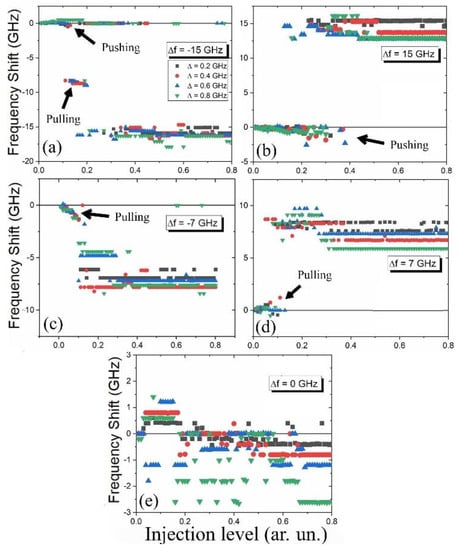
Figure 6.
Frequency shifts vs. injection level at different frequency detunings for the four cases of the frequency comb spacing: (a) ∆f = −15 GHz, (b) ∆f = 15 GHz, (c) ∆f = −7 GHz, (d) ∆f = 7 GHz and (e) ∆f = 0 GHz.
In the case of ∆f = −7 and 7 GHz shown in Figure 6c,d, we only observe frequency pulling as the locking bandwidth is very close. Finally, when the comb is injected at the same frequency as the free-running SL (∆f = 0 GHz, i.e., Figure 6e), we observe that the SL is slightly shifted towards the positive detuning side at a low injection level (<0.2), and for higher than that, the SL peak is shifted towards the negative detuning side. This is again due to the change in the refractive index caused by the change in carriers’ density and described by the LEF.
Finally, we concentrate on the frequency pushing occurring at a low injection level (K = 0.1) when the comb is injected very far from the free-running SL (i.e., at ∆f > 10 GHz and ∆f > −10 GHz), as shown in Figure 7. In other words, this figure is a magnification of parts of Figure 5a. It can be seen that the frequency pushing in general is enhanced as the spacing of the comb increases. The spread of the data is due to the fact that the dominant peak in the comb is not always the same and changes as the comb is detuned closer or further from the free-running SL. This random FWM can also cause the frequency pulling shown in some points in the figure (red and green).
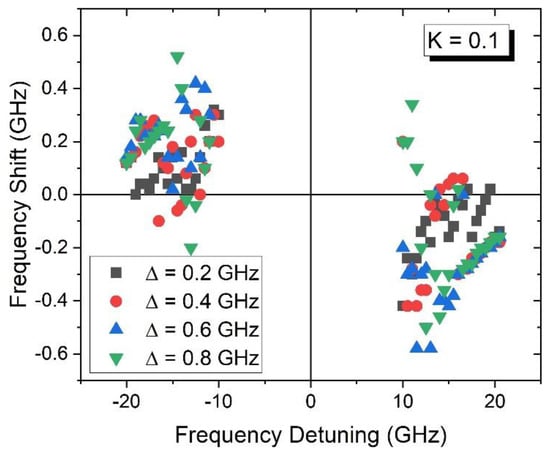
Figure 7.
Frequency shifts vs. frequency detuning at K = 0.1 for the four cases of the frequency comb.
4. Conclusions
We have shown theoretically that the frequency comb spacing has a crucial role in the locking map of a semiconductor laser under the injection of the frequency comb. As the comb spacing increases, the boundaries of the locking area become intermittent, especially the lower boundary at the negative detuning side. This spacing of the comb has been found to affect the frequency shift of the free-running SL outside the locking bandwidth. These results are believed to contribute to a better understanding of the frequency comb injection as they can be utilized in many modern communication applications. Future work should include the effect of changing the number of the comb lines, varying the power of the lines, the dynamics of carriers’ density and the experimental validation of these results.
Funding
This research was funded by Taif University, Researchers Supporting Project number (TURSP-2020/25), Taif, Saudi Arabia.
Institutional Review Board Statement
Not applicable.
Informed Consent Statement
Not applicable.
Data Availability Statement
Not applicable.
Acknowledgments
This work was supported by Taif University, Researchers Supporting Project number (TURSP-2020/25), Taif, Saudi Arabia.
Conflicts of Interest
The author declares no conflict of interest.
References
- Ohtsu, M.; Nakagawa, K.; Kourogi, M.; Wang, W. Frequency control of semiconductor lasers. J. Appl. Phys. 1993, 73, R1–R17. [Google Scholar] [CrossRef]
- Sooudi, E.; Sygletos, S.; Ellis, A.D.; Huyet, G.; McInerney, J.G.; Lelarge, F.; Merghem, K.; Rosales, R.; Martinez, A.; Ramdane, A.; et al. Optical Frequency Comb Generation Using Dual-Mode Injection-Locking of Quantum-Dash Mode-Locked Lasers: Properties and Applications. IEEE J. Quantum Electron. 2012, 48, 1327–1338. [Google Scholar] [CrossRef]
- Rosado, A.; Pérez-Serrano, A.; Tijero JM, G.; Valle, Á.; Pesquera, L.; Esquivias, I. Experimental study of optical frequency comb generation in gain-switched semiconductor lasers. Opt. Laser Technol. 2018, 108, 542–550. [Google Scholar] [CrossRef]
- Rosado, A.; Perez-Serrano, A.; Tijero, J.M.G.; Gutierrez, A.V.; Pesquera, L.; Esquivias, I. Numerical and Experimental Analysis of Optical Frequency Comb Generation in Gain-Switched Semiconductor Lasers. IEEE J. Quantum Electron. 2019, 55, 2001012. [Google Scholar] [CrossRef]
- Zhao, B.-B.; Kovanis, V.; Wang, C. Tunable Frequency Comb Generation Using Quantum Cascade Lasers Subject to Optical Injection. IEEE J. Sel. Top. Quantum Electron. 2019, 25, 1900207. [Google Scholar] [CrossRef]
- Ren, H.; Fan, L.; Liu, N.; Wu, Z.; Xia, G. Generation of Broadband Optical Frequency Comb Based on a Gain-Switching 1550 nm Vertical-Cavity Surface-Emitting Laser under Optical Injection. Photonics 2020, 7, 95. [Google Scholar] [CrossRef]
- Moon, H.S.; Kim, E.B.; Park, S.E.; Park, C.Y. Selection and amplification of modes of an optical frequency comb using a femtosecond laser injection-locking technique. Appl. Phys. Lett. 2006, 89, 181110. [Google Scholar] [CrossRef]
- Ramond, T.M.; Hollberg, L.; Juodawlkis, P.W.; Calawa, S.D. Low-noise optical injection locking of a resonant tunneling diode to a stable optical frequency comb. Appl. Phys. Lett. 2007, 90, 171124. [Google Scholar] [CrossRef]
- Chan, S.-C.; Xia, G.-Q.; Liu, J.-M. Optical generation of a precise microwave frequency comb by harmonic frequency locking. Opt. Lett. 2007, 32, 1917. [Google Scholar] [CrossRef]
- Fukushima, S.; Silva, C.F.C.; Muramoto, Y.; Seeds, A.J. Optoelectronic millimeter-wave synthesis using an optical frequency comb generator, optically injection locked lasers and a unitraveling-carrier photodiode. J. Light. Technol. 2003, 21, 3043–3051. [Google Scholar] [CrossRef]
- Zhang, H.; Xu, M.; Zhang, J.; Jia, Z.; Campos, L.A.; Knittle, C. Highly Efficient Full-Duplex Coherent Optical System Enabled by Combined Use of Optical Injection Locking and Frequency Comb. J. Light. Technol. 2021, 39, 1271–1277. [Google Scholar] [CrossRef]
- Ohtsu, M. Frequency stabilization in semiconductor lasers. Opt. Quantum Electron. 1988, 20, 283–300. [Google Scholar] [CrossRef]
- Manamanni, K.; Steshchenko, T.; Wiotte, F.; Ramdane, A.C.; Sahni, M.-O.; Roncin, V.; Du-Burck, F. Frequency Stability Transfer in Passive Mode-Locked Quantum-Dash Laser Diode Using Optical Injection Locking. IEEE J. Quantum Electron. 2022, 58, 1300409. [Google Scholar] [CrossRef]
- Liu, Z.; Slavik, R. Optical Injection Locking: From Principle to Applications. J. Light. Technol. 2020, 38, 43–59. [Google Scholar] [CrossRef]
- Al-Hosiny, N.M.; Henning, I.D.; Adams, M.J. Tailoring enhanced chaos in optically injected semiconductor lasers. Opt. Commun. 2007, 269, 166–173. [Google Scholar] [CrossRef]
- Al-Hosiny, N.M. 3D Injection-locking maps of semiconductor laser under multiple optical injections. J. Opt. 2021, 50, 629–636. [Google Scholar] [CrossRef]
- Tistomo, A.S.; Gee, S. Laser frequency fixation by multimode optical injection locking. Opt. Express 2011, 19, 1081. [Google Scholar] [CrossRef]
- Gavrielides, A. Comb Injection and Sidebands Suppression. IEEE J. Quantum Electron. 2014, 50, 364–371. [Google Scholar] [CrossRef]
- Ó Duill, S.P.; Anandarajah, P.M.; Smyth, F.; Barry, L.P. Injection-locking criteria for simultaneously locking single-mode lasers to optical frequency combs from gain-switched lasers. In Physics and Simulation of Optoelectronic Devices XXV; Witzigmann, B., Osiński, M., Arakawa, Y., Eds.; SPIE: Bellingham, WA, USA, 2017; Volume 10098, pp. 51–59. [Google Scholar] [CrossRef]
- Shortiss, K.; Lingnau, B.; Dubois, F.; Kelleher, B.; Peters, F.H. Harmonic frequency locking and tuning of comb frequency spacing through optical injection. Opt. Express 2019, 27, 36976. [Google Scholar] [CrossRef]
- Doumbia, Y.; Malica, T.; Wolfersberger, D.; Panajotov, K.; Sciamanna, M. Nonlinear dynamics of a laser diode with an injection of an optical frequency comb. Optics Express 2020, 28, 30379. [Google Scholar] [CrossRef]
- Al-Hosiny, N.M.; Henning, I.D.; Adams, M.J. Correlation of Electron Density Changes with Optical Frequency Shifts in Optically Injected Semiconductor Lasers. IEEE J. Quantum Electron. 2006, 42, 570–580. [Google Scholar] [CrossRef]
- Hui, R.; D’Ottavi, A.; Mecozzi, A.; Spano, P. Injection locking in distributed feedback semiconductor lasers. IEEE J. Quantum Electron. 1991, 27, 1688–1695. [Google Scholar] [CrossRef]
- Al-Hosiny, N.; Henning, I.D.; Adams, M.J. Secondary locking regions in laser diode subject to optical injection from two lasers. Electron. Lett. 2006, 42, 759. [Google Scholar] [CrossRef]
- Simpson, T.B.; Liu, J.M.; Huang, K.F.; Tai, K. Nonlinear dynamics induced by external optical injection in semiconductor lasers. Quantum Semiclassical Opt. J. Eur. Opt. Soc. Part B 1997, 9, 765–784. [Google Scholar] [CrossRef]
- Liao, Y.-H.; Liu, J.-M.; Lin, F.-Y. Dynamical Characteristics of a Dual-Beam Optically Injected Semiconductor Laser. IEEE J. Sel. Top. Quantum Electron. 2013, 19, 1500606. [Google Scholar] [CrossRef]
- Goldberg, L.; Taylor, H.F.; Weller, J.F. Locking bandwidth asymmetry in injection-locked GaAlAs lasers. Electron. Lett. 1982, 18, 986. [Google Scholar] [CrossRef]
Publisher’s Note: MDPI stays neutral with regard to jurisdictional claims in published maps and institutional affiliations. |
© 2022 by the author. Licensee MDPI, Basel, Switzerland. This article is an open access article distributed under the terms and conditions of the Creative Commons Attribution (CC BY) license (https://creativecommons.org/licenses/by/4.0/).