Abstract
We fabricated a Yb:YAG crystal-derived silica fiber (YCDSF) by the melt-in-tube method with a CO2 laser-heated drawing tower and explored the influences of the heat treatment method on fluorescent properties in the YCDSF. After the heat treatment, the intensity of the emission peaks and the fluorescence lifetime of the YCDSFs improved. In particular, after 1350 °C of heat treatment, a series of sharp peaks appeared in the core layer, which may form a new crystalline phase. Moreover, its emission intensity at 1030 nm was significantly enhanced, over 2 times greater than before the heat treatment. Additionally, the fluorescence lifetime of Yb ions was also increased from 129 to 621 μs, indicating the changes in local environments around Yb ions. Then, schematic models were set up to show how the local environments around Yb ions are gradually changing. These results revealed that the assessed YCDSF is of excellent performance; after the heat treatment, it may be a potential material for realizing optical amplification, light sources, fiber lasers, and so on.
1. Introduction
Recently, near-infrared gain fiber-based fiber lasers working at around 1.0 μm have been widely used in optical detection, medical surgery, and laser ranging [1,2,3,4]. Some rare-earth ions, like Yb3+ ions or Nd3+ ions, have realized 1.0 μm emissions in suitable matrix materials [5,6,7,8]. Compared with Nd3+ ions, the energy level of Yb ions is relatively simple and only possesses 2F5/2 and 2F7/2 levels [9]. Based on various Yb-doped fibers, like silica fibers, phosphate fibers, and yttrium aluminum garnet crystal-derived silica fibers (YCDSF), a series of high-performance fiber lasers and amplifiers have been reported [10,11,12,13,14]. In addition, YAG crystal/ceramic-derived fibers have been fabricated to meet the requirements of new host materials [15,16]. These fibers are matched well with commercial silica-based fibers and present a high doping concentration, which are excellent candidates for applications. However, the luminescence properties of optical fibers are limited due to the weak crystal field in glass structures [17,18].
Consequently, various post-treatment methods have been proposed aiming at improving the optical properties, such as laser irradiation and heat treatment methods [19,20]. In 2012, the oxyfluoride nanocrystal fibers were fabricated by controlled heat treatment of glass fibers [21]. Recently, enhanced emissions in Er-doped nanocrystal fibers have been achieved by heat treatment [22]. However, these works have not provided any detailed description of the change in the optical properties. Many works were mainly limited to bulk glasses, and there has rarely been a report of the influences of the heat treatment method on luminescence performance in a YCDSF.
In this work, a kind of YCDSF was fabricated on a CO2 laser-heated drawing tower with a melt-in-tube method. Before and after the heat treatment, its microstructure was evaluated by Raman spectroscopy, and its fluorescent properties were investigated, including excitation and emission spectra and fluorescence lifetime.
2. Experimental Procedure
2.1. Fiber Fabrication and Properties
A YCDSF was fabricated on a CO2 laser-heated drawing tower with the melt-in-tube method. A commercially available YAG crystal rod (Lanjing Optoelectronic Technology, Shanghai, China) with a Yb ion concentration of 10.0 at% was used as the core layer of the fiber preform. It was 4.0 cm long and had a diameter of 0.5 mm. The crystal rod was inserted into a high-purity silica tube with an inner diameter of 1.0 mm and an external diameter of 6.0 mm to form a fiber preform. Then, the preform was subsequently drawn into the YCDSFs by a CO2 laser-heated drawing tower. Compared with the case of a graphite-heated drawing tower [23,24], the CO2 laser-heated drawing tower has a small heating zone, which means less time for the core melt to dissolve the cladding silica. At a drawing temperature of approximately 2050–2100 °C, the preform cladding is softened, while its core is in a molten state. During the fiber drawing process, the silica tube was connected to a vacuum pump, which created a negative pressure environment. The vacuum environment can effectively avoid the formation of micro-bubbles and defects, which promotes the formation of a well-defined interface between the fiber core and cladding [25,26]. More details on how the YCDSFs were processed can be found in the previous work [27].
The refractive index distribution of the cross-section of the YCDSF was measured by a refractive index profiler (S14, Photon Kinetics, Inc., Beaverton, OR, USA), as shown in Figure 1a. The refractive index difference between the core and cladding layer was approximately 0.07, and the numerical aperture of YCDSF was approximately 0.46. The cladding and core diameters of the fiber were approximately 200 and 35 μm, respectively. Here, the obtained core-cladding diameter ratio differed from that of the preform, which may be due to the element migration and the interfacial stresses between the molten core and the softened cladding. Furthermore, the elemental distribution of the precursor fiber core was measured by an electron probe micro-analyzer (EPMA-8050G, SHIMADZU, Kyoto, Japan), as shown in Figure 1b. The fiber core contained Al, Y, and Yb elements from the YAG crystal materials. In addition, it can be found that Si spontaneously appeared in the core and cladding layer, indicating that there is an obvious Si diffusion in the YCDSF. The two-dimensional elemental distribution of the YCDSF in cross-section showed the same results, as shown in Figure 1c. The exact concentration of SiO2 in the fiber core was 48.96 wt.%, while the contents of Y2O3 and Yb2O3 were 21.45 and 2.45 wt.%, respectively. The detailed elemental concentrations are shown in Table 1.
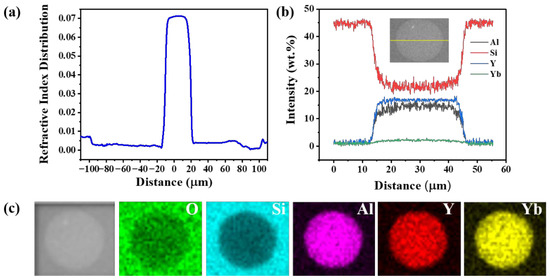
Figure 1.
(a) Refractive index distribution of the YCDSF cross-section. (b) Elemental distribution curve along the diameter of the YCDSF. (c) Two-dimensional elemental distribution of the YCDSF in cross-section.

Table 1.
Elemental concentrations of YCDSF.
2.2. Heat Treatment Process and Characterization Methods
The obtained precursor fibers (labeled as YCDSF0) were heat-treated for 5 h at different temperatures of 1200, 1300 and 1350 °C, respectively. These were then labeled as YCDSF1, YCDSF2, and YCDSF3, respectively. The heat treatment was carried out in a muffle (SXL-1700C, Shanghai, China), and its heating rate and the highest heat temperature were 10 °C/min and 1700 °C, respectively. Before the heat treatment, the YCDSF transmission with red light ensured that there were no obvious scattering points, as shown in Figure 2a. Then, a 5 cm long YCDSF was suspended in the central part of the furnace. When the furnace temperature was up to the target temperature, the YCDSF was put into the furnace quickly via a single-mode fiber (SMF) spliced to its tail, as shown in Figure 2b. After the sample was heated for 5 h, it was removed and rapidly cooled to room temperature, as shown in Figure 2c. Figure 2d shows the Raman analysis of YCDSF with heat treatment. To investigate the structural characteristics of the fiber, the Raman spectrum of the YCDSF core was recorded by a Raman spectrometer (LabRam HR800, Horiba Jobin Yvon, Paris, France) excited by a 532 nm laser. The excitation and emission spectra of the precursor fibers’ heat treatment at different temperatures were characterized by a fluorescence spectrometer (FLS980, Edinburgh Instruments, Livingston, UK) equipped with a 450W XE light source. Fluorescence lifetime was also measured using the same fluorescence spectrometer with a microseconds lamp as the excitation source.
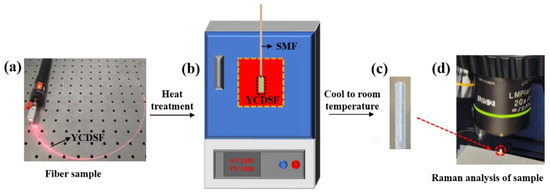
Figure 2.
(a) Image of YCDSF transmission with red light. (b) Schematic diagram of YCDSF heat treatment. (c) Image of YCDSF cooled to room temperature. (d) The Raman analysis of heat-treated YCDSF.
Additionally, the fluorescence lifetime of YCDSFs can be fitted with a bi-exponential equation. The bi-exponential equation can be written as Equation (1):
where R is the intensity of the measured fluorescence lifetime spectra, B1 and B2 are the fitting constants, and τ1 and τ2 stand for the fast and slow decay lifetime of Yb ions, respectively. The average lifetime τ can be estimated as Equation (2):
where w1 and w2 are the weights of τ1 and τ2, respectively. They can be calculated according to Equations (3) and (4) [28]:
Thus, τ can be obtained as [29]:
3. Experimental Results and Discussion
3.1. Raman Spectra of the YCDSFs before and after Heat Treatment
In order to investigate the effect of heat treatment on fiber microstructure, Raman spectra of the YCDSFs heat-treated at different temperatures are compared, as shown in Figure 3a. The Raman spectrum of YCDSF0 consists of several intense broad bands, which is a typical Raman spectrum of glass network structure. Due to the high-temperature fiber drawing process, the silica from the cladding can diffuse into the molten YAG crystal core to form an amorphous phase in the fiber core, leading to broadband Raman peaks. These broadband Raman peaks can be attributed to the Si-O-Si stretching or bending modes, which were also reported in [11]. The Raman spectra of the core layer in YCDSF1 and YCDSF2 are like that of the YCDSF0, indicating that there was still an amorphous state in the fiber core. As the heat treatment temperature increased to 1350 °C, sharp peaks obviously appeared in the Raman spectrum of the core layer in YCDSF3. These sharp peaks are obviously different for the Yb:YAG crystal, as shown in Figure 3b. All sharp peaks are in good agreement with the Raman spectrum of β-Y2Si2O7 crystals [30], which indicates that Y2Si2O7 crystals may be precipitated in the core layer of the YCDSF3. The observed Raman peaks located at 181, 364, 407, and 520 cm−1 can be attributed to the O-Y-O bending mode, Y-O stretching mode, O-Y-O stretching and O-Si-O bending modes, and Si-O-Y bending mode [31], respectively. The Raman peaks observed at 915 and 949 cm−1 are related to strong Si–O stretching modes [32]. In addition, Figure 3c shows the enlarged cross-section of the YCDSF3. A, B, C, and D are the measured positions of Raman on the fiber. The Raman spectra of the YCDSF3 sample at the four positions are shown in Figure 3d. No obvious sharp peak is observed in the cladding layer (such as A and B points), suggesting that the crystallization of crystals is well confined within the fiber core. Therefore, the crystals can be formed in the fiber core of the YCDSF3 by heat treatment of the YCDSF0 at 1350 °C. The exact crystal phase structure will be further analyzed by micro-area X-ray diffraction in the future.
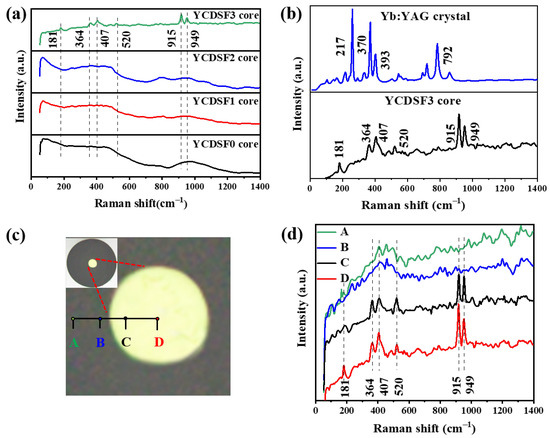
Figure 3.
(a) Raman spectra of the core layer of the YCDSF0 and YCDSF heat-treated at different temperatures. (b) Raman spectra of Yb:YAG crystal and core layer of the YCDSF3. (c) The enlarged image of the YCDSF3 cross-section. A, B, C, and D are the measured positions of Raman spectra on the fiber. Inset is the whole image of the YCDSF3 cross-section. (d) Raman spectra of the YCDSF3 at different positions.
3.2. Excitation and Emission Spectra of the YCDSFs before and after Heat Treatment
To further investigate the effect of heat treatment on the luminous properties in YCDSFs, their excitation and emission spectra were measured, as shown in Figure 4. Due to the strong crystal field of YAG, the excitation and emission spectra in the Yb:YAG crystal dominate some narrow-sharp peaks in Figure 4a, which are mainly located at 917, 940, 980, and 1030 nm, respectively. For YCDSF0, though the excitation peaks remain located at 917, 940, and 977 nm, a broadband emission peak at 1017 nm was observed in Figure 4b. This broad peak can be ascribed to the characteristic electronic transition of Yb3+ ions. Compared with the luminous properties of Yb3+ ions in the YAG crystal and YCDSF0, the emission peaks depend on the local environments around Yb3+ ions.
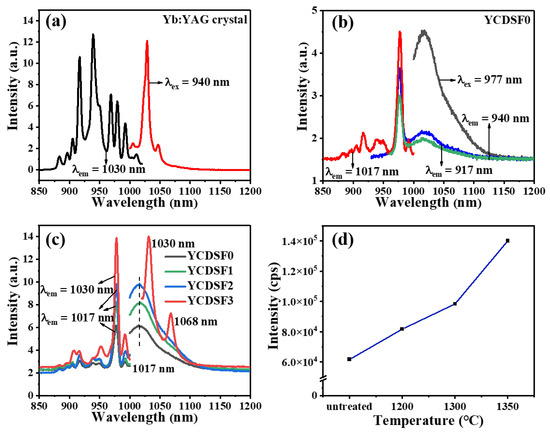
Figure 4.
Excitation and emission spectra of the (a) Yb: YAG crystal, (b) YCDSF0, and (c) YCDSF heat treated at different temperatures. (d) Emission intensity at different heat-treated temperatures.
Different from YCDSF0, the excitation and emission spectra of YCDSF3 have obviously changed, as shown in Figure 4c. In particular, the emission wavelength is transferred from 1017 to 1030 nm, and the emission peaks are clearly sharpened. Combining these results with the Raman spectra of the YCDSF3 core, the Yb3+ ions may enter the crystal lattices of Y2Si2O7 [30]. Owing to the charge match and similar ionic radius of Yb ions and Y ions, Yb ions may easily replace Y ions and precipitate crystals during the heat-treated process, leading to obvious changes in emission spectra. In addition, the luminescence intensity of the YCDSFs increased significantly with increasing heat-treated temperature, as shown in Figure 4d. Importantly, the luminescence of the sample heat-treated at 1350 °C can reach ~2.27 times compared with the YCDSF0. As a result, heat treatment is a powerful means to solve the difficulty of realizing highly efficient emissions in YAG crystal-derived silica fibers.
3.3. Fluorescence Lifetime of the Yb3+ Ions in the YCDSFs before and after Heat Treatment
Figure 5a revealed the fluorescence lifetime of the Yb3+ ions as a function of the heat-treatment temperature. These decay curves fit a single exponential function. The fluorescence lifetime of the Yb ions increased from 129 to 460 µs in YCDSF0 and YCDSF2. While the decay curves in YCDSF3 do not fit a single exponential function, then a double exponential function can be fitted, as shown in Figure 5b. Additionally, its fitted averaged fluorescence lifetime is 621 µs by Equations (1)–(5), which is longer than other samples. To analyze this reason clearly, the fluorescence lifetime of Yb ions in the Yb: YAG crystal and YCDSF0 were also assessed and found to be 1025 and 129 µs, respectively. This is due to the different local environments around the Yb ions in the YAG crystal field and fibers [33]. Here, the fast decay lifetime τ1 (272 µs, w1: 10%) of Yb3+ ions in YCDSF3 may be attributed to the electronic transition of Yb ions in yttrium aluminosilicate glass materials after heat treatment. The slow decay lifetime τ2 (912 µs, w2: 90%) may be the electronic transition lifetime of Yb ions in the Y2Si2O7 crystal. Usually, the variability of the fluorescence lifetime is related to the microlocal environment [34,35], which can act as a probe for the local structure and play an important role in multiphoton relaxation. This result indicates that the heat treatment changed the local structure of the Yb ions. Due to the relatively small phonon energy of the crystal lattice, the multiphoton nonradiative relaxation probability is suppressed; thus, the decay lifetime of Yb ions in YCDSF3 shows a notable extension after heat treatment. Combined with the excitation and emission spectra of the Yb:YAG crystals and YCDSF3, these results also indicate that Yb3+ ions exist both in the glass network and in the precipitated crystals. Therefore, the luminescence properties of crystal-derived fibers are greatly enhanced by the heat treatment method.
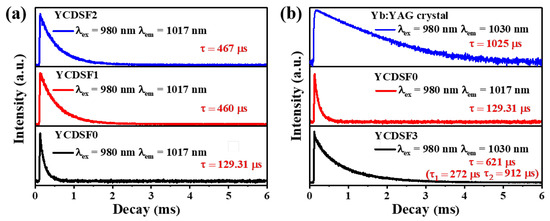
Figure 5.
Fluorescence decay curves of (a) YCDSF0, YCDSF1 and YCDSF2, (b) Yb:YAG crystal, YCDSF0 and YCDSF3.
3.4. Schematic Diagram of the Local Structure of the Yb Ions
For the Yb:YAG crystal, some sharp Raman peaks were obviously observed, as the blue curve shows in Figure 3b. These sharp Raman peaks disappeared, and several intense broad bands were observed after the fiber drawing process, indicating that there was an amorphous state in the YCDSF0 core, as the black curve shows in Figure 3a. Then, after heat treatment at 1350 °C, new sharp peaks appeared, and they were obviously different from the Yb: YAG crystal, as the black curve shows in Figure 3b. At the same time, the lifetime of Yb ions in the YCDSF0 was lower than that of the Yb:YAG crystal. Then, the lifetime of Yb ions in YCDSF3 becomes longer after heat treatment, as the black curve shows in Figure 5b. According to the above discussion, heat treatment has changed the local structure of the Yb ions. A schematic diagram of the local structure of the Yb ions was established, as shown in Figure 6. In the Yb:YAG crystal, Yb3+ ions were incorporated into the crystalline phase and occupied the Y3+ ions sites in the octahedral, as shown in Figure 6a. However, owing to the high-temperature fiber drawing process, silica from the cladding was dissolved into the YAG melt, forming an amorphous phase, leading to the broadband emission peak at 1017 nm and Raman peaks, as shown in Figure 6b. Heat treatment at an appropriate temperature leads to the rearrangement of the ionic bond and the formation of the Y2Si2O7 crystals [36], as presented in Figure 6c. The combination of the two local environments around Yb ions resulted in improvements in the spectral properties of Yb ions. Therefore, heat treatment is a powerful method to improve the emission performance of similar crystal-derived silica fibers.
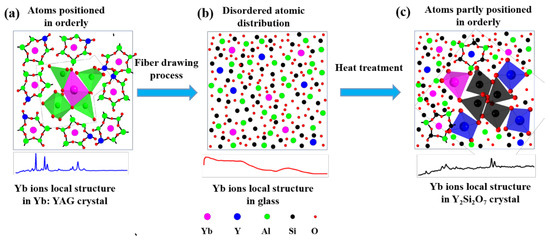
Figure 6.
Schematic illustration of the local environments around Yb ions in (a) Yb: YAG crystal, (b) glass, and (c) Y2Si2O7 crystal.
4. Conclusions
In conclusion, we fabricated the YCDSF using the melt-in-tube method combined with the CO2 laser-heated drawing technique, and its optical characteristics were investigated before and after the heat treatment. The emission intensity and the fluorescence lifetime were further increased at 1030 nm. The results showed that the heat treatment method could improve the emission intensity and fluorescence lifetime of Yb ions in the YCDSFs. In addition, after the YCDSF was heat-treated at 1350 °C, a new phase was found by the sharp Raman peaks appearing in the fiber core, indicating that the local structure around the Yb3+ ions changed. These results sufficiently illustrate that the newly formed phase enhances its optical performance. Next, we will further optimize the heat treatment parameters to fabricate YCDSFs with superior performances and decrease the loss of the YCDSF, then apply them to optical amplifiers, light sources, fiber lasers, etc.
Author Contributions
K.Z. carried out the experiments and conducted the analysis. J.W. conceived the presented idea and oversaw the direction and planning. Y.W. (Ying Wan) and Y.W. (Yan Wu) assisted in the sample preparation and performing the experiments, F.P. provided critical feedback during the research, and T.W. supervised the overall project. All authors have read and agreed to the published version of the manuscript.
Funding
This work was supported by the National Key Research and Development Program of China (2020YFB1805800); the National Natural Science Foundation of China (61975113, 61935002, 61675125, 61635006); 111 Project (D20031); and the Shanghai professional technical public service platform of advanced optical waveguide intelligent manufacturing and testing (19DZ2294000).
Institutional Review Board Statement
Not applicable.
Informed Consent Statement
Not applicable.
Data Availability Statement
Data underlying the results presented in this paper are not publicly available at this time but may be obtained from the authors upon reasonable request.
Conflicts of Interest
The authors declare no conflict of interest.
References
- Buikema, A.; Jose, F.; Augst, S.J.; Fritschel, P.; Mavalvala, N. Narrow-linewidth fiber amplifier for gravitational-wave detectors. Opt. Lett. 2019, 44, 3833–3836. [Google Scholar] [CrossRef] [PubMed]
- Li, Y.B.; Jiang, M.Y.; Xue, Z.L.; Zeng, S.J. 808 nm light triggered lanthanide nanoprobes with enhanced down-shifting emission beyond 1500 nm for imaging-guided resection surgery of tumor and vascular visualization. Theranostics 2020, 10, 6875–6885. [Google Scholar] [CrossRef]
- Nurnberg, J.; Willenberg, B.J.; Phillips, C.R.; Keller, U. Dual-comb ranging with frequency combs from single cavity free-running laser oscillators. Opt. Express 2021, 29, 24910–24918. [Google Scholar] [CrossRef]
- Philippov, V.; Codemard, C.; Jeong, Y.; Alegria, C.; Sahu, J.K.; Nilsson, J. High-energy in-fiber pulse amplification for coherent lidar applications. Opt. Lett. 2004, 29, 2590–2592. [Google Scholar] [CrossRef] [PubMed]
- Wang, J.H.; Chen, G.; Zhang, L.; Hu, J.M.; Li, J.Y.; He, B.; Chen, J.B.; Gu, X.J.; Zhou, J.; Feng, Y. High-efficiency fiber laser at 1018 nm using Yb-doped phosphosilicate fiber. Appl. Opt. 2012, 51, 7130–7133. [Google Scholar] [CrossRef]
- Li, Y.; Peng, K.; Zhan, H.; Liu, S.; Ni, L.; Wang, Y.Y.; Yu, J.; Wang, X.L.; Wang, J.J.; Jing, F.; et al. Yb-doped aluminophosphosilicate ternary fiber with high efficiency and excellent laser stability. Opt. Fiber Technol. 2018, 41, 7–11. [Google Scholar] [CrossRef]
- Wan, Y.; Wen, J.X.; Jiang, C.; Zou, K.; Tang, F.Z.; Pang, F.F.; Wang, T.Y. Over 100 mW stable low-noise single-frequency ring-cavity fiber laser based on a saturable absorber of Bi/Er/Yb co-doped silica fiber. J. Lightwave Technol. 2022, 40, 805–812. [Google Scholar] [CrossRef]
- Gomes, L.; Denaldi, R.L.; Moraes, R.D.; Baldochi, S.L. The luminescence parameters of Yb3+: Er3+-doped LiLa(WO4)2 single crystal grown in the form of fiber for up-conversion green emission. J. Lumin. 2017, 187, 479–485. [Google Scholar] [CrossRef]
- Ueda, J.; Tanabe, S. Visible to near infrared conversion in Ce3+-Yb3+ co-doped YAG ceramics. J. Appl. Phys. 2009, 106, 043101. [Google Scholar] [CrossRef]
- Lafouti, M.; Latifi, H.; Fathi, H.; Ebrahimzadeh, S.; Sarikhani, S.; Sarabi, H. Experimental investigation of a high-power 1018 nm fiber laser using a 20/400 μm ytterbium-doped fiber. Appl. Opt. 2019, 58, 729–733. [Google Scholar] [CrossRef]
- Zheng, S.P.; Li, J.; Yu, C.L.; Zhou, Q.L.; Hu, L.L.; Chen, D.P. Preparation and characterizations of Yb:YAG-derived silica fibers drawn by on-line feeding molten core approach. Ceram. Int. 2017, 43, 5837–5841. [Google Scholar] [CrossRef]
- Qian, Q.; Yang, Z.M. Yb3+-doped phosphate glass fiber and 1.06 μm single-frequency fiber laser. Acta Optica Sinica 2010, 30, 1904–1909. [Google Scholar] [CrossRef]
- Fu, S.J.; Shi, W.; Feng, Y.; Zhang, L.; Yang, Z.M.; Xu, S.H.; Zhu, X.S.; Norwood, R.A.; Peyghambarian, N. Review of recent progress on single-frequency fiber lasers. J. Opt. Soc. Am. B 2017, 34, 49–62. [Google Scholar] [CrossRef]
- Wang, N.N.; Wang, X.L.; Hu, X.H.; Zhang, T.; Yuan, H.; Zhang, W.; Li, F.; Wang, Y.S.; Zhao, W. 41.8 W output power, 200 kHz repetition rate ultra-fast laser based on Yb:YAG single crystal fiber (SCF) amplifier. Opt. Laser Technol. 2020, 127, 106202. [Google Scholar] [CrossRef]
- Huang, Y.C.; Lu, Y.K.; Chen, J.C.; Hsu, Y.C.; Huang, Y.M.; Huang, S.L.; Cheng, W.H. Broadband emission from Cr-doped fibers fabricated by drawing tower. Opt. Express 2006, 14, 8492–8497. [Google Scholar] [CrossRef]
- Dragic, D.P.; Ballato, J.; Hawkins, T.; Foy, P. Feasibility study of Yb:YAG-derived silicate fibers with large Yb content as gain media. Opt. Mater. 2012, 34, 1294–1298. [Google Scholar] [CrossRef]
- Jia, M.; Wen, J.X.; Pan, X.P.; Zhang, L.; Yuan, J.; Huang, Y.; Zhang, X.B.; He, L.F.; Pang, F.F.; Wang, T.Y. Flexible scintillation silica fiber with engineered nanocrystals for remote real-time X-ray detection. ACS Appl. Mater. Interfaces 2022, 14, 1362–1372. [Google Scholar] [CrossRef]
- Fang, Z.J.; Zheng, S.P.; Peng, W.C.; Zhang, H.; Ma, Z.J.; Dong, G.P.; Feng, Z.S.; Chen, D.P.; Qiu, J.R. Ni2+ doped glass ceramic fiber fabricated by melt-in-tube method and successive heat treatment. Opt. Express 2015, 23, 28258–28263. [Google Scholar] [CrossRef]
- Fang, Z.J.; Li, Y.; Zhang, F.T.; Ma, Z.J.; Dong, G.P.; Qiu, J.R. Enhanced sunlight excited 1 μm emission in Cr3+–Yb3+ codoped transparent glass-ceramics containing Y3Al5O12 nanocrystals. J. Am. Ceram. Soc. 2014, 98, 1105–1110. [Google Scholar] [CrossRef]
- Ferreira, N.M.; Costa, F.M.; Nogueira, R.N.; Graca, M.P.F. Lithium niobate bulk crystallization promoted by CO2 laser radiation. Appl. Surf. Sci. 2012, 258, 9457–9460. [Google Scholar] [CrossRef]
- Augustyn, E.; Zelechower, M.; Stroz, D.; Chraponski, J. The microstructure of erbium-ytterbium co-doped oxyfluoride glass-ceramic optical fibers. Opt. Mater. 2012, 34, 944–950. [Google Scholar] [CrossRef]
- Kang, S.L.; Fang, Z.J.; Huang, X.J.; Chen, Z.; Yang, D.D.; Xiao, X.R.; Qiu, J.R.; Dong, G.P. Precisely controllable fabrication of Er3+-doped glass ceramic fibers: Novel mid-infrared fiber laser materials. J. Mater. Chem. C 2017, 5, 4549–4556. [Google Scholar] [CrossRef]
- Zhang, Y.; Wang, W.W.; Li, J.; Xiao, X.S.; Ma, Z.J.; Guo, H.T.; Dong, G.P.; Xu, S.H.; Qiu, J.R. Multi-component yttrium aluminosilicate (YAS) fiber prepared by melt-in-tube method for stable single-frequency laser. J. Am. Ceram. Soc. 2019, 102, 2551–2557. [Google Scholar] [CrossRef]
- Xie, Y.Y.; Liu, Z.J.; Cong, Z.H.; Qin, Z.G.; Wang, S.; Jia, Z.X.; Li, C.Z.; Qin, G.S.; Gao, X.B.; Zhang, X.Y. All-fiber-integrated Yb:YAG-derived silica fiber laser generating 6 W output power. Opt. Express 2019, 27, 3791–3798. [Google Scholar] [CrossRef]
- Zhang, X.J.; Ma, Z.Y.; Yuan, Z.Y.; Su, M. Mass-productions of vertically aligned extremely long metallic micro/nanowires using fiber drawing nanomanufacturing. Adv. Mater 2008, 20, 1310–1314. [Google Scholar] [CrossRef]
- Jia, M.; Wen, J.X.; Luo, W.Y.; Dong, Y.H.; Pang, F.F.; Chen, Z.Y.; Peng, G.D.; Wang, T.Y. Improved scintillating properties in Ce: YAG derived silica fiber with the reduction from Ce4+ to Ce3+ ions. J. Lumin 2020, 221, 117063. [Google Scholar] [CrossRef]
- Wan, Y.; Wen, J.X.; Dong, Y.H.; Jiang, C.; Jia, M.; Tang, F.Z.; Chen, N.; Zhao, Z.W.; Huang, S.J.; Pang, F.F.; et al. Exceeding 50% slope efficiency DBR fiber laser based on a Yb-doped crystal-derived silica fiber with high gain per unit length. Opt. Express 2020, 28, 23771–23783. [Google Scholar] [CrossRef]
- Pan, X.P.; Dong, Y.H.; Jia, M.; Wen, J.X.; Su, C.Y.; Shang, Y.N.; Zhang, X.B.; Pang, F.F.; Wang, T.Y. Temperature-induced PbS quantum dots with tunable broadband wavelength grown by atomic layer deposition. Appl. Surf. Sci. 2021, 546, 149086. [Google Scholar] [CrossRef]
- Baranov, A.V.; Bogdanov, K.V.; Ushakova, E.V.; Cherevkov, S.A.; Fedorov, A.V.; Tscharntke, S. Comparative analysis of Raman spectra of PbS macro-and nanocrystals. Opt. Spectrosc. 2010, 109, 268–271. [Google Scholar] [CrossRef]
- Kaindl, R.; Tobbens, D.M.; Kahlenberg, V. DFT-aided interpretation of the Raman spectra of the polymorphic forms of Y2Si2O7. J. Raman Spectrosc. 2011, 42, 78–85. [Google Scholar] [CrossRef]
- Tian, Z.L.; Zheng, L.Y.; Li, Z.J.; Li, J.L.; Wang, J.Y. Exploration of the low thermal conductivities of γ-Y2Si2O7, β-Y2Si2O7, β-Yb2Si2O7, and β-Lu2Si2O7 as novel environmental barrier coating candidates. J. Eur. Ceram. Soc. 2016, 36, 2813–2823. [Google Scholar] [CrossRef]
- Yang, Y.; Sun, W.; Zhang, P.; Zhou, X.F.; Qiu, B.B.; Kong, C.G.; Lu, G.W. Raman spectra study on lattice vibration and thermal conductivity of MMTN and MMTWD crystals. J. Synth. Cryst. 2013, 42, 933–937. [Google Scholar]
- Dong, H.H.; Chen, Y.G.; Jiao, Y.; Zhou, Q.L.; Cheng, Y.; Zhang, H.; Lu, Y.J.; Wang, S.K.; Yu, C.L.; Hu, L.L. Nanocrystalline Yb: YAG-doped silica glass with good transmittance and significant spectral performance enhancements. Nanomaterials 2022, 12, 1263. [Google Scholar] [CrossRef]
- Murata, T.; Mazeno, K.; Morinaga, K. Matrix effect on local structure surrounding Yb3+ and spontaneous emission probability in oxide glasses. Sci. Technol. Adv. Mat. 2002, 3, 85–90. [Google Scholar] [CrossRef]
- Ferreira, J.; Santos, L.F.; Almeida, R.M. Sol–gel-derived Yb:YAG polycrystalline ceramics for laser applications. J. Sol.-Gel. Sci. Technol. 2017, 83, 436–446. [Google Scholar] [CrossRef]
- Mao, Q.N.; Lan, B.J.; Zhou, S.F. Crystallization control in Ni2+-doped glass-ceramics for broadband near-infrared luminesce. J. Am. Ceram. Soc. 2020, 103, 2569–2574. [Google Scholar] [CrossRef]
Publisher’s Note: MDPI stays neutral with regard to jurisdictional claims in published maps and institutional affiliations. |
© 2022 by the authors. Licensee MDPI, Basel, Switzerland. This article is an open access article distributed under the terms and conditions of the Creative Commons Attribution (CC BY) license (https://creativecommons.org/licenses/by/4.0/).