Abstract
Pacemaker cardiomyocytes of the sinoatrial node (SAN) beat more rapidly than cells of the working myocardium. Beating in SAN cells responds to β-adrenergic and cholinergic signaling by speeding up or slowing, respectively. Beat rate has traditionally been assessed using voltage or calcium sensitive dyes, however these may not reflect the true rate of beating because they sequester calcium. Finally, in vitro differentiated cardiomyocytes sometimes briefly pause during imaging giving inaccurate beat rates. We have developed a MATLAB automation to calculate cardiac beat rates directly from video clips based on changes in pixel density at the edges of beating areas. These data are normalized to minimize the effects of secondary movement and are converted to frequency data using a fast Fourier transform (FFT). We find that this gives accurate beat rates even when there are brief pauses in beating. This technique can be used to rapidly assess beating of cardiomyocytes in organoid culture. This technique could also be combined with field scanning techniques to automatically and accurately assess beating within a complex cardiac organoid.
1. Introduction
Enormous strides have been made in our ability to grow donor cardiomyocytes from pluripotent cells, such as human embryonic stem cells and induced pluripotent stem cells. Both human and mouse pluripotent cells can be differentiated into all types of cardiomyocytes, including both immature fetal cardiac cells and more mature cells expressing a full range of cardiac subtypes, including atrial, ventricular and conduction system [1,2,3]. More recently, protocols have been developed that strongly bias cardiomyocyte differentiation toward specific lineages. For example, it is now feasible to make nearly pure populations of highly mature ventricular cardiomyocytes [4] that are capable of restoring ventricular function in non-human primates after infarct [5]. These studies also present new challenges since it is now clear that even a small number of ectopic pacemaker cells can cause arrhythmias after grafting [5]. This is consistent with previous data demonstrating that grafts of pacemaker-like cells to canine hearts can initiate action potentials [6,7,8,9,10,11].
A major challenge in the field of cardiac stem cell biology is the ability to distinguish different cardiomyocyte subtypes either within complex organoid cultures, such as embryoid bodies (EBs), or within a heart following a graft to identify and isolate ectopic pacemaker cells. Realization of the full therapeutic potential of in vitro derived cardiomyocytes will require protocols to differentiate pure subtypes and, in particular, to insure that grafts of cells to the working myocardium do not contain sinoatrial node (SAN) pacemaker cells.
Conversely, sinus node dysfunction is a major source of morbidity and mortality in humans. Loss of sinus node function causes bradycardia and patients with this disease suffer from fatigue, dizziness, chest pain, exercise intolerance and fainting. Severe bradycardia can be fatal. Nearly 3 million people worldwide have electronic pacemakers, and each year 600,000 new pacemakers are implanted. Mechanical pacemakers are effective at alleviating the major symptoms of bradycardia, however they have limitations—they are prone to lead slippage and battery issues that may be fatal. They also affect quality of life because devices such as cell phones, metal detectors and some household appliances affect their function. Given the recent success with the implantation of ventricular cardiomyocytes, it now seems feasible to generate SAN cells in vitro for use as biological pacemakers; however, again, this will require protocols for the efficient differentiation of pure pacemakers from pluripotent sources. Early work in this field suggests that this can be accomplished by the addition of small molecules and growth factors as cells differentiate in vitro [12,13,14,15], however much work remains to be done. One tool that is currently lacking is the ability to rapidly distinguish cardiac subtypes. Currently, this requires dissociating differentiated EBs and performing electrophysiological studies on single cells to identify characteristic currents that are generated by specific channel proteins. Such electrophysiological approaches are time consuming and require specialized equipment and skill to perform them correctly.
An alternative simplified approach entails measuring the beating frequency of cardiomyocyte populations within intact EBs to identify cardiac subtypes. Traditionally, beating frequency has been measured manually by counting contractions per unit of time, either in live cultures or from recorded videos. However, manual analyses are prone to bias and inaccuracies, especially when attempting to measure fast beating cells such as SAN-like cells. Recently, several procedures based on algorithmic analyses of segmented live cell image series have been introduced in an attempt to automate the measurement of beat frequency [16,17]. While these automated approaches introduce improvements over manual measurements, they may fail to accurately represent fast beating cells due to intermittent pauses in contraction that are induced by environmental stresses (e.g., light exposure, rapid changes in temperature, etc.) during imaging or experimental manipulation. To circumvent the issue of pausing and reliably extract fast beating frequencies from time lapse image series, we have created a MATLAB algorithm that transforms time domain data into the frequency domain using a fast Fourier transform (FFT). Subsequent to applying the FFT, our algorithm performs a power spectrum analysis that identifies the dominant beat frequency within a given imaged area, regardless of variations or pauses in contractions. The incorporation of our FFT algorithm into fully automated workflows is expected to provide improvements in the identification of cardiac subtypes in stem cell-derived organoid cultures for the purposes of drug screening and cell type-specific bioengineering applications.
2. Materials and Methods
Murine embryonic stem (ES) cells of the R1 strain expressing the cardiac specific fluorescent reporter, MHCα::GFP [18] were co-cultured with mouse embryonic fibroblasts (MEFs) on gelatin-coated plates and were maintained in ES cell growth medium (DMEM + 10%FBS, supplemented with 0.1 mM non-essential amino acids, 2 mM l-glutamine, 1 mM sodium pyruvate, 10−4 mM β-mercaptoethanol, 1X antibiotics/antimyoctic and 1000 U/mL LIF). Clonal lines were established and were checked to ensure that the MHCα::GFP is expressed in all cardiac cells and only in cardiac cells [19]. For differentiation studies, ES cells were passaged off of MEFs and were differentiated as embryoid bodies (EBs) using the hanging drop method, as previously described [19]. Single EBs, consisting of approximately 300 cells each, were plated in each well of a 48-well plate and were allowed to differentiate for 17–21 days prior to imaging.
Areas with beating cardiomyocytes were identified using the GFP reporter. Epifluorescence and phase-contrast imaging were performed using an Olympus CKX41 inverted microscope that was equipped with a 10× objective. The images were acquired with a Leica DFC365 FX CCD camera at 8-bit depth and 2 × 2 binning using Leica Application Suite (LAS) X software. Calcium imaging was performed using a Fluo-4 Direct Calcium Assay Kit (ThermoFisher Scientific, Waltham, MA, USA).
Regions of Interest (ROIs) from the video clips were manually chosen for the presence of beating and confirmed for cardiomyocyte identity based on expression of the cardiac-specific GFP fluorescent reporter. Changes in mean pixel brightness over time with individual ROIs were analyzed using LAS X software and were converted into an Excel file format for importation into MATLAB (R2017a, MathWorks, Natick, MA, USA). A custom MATLAB code was developed to read time series data from Excel files, to normalize the time series data and to execute a FFT to identify the dominant frequency.
Normalization (adapted from [20]) was carried out using the following equations:
- where F is intensity and t is time. F0, the local minimum intensity, is found by
- where n = 0, 1, 2,… etc.
- whereAnd and
- where n = 0, 1, 2, … etc. and a = max(t)
The parameters τ0, τ1, and τ2 are spacing parameters and can be adjusted for different methods of imaging. The parameter τ0 can be adjusted for different frequency images using the following equation:
where f is the frequency.
After the algorithm identified the maximum peak that was produced by the FFT, the frequency data were output as beats per minute (bpm). Output also included several graphical representations of the algorithmic processes. Each step of the algorithm is annotated in the MATLAB code (Supplemental Materials, Reno_FFT_bpm.m).
3. Results and Discussion
Cardiomyocytes that are differentiated from pluripotent cells are a promising source of cells for cardiac regenerative medicine. However, it has long been known that EB-derived cardiac cells express a full range of cardiac phenotypes. The most recent work suggests that fully differentiated and subtype-pure populations of cardiac cells are best for grafting into damaged ventricular myocardium [4,5]. One concern with this approach is that if cells of the wrong electrophysiological characteristics are present in a graft, then it will cause arrhythmias. Therefore, it is important to develop techniques to rapidly identify cardiac phenotypes. Definitive identification of cardiac phenotype is based on single-cell patch clamp studies, however several other techniques, including beat rate, can be used for the provisional identification of various cardiac phenotypes. Beat rate can be assessed by loading cells with fluorescent dyes which change brightness according to changes in calcium concentration or voltage, however these techniques may not represent true beat rate since they also sequester calcium and other ions that are necessary for beating to occur. Similarly, beat rate can be determined by hand counting the number of beats per unit of time and converting this into beats per minute (bpm). This method is time consuming and prone to human error, particularly for fast beating cardiac cells, such as SAN cells [15]. In addition, cardiac cells may pause during imaging, which could be triggered by changes in temperature, changes in light intensity, interference from other beating areas in the dish, or experimental manipulation.
Beat rate can also be discerned directly from video clips and we hypothesized that this process could be semi-automated since pixel density should change as cells contract during beating. We hypothesized that by measuring the changes in pixel brightness at the edge of beating areas, we could accurately determine how fast an area is beating. Such a technique would not only eliminate human error, however when combined with fast Fourier transform (FFT) analysis, it should be able to accurately calculate beat rate even when cells briefly pause during imaging.
To test this, EBs possessing a reporter construct in which the cardiac specific promoter for myosin heavy chain drove the expression of green fluorescent protein (GFP) (MHCα::GFP) [18]. These ES cells were differentiated as EB organoids with one EB placed in each well of a 48-well plate. At 21 days, all of the EBs possessed significant beating areas expressing GFP. We noted that many EBs had both a main beating area consisting of many cardiomyocytes and also smaller beating areas consisting of either single cardiac cells or small clusters of cells.
Video recordings were made of these beating areas under phase-contrast lighting to highlight the edges of the beating areas (Figure 1A; Video S1). In phase contrast microscopy, structures with different optical densities differentially diffract light, thus providing contrast [21]. As cardiomyocytes contract, areas of contrast move, therefore contractions events can be recorded as fluctuations in mean pixel intensity within a defined region of interest (ROI) over time (Figure 1B).
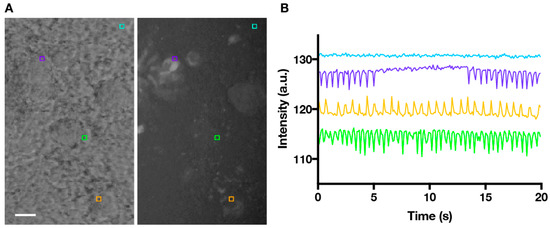
Figure 1.
Time-lapse series of beating cardiomyocytes with ROIs (region of interest) placed to extract motion. (A) Phase-contrast image of beating areas within an EB (embryoid bodies), and corresponding MHCα::GFP image confirming cardiomyocyte identity. ROIs (5 × 5 pixels) are placed at the edges of the beating areas (purple, green and orange squares) and a non-beating control area (cyan square). Scale bare = 100 µm; (B) Plot showing changes in the mean pixel intensities within ROIs over time, which correspond to beating motion.
To extract beating frequency data from phase-contrast recordings, we identified ROIs at the edges of the beating areas (where contrast in pixel brightness was the greatest) to generate intensity versus time plots. The time series data were then run through a MATLAB algorithm to extract accurate beating frequencies. Time domain data were first normalized (see Materials and Methods) using a weighted moving average to account for movements of the sample—which appear as larger amplitude, longer wavelength shifts in the data—that were not related to local beating.
For phase-contrast time lapse recordings of cardiomyocyte contractions, we found imaging at 10 Hz (τ0 = 0.1) satisfied the Nyquist sampling criteria to detect fast, SAN-like beating (<300 bpm at room temperature), with values of τ1 = 0.75 and τ2 = 2 found empirically to be optimal. However, the algorithm can easily be adapted for other time parameters and, therefore, is not limited to use with a single sampling frequency, time length, or type of imaging. Figure 2 shows how the normalization process eliminates low frequency noise from the data.
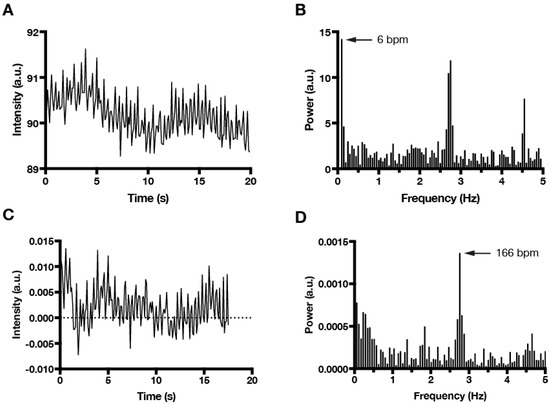
Figure 2.
Normalization of time series data and FFT (fast Fourier transform) power spectrum analysis to beating frequency. (A) Raw time series data showing high frequency changes in mean intensity combined with slow, sinusoidal changes due to secondary motion imaging artifact. (B) FFT plot of the raw time series data attributes dominant beating frequency (6 bpm) to motion caused by imaging artifact. (C) Normalization of time series data eliminates changes due to secondary imaging artifacts. (D) FFT plot of normalized time series data correctly identifies fast beating (166 bpm) as the dominant frequency.
Once the data had been normalized, the algorithm extracted the dominant beating frequency from the time domain data using a fast Fourier transform (FFT). In theory, a filter could have been used to extract only one frequency from the normalized data. However, filters work best when expected values fall within a relatively small range [22]. Cardiomyocytes in EB culture displayed a wide range of beating frequencies, thus a simple filter was not appropriate [23]. The Fourier transform treats the raw signal like a sum of many sinusoids and generates a value that is representative of the energy of each individual frequency within the signal. Fourier transform is therefore ideal to determine which frequency is the most prominent within a signal that is relatively complex [24]. Our MATLAB automation used FFT to generate a graph of the frequencies of the sinusoidal waves in the power spectrum in order to identify the dominant frequency within the signal (Figure 2).
Often times, imaging or experimental conditions cause cardiomyocyte contraction to pause (Figure 3A). Whereas manual averaging of contractions over time will frequently underestimate the actual beating frequency, FFT provides a robust method to extract the dominant beating frequency, even when the signal contains intermittent pauses (Figure 3B). This feature underscores the utility of incorporating FFT analysis into the workflow of any automated procedure that is designed to detect and quantify cardiomyocyte contraction.
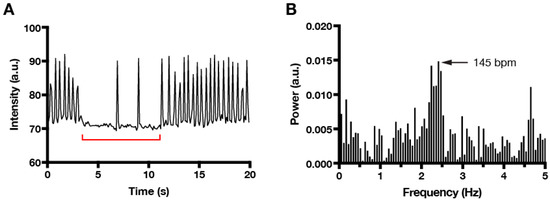
Figure 3.
FFT analysis correctly identifies dominant frequencies despite pauses in beating. (A) Time series plot showing intermittent pauses (red bracket) in fast beating. (B) FFT plot reveals a single dominant beating frequency (145 bpm) that is approximately double the value calculated manually by averaging the number of spikes over time (~84 bpm).
Finally, as mentioned above, the application of FFT analysis using our MATLAB algorithm is not limited to imaging that is performed with phase-contrast microscopy. For example, we were able to compare calcium transients (Video S2) with cardiomyocyte contractions in EB cultures (Figure 4). We anticipate that our FFT algorithm will also prove useful for correlating mechanical contraction activity with other dye-based imaging modalities, such as voltage-sensitive dyes.
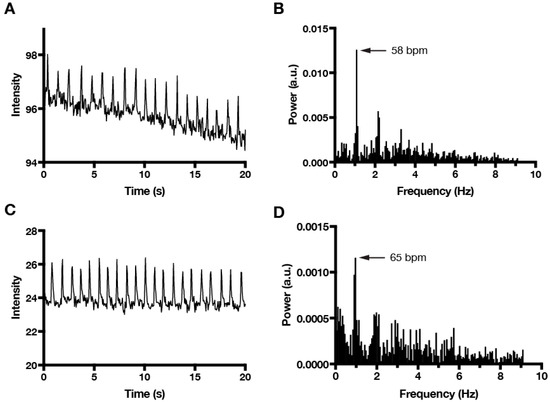
Figure 4.
Comparison of cardiomyocyte contraction and calcium transients using FFT analysis. (A) Time series plot of cardiomyocyte contractions measured by phase-contrast intensity fluctuations and (B) corresponding FFT plot that identifies the dominant beating frequency (58 bpm). (C) Time series plot of cardiomyocyte calcium transients that were measured by Fluo-4 fluorescence intensity fluctuations in the same beating area as (A). Video S2 shows Fluo-4 imaging with the ROI (green square) used to measure intensity fluctuations. (D) FFT plot of Fluo-4 data identifies a dominant beating frequency (65 bpm) based on calcium transients that is similar to the contraction frequency that is based on phase-contrast imaging. Sampling frequency was 18 Hz for both imaging modalities.
Supplementary Materials
The following are available online at http://www.mdpi.com/2304-6732/5/4/39/s1, Video S1: Phase contrast time lapse series of beating cardiomyocytes with ROIs placed to extract motion; Video S2: Fluo-4 time-lapse series of calcium transients in beating cardiomyocytes; MATLAB code for FFT analysis: Reno_FFT_bpm.m.
Author Contributions
Conceptualization, A.C.F. and A.W.H.; methodology, A.R.; software, A.R., A.W.H., Y.L. and T.Y.; validation, A.R. and A.W.H.; formal analysis, A.W.H. and T.Y.; data curation, A.C.F.; writing—original draft preparation, A.R. and A.W.H.; writing—review and editing, A.W.H. and A.C.F.; visualization, A.W.H.; supervision, A.C.F. and A.W.H.; project administration, A.C.F.; funding acquisition, A.C.F.
Funding
This research was funded by the American Heart Association (AHA-14GRNT20380403) and the National Institute of General Medicine of the National Institutes of Health (P20GM103444).
Acknowledgments
We thank Brent Harwell, Erin Schnell and Gage Galbreith for technical assistance with this paper. We thank Jeffrey Anker for useful commentary on this project and Naren Vayavahare, Roger Markwald and Tom Borg for feedback about this work.
Conflicts of Interest
The authors declare no conflict of interest.
References
- He, J.Q.; Ma, Y.; Lee, Y.; Thomson, J.A.; Kamp, T.J. Human embryonic stem cells develop into multiple types of cardiac myocytes: Action potential characterization. Circ. Res. 2003, 93, 32–39. [Google Scholar] [CrossRef] [PubMed]
- Maltsev, V.A.; Wobus, A.M.; Rohwedel, J.; Bader, M.; Hescheler, J. Cardiomyocytes differentiated in vitro from embryonic stem cells developmentally express cardiac-specific genes and ionic currents. Circ. Res. 1994, 75, 233–244. [Google Scholar] [CrossRef] [PubMed]
- Wobus, A.M.; Kaomei, G.; Shan, J.; Wellner, M.C.; Rohwedel, J.; Ji, G.; Fleischmann, B.; Katus, H.A.; Hescheler, J.; Franz, W.M. Retinoic acid accelerates embryonic stem cell-derived cardiac differentiation and enhances development of ventricular cardiomyocytes. J. Mol. Cell. Cardiol. 1997, 29, 1525–1539. [Google Scholar] [CrossRef] [PubMed]
- Ronaldson-Bouchard, K.; Ma, S.P.; Yeager, K.; Chen, T.; Song, L.; Sirabella, D.; Morikawa, K.; Teles, D.; Yazawa, M.; Vunjak-Novakovic, G. Advanced maturation of human cardiac tissue grown from pluripotent stem cells. Nature 2018, 556, 239–243. [Google Scholar] [CrossRef] [PubMed]
- Liu, Y.W.; Chen, B.; Yang, X.; Fugate, J.A.; Kalucki, F.A.; Futakuchi-Tsuchida, A.; Couture, L.; Vogel, K.W.; Astley, C.A.; Baldessari, A.; et al. Human embryonic stem cell-derived cardiomyocytes restore function in infarcted hearts of non-human primates. Nat. Biotechnol. 2018, 36, 597–605. [Google Scholar] [CrossRef] [PubMed]
- Koh, G.Y.; Soonpaa, M.H.; Klug, M.G.; Pride, H.P.; Cooper, B.J.; Zipes, D.P.; Field, L.J. Stable fetal cardiomyocyte grafts in the hearts of dystrophic mice and dogs. J. Clin. Investig. 1995, 96, 2034–2042. [Google Scholar] [CrossRef] [PubMed]
- Qu, J.; Plotnikov, A.N.; Danilo, P., Jr.; Shlapakova, I.; Cohen, I.S.; Robinson, R.B.; Rosen, M.R. Expression and function of a biological pacemaker in canine heart. Circulation 2003, 107, 1106–1109. [Google Scholar] [CrossRef] [PubMed]
- Plotnikov, A.N.; Sosunov, E.A.; Qu, J.; Shlapakova, I.N.; Anyukhovsky, E.P.; Liu, L.; Janse, M.J.; Brink, P.R.; Cohen, I.S.; Robinson, R.B.; et al. Biological pacemaker implanted in canine left bundle branch provides ventricular escape rhythms that have physiologically acceptable rates. Circulation 2004, 109, 506–512. [Google Scholar] [CrossRef] [PubMed]
- Bucchi, A.; Plotnikov, A.N.; Shlapakova, I.; Danilo, P., Jr.; Kryukova, Y.; Qu, J.; Lu, Z.; Liu, H.; Pan, Z.; Potapova, I.; et al. Wild-type and mutant HCN channels in a tandem biological-electronic cardiac pacemaker. Circulation 2006, 114, 992–999. [Google Scholar] [CrossRef] [PubMed]
- Plotnikov, A.N.; Shlapakova, I.; Szabolcs, M.J.; Danilo, P., Jr.; Lorell, B.H.; Potapova, I.A.; Lu, Z.; Rosen, A.B.; Mathias, R.T.; Brink, P.R.; et al. Xenografted adult human mesenchymal stem cells provide a platform for sustained biological pacemaker function in canine heart. Circulation 2007, 116, 706–713. [Google Scholar] [CrossRef] [PubMed]
- Shlapakova, I.N.; Nearing, B.D.; Lau, D.H.; Boink, G.J.; Danilo, P., Jr.; Kryukova, Y.; Robinson, R.B.; Cohen, I.S.; Rosen, M.R.; Verrier, R.L. Biological pacemakers in canines exhibit positive chronotropic response to emotional arousal. Heart Rhythm 2010, 7, 1835–1840. [Google Scholar] [CrossRef] [PubMed]
- Protze, S.I.; Liu, J.; Nussinovitch, U.; Ohana, L.; Backx, P.H.; Gepstein, L.; Keller, G.M. Sinoatrial node cardiomyocytes derived from human pluripotent cells function as a biological pacemaker. Nat. Biotechnol. 2017, 35, 56–68. [Google Scholar] [CrossRef] [PubMed]
- Rentschler, S.; Zander, J.; Meyers, K.; France, D.; Levine, R.; Porter, G.; Rivkees, S.A.; Morley, G.E.; Fishman, G.I. Neuregulin-1 promotes formation of the murine cardiac conduction system. Proc. Natl. Acad. Sci. USA 2002, 99, 10464–10469. [Google Scholar] [CrossRef] [PubMed]
- Wiese, C.; Nikolova, T.; Zahanich, I.; Sulzbacher, S.; Fuchs, J.; Yamanaka, S.; Graf, E.; Ravens, U.; Boheler, K.R.; Wobus, A.M. Differentiation induction of mouse embryonic stem cells into sinus node-like cells by suramin. Int. J. Cardiol. 2011, 147, 95–111. [Google Scholar] [CrossRef] [PubMed]
- Brown, K.; Legros, S.; Ortega, F.A.; Dai, Y.; Doss, M.X.; Christini, D.J.; Robinson, R.B.; Foley, A.C. Overexpression of Map3k7 activates sinoatrial node-like differentiation in mouse ES-derived cardiomyocytes. PLoS ONE 2017, 12, e0189818. [Google Scholar] [CrossRef] [PubMed]
- Devarasetty, M.; Forsythe, S.; Shupe, T.D.; Soker, S.; Bishop, C.E.; Atala, A.; Skardal, A. Optical Tracking and Digital Quantification of Beating Behavior in Bioengineered Human Cardiac Organoids. Biosensors 2017, 7. [Google Scholar] [CrossRef] [PubMed]
- Maddah, M.; Heidmann, J.D.; Mandegar, M.A.; Walker, C.D.; Bolouki, S.; Conklin, B.R.; Loewke, K.E. A non-invasive platform for functional characterization of stem-cell-derived cardiomyocytes with applications in cardiotoxicity testing. Stem Cell Rep. 2015, 4, 621–631. [Google Scholar] [CrossRef] [PubMed]
- Takahashi, T.; Lord, B.; Schulze, P.C.; Fryer, R.M.; Sarang, S.S.; Gullans, S.R.; Lee, R.T. Ascorbic acid enhances differentiation of embryonic stem cells into cardiac myocytes. Circulation 2003, 107, 1912–1916. [Google Scholar] [CrossRef] [PubMed]
- Brown, K.; Legros, S.; Artus, J.; Doss, M.X.; Khanin, R.; Hadjantonakis, A.K.; Foley, A. A comparative analysis of extra-embryonic endoderm cell lines. PLoS ONE 2010, 5, e12016. [Google Scholar] [CrossRef] [PubMed]
- Jia, H.; Rochefort, N.L.; Chen, X.; Konnerth, A. In vivo two-photon imaging of sensory-evoked dendritic calcium signals in cortical neurons. Nat. Protoc. 2011, 6, 28–35. [Google Scholar] [CrossRef] [PubMed]
- Spencer, M. (Ed.) Fundamentals of Light Microscopy; Cambridge University Press: Cambridge, UK, 1982; Volume 6, p. 3. [Google Scholar]
- Nussbaumer, H.J. Fast Fourier Transform and Convolution Algorithms; Springer: Berlin/Heidelberg, Germany, 1982; Volume 2. [Google Scholar]
- Allessie, M.A.; Boyden, P.A.; Camm, A.J.; Kleber, A.G.; Lab, M.J.; Legato, M.J.; Rosen, M.R.; Schwartz, P.J.; Spooner, P.M.; Van Wagoner, D.R.; et al. Pathophysiology and prevention of atrial fibrillation. Circulation 2001, 103, 769–777. [Google Scholar] [CrossRef] [PubMed]
- Bracewell, R.N.; Bracewell, R. The Fourier Transform and Its Applications; McGraw Hill: New York, NY, USA, 2000. [Google Scholar]


© 2018 by the authors. Licensee MDPI, Basel, Switzerland. This article is an open access article distributed under the terms and conditions of the Creative Commons Attribution (CC BY) license (http://creativecommons.org/licenses/by/4.0/).