Abstract
With the increasingly complex space environment, the operational safety of spacecraft faces severe challenges, creating an urgent need to develop efficient and reliable space target detection and identification technologies. Traditional optical detection equipment faces significant challenges in space target detection and identification due to the low signal-to-noise ratio of space targets. To address the limited field of view (FOV) of traditional spectrometers, this paper proposes an improved wide-FOV infrared slitless spectrometer system based on the Dyson spectrometer. The system consists of three main components: a front telescope system, a spectral dispersion system, and a relay lens system. The front telescope system adopts a Ritchey–Chrétien structure and incorporates a correction lens group to enhance imaging quality. To overcome the practical challenges of conventional Dyson spectrometers—such as the high difficulty and cost in manufacturing and aligning concave gratings—an improved Dyson spectrometer based on a planar blazed grating is designed. A collimating lens group is incorporated to reduce spectral line curvature and chromatic aberration while ensuring a linear spectral dispersion relationship, achieving “spectrum-value unification” in the system. Additionally, a secondary imaging relay lens system is designed to ensure 100% cold stop matching efficiency, thereby minimizing stray light interference. Through optimization and ray tracing using optical design software, the final system achieves a field of view of 0.69° × 0.55°, a spectral resolution of 8.41 nm/pixel, spectral line curvature and chromatic aberration both below 10 µm, and a nearly linear spectral dispersion relationship, realizing spectrum-value unification to facilitate target identification. This infrared slitless spectrometer can stably acquire the spectral characteristics of space targets without requiring high-precision theodolites, providing a novel technical solution for the identification of dynamic space targets. It holds broad application prospects in space surveillance and related fields.
1. Introduction
With the rapid increase in the number of space objects, the effective detection and identification of space targets have become crucial for ensuring spacecraft operational safety and national defense security [1]. Consequently, enhancing space target detection and identification capabilities has emerged as a critical challenge in the global aerospace domain [2,3].
However, due to their considerable distance or small size, space targets typically appear as point sources in traditional optical systems, making it difficult to obtain clear geometric features and thus limiting efficient detection and precise identification [4]. Infrared spectral detection, by capturing the target’s intrinsic radiation, enables full-orbit and all-day observation without relying on reflected light. The acquired infrared spectral characteristics can be used to retrieve temperature distribution, emissivity, surface material composition, and proportions, providing an effective means for target identification [5,6,7,8].
In dynamic space environments, traditional slit spectrometers suffer from a narrow field of view (FOV) and require high-precision pointing control to track fast-moving point targets. In contrast, slitless spectrometers eliminate the need for slit alignment, reducing dependence on theodolite tracking accuracy while offering a wide FOV and rapid response, making them more suitable for dynamic target detection. Although this technology may face challenges such as background light interference and spectral overlap [9], these effects can be mitigated by adopting a “low-looking-high” strategy and controlling spectral line curvature and chromatic aberration, demonstrating its unique advantages in detecting and identifying dynamic space point targets.
Initially, slitless spectroscopy was primarily used in ground-based telescopes for quasar detection. In the 1970s, P.S. Osmer et al. [10] attached a thin objective prism to a 60 cm Schmidt telescope at the Pan-American Observatory in Chile, achieving low-cost, high-efficiency quasar spectral screening. However, ground-based systems are susceptible to atmospheric interference and suffer from severe spectral overlap in dense celestial regions, limiting their applications. With the successful deployment of the Near Infrared Camera and Multi-Object Spectrometer (NICMOS) [11,12] on the Hubble Space Telescope (HST) in 1997 for galaxy evolution studies, slitless spectroscopy demonstrated significant advantages in space-based astronomical observations. Subsequently, the James Webb Space Telescope (JWST) incorporated this technology as a core observational capability, equipping instruments such as the NIRISS and NIRCam [13,14,15,16]. In recent years, missions like Euclid, the Chinese Space Station Telescope (CSST), and the Nancy Grace Roman Space Telescope (Roman) have adopted slitless spectroscopic designs [17,18,19]. Additionally, in solar physics research, the Multi-Order Solar Extreme Ultraviolet Spectrograph (MOSES) significantly improved spatial and spectral information separation efficiency through its slitless design [20,21,22]. This technology is gradually expanding from ground-based astronomy to space science, showcasing broad application prospects.
However, whether in space survey telescopes or solar observation instruments like the MOSES, the observed targets are mostly quasi-stationary celestial objects, making direct application to fast-moving space point targets in Earth orbit challenging. Dynamic target observation requires special consideration of image motion effects, integration time optimization, and tracking accuracy. Furthermore, traditional systems are often bulky, costly, and difficult to adapt to the miniaturization, lightweight, and low-cost requirements of space-based platforms. Their limited FOV also restricts wide-area spatial coverage.
To address these challenges, this study designs a space-based infrared slitless spectrometer system for dynamic space point targets comprising three main subsystems: a front telescope system, a spectral dispersion system, and a relay lens system. The front telescope system employs a Ritchey–Chrétien configuration combined with a correction lens group to enhance imaging quality. The spectral dispersion system improves upon the Dyson concentric structure by replacing the concave grating with a planar blazed grating, significantly reducing the manufacturing complexity and cost. To ensure accurate radiometric calibration, a collimating lens group is designed to suppress spectral line curvature and chromatic aberration. The relay lens system achieves 100% cold stop matching, substantially improving stray light suppression.
Current mainstream space target detection methods include ground-based telescopes, space-based visible-light imaging systems, and space-based radar. Ground-based systems are limited by atmospheric turbulence, weather conditions, and geographical coverage, preventing global continuous observation. Space-based visible-light devices offer high resolutions but rely on solar illumination, making all-weather operation difficult, while weak distant targets are prone to background light interference. Space-based radar provides all-weather capability but suffers from system complexity, high cost, and power consumption.
In contrast, the proposed space-based infrared slitless spectrometer system offers multiple advantages; infrared observation relies on self-emission, enabling all-day long-distance detection; slitless spectroscopy overcomes the narrow FOV limitation of traditional spectrometers and reduces theodolite precision requirements, facilitating dynamic target tracking; and the system is compact, lightweight, and cost-effective, being suitable for multi-satellite deployment in space surveillance networks to achieve global, continuous detection and identification of space targets.
In summary, this system effectively addresses existing technological gaps in target detection capability, information acquisition, engineering feasibility, and networked deployment, demonstrating significant potential for practical applications.
2. Optical System Parameter Design
The slitless spectrometer system is proposed to be deployed in near-Earth orbit at an altitude of 500 km, and it is mainly aimed at detecting and recognizing artificial satellites in the orbit altitude of 500~650 km and observation angles of 0~50°. According to the literature [23], the surface temperature of LEO satellites is generally higher than 300 K. Based on this, the main performance index of the system is determined as follows. Under the condition of a 233 km slant distance (corresponding to the target at a 650 km orbital altitude), the system is able to effectively identify the typical satellite target with an equivalent diameter of 1 m and a temperature of 300 K. The system is also capable of detecting and identifying satellites with an equivalent diameter of 1 m and a temperature of 300 K.
The spectral smile and keystone are important spectrometer metrics that have a significant impact on subsequent radiometric accuracy. According to the criteria given by Robert O. Green [24], when the relative deviation of the spectral signal is <5%, the effect of the deviation on the system is negligible. When the spectral smile and keystone do not exceed half of the image element, the above standard can be achieved. Pengkai Dong, a student of our group, performed radiometric thermometry calibration of a blackbody using a simple slitless spectrometer and found that the radiometric thermometry accuracy was highest when the system was combined with six image elements at a higher signal-to-noise ratio and eight image elements at a lower signal-to-noise ratio [25]. Since the image merging will be performed in the subsequent data processing, the system relaxes the tolerance of the spectral smile and keystone to one pixel size. The spectral resolution design index of the system was better than 10 nm/pixel, and the working spectral band was .
In addition, the slitless spectrometer has a significant advantage in field-of-view coverage compared with the slit spectrometer. Therefore, under the premise of meeting the design index, this paper should expand the system’s field of view as much as possible.
2.1. Determination of Aperture
The source of infrared radiation from a low-orbiting space target consists of four main components: the target’s own radiation, the direct radiation from the Sun, the direct radiation from the Earth, and the reflection of solar radiation from the Earth’s surface. In order to achieve detection of a target throughout its orbit, the system must ensure that detection is achieved even when the target’s radiant energy is at its lowest (i.e., in the Earth’s shadow region). In this case, the target’s infrared radiation consists only of its own thermal radiation and reflections of the Earth’s infrared radiation.
Slitless infrared spectrometers have significant advantages when operating in the space environment. Firstly, the extremely low background radiation makes the system noise mainly come from the detector itself. Secondly, the near-vacuum space environment makes the atmospheric transmission loss negligible. The dynamic space target studied in this paper is a point target, and thus the dispersion effect of the target must be considered. In addition, the dispersion effect, the face obscuration rate of the secondary mirror to the primary mirror in the Ricci Chrétien (RC) telescope, the diffraction efficiency of the grating, and the response rate of the infrared detector all affect the energy received at the focal plane of the infrared detector. Based on these parameters, to establish the infrared action distance model [26], one can accurately calculate the minimum aperture requirements of the spectrometer to ensure that the system can still work reliably under the worst conditions:
where for , the spectrometer’s optical system of light transmittance, spectrometer system of the front telescope’s obstruction ratio, and transmittance of the lenses will affect the system’s spectral transmittance for the general front telescope system. The mask ratio of the front telescope in the spectrometer system and the transmittance of the lens will affect the spectral transmittance of the system. Generally, the front telescope system has a mask ratio of no more than 0.09, and the transmittance of the lens coated with infrared material is generally greater than 0.98. Thus, the spectral transmittance of the optics will be 0.8. For , regarding the dispersive area of the point target, usually the dispersive spot of the infrared imaging optics system will be greater than pixels. Due to the spectral resolution of the spectrometer in this paper, the spectral resolution of the spectrometer was designed to be 10 nm/pixel, and thus the spectrometer’s dispersive area was designed to be pixels. For , regarding the diffraction efficiency of the shining grating, due to the grating constant of the grating in this paper being relatively small, the diffraction efficiency is not high. In the range of the band, the diffraction efficiency of the grating is 40~50%, and thus the diffraction efficiency is taken to be 40%.
For , the response rate of the infrared detector is taken to be 0.8, while is the luminance of infrared radiation of the spatial target in the pupil of the spectrometer. is the ratio of the infrared detector detecting ratio, where , is the unit detector photosensitive surface area, where , SNR is the signal-to-noise ratio threshold of the spectrometer system, which we set to six, and is the distance of the target from the spectrometer system. According to the technical specifications requiring that the target can be detected in a 650 km orbit, the observation angle is the target, and then the detection distance R = 233 km. Meanwhile, is the focal plane detector noise equivalent bandwidth, and T is the integration time of the detector, which is taken to be T = 10 ms.
According to the theoretical calculations, the target is in the shadow zone of the Earth when it is in the spectrometer’s entry pupil. According to the theoretical calculation, when the target is in the Earth’s shadow zone, its infrared irradiance at the pupil of the spectrometer reaches the minimum, and the theoretical through-aperture of the optical system is calculated to be 349 mm.
It is worth noting that the spectral resolution of the system in this paper is better than 10 nm/pixel, and therefore the spectral resolution will usually be smaller in the design of the actual optical system. This will result in the dispersed spot area of the point target exceeding the expected value of the original design. In order to ensure the system’s performance, the effective through-aperture of the spectrometer is determined to be 400 mm after a comprehensive weighing process, and this design value provides the necessary margin for the system’s performance while meeting the detection sensitivity requirement.
2.2. Calculation of Relative Aperture, Focal Length, and Field of View Angle
In this paper, a cooled infrared detector is employed. To minimize stray light interference caused by the mismatch between the optical pupil and aperture, the design requires that the cold stop of the slitless spectrometer achieve 100% matching efficiency. Therefore, the system’s F number must match that of the detector. The significant advantage of a slitless spectrometer over a conventional slit spectrometer lies in its larger field of view. According to Equations (2) and (3), once the system’s aperture is determined, the field of view is positively correlated with the effective photosensitive area of the detector and the system’s relative aperture. Thus, this paper selects a cooled infrared detector with an F number of 2 and matches the system’s F number accordingly to achieve the optimal optical performance and field of view.
Considering the application scenario, the object is assumed to be at infinity in the object space, and the system’s aperture is placed at the primary mirror. The spectrometer’s aperture is 400 mm, and the diameter of the entrance pupil equals the aperture. With an F number of two, the system’s focal length can be calculated using the following formula:
where is the system’s F number.
The pixel area of the infrared detector is , the pixel size is 15 µm, and the sensing area of the detector is , while the field of view of the spectrometer can be calculated by the following equation:
where is the effective sensing size of the detector. The field of view of the spectrometer is calculated to be .
3. Optical System Design and Optimization
The slitless spectrometer consists of a front telescope group system, a beam splitting system, and a relay lens group system. The optical structure is schematically shown in Figure 1. The front telescope system is responsible for converging the parallel light rays from the target object into the incident beam of the system, providing the necessary optical focus for the whole spectrometer. The spectroscopic system is selected based on the Dyson modified spectrometer structure, which is responsible for the spectral dimension separation of the target. In addition, the system utilizes a secondary imaging design to achieve stray light suppression. Thus, a relay mirror system was designed to ensure that the cold diaphragm matching efficiency reached 100%.
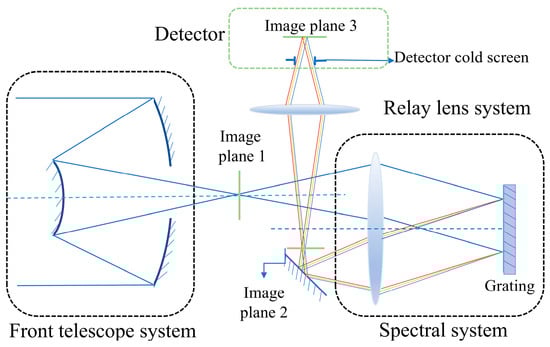
Figure 1.
Optical schematic of a slitless infrared spectrometer. In the optical system, the blue beam preceding the blazed grating represents broadband polychromatic light spanning wavelength range. Upon diffraction by the grating, spectral dispersion separates the components: with the red ray corresponding to the long-wavelength radiation, the yellow ray representing the central wavelength, and the blue ray denoting the short-wavelength radiation.
During the design process, the subsystems are designed independently of each other, but in order to ensure the imaging quality of the combined design, the optical parameters between the three subsystems are required to match with each other (i.e., matching the field of view, optical pupil position, and numerical aperture). Matching the field of view refers to the front group of optical systems of the image side of the field of view and the rear group of optical systems of the object side of a field of view of the same size. Optical pupil position matching means that the front group of optical systems outside of the pupil and the rear group of optical systems in the pupil are located in the same position. The numerical aperture matching conditions for the front group of optical systems of the image-side numerical aperture should be greater than or equal to that of the rear group of optical systems on the object side of the numerical aperture. In addition, in order to facilitate the connection and matching of various parts of the system, the front telescope system is required to realize the image-square telecentric design, the beam splitting system has to realize the object-square and image-square double telecentric design, and the relay system has to realize the object-square telecentric design.
3.1. Design of the Front Telescope System
In this study, the Ritchey–Chrétien (RC) telescope is used as the initial structure of the front telescope system, which consists of a hyperbolic primary mirror and a hyperbolic secondary mirror with excellent aberration correction. The initial structural parameters of the system were derived based on the classical design equations of the RC telescope [27].
In the preliminary design, the relative aperture of the front telescope system was initially set to F/2 in order to satisfy the optical parameter matching. However, it was found that the RC telescope with this parameter configuration is more difficult to process in the actual design process, and therefore the relative aperture was adjusted to F/4. It is worth noting that since the actual field of view of the system exceeded the design range of the conventional RC telescope, this led to a significant degradation in the imaging quality. For this reason, a set of correction mirrors is introduced in this paper to effectively compensate for this aberration.
The optical structure schematic of the optimized front telescope system is shown in Figure 2, the MTF is shown in Figure 3, and the spot diagram is shown in Figure 4, from which it can be seen that the imaging quality of the front telescope system is excellent. In addition, the front telescope system successfully realizes the image-square telecentric design (i.e., the normal angle between the main ray of each field of view and image plane 1 is controlled within an extremely small range).
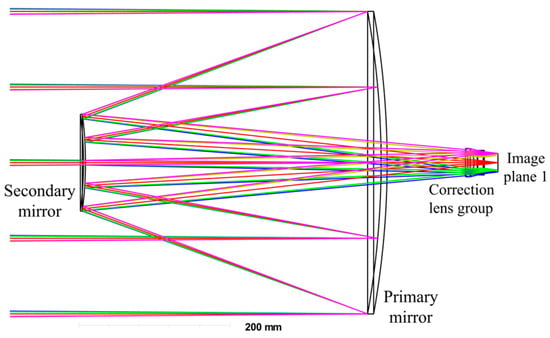
Figure 2.
Optical path structure of the front telescope. The figure employs distinct color coding to differentiate light paths from various FOV, where pink, red and green rays represent the optical trajectories of +1, 0 and −1 FOVs respectively.
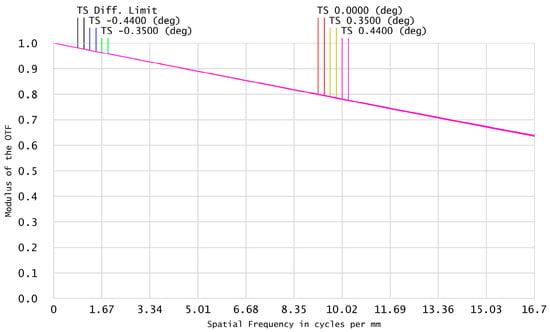
Figure 3.
MTF for the front telescope.
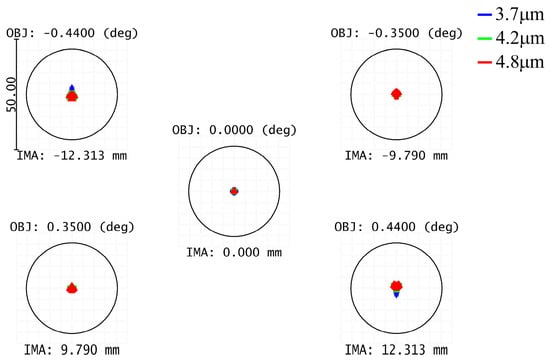
Figure 4.
Spot diagram of the front telescope.
3.2. Spectral System Design
Because the Dyson spectrometer has the advantages of a higher field of view tolerance, low spectral smile and keystone, and value spectral unity, the Dyson spectrometer system was selected as the initial design structure in this paper.
In terms of spectroscopic element selection, this study adopted a sparkle grating as the core spectroscopic device. However, due to the spherical curvature, the blaze angle of a spherical blazed grating is position-dependent, changing across the grating surface [28]. This feature leads to the device’s processing precision requirements being extremely high, not only significantly increasing the manufacturing cost but also the system’s mounting challenges.
In order to solve the practical application problems of concave gratings, this paper improves the Dyson spectrometer by adopting a planar flashing grating instead of a concave flashing grating. It should be noted that this improvement sacrifices the original low spectral smile and spectral keystone advantages of the Dyson spectrometer structure.
Analyzed from the optical principle, the spectral smile and keystone phenomena stem from the Y axis (the field of view), X axis (different field of view under the incident beam), and the grating’s main cross-section of the angle difference. Theoretical studies show that the smaller the difference in the angle of incidence, the weaker the spectral smile and spectral keystone effects of the system. In light of the system adopting the plane grating design, a specially designed collimator mirror group for precision collimation of the incident beam was implemented. Collimation accuracy and spectral line quality are positively correlated, where the better the collimation effect, the more ideal the system’s spectral smile and spectral keystone control. This design not only greatly reduces the processing difficulty and mounting complexity of optical components but also realizes effective control of the system’s manufacturing cost.
The improved spectral system is shown in Figure 5. When the diffraction order is zero, and the ideal imaging conditions are assumed, the object and image planes are symmetric with respect to the optical axis . In this configuration, light rays originating from different fields of view on the object plane and having the same cone angle will intersect at the same location on the grating. Therefore, the design of the spectroscopic system can be approached using a reverse design methodology, as outlined below.

Figure 5.
Schematic structure of the improved beam splitting system. In the optical system schematic, the blue beam incident on the grating represents polychromatic light covering the spectral band. After passing through the diffraction grating, the composite light undergoes wavelength dispersion. The red ray indicates the +first-order diffracted light, while the black ray corresponds to the zero-order light.
- Calculate the initial parameters of the spectroscopic system, namely the incident angle , grating height , grating constant , and focal length of the lens group . Subsequently, a new optical system is constructed using inverse design methodology: the blazed grating surface of the original system serves as the object plane of the new system, while both the object and image planes of the legacy system are mapped to the image plane of the new system. During this process, the following geometric correspondences are rigorously maintained: the object-side numerical aperture angle of the new system equals the maximum incidence angle of the legacy system grating, the object plane height of the new system matches the grating height of the legacy system, and the focal length of the new system precisely corresponds to the lens group focal length of the legacy system. During the optimization design based on these mapping relationships, precise control of incident rays across all field points at the image plane must be implemented: ensuring the chief ray coincides with the object plane normal to achieve perpendicular incidence, while constraining the incident angle of marginal field rays at the object plane to exceed angle . This approach achieves optimal balance between system light collection efficiency and aberration characteristics.
- After completing the initial optimization, assemble the optimized lens group. To ensure proper system matching, the exit pupil of the front telescope system is set as the entrance pupil for the spectroscopic system. Further optimization is then performed.
- Change the diffraction order to +1, and continue the optimization process to ensure that the main ray is vertically incident on image plane 2.
Using these steps and the following formulas, the initial parameters of the spectroscopic system can be calculated.
is the primary image plane formed by the front objective system, is the diffracted image plane of passing through the beam splitting system at level 0, and is the diffracted image plane of passing through the beam splitting system at level +1. This is known through the grating diffraction equation and geometrical relations:
where and are the diffraction angles of levels 0 and +1, respectively; is the object cone angle; is the diffraction level of the grating; is the wavelength of the diffracted light; and is the grating constant.
The lens group’s object–image relationship is
The grating dispersion formula is
where is the focal length of the lens group.
When designing the system, it is important to consider the object–image separation and the placement of subsequent fold mirrors. These factors impose additional constraints on the system’s design. From the geometric relationships, we have
The system requires a spectral resolution better than 10 nm/pixel, and the magnification of the subsequent relay mirror system was designed to be −0.5. Thus, the spectral resolution was designed to be 9 nm/pixel, where µm and nm. t According to the above formulas, combined with the requirements of the separation of the image plane and the parameters of the primary image plane AB, the initial parameters of the spectroscopic system can be determined. The focal length of the lens group is mm, the eccentricity value is 25 mm, the grating size is mm, and the grating constant is lp/mm.
The above initial parameters were imported into the optical design software for ray tracing and optimization design, and the optimized optical structure of the spectral system is shown in Figure 6. The MTF diagrams of the spectral system at wavelengths of , , and are shown in Figure 7a–c, respectively, and it can be clearly found that their MTFs were greater than 0.59. As shown in Figure 8, the spot diameters of the spectroscopic system were sub-Airy throughout the operational wavelength range, verifying its diffraction-limited imaging capability. Therefore, the imaging quality of the spectral system was excellent. In addition, the system realized the design requirement of double telecentricity of the object and image sides of the spectroscopic system.
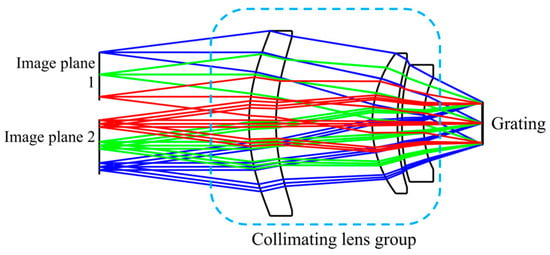
Figure 6.
Optical structure of the spectral system. The figure employs distinct color coding to differentiate light paths from various FOV, where blue, green and red rays represent the optical trajectories of +1, 0 and −1 FOVs respectively.
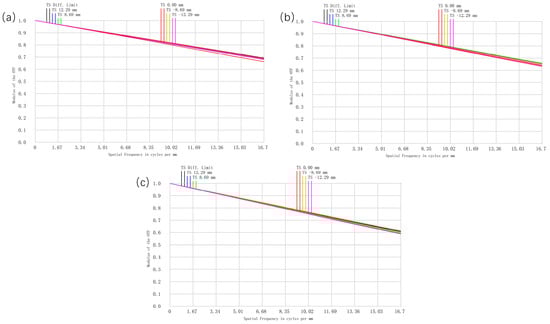
Figure 7.
The MTF diagrams of the spectral system: (a) , (b) , and (c) .
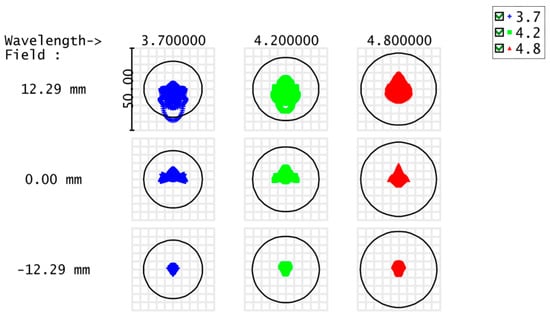
Figure 8.
The matrix spot diagram of the spectral system. (This one ignores the vertical axis color difference).
3.3. Repeater Mirror System
In the design of the infrared optical system, the matching of the cold diaphragm of the cooled detector is the key technical difficulty in realizing efficient stray light suppression. The cooling infrared detector used in this system had a 0.47-mm-thick cold diaphragm set 20 mm in front of its focal plane, which was designed to effectively block the radiation outside the field of view from entering the detection area. In order to ensure the best stray light suppression effect, the system design must ensure 100% cold diaphragm efficiency.
For the wavelength-related optical pupil displacement phenomenon unique to the refractive spectral system (spectral system outside of the pupil at wavelengths of 3.7 μm, 4.2 μm, and 4.8 μm at the 7446 mm, 4002 mm, and 3964 mm positions, respectively), the traditional direct matching program is fundamentally difficult. In order to solve this problem, this paper adopts a secondary imaging optical relay lens group system.
The schematic diagram of the final design of the optical system of the relay lens group is shown in Figure 9, and the MTF diagram is shown in Figure 10, which shows that the imaging quality of the relay lens group system was excellent. In addition, its exit pupil was located at −20.47 mm, and the diameter of the exit pupil was 10.235 mm, which coincided with the cold diaphragm of the detector, realizing 100% matching efficiency of the cold diaphragm.
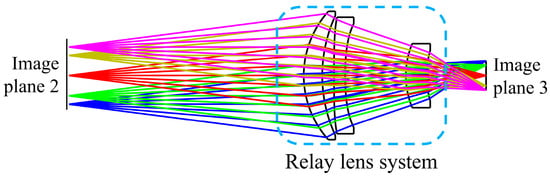
Figure 9.
The schematic diagram of the relay lens group system. The figure employs distinct color coding to differentiate light paths from various FOV, where pink, golden-brown, red, green, and blue rays represent the optical trajectories of +1, +0.707, 0, −0.707, and −1 FOVs respectively.
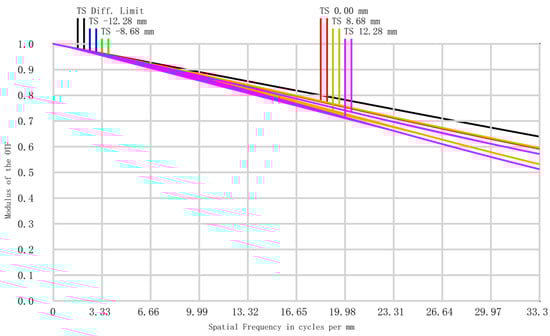
Figure 10.
The MTF diagram of the relay lens group system.
3.4. Slitless Spectrometer System Design Results
After the independent design of the front telescope system, spectroscopy system, and relay system were completed, these three subsystems needed to be combined and further optimized, especially in terms of the spectral smile and keystone. In addition to the collimating mirror set, aspherical lenses can be used to reduce the spectral smile and keystone. In this paper, this occurred after the combination of the system. Therefore, optical design software was used to optimize the whole optical system of the spectrometer, and the spectral smile and keystone were optimized by using the light position evaluation function’s operand. The total length of the final optimized spectrometer system was controlled at 767 mm, and the schematic diagram of the optical structure of the system is shown in Figure 11. The system performance indicators are shown in Table 1, and the main component parameters are shown in Table 2.
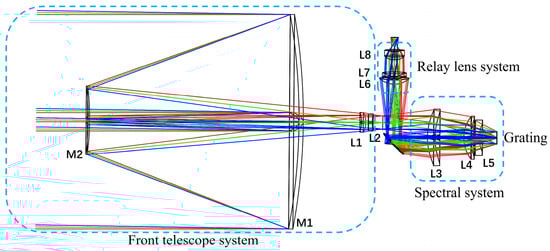
Figure 11.
The schematic diagram of the optical structure of the system.

Table 1.
System performance indicators.
Table 2.
Optical element parameter.
4. Performance Analysis of Slitless Spectrometer
4.1. Image Quality Assessment
Figure 12 is a graph showing the variation of the root mean square (RMS) radius of the dispersive spot in the spatial and spectral directions with the wavelength under different fields of view of the spectrometer. As seen in the graph, the RMS radius of the spectrometer under different fields of view never exceeded 2 µm, and the variation was relatively smooth, indicating that the spectrometer maintained stable imaging quality across different wavelengths and fields of view.
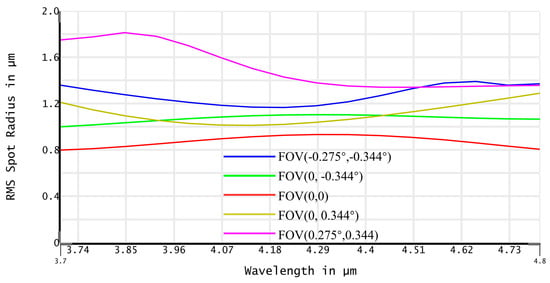
Figure 12.
RMS spot radius under the different wavelengths and FOVs. The horizontal coordinate is the wavelength, the vertical coordinate is the RMS spot radius, and different colors represent different fields of view.
Figure 13 shows the dot plot of the spectrometer under various fields of view and wavelengths, demonstrating that the RMS radius in the full field of view and the entire working band on the third image plane remained smaller than one pixel in size. In the preliminary calculation of the spectrometer’s pass aperture, the diffuse spot in the spatial direction was considered to span three pixels in size, while the ideal imaging size of the target was less than half a pixel in size. After passing through the spectrometer, the target’s imaging size in the spatial direction did not exceed three pixels, fully meeting the initial design requirements. Therefore, all design parameters were satisfied, proving that the system exhibited superior performance in terms of spatial imaging and spectral dispersion, successfully achieving the expected design goals.
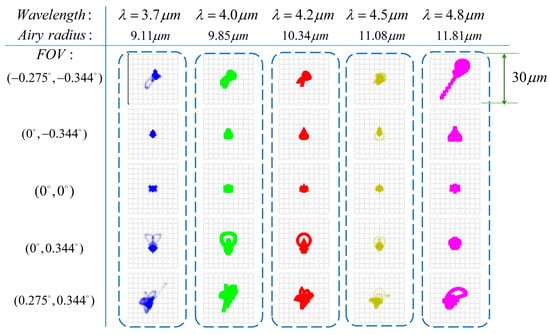
Figure 13.
Spot diagrams under the different wavelengths and FOVs. The images in the figure are diffuse spots in different fields of view and wavelengths of the system, where the same columns have the same wavelength and the same rows have the same field of view.
4.2. Smile and Keystone
In the system with a collimated optical path, due to the different angle between the light incident on the grating and the grating’s main cross-section, certain values for the spectral smile and keystone will be generated at the image plane. Spectral smile refers to the target of the spectroscopic system, its monochromatic image, and the ideal position deviation, forming a series of curved spectral lines. Keystone refers to the target of the spectroscopic system, with different wavelengths due to the magnification of different monochromatic images of the difference between the image heights. Spectral smile will cause spectral information aliasing, reducing the spectral resolution, while keystone will lead to uneven spatial distribution of the spectral intensity of the image surface.
The variation curve of the system’s spectral smile with the image height is shown in Figure 14a, from which it can be seen that the spectral smile in the working band was always no more than 10 µm. The spectral smile increased with the increase in wavelength and field of view and was symmetric with respect to the center field of view. The variation curve of the system’s keystone with the wavelength is shown in Figure 14b. The keystone was always no more than 0.3 µm, and the spectral smile and keystone were both effectively controlled within one pixel size, which indicates that the optical performance of the system was not uniform. Both the spectral smile and keystone were effectively controlled within one image element size, indicating that the optical performance of the system met the expected design objectives.
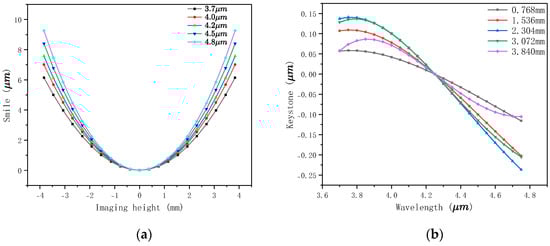
Figure 14.
Spectral smile and keystone. (a) Spectral smile curve. (b) Keystone curve. (a) This is the spectral smile of the system, where the horizontal coordinate is the image height of the target in the x-axis (spatial dimension) direction of the detector, the vertical axis is the distance between that image height under the field of view and the central field of view on the detector, and the different colors represent different wavelengths of the target after dispersion. (b) This is the spectral keystone of the system. The horizontal coordinate is the target wavelength, the vertical axis is the difference between that wavelength and the center wavelength in terms of image height on the detector, and different colors represent different fields of view.
4.3. Spectral Resolution
The spectral resolution is an important index for evaluating the performance of a spectrometer which not only affects the ability of the spectrometer to detect detailed spectra but also directly determines the accuracy of the system in qualitative and quantitative analysis. Reasonable selection and optimization of the spectral resolution is the basis for ensuring the performance of a spectrometer.
The spectral resolution of a spectrometer is calculated as follows [29]:
where is the pixel size, is the longest wavelength, is the shortest wavelength, and is the total dispersion width.
Using the above formula, and are taken as the shortest and longest working wavelengths of the slitless spectrometer, respectively. Optical design software was used to trace the light in different fields of view to find the total dispersion width of different fields of view, and then the spectral resolution was calculated. The variation in the spectral resolution with the wavelength is shown in Figure 15, from which it can be clearly seen that the difference in spectral resolution between different fields of view and different wavelengths was relatively small, and the dispersion of the spectrum basically presented a linear relationship, realizing the value of the spectrum, which provides a great advantage for the inversion of the subsequent data. The spectral resolution of the spectrometer was calculated as the mean value, and the result shows that the spectral resolution of the spectrometer was 8.41 nm/pixel, which is better than the design index requirement of 10 nm/pixel and meets the system design requirements.
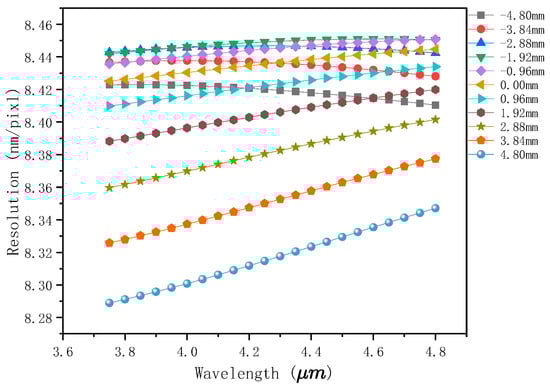
Figure 15.
Spectral resolution. This is a curve of the spectral resolution versus the wavelength for different fields of view. The horizontal coordinate is the target wavelength, the vertical axis is the spectral resolution, and different colors represent different fields of view.
The spot diagrams of different wavelengths and fields of view of the spectrometer are shown in Figure 16, which shows that when the wavelength difference was 10 nm, the different wavelengths of the spectrometer’s center field of view and the edge field of view could still be effectively separated in the image plane, indicating that the spectral resolution of the spectrometer was better than 10 nm and the design requirements of the system were met.
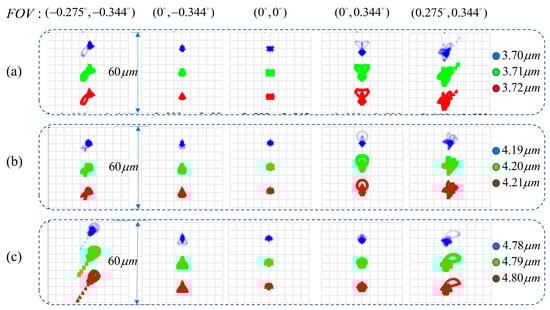
Figure 16.
Spot diagrams under different bands and FOVs; (a) ; (b) ; and (c) . The plot is a column of dots spaced at wavelengths of 10 nm, with each column having the same field of view and each row having the same wavelength.
4.4. Experimental Validation and Results
The spaceborne infrared slitless spectrometer system successfully developed in this work is physically presented in Figure 17. Featuring a compact structure with a small volume and lightweight characteristics, the system fully complies with the volume and mass requirements for payloads on spaceborne platforms. To validate the system’s performance, we conducted comprehensive testing procedures.
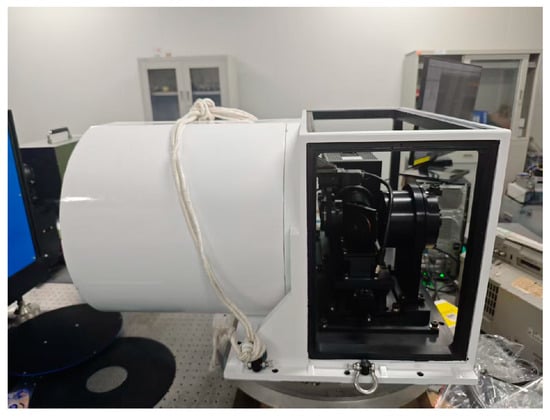
Figure 17.
System diagram.
Figure 18a displays the standard blackbody infrared spectral image acquired by this spectrometer, exhibiting excellent background uniformity that demonstrates its superior stray light suppression capability. The distinct white spot on the left side of the image in (a) corresponds to the blackbody’s zero-order diffraction spectrum, whose intensity distribution reflects the system’s point spread function characteristics. The two bright white lines on the right represent +first-order diffraction spectra, with their spectral broadening directly correlated to the system’s spectral resolution. These two spectral bands were located at and , spanning 78 pixels and yielding a spectral resolution of 8.58 nm/pixel, which shows close agreement with the design specifications.
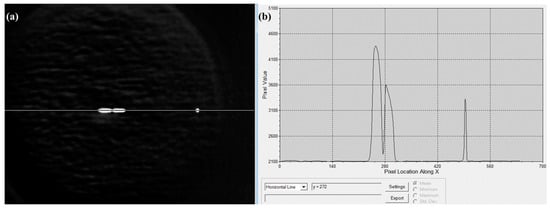
Figure 18.
(a) Infrared spectral image of blackbody target. (b) The detector gray value-image element position relationship curve.
The simultaneous imaging capability of both the zero-order and +first-order diffraction patterns on the detector enabled the system to not only identify targets through infrared spectral information but also tracked targets utilizing the zero-order diffraction pattern.
As shown in Figure 18b, the detector’s grayscale value versus pixel position relationship curve further verifies the system’s low-noise characteristics and clearly reveals characteristic inflection points of the blackbody radiation curve. This provides a reliable foundation for establishing a quantitative inversion model correlating the “grayscale-radiant exitance-temperature” relationship in subsequent research.
5. Conclusions
In this paper, an innovative infrared slitless spectrometer optical system based on Dyson modified was designed to realize the detection and identification of long-range dynamic spatial point targets. By adopting a slitless design, the system significantly extends the spectrometer’s field of view and meets the needs of high-speed dynamic spatial target detection and identification. The system consists of three main systems: a front telescope system, an improved spectroscopy system based on a Dyson concentric structure, and a relay system.
The improved spectroscopic system based on a Dyson concentric structure adopts a planar flashing grating instead of the traditional concave flashing grating. In order to solve the problems brought about by this, the system was designed with a set of collimating mirrors to collimate the incident light at the grating so as to reduce spectral curvature and chromatic aberrations, as well as make the dispersion of the spectrum basically show a linear relationship. This design ensures that the gray values on the detector are closely related to the spectral distribution, which facilitates the subsequent quantitative analysis of spectral data and effectively supports target identification. In addition, the improvement significantly reduced the difficulty of processing and mounting the optical components and effectively lowered the manufacturing cost of the system.
Through simulation and optimization of the optical design software, the results show that the system performed well in terms of dispersion spot, spectral resolution, spectral smile, and keystone, and the cold diaphragm matching efficiency reached 100%. In addition, the volume of the spectrometer met the design requirements. The infrared slitless spectrometer solves the limitation of the field of view of traditional spectrometers being too small, does not require a high tracking longitude for the warp beam, and is capable of stably acquiring the spectral characteristics of a target in the full orbital range. Despite the low spectral resolution of the system, the system is still able to provide sufficient accuracy to meet the recognition requirements of dynamic space targets in the acquisition of spectral information of space targets.
In summary, the infrared slitless spectrometer system based on the improved Dyson designed in this paper has the advantages of value-spectrum unification, low cost, miniaturization, and low requirements for the tracking accuracy of the warp beam, providing a new technical idea for the detection, identification, and tracking of space targets while having a wide range of application prospects.
Author Contributions
Conceptualization, L.Z. and W.S.; methodology, Y.C.; software, Y.C. and P.D.; validation, Y.C. and P.C.; formal analysis, Y.C. and P.C.; investigation, H.Z.; resources, L.Z. and W.S.; data curation, P.D. and P.C.; writing—original draft preparation, Y.C. and P.D.; writing—review and editing, L.Z. and W.S.; supervision, L.Z. and W.S.; project administration, L.Z.; funding acquisition, L.Z. All authors have read and agreed to the published version of the manuscript.
Funding
This research was funded by the Natural Science Basic Research Program of Shanxi, grant number 2024JC-YBQN-0707.
Data Availability Statement
Data are contained within the article.
Conflicts of Interest
The authors declare no conflicts of interest.
Abbreviations
The following abbreviations are used in this manuscript:
| RC | Ritchey–Chrétien |
| HST | Hubble Space Telescope |
| MOSES | Multi-Order Solar EUV Spectrograph |
| JWST | James Webb Space Telescope |
| FOV | Field of view |
| RMS | Root mean square |
References
- Shan, M.; Guo, J.; Gill, E. Review and Comparison of Active Space Debris Capturing and Removal Methods. Prog. Aerosp. Sci. 2016, 80, 18–32. [Google Scholar] [CrossRef]
- Yunpeng, H.; Kebo, L.; Yangang, L.; Lei, C. Review on Strategies of Space-Based Optical Space Situational Awareness. J. Syst. Eng. Electron. 2021, 32, 1152–1166. [Google Scholar] [CrossRef]
- Pardini, C.; Anselmo, L. Revisiting the Collision Risk with Cataloged Objects for the Iridium and COSMO-SkyMed Satellite Constellations. Acta Astronaut. 2017, 134, 23–32. [Google Scholar] [CrossRef]
- Zhang, F.; Li, C.; Shi, L. Detecting and Tracking Dim Moving Point Target in IR Image Sequence. Infrared Phys. Technol. 2005, 46, 323–328. [Google Scholar] [CrossRef]
- Pang, S.; Wang, H.; Lu, X.; Shen, Y.; Pan, Y. Space-Based Detection of Space Debris by Photometric and Polarimetric Characteristics. In Proceedings of the AOPC 2017: Space Optics and Earth Imaging and Space Navigation, Beijing, China, 4–6 June 2017; SPIE: Bellingham, WA, USA, 2017; Volume 10463, pp. 295–303. [Google Scholar]
- Tippets, R.D.; Wakefield, S.; Young, S.; Ferguson, I.; Earp-Pitkins, C.; Chun, F.K. Slitless Spectroscopy of Geosynchronous Satellites. Opt. Eng. 2015, 54, 104103. [Google Scholar] [CrossRef]
- Deng, S.; Liu, C.; Tan, Y.; Liu, D.; Jiang, C.; Kang, Z.; Li, Z.; Fan, C.; Zhu, C.; Zhang, N.; et al. Research on Spectral Measurement Technology and Surface Material Analysis of Space Target. Spectrosc. Spectr. Anal. 2021, 41, 3299–3306. [Google Scholar]
- Xu, R.; Zhao, F.; Zhou, J. Progress of Spectral Measurements and Characterization for Non-Resolved Space Objects. Spectrosc. Spectr. Anal. 2019, 39, 333–339. [Google Scholar]
- Hoag, A.A.; Schroeder, D.J. “Nonobjective” Grating Spectroscopy. Publ. Astron. Soc. Pac. 1970, 82, 1141. [Google Scholar] [CrossRef]
- Osmer, P.S.; Smith, M.G. Discovery and spectrophotometry of the quasars in the −40° zone of the ctio curtis schmidt survey. Astrophys. J. Suppl. Ser. 1980, 42, 333–349. [Google Scholar] [CrossRef]
- Fraquelli, D.A.; Schultz, A.B.; Bushouse, H.; Hart, H.M.; Vener, P. NICMOS Coronagraphy. Publ. Astron. Soc. Pac. 2003, 116, 55. [Google Scholar] [CrossRef]
- Ramberg, E. Optical Design of NICMOS: The Second-Generation Infrared Instrument for the Hubble Space Telescope; Bely, P.Y., Breckinridge, J.B., Eds.; SPIE: Orlando, FL, USA, 1993; pp. 383–389. [Google Scholar]
- Doyon, R.; Hutchings, J.B.; Beaulieu, M.; Albert, L.; Lafrenière, D.; Willott, C.; Touahri, D.; Rowlands, N.; Maszkiewicz, M.; Fullerton, A.W.; et al. The JWST Fine Guidance Sensor (FGS) and Near-Infrared Imager and Slitless Spectrograph (NIRISS); Clampin, M.C., Fazio, G.G., MacEwen, H.A., Oschmann, J.M., Eds.; SPIE: Amsterdam, The Netherlands, 2012; p. 84422R. [Google Scholar]
- Willott, C.J.; Doyon, R.; Albert, L.; Brammer, G.B.; Dixon, W.V.; Muzic, K.; Ravindranath, S.; Scholz, A.; Abraham, R.; Artigau, É.; et al. The Near-Infrared Imager and Slitless Spectrograph for the James Webb Space Telescope—II. Wide Field Slitless Spectroscopy. PASP 2022, 134, 025002. [Google Scholar] [CrossRef]
- Albert, L.; Lafrenière, D.; Doyon, R.; Artigau, É.; Volk, K.; Goudfrooij, P.; Martel, A.R.; Radica, M.; Rowe, J.; Espinoza, N.; et al. The Near Infrared Imager and Slitless Spectrograph for the James Webb Space Telescope. III. Single Object Slitless Spectroscopy. Publ. Astron. Soc. Pac. 2023, 135, 075001. [Google Scholar] [CrossRef]
- Greene, T.P.; Chu, L.; Egami, E.; Hodapp, K.W.; Kelly, D.M.; Leisenring, J.; Rieke, M.; Robberto, M.; Schlawin, E.; Stansberry, J. Slitless Spectroscopy with the James Webb Space Telescope Near-Infrared Camera (JWST NIRCam). In Proceedings of the Space Telescopes and Instrumentation 2016: Optical, Infrared, and Millimeter Wave, Edinburgh, UK, 26 June–1 July 2016; SPIE: Bellingham, WA, USA, 2016; Volume 9904, pp. 130–141. [Google Scholar]
- Maciaszek, T.; Ealet, A.; Jahnke, K.; Prieto, E.; Barbier, R.; Mellier, Y.; Beaumont, F.; Bon, W.; Bonnefoi, A.; Carle, M.; et al. Euclid Near Infrared Spectrometer and Photometer Instrument Concept and First Test Results Obtained for Different Breadboards Models at the End of Phase, C. In Proceedings of the Space Telescopes and Instrumentation 2016: Optical, Infrared, and Millimeter Wave, Edinburgh, UK, 26 June–1 July 2016; SPIE: Bellingham, WA, USA, 2016; Volume 9904, pp. 298–315. [Google Scholar]
- Gong, Q.; Content, D.A.; Dominguez, M.; Emmett, T.; Griesmann, U.; Hagopian, J.; Kruk, J.; Marx, C.; Pasquale, B.; Wallace, T.; et al. Wide-Field InfraRed Survey Telescope (WFIRST) Slitless Spectrometer: Design, Prototype, and Results. In Proceedings of the Space Telescopes and Instrumentation 2016: Optical, Infrared, and Millimeter Wave, Edinburgh, UK, 26 June–1 July 2016; SPIE: Bellingham, WA, USA, 2016; Volume 9904, pp. 403–420. [Google Scholar]
- Zhan, H. Consideration for a large-scale multi-color imaging and slitless spectroscopy survey on the Chinese space station and its application in dark energy research. Sci. China Phys. Mech. Astron. 2011, 41, 1441–1447. [Google Scholar] [CrossRef]
- Kankelborg, C.C.; Thomas, R.J. Simultaneous Imaging and Spectroscopy of the Solar Atmosphere: Advantages and Challenges of a 3-Order Slitless Spectrograph; Siegmund, O.H.W., Fineschi, S., Gummin, M.A., Eds.; SPIE: San Diego, CA, USA, 2001; pp. 16–26. [Google Scholar]
- Parker, J.D.; Kankelborg, C.C. Determining the Spectral Content of MOSES Images. Astrophys. J. 2022, 932, 130. [Google Scholar] [CrossRef]
- Fox, J.L.; Kankelborg, C.C.; Thomas, R.J. A transition region explosive event observed in He II with the moses sounding rocket. Astrophys. J. 2010, 719, 1132. [Google Scholar] [CrossRef]
- Ma, W.; Xuan, Y.; Han, Y. Analysis of Thermal Characteristics of Satellite Systems. Spacecr. Eng. 2009, 18, 48–54. [Google Scholar]
- Green, R.O. Spectral Calibration Requirement for Earth-Looking Imaging Spectrometers in the Solar-Reflected Spectrum. Appl. Opt. AO 1998, 37, 683–690. [Google Scholar] [CrossRef]
- Dong, P.; Zhou, L.; Liu, Z.; Cui, K. Multi-Spectral Radiation Thermometry of Space Point Targets Based on Spectral Image Pixel Binning. Appl. Opt. AO 2024, 63, 7900–7908. [Google Scholar] [CrossRef]
- Xing, Q.; Huang, H.; Xiong, R.; Yu, T. Detect-ability Analyzing of IR FPA Tracking System. Acta Photonica Sin. 2004, 33, 893–896. [Google Scholar]
- Pan, J. The Methodic Design of the IR Imaging System with Large Aperture. Acta Photonica Sin. 2003, 23, 1475–1478. [Google Scholar]
- Wang, X. Research on Hadama Transform Near-Infrared Spectrometer Based on DMD. Ph.D. Thesis, University of Chinese Academy of Science, Beijing, China, 2016. [Google Scholar]
- Akhmetov, D.M.; Muslimov, E.R.; Kharitonov, D.Y.; Ibatullin, E.G.; Pavlycheva, N.K. A Prototype Slitless Spectrograph with a Composite Grism. Astrophys. Bull. 2024, 79, 525–534. [Google Scholar] [CrossRef]
Disclaimer/Publisher’s Note: The statements, opinions and data contained in all publications are solely those of the individual author(s) and contributor(s) and not of MDPI and/or the editor(s). MDPI and/or the editor(s) disclaim responsibility for any injury to people or property resulting from any ideas, methods, instructions or products referred to in the content. |
© 2025 by the authors. Licensee MDPI, Basel, Switzerland. This article is an open access article distributed under the terms and conditions of the Creative Commons Attribution (CC BY) license (https://creativecommons.org/licenses/by/4.0/).