Communication

Electrohydrodynamically Printed Microlens Arrays with the High Filling Factor near 90%

1
School of Physics & Optoelectronic Engineering, Guangdong University of Technology, Guangzhou 510006, China
2
Department of Electrical and Electronic Engineering, Southern University of Science and Technology, Shenzhen 518055, China
3
School of Information Engineering, Wuhan University of Technology, Wuhan 430070, China
4
State Key Laboratory of Optical Fiber and Cable Manufacture Technology, Southern University of Science and Technology, Shenzhen 518055, China
5
Shenzhen Engineering Research Center for High Resolution Light Field Display and Technology, Southern University of Science and Technology, Shenzhen 518055, China
6
Shenzhen Placnk Innovation Technology Co., Ltd., Shenzhen 518112, China
*
Authors to whom correspondence should be addressed.
These authors contributed equally to this work.
Photonics 2025, 12(5), 446; https://doi.org/10.3390/photonics12050446
Submission received: 29 March 2025 / Revised: 1 May 2025 / Accepted: 2 May 2025 / Published: 5 May 2025

Abstract

:
Microlens arrays (MLAs) are essential for light collection, extraction, and high-resolution imaging. However, most reported MLAs have a limited filling factor. Here, we demonstrate MLAs using three different UV-curing optical adhesives based on the electrohydrodynamic inkjet (E-jet) printing technique. The highest filling factor of 89.91% is achieved. By controlling the curvature of the microlens via the surface treatment of the substrate, a series of MLAs with different numerical apertures can be obtained. With the high-consistency printing technique, the demonstrated high filling factor MLAs could be potentially useful to improve the performance of optical imaging and sensing systems.

1. Introduction

Microlens arrays (MLAs) have attracted extensive attention due to their important applications in many fields, such as organic light-emitting devices [1,2,3], three-dimensional displays [4,5,6], solar cells [7,8,9,10], and cell detection [11,12,13]. Thus far, various techniques have been developed to fabricate MLAs, such as inkjet printing [12,14,15,16,17], laser direct writing [18,19,20,21], photopolymerization-induced phase separation [22,23,24,25], screen printing [26,27], photolithography [28,29,30], photopolymerization [31], and thermal reflow [32,33]. Among these techniques, laser direct writing can be used to achieve high precision and mask-free MLAs, but with quite low processing efficiency and high cost. The screen printing technique is based on the ink transfer to the substrate through a scraper, which is a relatively efficient and low-cost method. However, it is very challenging to achieve the MLAs with a high filling factor. MLAs fabricated with the photolithography technique usually have a high resolution and optical performance, but their high fabrication cost and complicated processes are not suitable for large-area mass production. Compared to photolithography, photopolymerization is a much cheaper technique with a broad selection range of photosensitive materials. However, in terms of processing, it is similar to photolithography, which is also not suitable for large-scale preparation. The thermal reflux method has been widely used in large-area fabrication, but the numerical aperture (NA) of the prepared microlenses is relatively small, hence greatly limiting their applications.
Comparatively, the distinct advantage of inkjet printing over the abovementioned techniques is that it allows direct preparation for MLAs. This method avoids potential damage to MLAs removal from the mold. Therefore, inkjet printing is much more flexible and convenient to prepare large-area MLAs. Based on this technique, Park et al. applied an electric field between the nozzle and the substrate to create tiny droplets that fall onto the substrate through the electric field force [34], which is the so-called electrohydrodynamic jet (E-jet) printing. Under the action of the electric field force (FE) and gravity (FG), the droplet overcomes the viscous force (FV), capillary force (FC), and surface tension (FS) to form a stable conical jet [35]. The diameter of the cone jet can be much smaller than that of the nozzle, hence becoming feasible to prepare high-resolution MLAs [36,37]. Compared with the above techniques, the key advantage of the E-jet printing lies in the precise control of droplets through the electric field, overcoming the limitations posed by traditional ones: the printing resolution can reach sub-micron (<1 μm), far exceeding inkjet printing (>10 μm) and screen printing (>50 μm). The printing process is material-friendly, meaning that a wide spectrum of materials, such as high viscosity polymers, nanocomposites, bioinks, and so on, can be used for direct printing without the need additional further treatment. The process is flexible and efficient, allowing customization of non-spherical, multi-focal, or 3D stacked structures without the need of masks or molds, and can be completed in a single-step process at a significantly lower cost than the photolithography and laser direct writing. The E-jet printing is adaptable to various types of substrates including flexible, curved, and heat-sensitive ones (such as PDMS, PET). Finally, it is environmentally friendly, with no chemical etching waste, and a high material utilization rate of over 90%. In general, MLAs with the high filling factor can greatly enhance the light utilization efficiency and reduce the light loss accordingly. For example, in LED devices, the light extraction efficiency can be significantly improved by preparing high filling ratio MLAs on the light-emitting side of the LED devices, thus enhancing their brightness [38]. Similarly, the preparation of MLAs on the surface of the solar cell can also improve the energy harvesting capacity, improving the energy conversion efficiency [39].
In this work, we demonstrate MLAs using three different UV-curing optical adhesives using the E-jet printing technique. With the hexagonal array arrangement, tightly packed MLAs with the filling factor of up to 89.91% are achieved. By controlling the curvature of the microlens via UV-ozone (UVO) treatment of the substrate surface, a series of MLAs with different NAs can be obtained. The demonstrated high filling factor MLAs show well-controlled focusing and imaging properties with adjustable focal lengths and NAs, which could be potentially useful to improving the performance of optical imaging and sensing systems.

2. Experimental Section

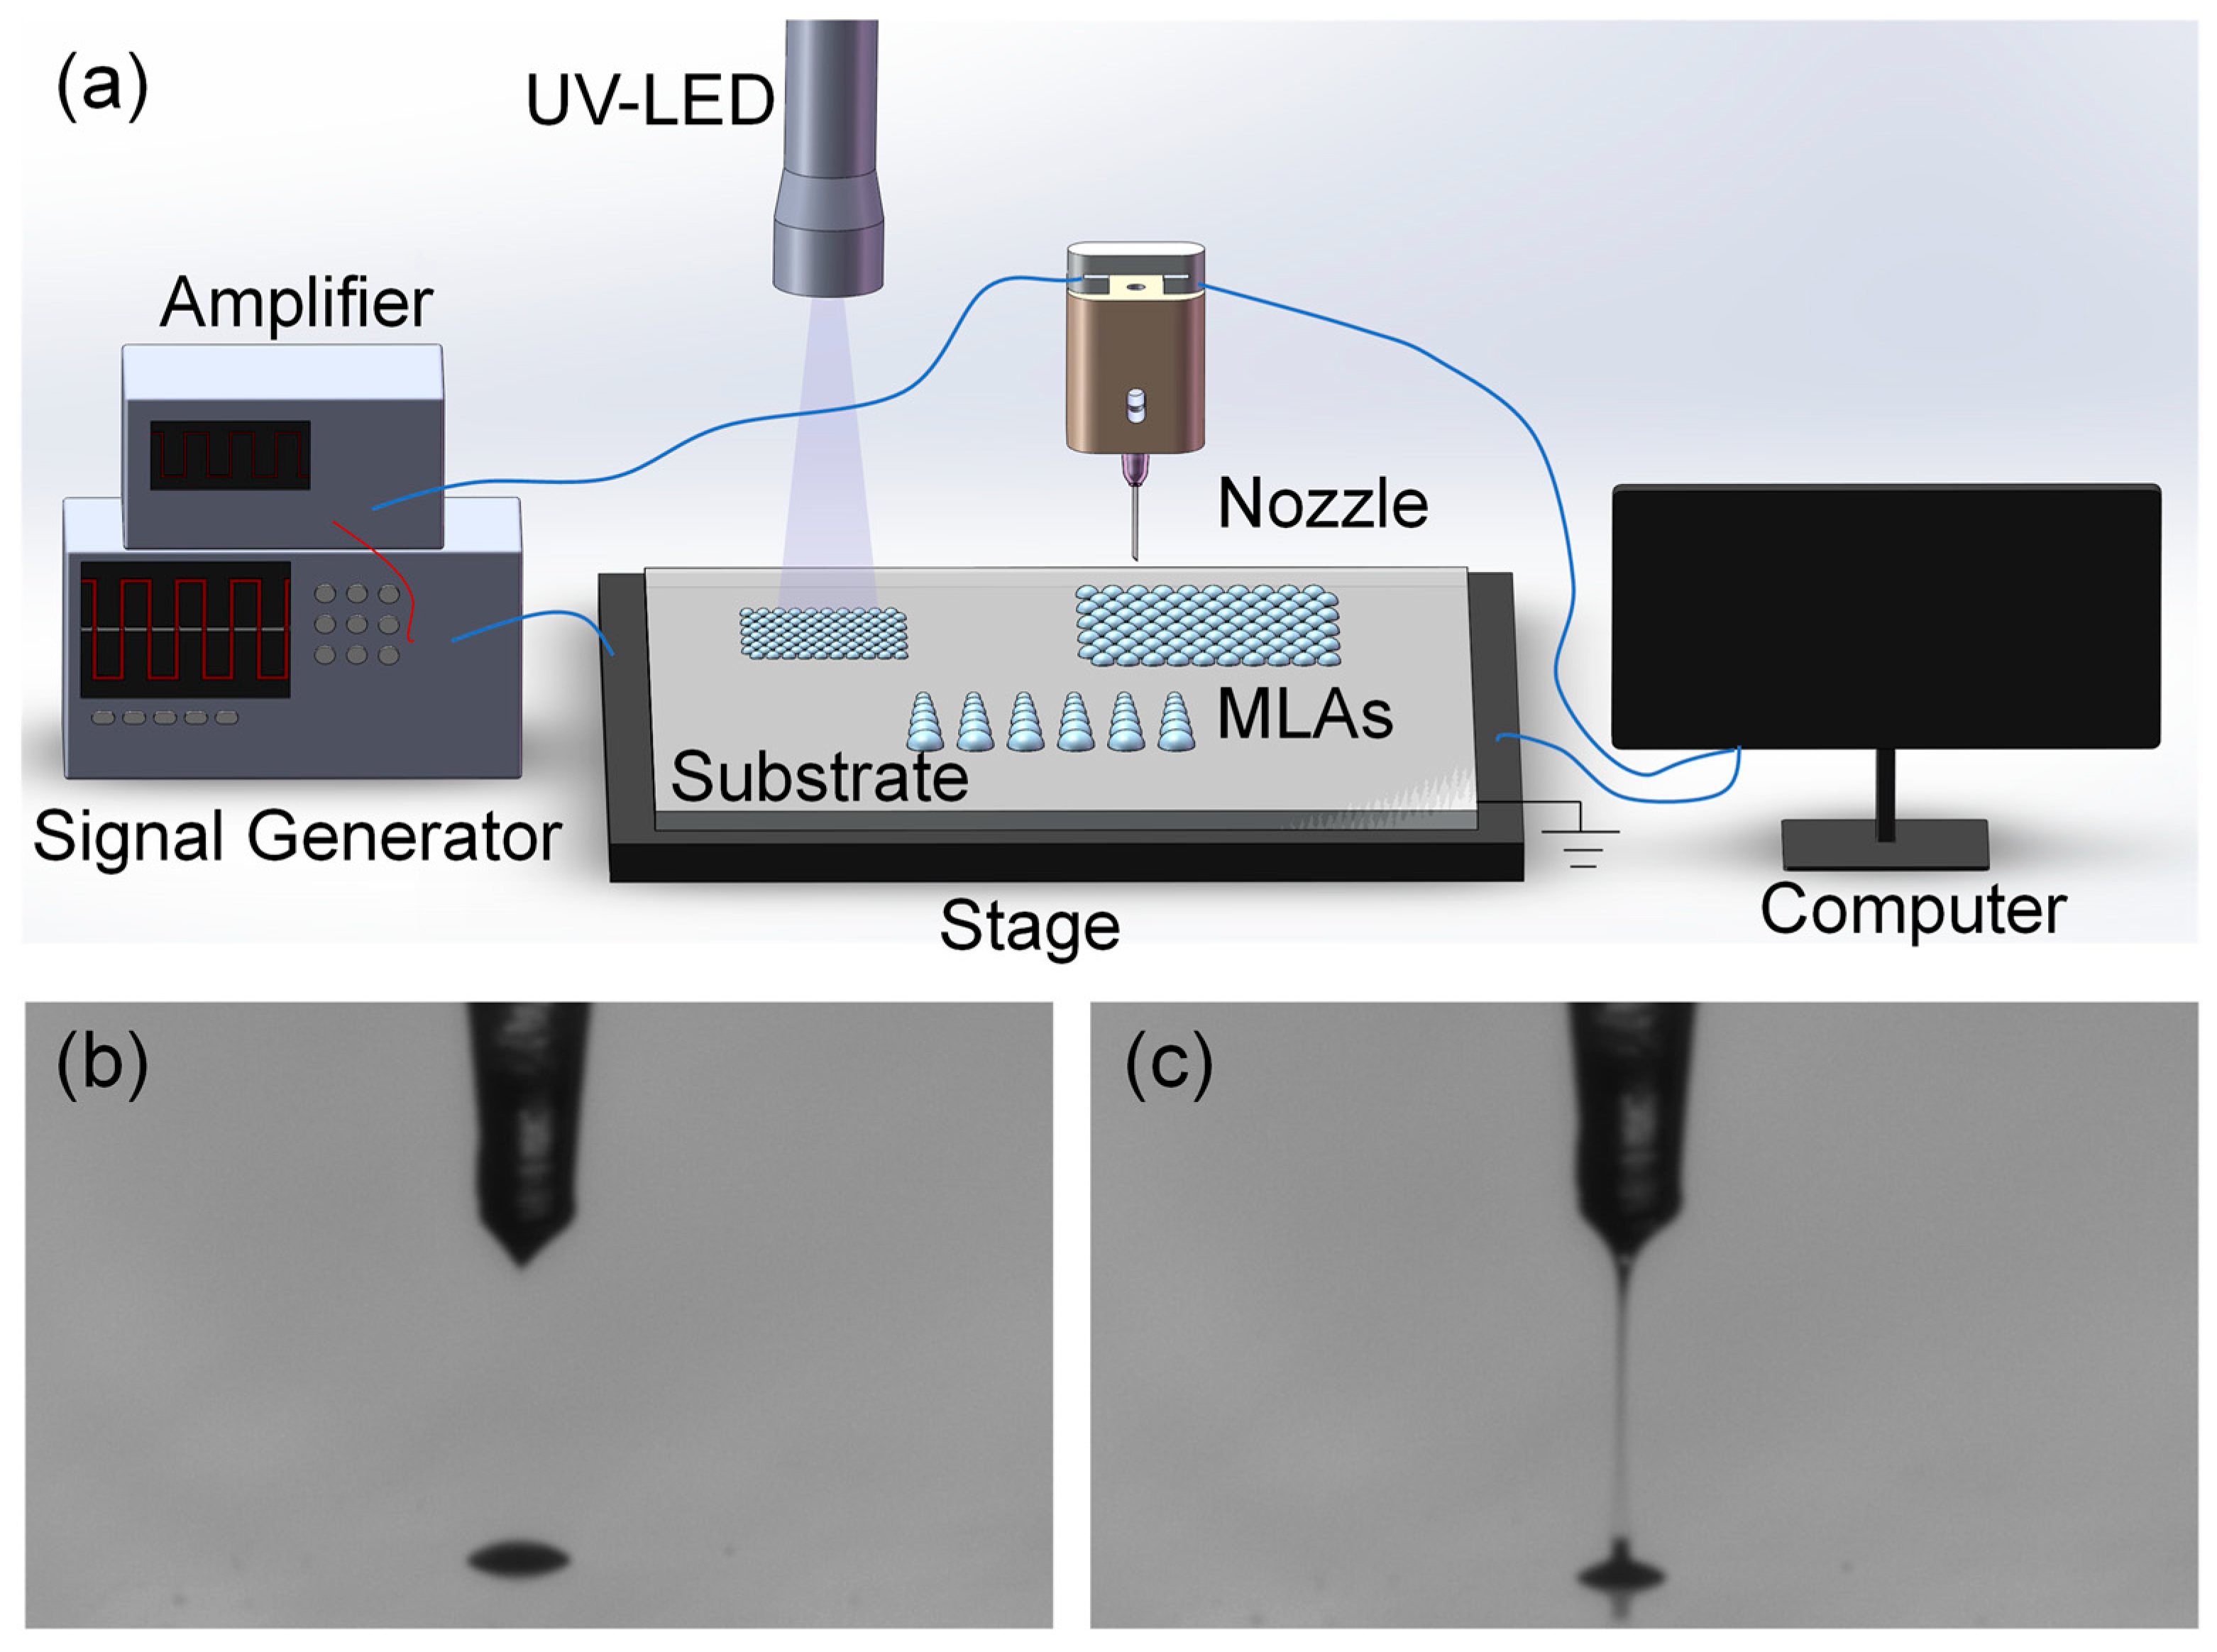
2.1. Experimental System

The MLAs were fabricated using an E-jet printing system (EHDJet-H, Guangdong Sygole Intelligent Technology Co., Ltd., Dongguan, China). In this system, the substrate was placed on a high-precision x-y-z translation stage, and the UV-curable optical adhesive was sprayed on the substrate by a nozzle above the substrate. An electrical pulse generated from a signal generator (33500B, Keysight, CO, USA) and then amplified by a voltage amplifier (HVA-103NP6, Tjshenghuo Co. Ltd., Tianjin, China) was applied in between the substrate and the nozzle. An imaging system consisting of a tilted camera (acA2500, Basler, Ahrensburg, Germany) and a white light source was used to observe the printing process in real-time.

2.2. MLAs Fabrication

The fabrication processes of MLAs consist of three steps: (1) preparation of the substrate, (2) E-jet printing of MLAs, and (3) UV curing of MLAs, as follows:
(1)
The glass slides were selected as the substrate in our experiments. They were ultrasonically cleaned with acetone and isopropyl alcohol for 15 min, respectively. Then, the glass slides were dried with nitrogen gas and UVO treatment for 20 min;
(2)
The UV-curing optical adhesives NOA 61, NOA 63, and NOA 68 (all from Norland Products, Inc., Jamesburg, NJ, USA) were used to print MLAs with a square wave electrical pulse (DC bias: 580 V, amplitude: 200 V, frequency: 100 Hz, duty cycle: 60%);
(3)
When the E-jet printing process was completed, the printed MLAs were cured by a UV-LED (wavelength: 365 nm, exposure intensity: 100 mW/cm2).
In particular, for the E-jet printing of MLAs, we conducted a series of experiments to determine the optimal printing parameters. First, to print microlenses accurately, we selected the nozzle with an inner diameter of 15 μm. Second, the height of the nozzle determines the status of the liquid droplet when it falls onto the substrate. To avoid excessive impact or premature atomization when it falls onto the substrate, and to prevent the microlens height from being greater than the nozzle height and causing the liquid to adhere to the outer surface of the nozzle, we set the nozzle height within the range of 75–100 μm. In our experiment, the nozzle height was optimized to be 85 μm. Third, an appropriate base voltage is necessary to ensure the smooth falling of droplets and avoid uncontrolled continuous spraying. We gradually increased the applied base voltage from 500 V to 580 V, at which the droplets reach the desired state. Then, we applied a bias voltage of 200 V to ensure that the liquid droplet can fall smoothly onto the substrate. The frequency and duty cycle were set as system default parameters.

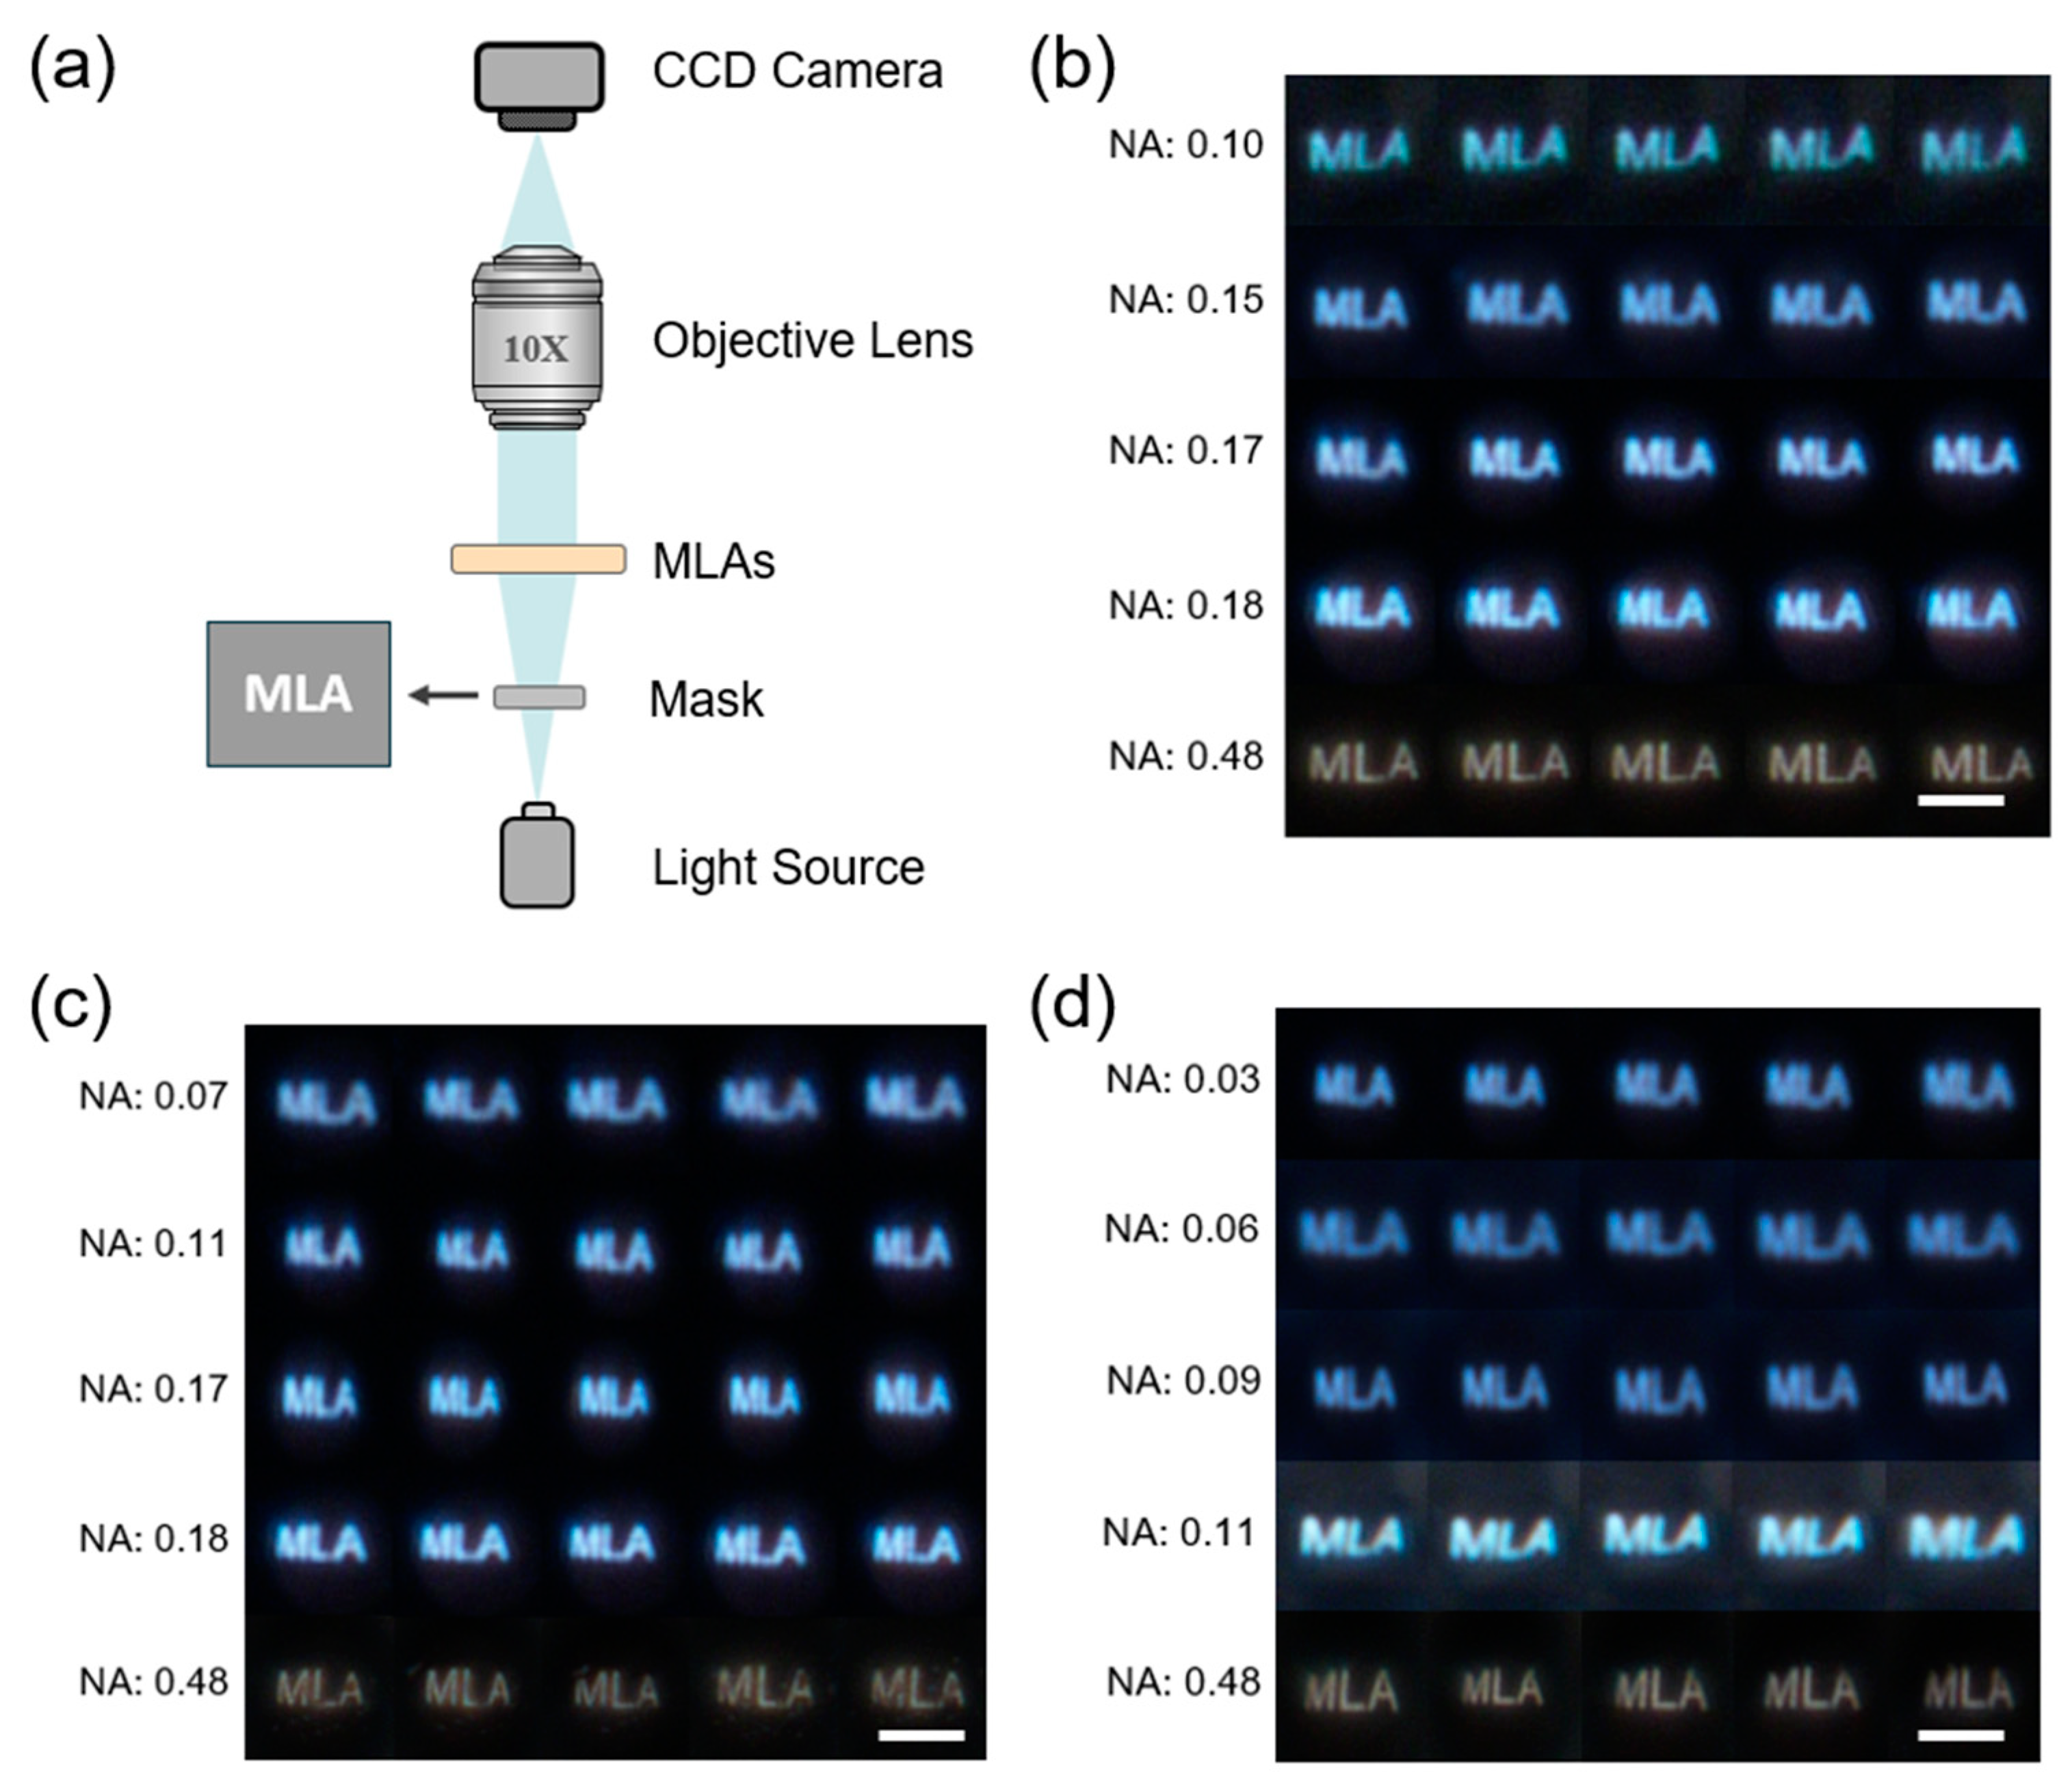
2.3. Characterization and Measurement

The contact angle of the substrate and the surface tension were measured using the drop-shape analyzer (DSA25S, KRÜSS, Hamburg, Germany). The cross-sectional profiles of the printed MLAs were characterized using a surface profiler (Tencor P-7, KLA, CA., USA). The focusing properties of MLAs were characterized using a confocal optical microscope system (Ahpha300, WITec, Ulm, Germany). A 532 nm semiconductor laser (MW-GL-532, Changchun Laser Optoelectronics Technology Co., Ltd., Changchun, China) beam was collimated and then illuminated from the substrate side. The focusing and imaging effects of different MLAs were collected by an objective (50×, 0.75) and observed by a CCD camera. The mask was prepared by a laser marking machine and then a microscope (ECLIPSE Ci-POL, Nikon, Tokyo, Japan) was used to characterize the imaging performance.

3. Results and Discussion

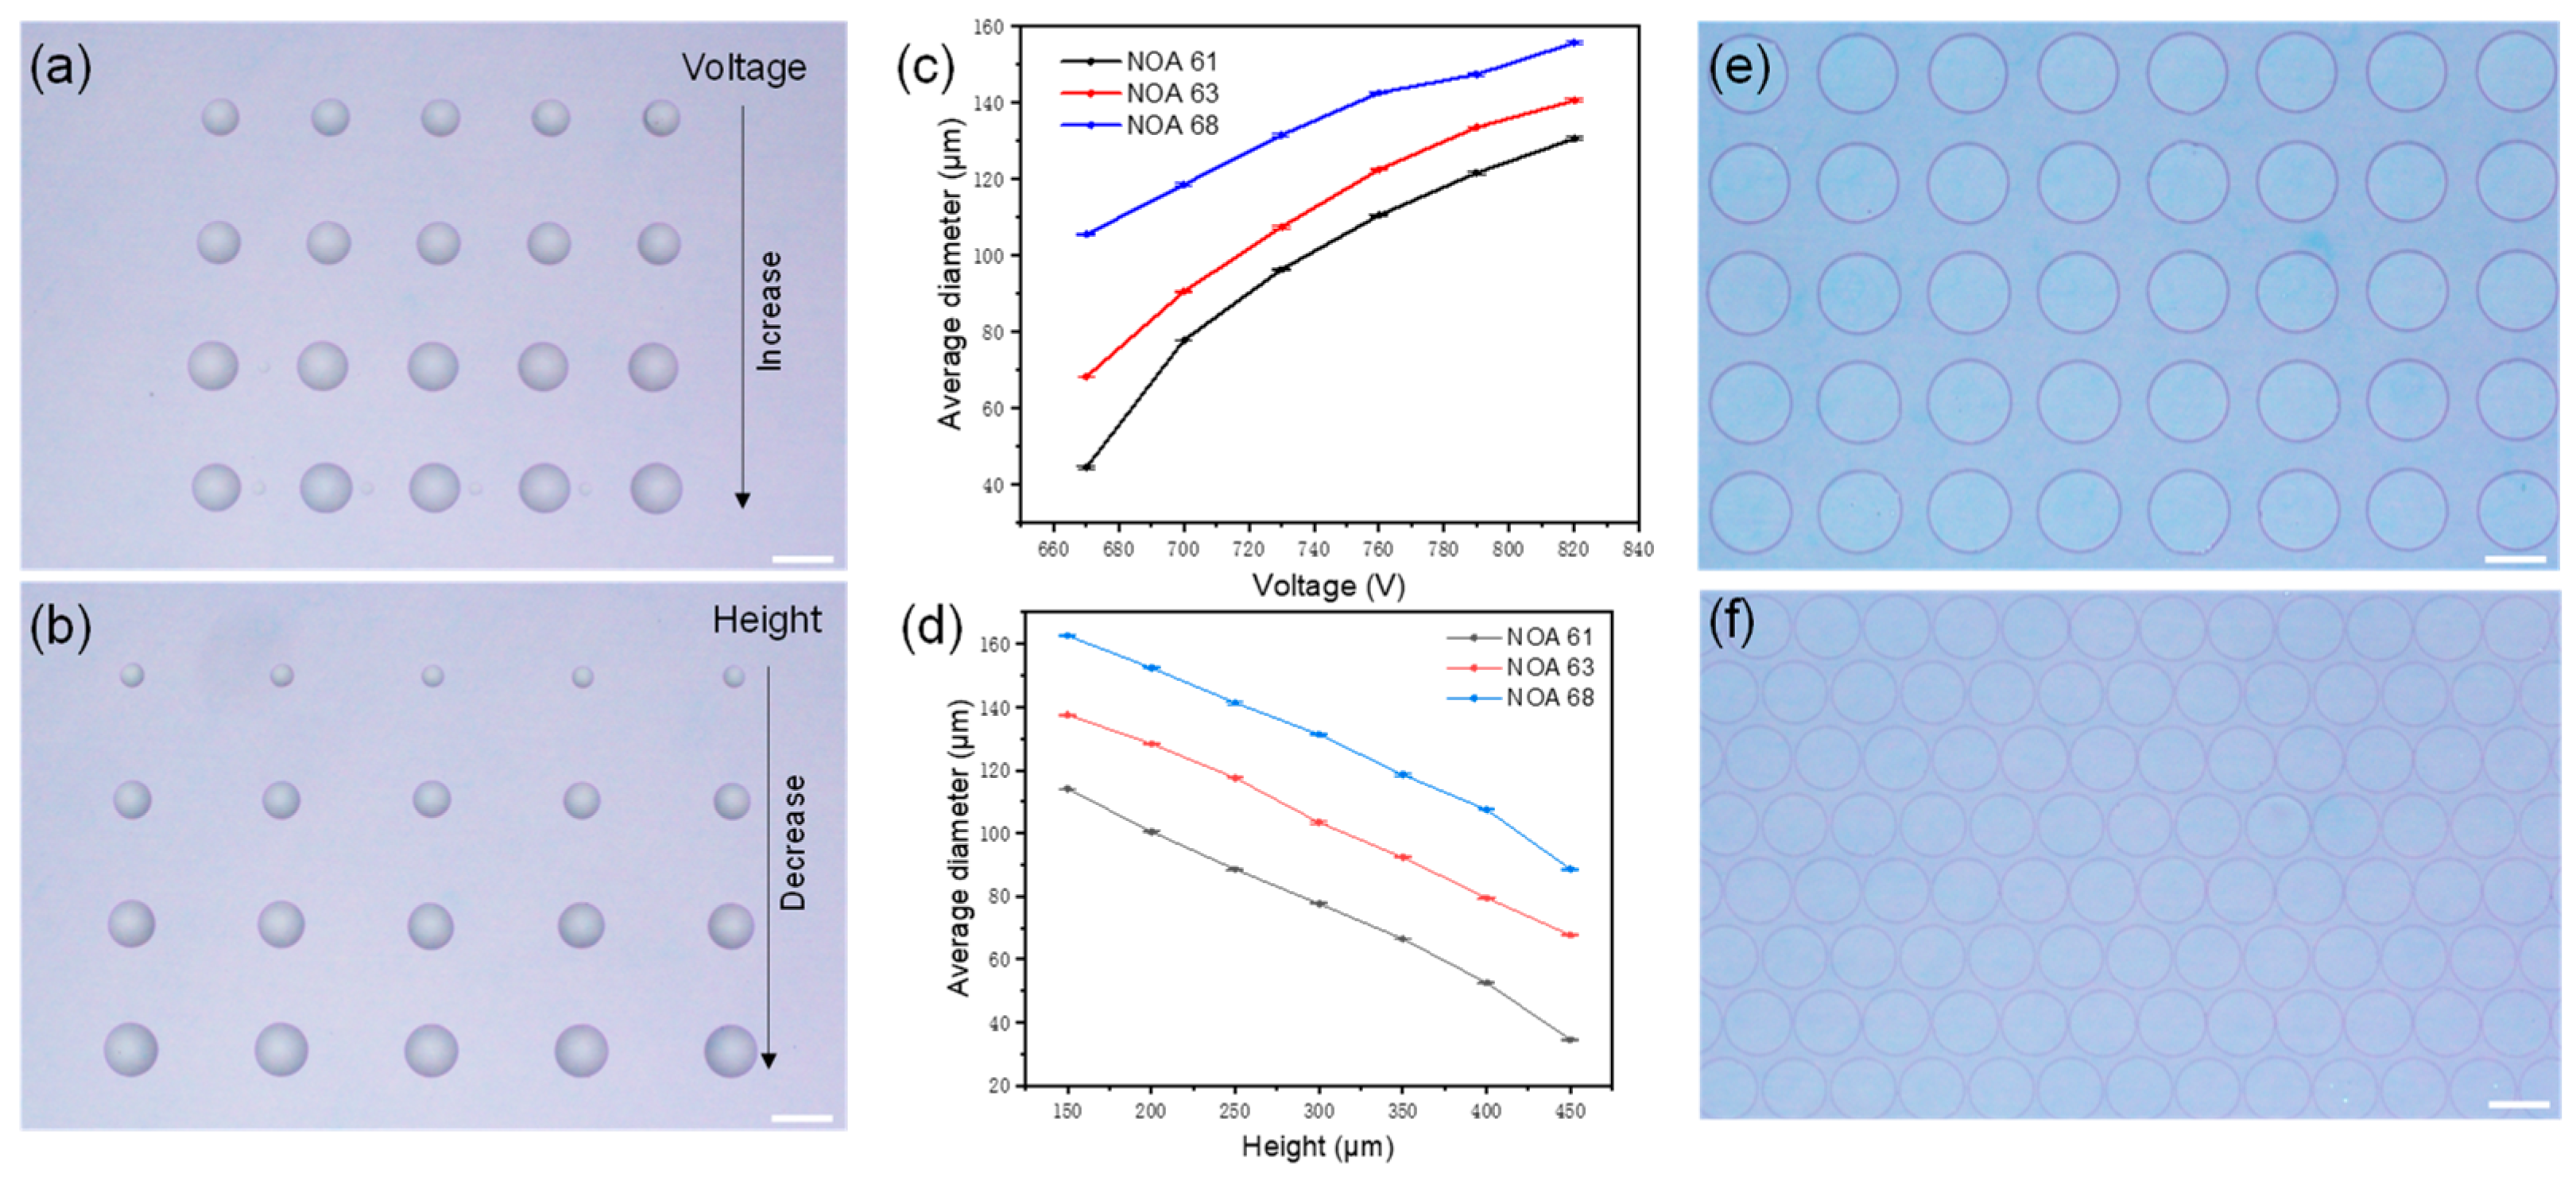
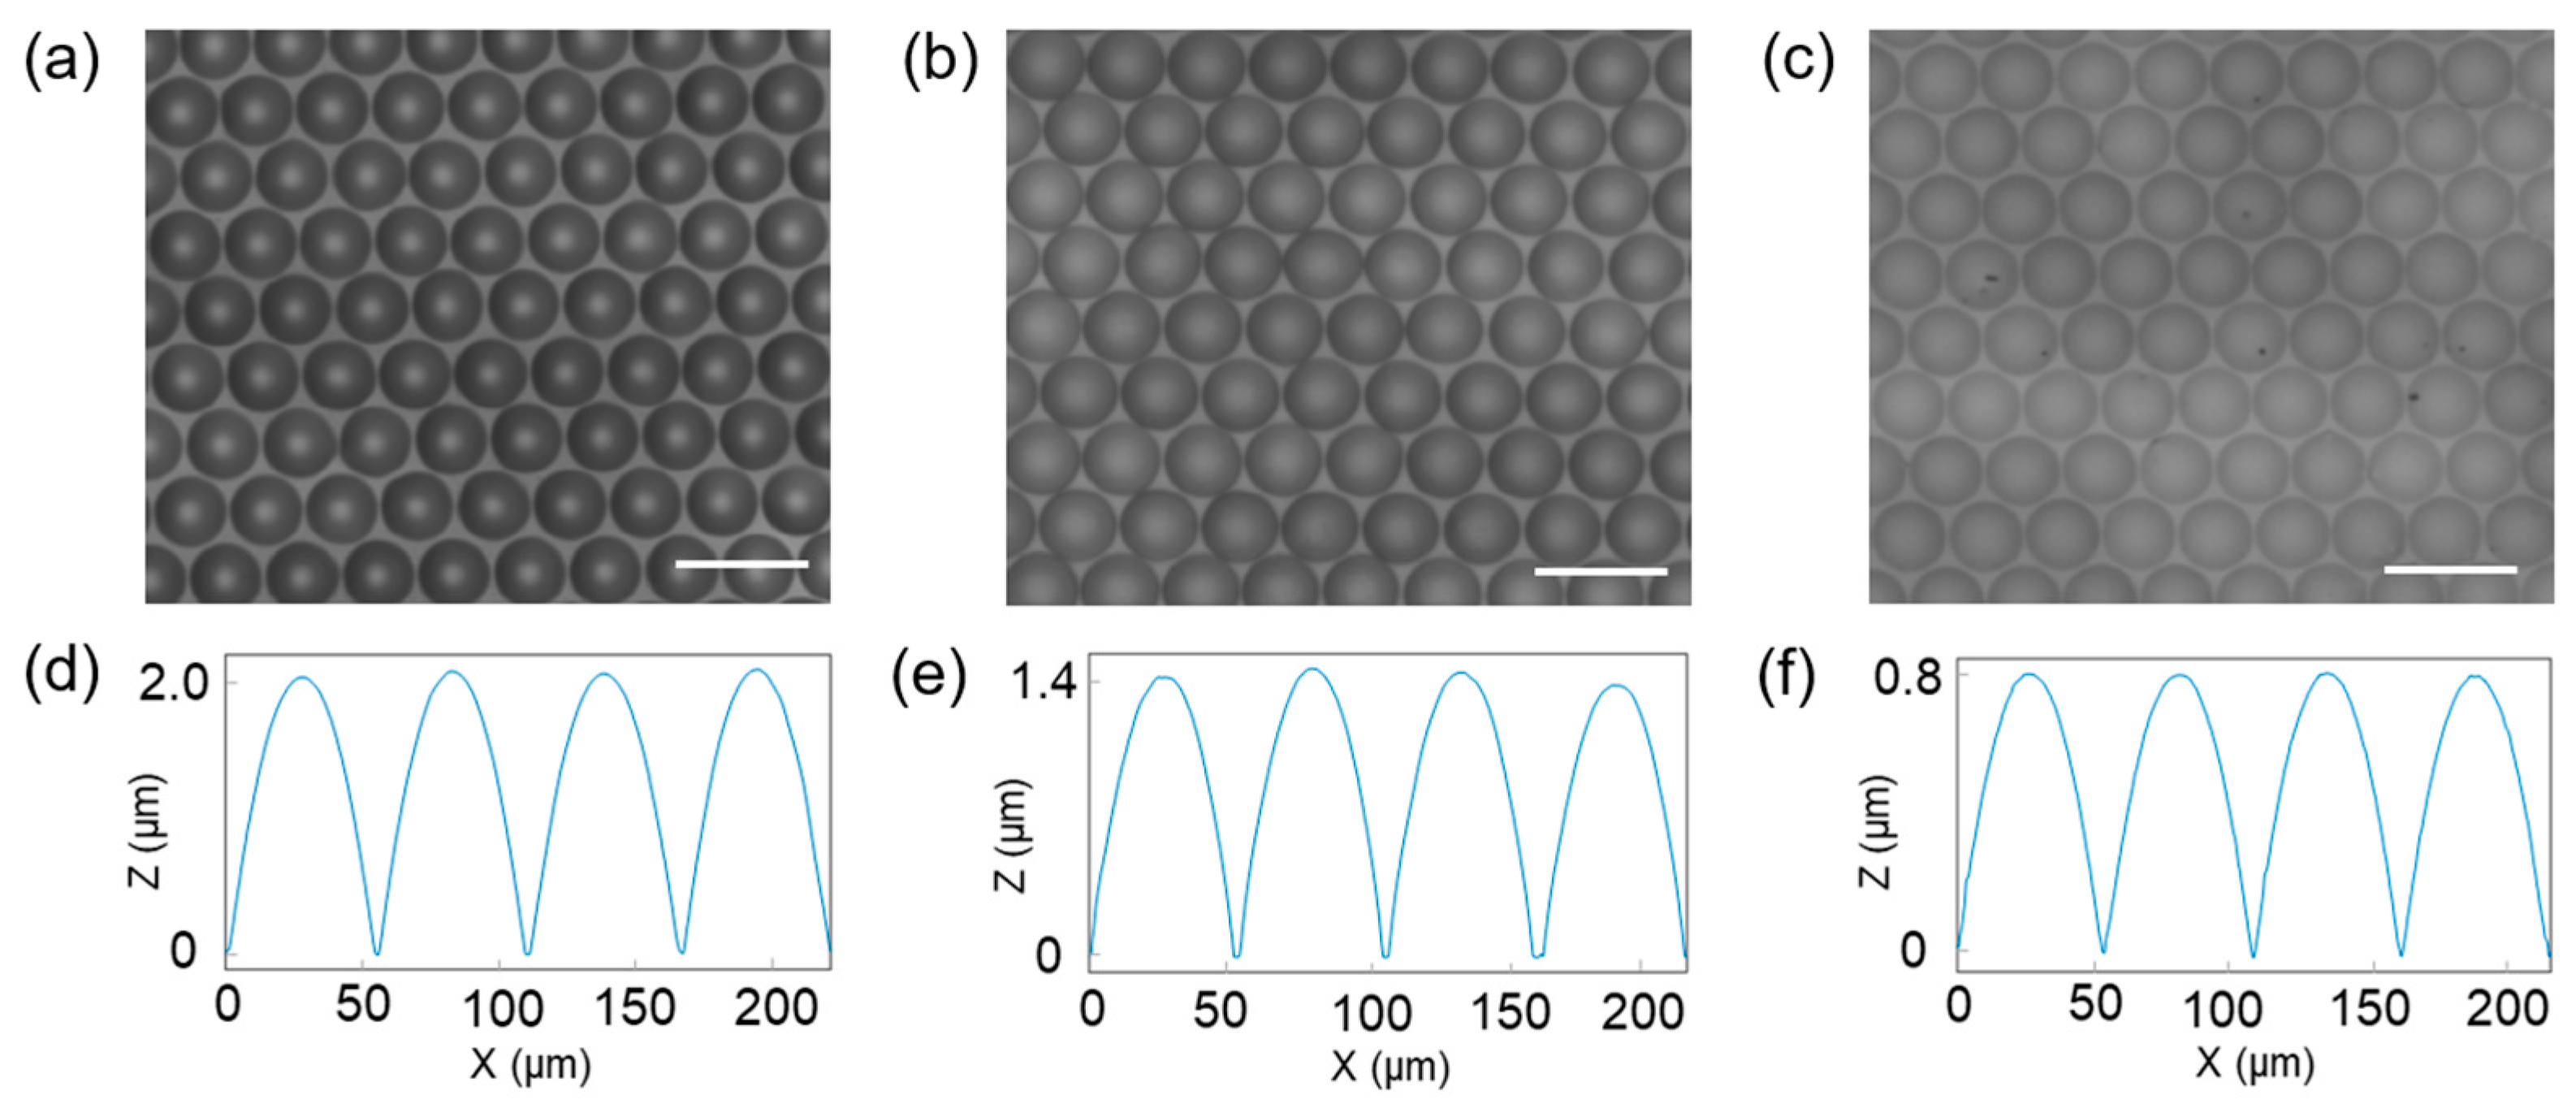
3.1. Fabrication of MLAs

The E-jet printing system is schematically shown in Figure 1a. When a high DC bias voltage is applied between the nozzle and the substrate, the printing ink will accumulate and form as a meniscus, and the meniscus becomes a cone under the action of an electric field, known as “Taylor cone” [40] (Figure 1b). When the electrostatic force overcomes the capillary force and surface tension, the ink separates from the Taylor cone and falls down as a jet stream (Figure 1c). The size and velocity of the jet stream are closely related to the inner diameter of the nozzle, the height of the nozzle from the substrate, the amplitude of the applied voltage, and the properties of the ink, such as viscosity, elongation, and temperature range. As a result, the properties of the jet stream will greatly affect the profile of the printed MLAs.
In addition to the jet stream that affects the printing profile, the wetting properties of the substrate and the viscosity of the printing ink material will also play critical roles in forming the final profile of MLAs. The wetting properties of the substrate are governed by the surface energy, while the viscosity of the printing ink is the material’s intrinsic property. The surface energy of the substrate and the surface tension of the droplet can be indicated by the contact angle (CA). In our experiments, the CAs of the printing inks (i.e., NOA 61, NOA 63, and NOA 68) were measured, respectively, as shown in Figure 2. In this study, the wetting properties are mainly controlled by the UVO treatment. The treatment induces a photoelectrochemical oxidation reaction through the synergistic effect of UV light and ozone [41]: high-energy UV photons directly break the surface chemical bonds (such as C-H, Si-CH3) of materials, generating active sites and decomposing ozone to produce reactive oxygen species [O(¹D), O₂⁻, etc.], which then oxidize the material surface and introduce polar functional groups such as hydroxyl (-OH) and carboxyl (-COOH), significantly improving surface energy and hydrophilicity. In addition, the UVO treatment can degrade organic pollutants, create surface microstructures (such as increasing roughness), and may alter polymer crystallinity, promoting exposure of polar groups. The left and right columns in Figure 2a–c show the CA changes before and after UVO treatment. It can be clearly seen that after UVO treatment, the CA decreases regardless of the optical adhesives, indicating increased hydrophilicity and ductility. Comparatively, among these three optical adhesives, NOA 68 and NOA 61 have the highest and lowest hydrophilicity, respectively. UVO treatment plays an important role in enhancing the hydrophilicity of the substrate surface. The CA as a function of the UVO treatment time is summarized in Figure 2d. The CA gradually decreases and eventually becomes stable with the increase in UVO treatment time, indicating gradually increased hydrophilicity of the substrate surface. For the sake of comparison, we selected the UVO treatment time of 20 min for subsequent experiments. It is worth mentioning that the CA comparison test was carried out under the same volume of liquid.
In order to control the MLA morphology precisely, it is necessary to explore the relationship between the diffusion time, the CA, the radius, the curvature radius and the height of the droplet. In the MLA printing process, when each individual droplet falls on the substrate, it will start to diffuse. Assuming that the number of the microlenses in the array is N, the printing period is T, the diffusion time of the droplets will be (N − 1)T, (N − 2)T, (N − 3)T, …, T, 0 when the last drop falls on the substrate. As shown in Figure 3, the droplet can be regarded as a spherical cap, and its volume is:
V = V ( R , h ) = π h 2 R ( 1 h 3 R )
where h is the droplet height, and R is the curvature radius. Normally, h/3R 1, so Equation (1) can be simplified as:
V = V ( R , h ) = π h 2 R
Although all the parameters including the droplet radius r, the contact angle θ, the height h, and the curvature radius R change with time during the diffusion process, the droplet volume remains a constant, that is:
V 0 = π h 2 R
By analyzing the relationship between r, h, R, and θ, the following relationship can be obtained:
r ( θ ) = V 0 π sin 3 θ ( 1 cos θ ) 2 3
h ( θ ) = V 0 π ( 1 cos θ ) 3
R ( θ ) = V 0 π 1 ( 1 cos θ ) 2 3
In previous studies [42], researchers have found that droplets possess the highest flow velocity when they first fall and then gradually decay. The closer they are to equilibrium, the lower the flow velocity is until they reach equilibrium. Therefore, the relationship between CA and time can be described as [14,42]:
cos θ t = 1 e γ l v η δ t cos θ Y + e γ l v η δ t cos θ 0
where γlv is the liquid–gas surface tension, η is the viscosity, δ is the unit fluid width, θY is the steady state CA determined by Young’s equation, and θ0 is the initial CA.
In addition, based on the above conditions, the focal length of each microlens can be calculated via the following equation,
f = h 2 + D 2 / 4 2 h ( n 1 )
where n is the refractive index of the UV-curable adhesive. By substituting the measured CA from Figure 2 into Equations (4) and (5), one can then obtain the droplet radius r, the height h, and finally the focal length f with Equation (8).
Experimentally, the size of each individual microlens can be adjusted by changing the amplitude of the applied voltage, the height of the nozzle, and the printing time when the other conditions are fixed. We used NOA 68 to explore the relationship between relevant parameters. As shown in Figure 4a, when the applied voltage increases, the diameter of the microlens tends to become large. Similarly, when the other parameters are fixed, a decrease in the nozzle height will also cause the microlens diameter to increase (see Figure 4b). Therefore, we studied the microlens size as functions of these two major influencing factors in the printing process, as shown in Figure 4c,d. We also conducted multiple sets of repeated experiments under the fixed experimental conditions and subsequently plotted the error bar by calculating the average and standard deviation of the microlens diameter. The obtained standard deviations for microlenses prepared by NOA 61, NOA 63, and NOA 68 at different nozzle heights were 0.07–0.37, 0.1–0.41, and 0.23–0.41, respectively. Similarly, the standard deviations at different applied voltages were 0.1–0.36, 0.12–0.4, and 0.24–0.41, respectively. These results indicate high consistency of the E-jet printing process. As a result, one can conveniently adjust the size of the microlens according to the experimentally achieved curves. It is worth noting that small satellite droplets around the printed microlenses might be produced during the E-jet printing process due to certain instability of the system. In addition, the falling location of the ink droplets from the nozzle might also slightly deviate from the pre-determined position. Due to the position deviation, the gap distance between the adjacent microlenses may increase at one side and decrease at the other side. The narrowing of the gap distance may cause coalescence of two adjacent microlenses. Therefore, it is essential to optimize the printing parameters of the E-jet system. In our experiments, we used the following optimized parameters to print MLAs: the DC base voltage of 800 V (Figure 4e) and 760 V (Figure 4f), the applied bias voltage of 200 V, the frequency of 100 Hz, and the duty cycle of 60%. Figure 4e,f shows the optical microscope images of the printed MLAs with square and hexagonal arrangements, which clearly confirm highly uniform patterns and consistent profiles.
For MLAs, the filling factor plays a critical role in achieving high-performance optical imaging and sensing systems. Therefore, we further investigated how to achieve high filling factor MLAs with hexagonal arrangement. In our experiments, we printed hexagonal MLAs using the three optical adhesives. The following optimized parameters were used to print high filling factor MLAs: the DC base voltage of 580 V, the applied bias voltage of 200 V, the frequency of 100 Hz, and the duty cycle of 60%. Figure 5 shows the top-view optical microscope images (see Figure 5a–c) and corresponding cross-sectional profiles (see Figure 5d–f) of the printed MLAs. Both the top and cross-sectional views confirm high uniformity of the printed MLAs. By putting the cross-section profiles of each individual microlens from three different MLAs (see Figure 6), we can clearly observe that they have almost the same size of ~27.3 μm in diameter but very different heights. The heights of them with NOA 68, NOA 63, and NOA 61 optical adhesives were 0.8, 1.4, and 2.0 μm, respectively. These obtained results under the same surface treatment of the substrates indicate subtle differences in viscosity and affinity of the optical adhesives. We have also fitted our microlenses’ profiles using parabolic equations. It can be seen from Figure 6 that the profiles of the printed microlenses using NOA 61, NOA 63, and NOA 68 can be perfectly fitted by the parabolic curves. The achieved root mean square (RMS) values of the parabolic fitting were 0.0088, 0.0174, and 0.0051, respectively. These results show that the printed microlenses are very close to the ideal parabolic shape, indicating better imaging quality of the microlenses.
From the images in Figure 5a–c, one can clearly observe that the microlenses get as close to each other as possible without coalescence. Furthermore, we calculated their filling factors. For these three printed MLAs with NOA 61, NOA 63, and NOA 68, their filling factors are calculated to be 80.41%, 77.26%, and 89.81%, respectively. The calculation method of the filling factor can be found in our previous report [14], and the calculation results are obtained after considering the edge effect. In particular, the printed MLA with NOA 68 has the filling factor that is very close to the theoretical limit of 90.7%. In a previous study, Zhang et al. achieved a high filling factor of 88% through secondary printing, reducing the coalescence between adjacent microlenses via interval printing curing [43]. In this study, we only used a single-step printing process to achieve a high-density MLA with the filling factor of ~90%, greatly reducing the fabrication complexity.

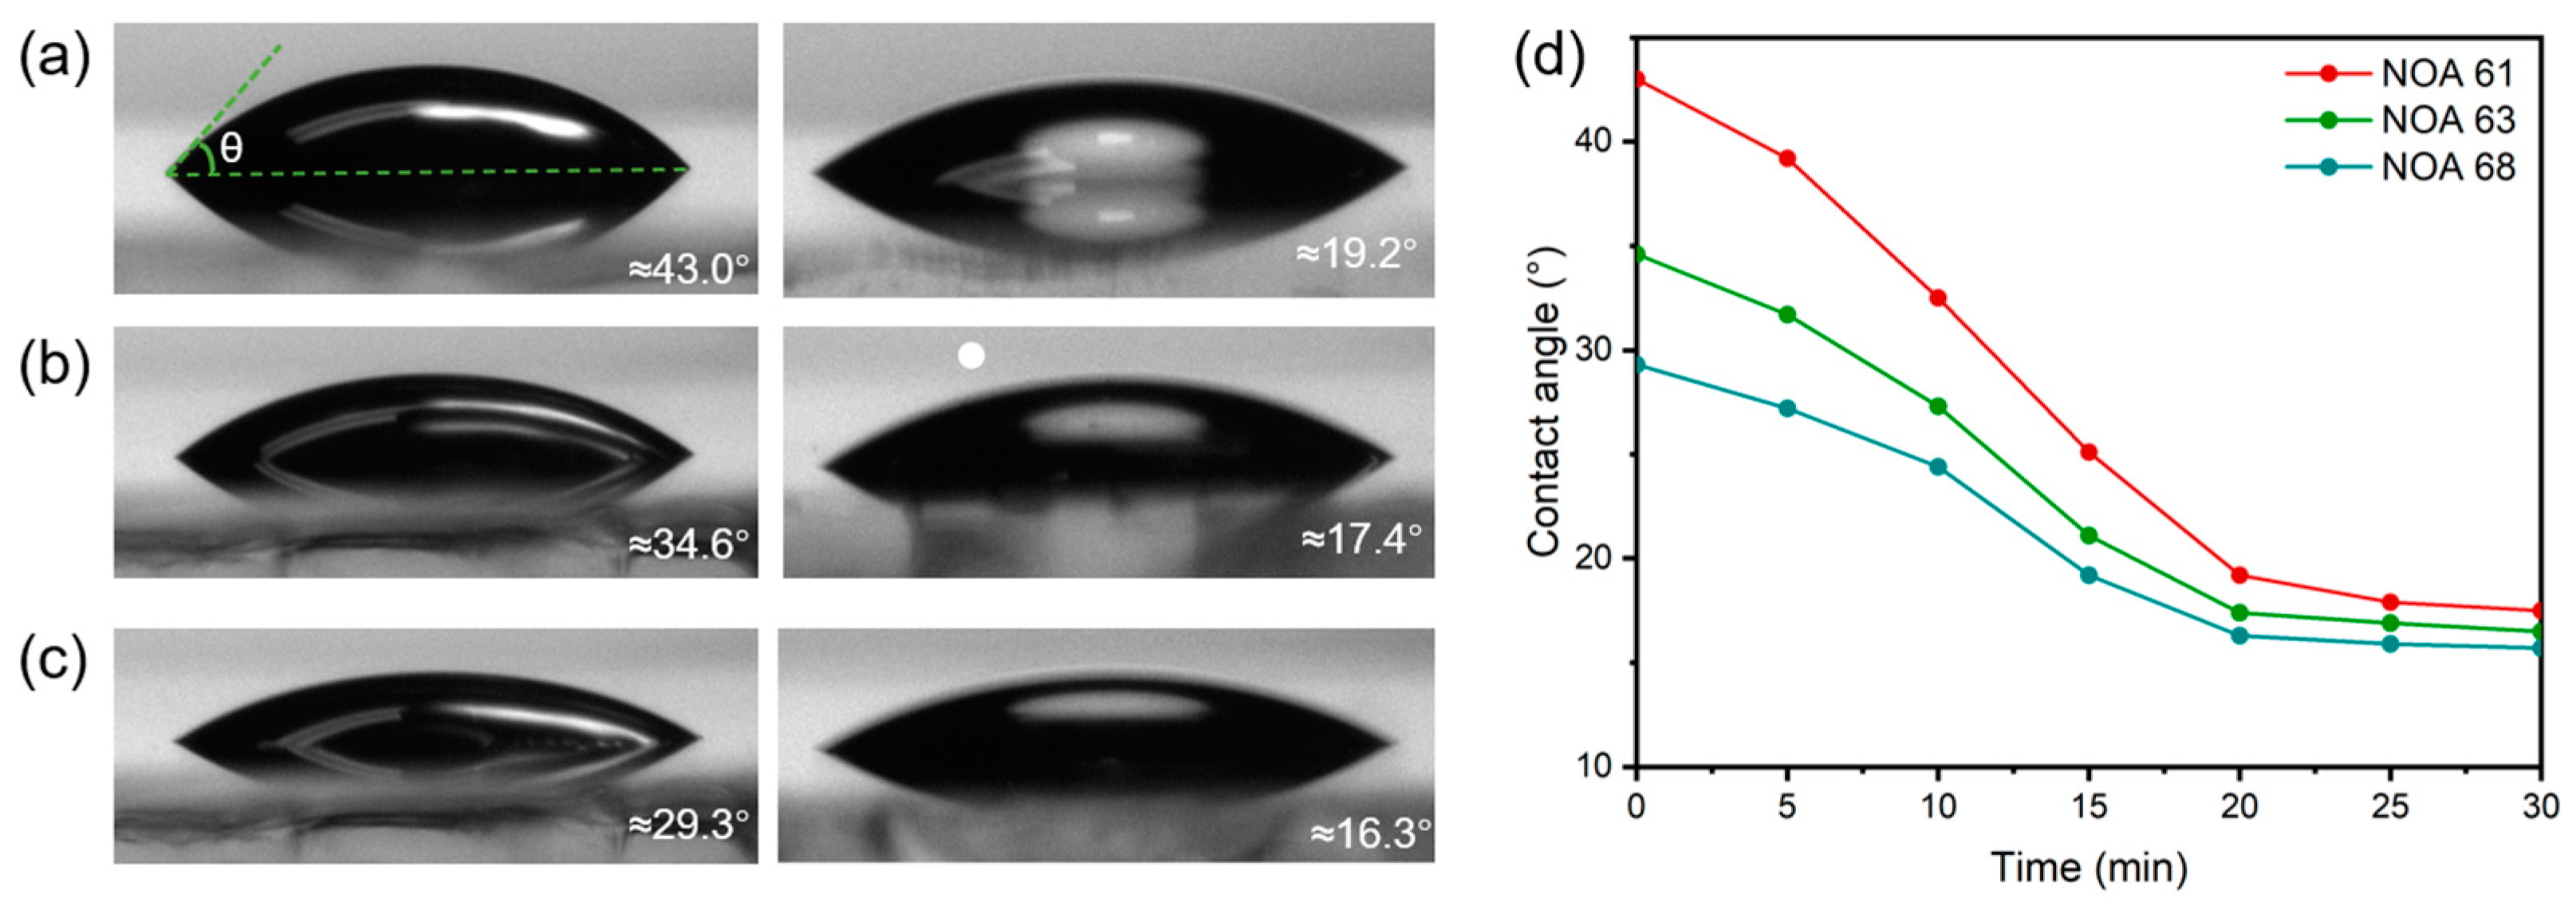
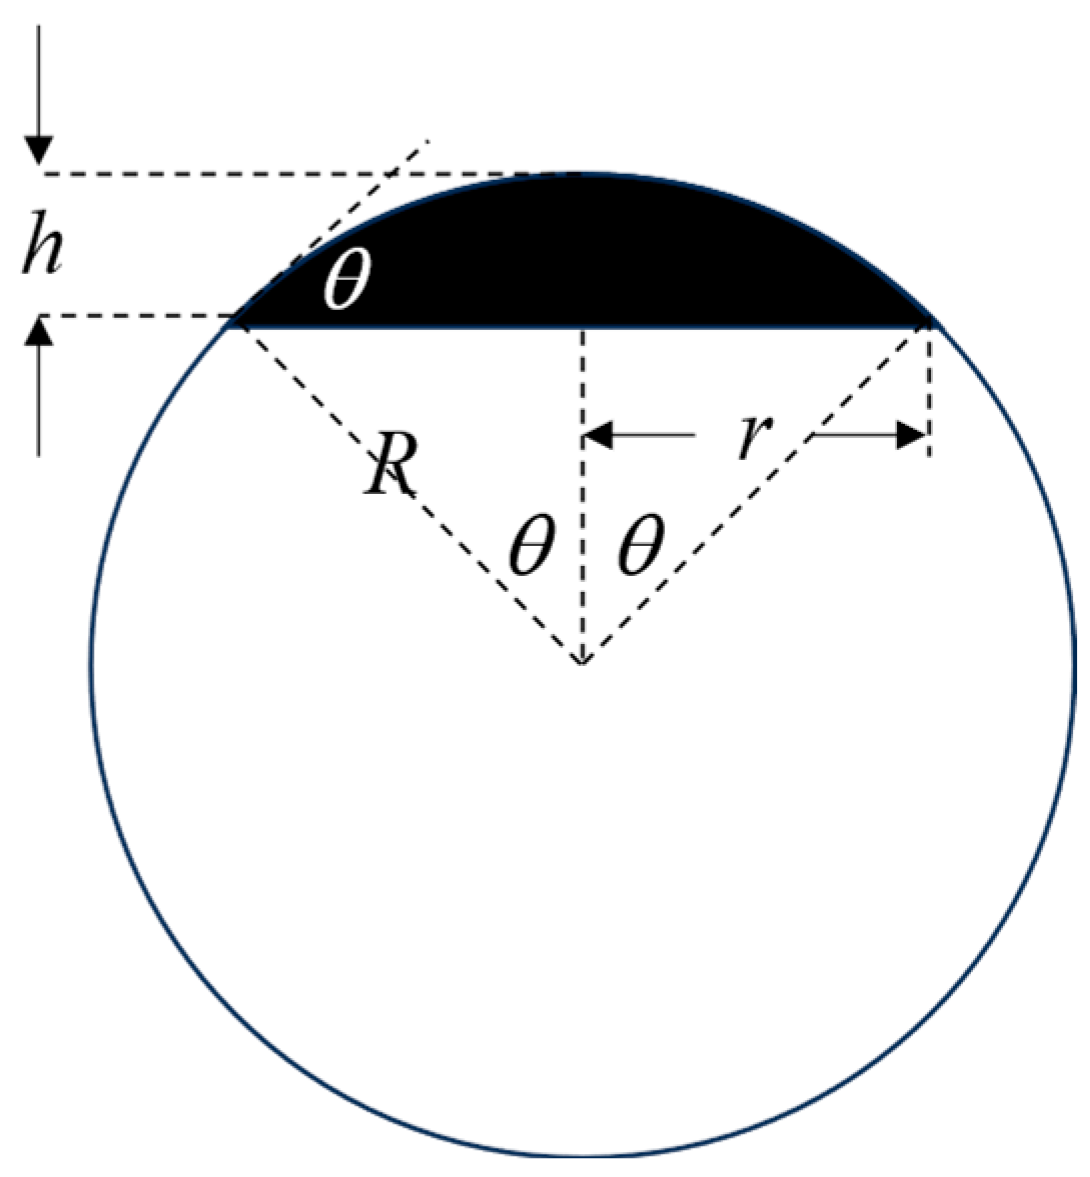
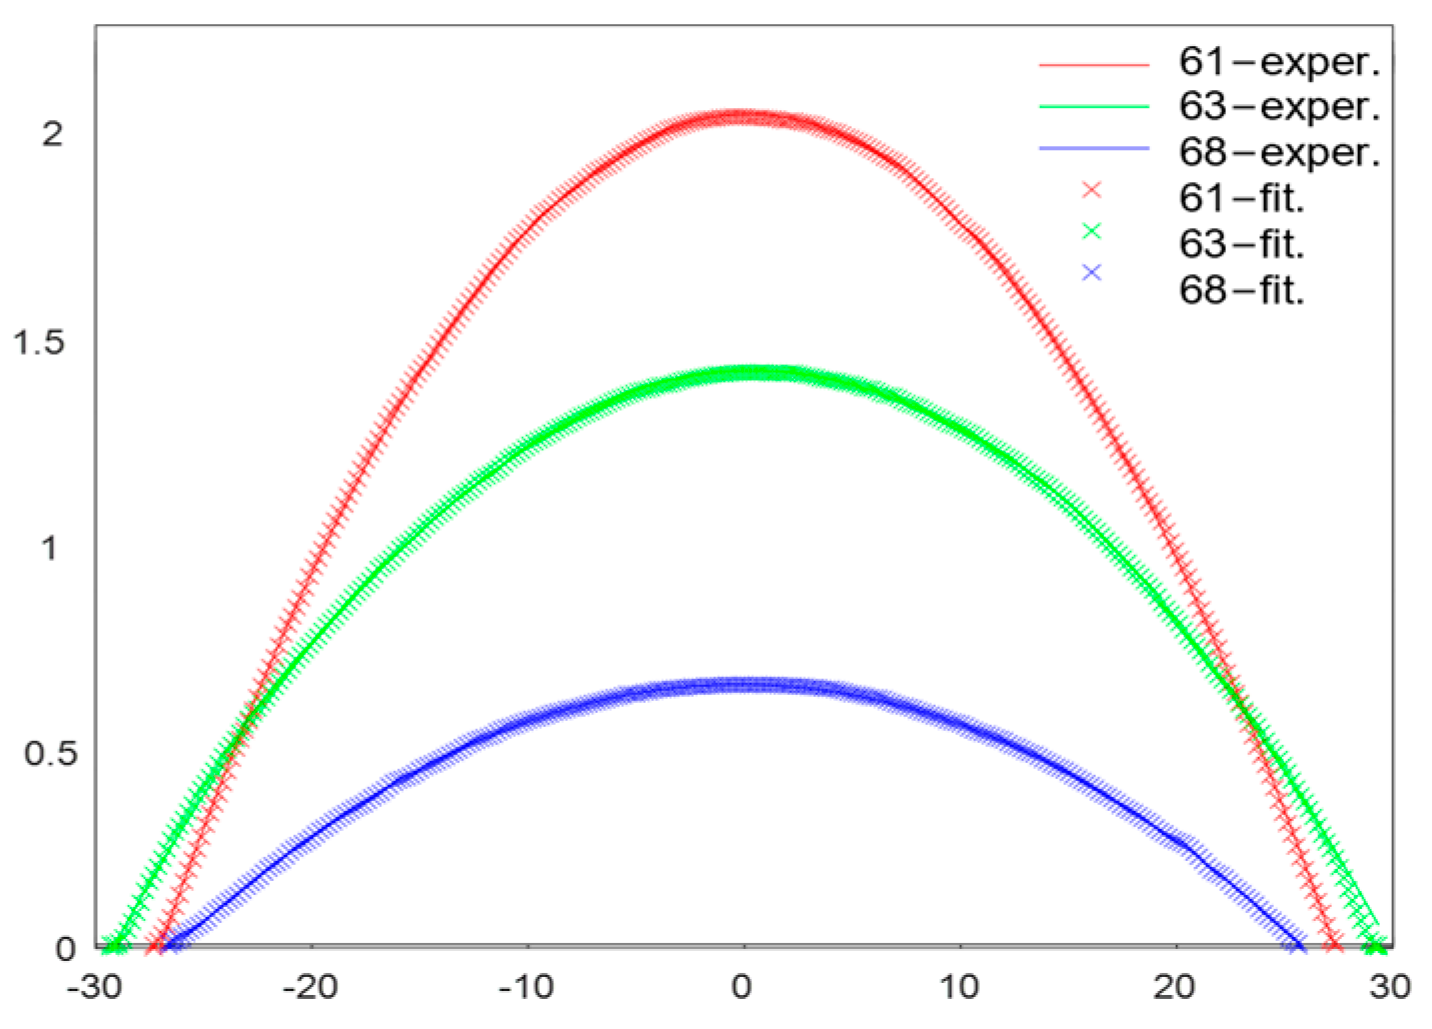
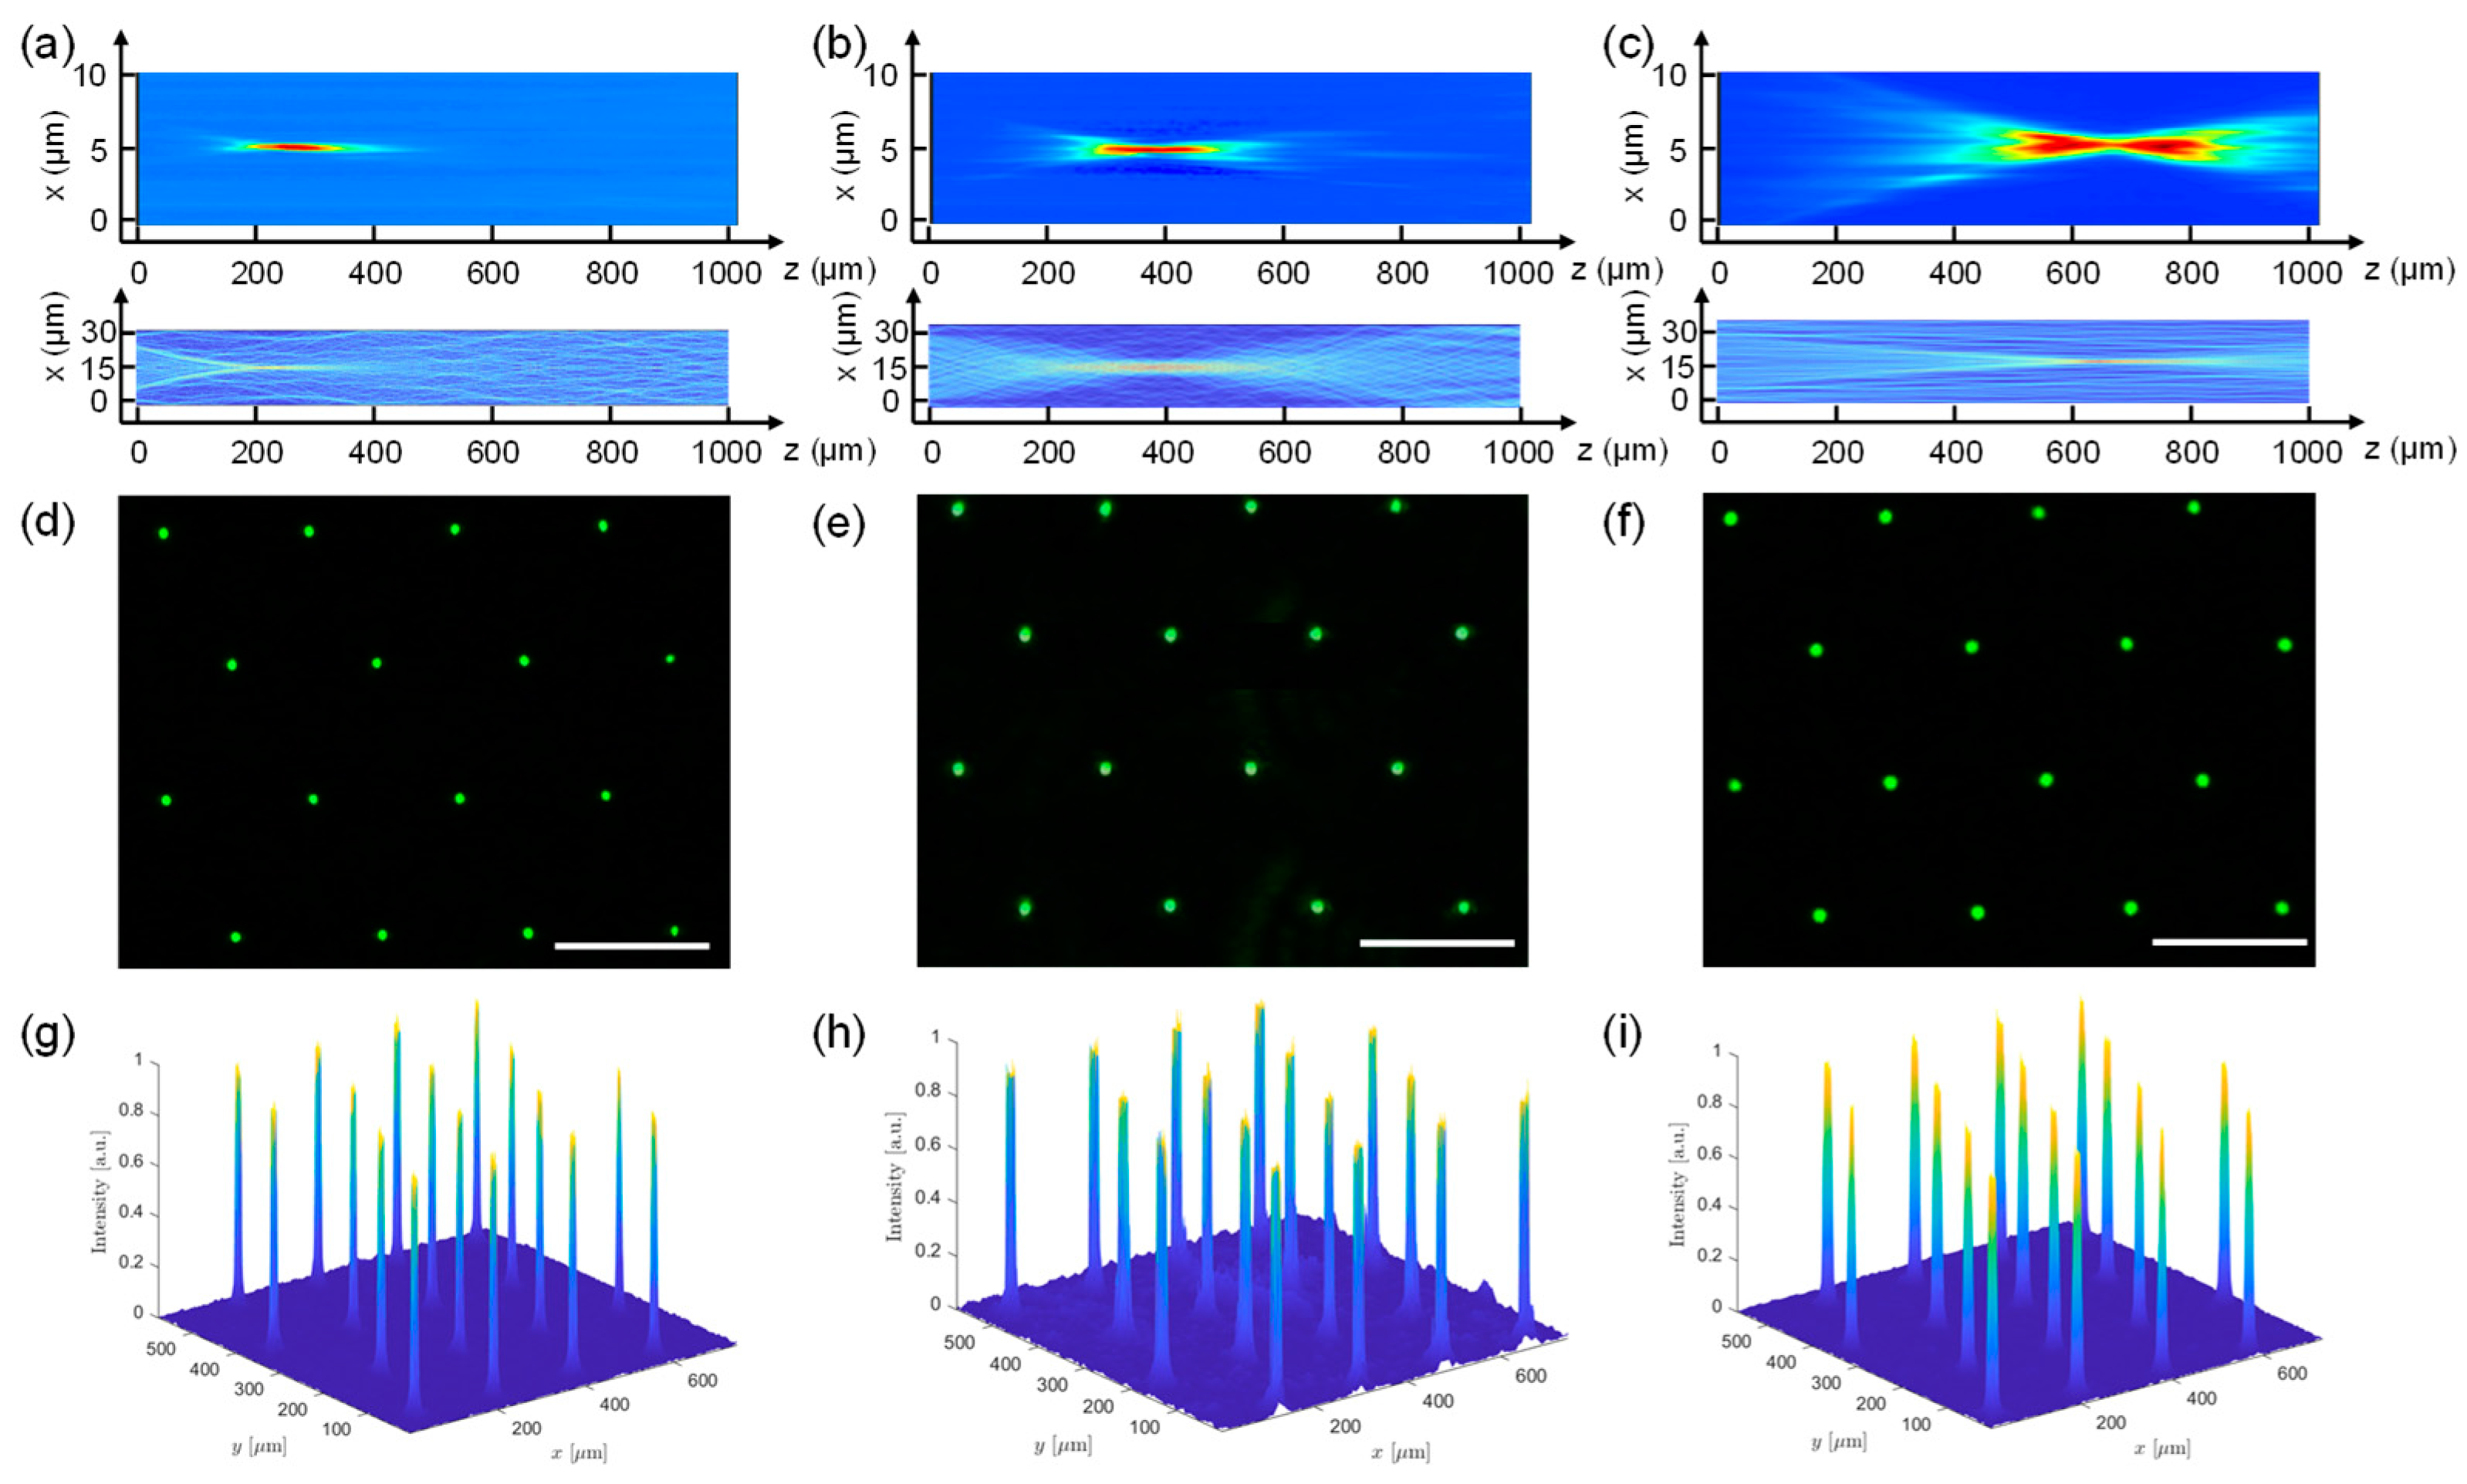
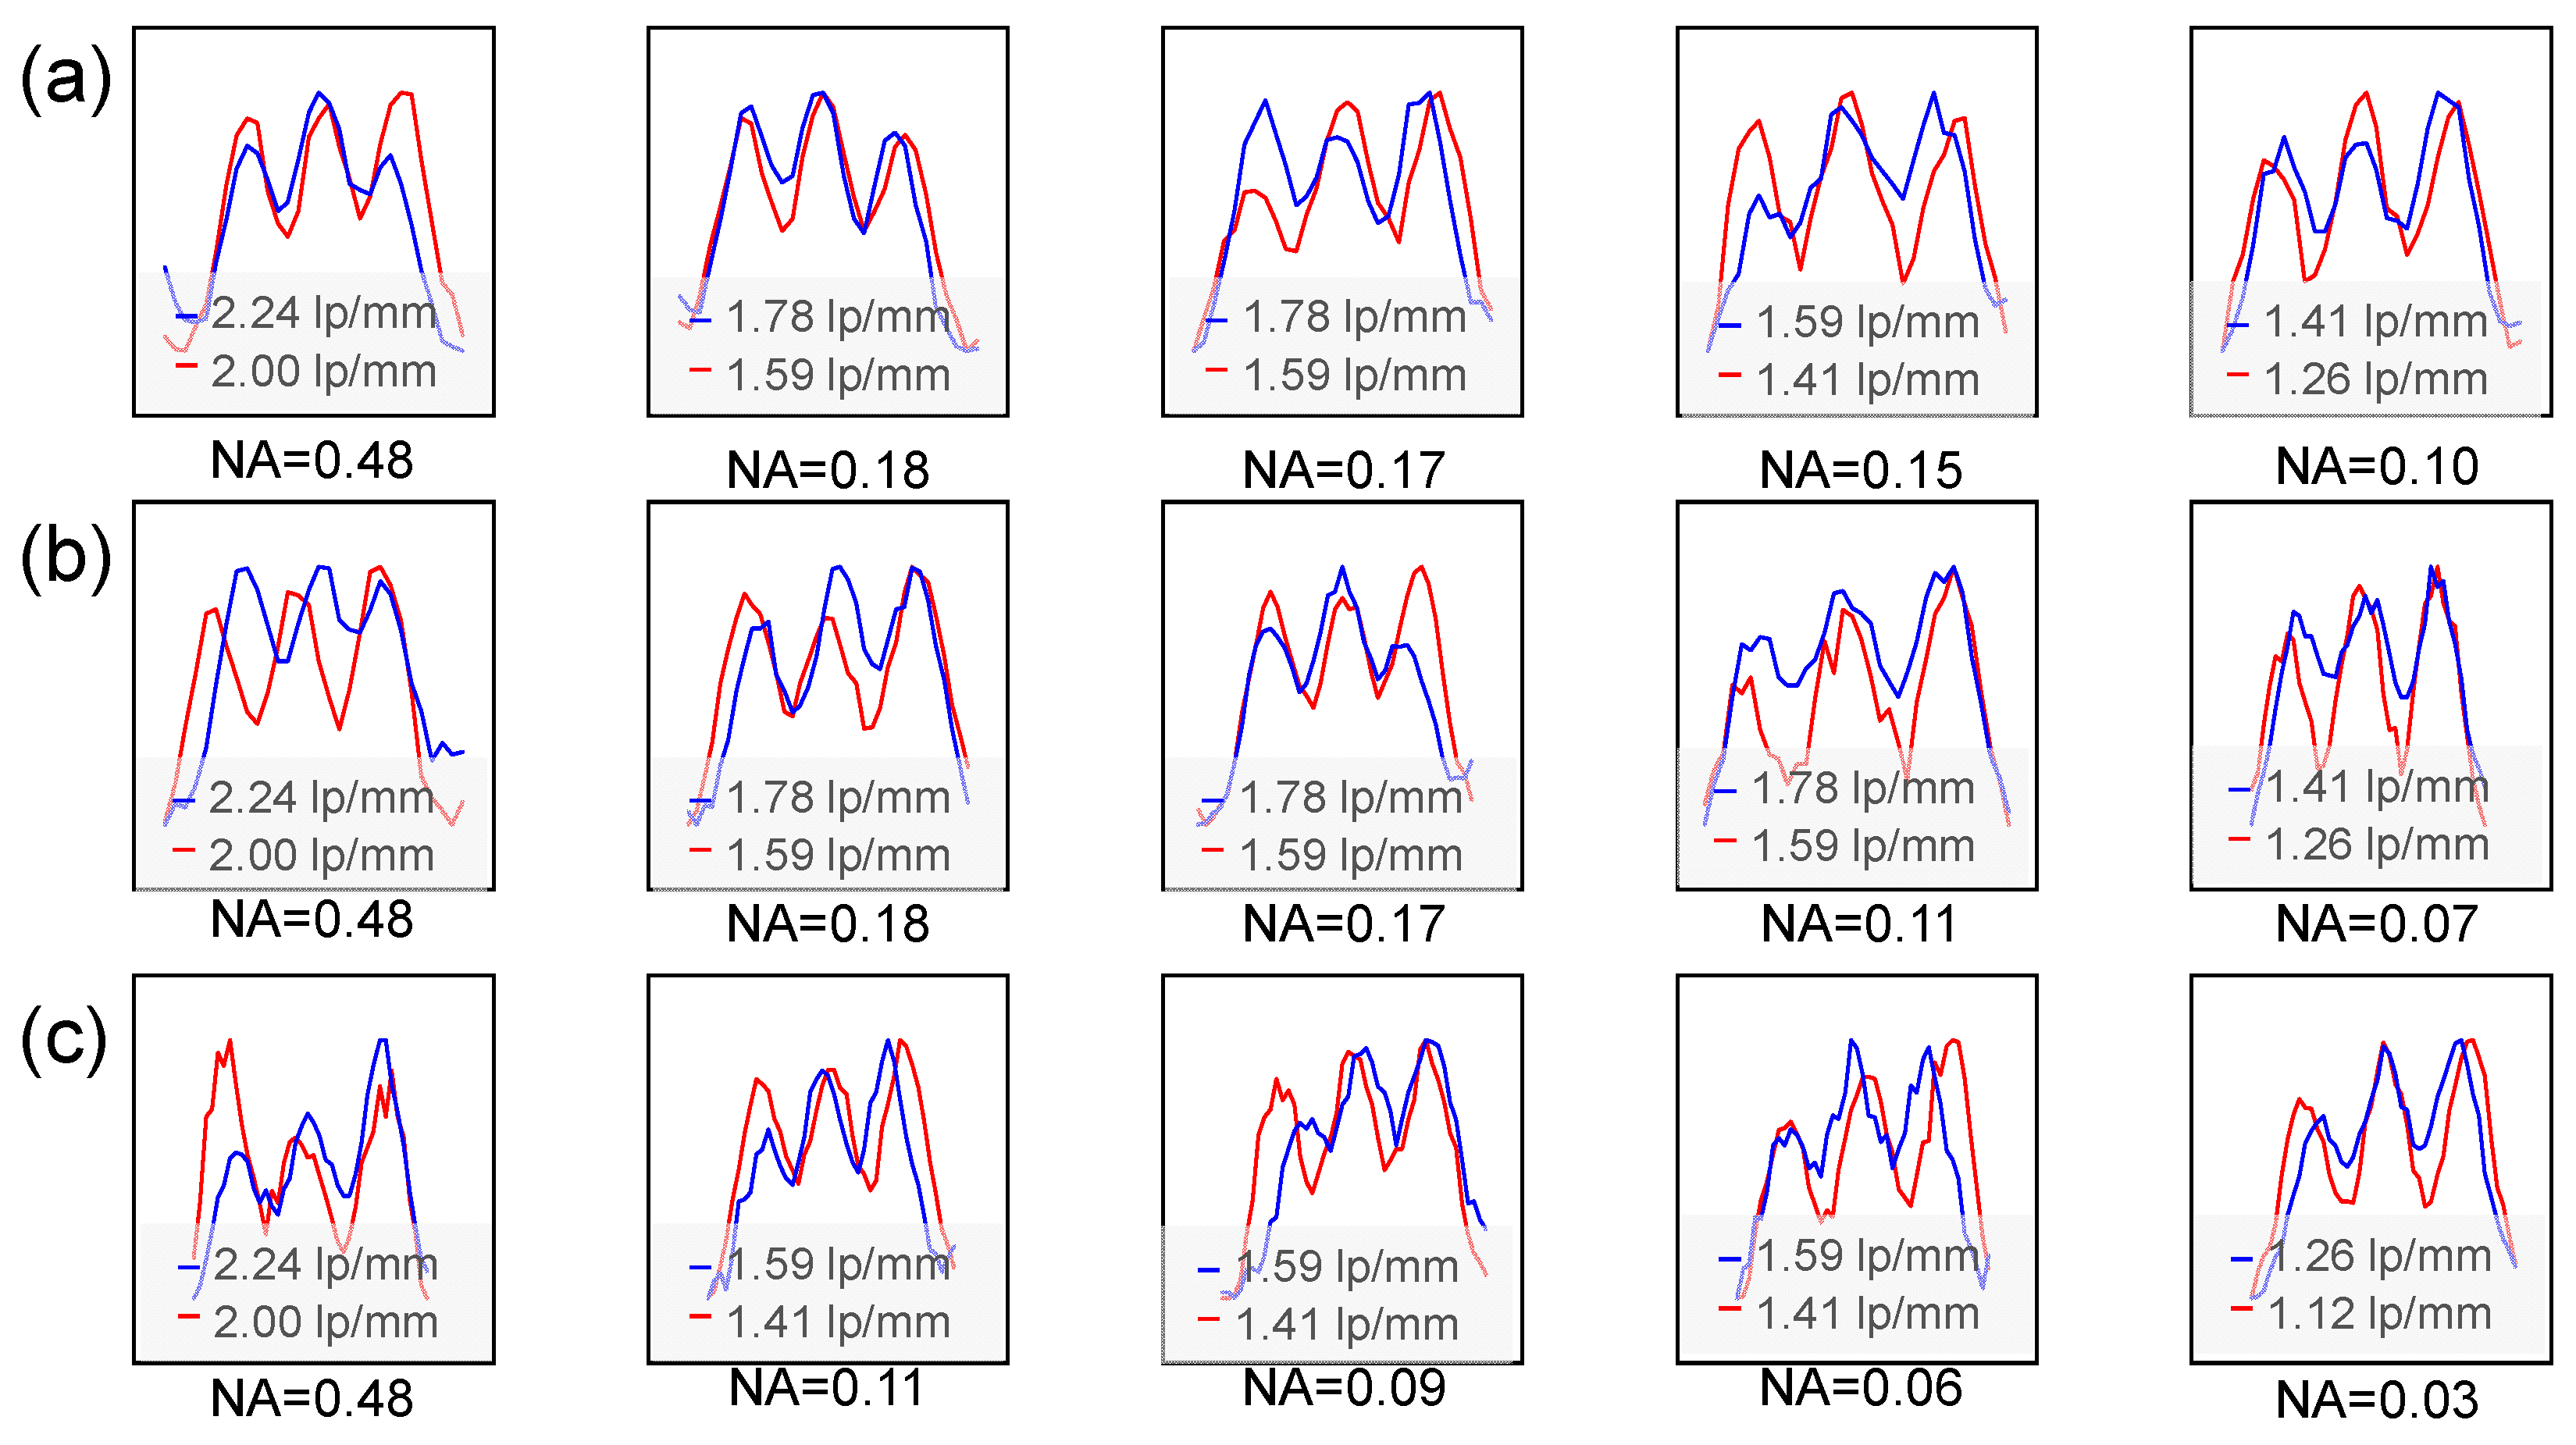
3.2. Optical Characterization of MLAs

The focusing properties of the printed MLAs were characterized using a confocal microscope system. Figure 7 shows the measured results. The NA of each individual microlens is calculated as [44]:
N A = D 2 f
where D and f are the diameter and the focal length of the microlens, respectively. From Figure 5, the microlenses printed with NOA 61, NOA 63, and NOA 68 have almost the same size of ~27.3 μm in diameter. The measured focal lengths of their corresponding MLAs are 273, 390, and 682 μm, respectively, which are in good agreement with the simulated results. Correspondingly, the calculated NA values were 0.1, 0.07, and 0.04, respectively. These distinctive results are mainly attributed to the differences in wetting and viscosity of the optical adhesives. As a result, the microlenses printed with NOA 61, NOA 63, and NOA 68 have almost the same radius but gradually decreased heights, hence causing increased curvature radius. As a result, their corresponding focal lengths increase, leading to gradually decreased NAs according to Equation (9).
Furthermore, the imaging properties of the printed MLAs were also tested. The experimental setup used for imaging characterization is shown in Figure 8a, in which a mask with the “MLA” letters was used. A white light beam from the light source passes through the mask, imaged by the printed MLA, and then collected by the CCD camera combined with the objective lens. The captured images by the CCD camera at the focal plane are illustrated in Figure 8b–d. The NA adjustment of the microlens could be achieved by changing the UVO treatment time (i.e., changing CA). The relationship between the CA and UVO treatment time can be found in Figure 2d. The experimental results indicate that the larger the CA, the higher the height of the microlens, and subsequently the shorter the focal length of the microlens, and vice versa. From our experimental results, we noticed that as the NA of the microlens increases, its corresponding height also increases. As a result, the profile of the microlenses gradually changes from parabola to ellipse. One can, therefore, clearly see from the captured images that the imaging distortion of the microlenses with small NA is low, but their imaging sharpness needs to be improved. On the contrary, the imaging sharpness of the microlenses with large NA is high, but their imaging distortion is high. Taking the NOA 61 MLA as the example (see Figure 8b), when NA = 0.1, the images are blurry. As NA gradually increases to 0.15, 0.17, and 0.18, the light collection ability of the microlenses is further enhanced, and the details of the images become clearer. When NA = 0.48, the resulting imaging quality is the best. At the same time, a 1951 USAF resolution test chart (1X R3L3S1N, Thorlabs) was used to evaluate the imaging resolution. The test results are shown in Figure 9, where one can determine the imaging resolution of the printed microlenses. From Figure 9, it clearly shows that the imaging resolution decreases as the NA of the microlens decreases, which is consistent with the observed trend in Figure 8. However, due to the fact that there is gradual change in the cross-sectional profile of the microlens, the image still exhibited slight distortion similar to that of a “fish eye”. By selecting the printing materials with higher refractive indices, the light collection ability of microlenses could be further enhanced, thereby improving imaging sharpness as well as reducing distortion to a certain extent.

4. Conclusions

In summary, we have demonstrated MLAs using three different UV-curing optical adhesives based on the E-jet printing technique. With a hexagonal arrangement, the highest filling factor of 89.91% was achieved with a single-step printing process, hence greatly reducing the printing complexity. By controlling the curvature of the microlens via the UVO surface treatment of the substrate, a series of MLAs with adjustable NA can be obtained, demonstrating excellent focusing performance and imaging effect. With the high-consistency printing technique, the demonstrated high filling factor MLAs could be potentially useful for improving the performance of optical imaging and sensing systems.

Author Contributions

Conceptualization, Y.J.L.; methodology, L.Z. and W.L.; software, L.Z. and H.G.; validation, L.Z. and W.L.; formal analysis, L.Z. and H.G.; investigation, Y.L., X.Z. (Xueqian Zhao), D.K. and Q.D.; resources, Y.J.L.; data curation, L.Z.; writing—original draft preparation, L.Z. and Y.L.; writing—review and editing, Y.J.L., X.Z. (Xiaoli Zhang) and B.X.; supervision, Y.J.L., X.Z. (Xiaoli Zhang) and B.X.; project administration, Y.J.L.; funding acquisition, Y.J.L. All authors have read and agreed to the published version of the manuscript.

Funding

This research is financially supported by the National Key R&D Program of China (Grant No. 2022YFA1203702); National Natural Science Foundation of China (Grant No. 62075093); Guangdong Basic and Applied Basic Research Foundation (Grant No. 2024A1515010415); Shenzhen Science and Technology Innovation Commission (Grant No. JCYJ20220818100413030); Shenzhen Development and Reform Commission (Grant No. XMHT20220114005); High Level of Special Funds from Southern University of Science and Technology (Grant No. G030230001 and G03034K004); Graduate Education Innovation Grants from Southern University of Science and Technology (Grant No. 202401002). This research is also supported by Guangdong Basic and Applied Basic Research Foundation (Grant No. 2025A1515010515), Guangdong University of Technology SPOE Seed Foundation (Grant No. SF2024111507).

Institutional Review Board Statement

Not applicable.

Informed Consent Statement

Not applicable.

Data Availability Statement

Data underlying the results presented in this paper are not publicly available at this time but may be obtained from the authors upon reasonable request.

Acknowledgments

The authors would like to thank the assistance of SUSTech Core Research Facilities for support with fabrication.

Conflicts of Interest

The authors declare no conflicts of interest. Bing Xu was employed by the company Shenzhen Placnk Innovation Technology Co., Ltd. The remaining authors decare that the research was conducted in the absence of any commercial or financial relationships that could be construed as a potential conflict of interest.

References

  1. Ho, Y.H.; Chen, K.Y.; Peng, K.Y.; Tsai, M.C.; Tian, W.C.; Wei, P.K. Enhanced light out-coupling of organic light-emitting diode using metallic nanomesh electrodes and microlens array. Opt. Express 2013, 21, 8535–8543. [Google Scholar] [CrossRef] [PubMed]
  2. Li, X.; Zhu, P.; Liu, G.; Zhang, J.; Song, R.; Ee, Y.K.; Kumnorkaew, P.; Gilchrist, J.F.; Tansu, N. Light extraction efficiency enhancement of III-Nitride light-emitting diodes by using 2-D close-packed TiO2 microsphere arrays. J. Disp. Technol. 2013, 9, 324–332. [Google Scholar] [CrossRef]
  3. Shin, S.R.; Le, H.B.; Ji, W.Y.; Ko, K.J.; Park, S.; Yoo, S.; Kang, J.W. Improving light extraction of flexible OLEDs using a mechanically robust Ag mesh/ITO composite electrode and microlens array. J. Mater. Chem. C 2018, 6, 5444–5452. [Google Scholar] [CrossRef]
  4. Deng, Z.; Chen, F.; Yang, Q.; Bian, H.; Du, G.; Yong, J.; Shan, C.; Hou, X. Dragonfly-eye-inspired artificial compound eyes with sophisticated Imaging. Adv. Funct. Mater. 2018, 26, 1995–2001. [Google Scholar] [CrossRef]
  5. Fan, Q.; Xu, W.; Hu, X.; Zhu, W.; Yue, T.; Zhang, C.; Yan, F.; Chen, L.; Lezec, H.J.; Lu, Y.; et al. Trilobite-inspired neural nanophotonic light-field camera with extreme depth-of-field. Nat. Commun. 2022, 13, 2130. [Google Scholar] [CrossRef]
  6. Li, J.; Wang, W.; Mei, X.; Pan, A.; Sun, X.; Liu, B.; Cui, J. Artificial compound eyes prepared by a combination of air-assisted deformation, modified laser swelling, and controlled crystal growth. ACS Nano 2019, 13, 114–124. [Google Scholar] [CrossRef]
  7. Chen, Y.; Elshobaki, M.; Ye, Z.; Park, J.M.; Noack, M.A.; Ho, K.M.; Chaudhary, S. Microlens array induced light absorption enhancement in polymer solar cells. Phys. Chem. Chem. Phys. 2013, 15, 4297–4302. [Google Scholar] [CrossRef]
  8. Myers, J.D.; Cao, W.; Cassidy, V.; Eom, S.H.; Zhou, R.; Yang, L.; You, W.; Xue, J. A universal optical approach to enhancing efficiency of organic-based photovoltaic devices. Energy Environ. Sci. 2012, 5, 6900–6904. [Google Scholar] [CrossRef]
  9. Nan, M.; Kim, K.; Lee, J.; Lee, K.K.; Yang, S.S. Concentrating microlens array mounted on an InGaP/GaAs/Ge solar cell for photovoltaic performance enhancement. Sol. Energy 2013, 91, 374–380. [Google Scholar]
  10. Xie, J.; Wu, K.; Cheng, J.; Li, P.; Zheng, J. The micro-optic photovoltaic behavior of solar cell along with microlens curved glass substrate. Energ. Convers. Manag. 2015, 96, 315–321. [Google Scholar] [CrossRef]
  11. Hung, T.Q.; Chin, W.H.; Sun, Y.; Wolff, A.; Bang, D.D. A novel lab-on-chip platform with integrated solid phase PCR and supercritical angle fluorescence (SAF) microlens array for highly sensitive and multiplexed pathogen detection. Biosens. Bioelectron. 2017, 90, 217–223. [Google Scholar] [CrossRef]
  12. Tian, X.; Yu, W.; Meng, X.; Sun, A.; Xue, L.; Liu, C.; Wang, S. Real-time quantitative phase imaging based on transport of intensity equation with dual simultaneously recorded field of view. Opt. Lett. 2016, 41, 1427–1430. [Google Scholar] [CrossRef]
  13. Wu, D.; Xu, J.; Niu, L.G.; Wu, S.Z.; Midorikawa, K.; Sugioka, K. In-channel integration of designable microoptical devices using flat scaffold-supported femtosecond-laser microfabrication for coupling-free optofluidic cell counting. Light Sci. Appl. 2015, 4, e228. [Google Scholar] [CrossRef]
  14. Cai, W.; Xia, H.; Li, W.; Kong, D.; Ma, Z.; Cheng, M.; Wang, J.; Liu, J.; Yang, X.; Luo, D.; et al. Electrohydrodynamically printed microlens arrays with controllable curvature based on surface functionalization. Surf. Interfaces 2024, 46, 103935. [Google Scholar] [CrossRef]
  15. Xu, M.; Zhou, Z.; Wang, Z.; Lu, H. Self-assembled microlens array with controllable focal length formed on a selective wetting surface. ACS Appl. Mater. Interfaces 2020, 12, 7826–7832. [Google Scholar] [CrossRef]
  16. Wang, L.; Luo, Y.; Liu, Z.Z.; Feng, X.; Lu, B. Fabrication of microlens array with controllable high NA and tailored optical characteristics using confined ink-jetting. Appl. Surf. Sci. 2018, 442, 417–422. [Google Scholar] [CrossRef]
  17. Dai, H.T.; Liu, Y.J.; Sun, X.W.; Luo, D. A negative-positive tunable liquid-crystal microlens array by printing. Opt. Express 2009, 17, 4317–4323. [Google Scholar] [CrossRef]
  18. Huang, Y.; Qin, Y.; Tu, P.; Zhang, Q.; Zhao, M.; Yang, Z.Y. High fill factor microlens array fabrication using direct laser writing and its application in wavefront detection. Opt. Lett. 2020, 45, 4460–4463. [Google Scholar] [CrossRef] [PubMed]
  19. Schmidt, T.; Conrad, D. Micro lens arrays made by CO2-laser radiation. Proc. SPIE 2020, 11478, 1147806. [Google Scholar]
  20. Ou, Y.; Li, S.; Qian, J.; Xiao, Y.; Fu, S.; Wu, L.; Zhang, M. Fabrication of large-area microwells on Polydimethylsiloxane films by femtosecond laser ablation. Opt. Laser Technol. 2020, 130, 106330. [Google Scholar] [CrossRef]
  21. Fan, H.; Cao, X.W.; Wang, L.; Li, Z.Z.; Chen, Q.D.; Juodkazis, S.; Sun, H.B. Control of diameter and numerical aperture of microlens by a single ultra-short laser pulse. Opt. Lett. 2019, 44, 5149–5152. [Google Scholar]
  22. Cheng, M.; Cai, W.; Wang, Z.; Chen, L.; Yuan, D.; Ma, Z.; Bai, Z.; Kong, D.; Cen, M.; Xu, S.; et al. Responsive liquid crystal network microstructures with customized shapes and predetermined morphing for adaptive soft microoptics. ACS Appl. Mater. Interfaces 2024, 16, 31776–31787. [Google Scholar]
  23. Cai, W.; Cheng, M.; Kong, D.; Ma, Z.; Liu, Y.J. Switchable liquid crystal lenticular microlens arrays based on photopolymerization-induced phase separation for 2D/3D autostereoscopic displays. Opt. Express 2024, 32, 625–638. [Google Scholar] [PubMed]
  24. Cai, W.; Kong, D.; Ma, Z.; Cen, M.; Wang, J.; Yuan, D.; Li, K.; Cheng, M.; Xu, S.; Luo, D.; et al. Optically anisotropic, electrically tunable microlens arrays formed via single-step photopolymerization-induced phase separation in polymer/liquid-crystal composite materials. Light Adv. Manuf. 2023, 4, 28. [Google Scholar]
  25. Dai, H.; Chen, L.; Zhang, B.; Si, G.; Liu, Y.J. Optically isotropic, electrically tunable liquid crystal droplet arrays formed by photopolymerizationinduced phase separation. Opt. Lett. 2015, 40, 2723–2726. [Google Scholar] [CrossRef] [PubMed]
  26. Wang, W.; Chen, G.; Weng, Y.; Weng, X.; Zhou, X.; Wu, C.; Guo, T.; Yan, Q.; Lin, Z.; Zhang, Y. Large-scale microlens arrays on flexible substrate with improved numerical aperture for curved integral imaging 3D display. Sci. Rep. 2020, 10, 11741. [Google Scholar]
  27. Zhou, X.; Peng, Y.; Peng, R.; Zeng, X.; Zhang, Y.; Guo, T. Fabrication of large-scale microlens arrays based on screen printing for integral imaging 3D display. ACS Appl. Mater. Interfaces 2016, 8, 24248–24255. [Google Scholar] [CrossRef]
  28. Li, Z.; Lu, H.; Ding, Y.; Xu, M. Low voltage liquid crystal microlens array based on polyvinyl alcohol convex induced vertical alignment. Liq. Cryst. 2020, 48, 248–254. [Google Scholar] [CrossRef]
  29. Li, Z.; Xu, M.; Lu, H.; Ding, Y. A polyvinyl alcohol microlens array with controlled curvature on discontinuous hydrophobic surface. J. Mol. Liq. 2020, 319, 114372. [Google Scholar] [CrossRef]
  30. Luo, J.; Guo, Y.; Wang, X. Rapid fabrication of curved microlens array using the 3D printing mold. Optik 2018, 156, 556–563. [Google Scholar] [CrossRef]
  31. Zhang, D.; Xu, Q.; Fang, C.; Wang, K.; Wang, X.; Zhuang, S.; Dai, B. Fabrication of a microlens array with controlled curvature by thermally curving photosensitive gel film beneath microholes. ACS Appl. Mater. Interfaces 2017, 9, 16604–16609. [Google Scholar] [CrossRef] [PubMed]
  32. Wang, Y.; Shi, C.; Liu, C.; Yu, X.; Xu, H.; Wang, T.; Qiao, Y.; Yu, W. Fabrication and characterization of a polymeric curved compound eye. J. Micromech. Microeng. 2019, 29, 055008. [Google Scholar] [CrossRef]
  33. Zhu, J.; Li, M.; Qiu, J.; Ye, H. Fabrication of high fill-factor aspheric microlens array by dose-modulated lithography and low temperature thermal reflow. Microsyst. Technol. 2019, 25, 1235–1241. [Google Scholar] [CrossRef]
  34. Park, J.U.; Hardy, M.; Kang, S.J.; Barton, K.; Adair, K.; Mukhopadhyay, D.K.; Lee, C.Y.; Strano, M.S.; Alleyne, A.G.; Georgiadis, J.G.; et al. High-resolution electrohydrodynamic jet printing. Nat. Mater. 2007, 6, 782–789. [Google Scholar] [CrossRef] [PubMed]
  35. Zhong, Y.; Yu, H.; Zhou, P.; Wen, Y.; Zhao, W.; Zou, W.; Luo, H.; Wang, Y.; Liu, L. In situ electrohydrodynamic jet printing-based fabrication of tunable microlens arrays. ACS Appl. Mater. Interfaces 2021, 13, 39550–39560. [Google Scholar] [CrossRef]
  36. An, B.W.; Kim, K.; Lee, H.; Kim, S.Y.; Shim, Y.; Lee, D.Y.; Song, J.Y.; Park, J.U. High-resolution printing of 3D structures using an electrohydrodynamic inkjet with multiple functional inks. Adv. Mater. 2015, 27, 4322–4328. [Google Scholar] [CrossRef]
  37. Onses, M.S.; Sutanto, E.; Ferreira, P.M.; Alleyne, A.G.; Rogers, J.A. Mechanisms, capabilities, and applications of high-resolution electrohydrodynamic jet printing. Small 2015, 11, 4237–4266. [Google Scholar] [CrossRef]
  38. Shi, L.; Chen, S. Over 32.5% efficient top-emitting quantum-dot LEDs with angular-independent emission. ACS Appl. Mater. Interfaces 2022, 14, 30039–30045. [Google Scholar] [CrossRef]
  39. Zhang, X.; LV, L.; Hu, F. Photoresist microlens arrays fabricated by nanoimprint technique to improve the photoelectric conversion efficiency of solar cells. Coatings 2022, 12, 1812. [Google Scholar] [CrossRef]
  40. Taylor, G.I. Disintegration of water drops in an electric field. Proc. R. Soc. A 1964, 280, 383–397. [Google Scholar]
  41. John, R. UV/ozone cleaning of surfaces. J. Vac. Sci. Technol. 1985, 3, 1027–1034. [Google Scholar]
  42. Blake, T.D.; Coninck, J.D. The influence of solid–liquid interactions on dynamic wetting. Adv. Colloid Interface Sci. 2002, 96, 21–36. [Google Scholar] [CrossRef] [PubMed]
  43. Zhang, Q.; Schambach, M.; Schlisske, S.; Jin, Q.; Mertens, A.; Rainer, C.; Sosa, G.H.; Heizmann, M.; Lemmer, U. Fabrication of microlens arrays with high quality and high fill factor by inkjet printing. Adv. Opt. Mater. 2022, 10, 2200677. [Google Scholar] [CrossRef]
  44. Yong, J.; Chen, F.; Yang, Q.; Du, G.; Bian, H.; Zhang, D.; Si, J.; Yun, F.; Hou, X. Rapid fabrication of large-area concave microlens arrays on PDMS by a femtosecond laser. ACS Appl. Mater. Interfaces 2013, 5, 9382–9385. [Google Scholar] [CrossRef] [PubMed]
Figure 1. (a) Schematic diagram of the E-jet printing system for preparation. (b) Taylor cone formed by applying a voltage in between the nozzle and the substrate. (c) The jet formed during the printing process.
Photonics 12 00446 g001
Figure 2. Measured CAs of (a) NOA 61, (b) NOA 63, and (c) NOA 68 before (left panel) and after (right panel) 20 min UVO treatment. (d) CA as a function of the UVO treatment time.
Photonics 12 00446 g002
Figure 3. Schematic diagram for the volume calculation of a droplet.
Photonics 12 00446 g003
Figure 4. (a,b) Optical microscope images of the printed microlenses under different (a) applied voltages and (b) nozzle heights, respectively. (c,d) The size of the printed microlenses as functions of (c) the applied voltage and (d) the nozzle height. (e,f) Optical microscope images of the printed MLAs in (e) square and (f) hexagonal arrangements. Scale bar: 100 µm.
Photonics 12 00446 g004
Figure 5. (ac) Top-view optical microscope images and (df) corresponding cross-sectional profiles of the printed MLAs with (a,d) NOA 61, (b,e) NOA 63, and (c,f) NOA 68 optical adhesives. Scale bar: 100 μm.
Photonics 12 00446 g005
Figure 6. Cross-sectional profile comparison and parabolic fitting of the three types of microlenses.
Photonics 12 00446 g006
Figure 7. (ac) The measured (upper) and simulated (lower) focusing intensity distribution of a single microlens in the x-z plane. (df) The focal points of MLAs, and (gi) the normalized 3D intensity distribution at the focal plane of MLAs with (a,d,g) NOA 61, (b,e,h) NOA 63, and (c,f,i) NOA 68, respectively. Scale bar: 50 μm.
Photonics 12 00446 g007
Figure 8. (a) Experimental setup for imaging characterization. Imaging properties of MLAs with different NAs prepared by (b) NOA 61, (c) NOA 63, and (d) NOA 68. Scale bar: 20 μm.
Photonics 12 00446 g008
Figure 9. The tested imaging resolution of the printed microlenses with different NAs using (a) NOA 61, (b) NOA 63, and (c) NOA 68. The red and blue lines represent exactly distinguishable and indistinguishable line pairs.
Photonics 12 00446 g009
Disclaimer/Publisher’s Note: The statements, opinions and data contained in all publications are solely those of the individual author(s) and contributor(s) and not of MDPI and/or the editor(s). MDPI and/or the editor(s) disclaim responsibility for any injury to people or property resulting from any ideas, methods, instructions or products referred to in the content.

