Abstract
Accurate quality-of-transmission (QoT) estimation prior to lightpath deployment is essential for minimizing design margins in optical networks. Owing to their high precision and strong generalization capabilities, artificial neural networks (ANNs) have emerged as a promising approach for lightpath QoT estimation. However, focusing exclusively on prediction accuracy is inadequate for maximizing global network capacity. Conventional models employing symmetric loss functions apply identical penalties to both overestimation and underestimation errors, thereby precluding controlled bias in predictions and their impact on overall network capacity. This paper investigates the margin configuration for the whole network capacity and proposes a novel QoT estimation method with asymmetric loss functions, which jointly considers the assessment of global network capacity and gives different penalties for overestimation and underestimation. We further present an iterative search algorithm grounded in network capacity considerations to optimize the parameters of these asymmetric loss functions. Simulation results confirm that our ANN-based models facilitate efficient modulation format assignment, leading to corresponding increases in network capacity.
1. Introduction
Emerging technologies, such as cloud computing, edge computing, Internet of Things, virtual reality, and artificial intelligence, have been driving extreme traffic growth in mobile networks [1]. As a critical infrastructure for data transmission, optical networks are experiencing a sharp rise in capacity demand. Therefore, developing high-capacity transmission systems and improving resource utilization efficiency have become key priorities in the field. Recently, a low-margin optical network has been proposed to increase network capacity by lessening network margins [2]. Traditionally, large margins are reserved to ensure that all lightpaths maintain acceptable quality of transmission (QoT), which often forces the use of lower-order modulation formats and limits overall capacity. These margins are generally categorized into three types, system margins (S-margins), which accommodate variations in network operating conditions; unallocated margins (U-margins), which account for gaps between demand and equipment capabilities; and design margins (D-margins), which guard against inaccuracies in QoT estimation [2]. Among these, reducing D-margins through more accurate QoT estimation has been shown to be an effective strategy for realizing low-margin networks.
Due to the uncertain physical layer (PL) parameters in real life, such as amplifier gain ripple, connector losses, and fiber types, the analysis process of the physical models is complicated, making the precise deduction of physical layer states challenging [3,4]. To mitigate this issue, additional margins are typically incorporated to safeguard against estimation inaccuracies, albeit at the cost of reduced network capacity. Recently, machine learning (ML) has emerged as a promising approach for quality of transmission (QoT) estimation in low-margin optical networks. ML-based QoT estimators leverage implicitly captured information from optical networks to train predictive models that establish relationships between input data (i.e., physical layer parameters) and output data (i.e., lightpath QoT), without requiring an explicit description of transmission channel states, which are generally difficult to characterize precisely. With advances in intelligent technologies, numerous machine learning algorithms including random forest (RF), support vector machines (SVM), and artificial neural networks (ANN) have demonstrated effectiveness in ML-based QoT estimation for optical networks [5,6]. Artificial neural networks, in particular, have gained widespread adoption for predicting network states and traffic patterns due to their high accuracy and broad applicability.
While high-accuracy prediction models can reduce estimation errors and design margins, thereby enhancing network capacity, focusing solely on the statistical properties of ML-based estimator errors is insufficient for achieving optimal global network performance. This limitation arises because the capacity of each deployed lightpath depends on both the deployment scheme and the selected modulation format. In the deployment scheme, ensuring lightpath reliability requires that the modulation format (MF) configured with the predicted QoT satisfies the FEC threshold in field deployment, meaning the FEC threshold must not exceed the predicted QoT value minus the design margin. Consequently, both the predicted QoT value and the design margin are key factors determining the configured modulation format and resulting lightpath capacity. Focusing exclusively on estimation error fails to simultaneously control both the design margin and the bias in prediction values, factors that substantially impact overall network capacity.
The performance of machine learning (ML)-based prediction models is primarily governed by three key factors: the training dataset, the model’s network architecture, and the loss function [7]. Among these, the loss function plays a crucial role by directing the network’s training process and substantially influencing prediction outcomes. These predictions can manifest as either overestimations or underestimations. Overestimation occurs when predicted values exceed actual measurements, potentially leading to the selection of higher-order modulation formats. This may result in improperly configured lightpaths that compromise network reliability. To solve this problem, the design margin is typically defined as the maximum overestimated prediction to ensure network reliability. Conversely, underestimation means that the predicted value is less than the actual value, therefore leading to the selection of a lower modulation format for the lightpath, which leads to a lower capacity for the current lightpath. The influences on network capacity are different, such as the overestimation affecting the capacity of all the lightpaths in the whole network when the design margin increases, while the underestimation only makes the current lightpath capacity reduce.
Existing research predominantly emphasizes prediction model accuracy [8], often overlooking the assessment of global network performance from a capacity perspective. They mainly leverage the traditional ANN-based models with symmetric loss functions [9], such as mean square error (MSE) or mean absolute error (MAE), which apply identical penalties to both overestimation and underestimation errors. Consequently, these methods cannot control prediction bias effectively. Current efforts to enhance estimation accuracy primarily focus on optimizing training datasets and ANN architectures, while neglecting the impact of prediction characteristics on overall network capacity. Furthermore, existing models typically disregard maximum overestimation, resulting in inflated design margins, conservative modulation format selection, and, consequently, substantially diminished network capacity.
This paper investigates the impact of prediction models and their outcomes on low-margin optical network configuration, with a specific focus on enhancing network capacity through novel loss function design. The main contributions of this work are summarized as follows.
(1) A novel quality-of-transmission (QoT) estimation framework employing asymmetric loss functions is proposed to enhance network capacity. To the best of our knowledge, this represents the first QoT estimation approach that jointly considers margin configuration and its impact on global network performance from a capacity perspective.
(2) We systematically demonstrate that overestimation and underestimation errors have distinct effects on overall network capacity, with overestimation exerting a more substantial negative impact.
(3) We develop an iterative search algorithm based on network capacity optimization to determine the optimal parameters for models with asymmetric loss functions, thereby constructing enhanced prediction models.
(4) Network performance is evaluated in terms of capacity using two standard network topologies, i.e., Japan and NSF networks, and the effectiveness of our proposed ANN-based QoT estimation models with asymmetric loss functions is validated through comprehensive simulations.
The remainder of this paper is structured as follows. Section 2 reviews related work. Section 3 describes machine learning-based QoT estimation models. Section 4 presents the proposed QoT estimation method with asymmetric loss functions. Section 5 analyzes the training process for the proposed models and identifies optimal configurations for both network topologies. Section 6 assesses performance through extensive simulations and Section 7 concludes the paper.
2. Related Works
Accurate quality-of-transmission (QoT) estimation for lightpaths is essential for reducing design margins and enabling effective network planning and deployment in low-margin optical networks [1,10,11]. Traditional QoT estimation approaches primarily rely on physical-layer analysis, employing mathematical models to characterize optical transmission processes. These methods can be broadly categorized into two groups: sophisticated analytical models [12] and approximate estimation models [13]. Jing et al. [12] proposed a distributed Fourier method for optical transmission estimation, accounting for both dispersion and nonlinear effects on optical pulse signals. Alternatively, Poggiolini et al. [13] employed a Gaussian noise model to address nonlinear noise in transmission systems, offering a simplified approach that enables rapid QoT estimation. However, such simplified models necessitate additional resource margins to accommodate uncertainties in challenging network scenarios. Consequently, traditional QoT estimation methods prove inadequate for low-margin network design in real-world applications.
The advancement and widespread adoption of machine learning (ML) technologies have demonstrated that ML-based QoT estimation can achieve significantly higher prediction accuracy [11]. In ML-based QoT estimation, physical layer states are implicitly captured through analysis of data collected from optical networks. Leveraging information from established lightpaths, this approach enables accurate QoT estimation for unestablished lightpaths. For example, Yan et al. [14] developed two machine learning approaches to create an accurate QoT estimator, reducing the design margin from 2 dB to 1.8 dB. Similarly, Savory et al. [15] investigated the combination of machine learning and analytical models for QoT estimation, achieving a further reduction in design margin to 0.1 dB for new traffic demands.
Existing ML-based QoT estimation approaches can be categorized into classification and regression models. Classification models determine whether a lightpath can be successfully established, whereas regression models directly predict specific QoT values. In the classification domain, Aladin et al. [16] developed a random forest (RF)-based QoT classifier to assess whether new channels meet establishment requirements, using transmission bandwidth, modulation format, and routing information as model inputs. Their results demonstrated strong accuracy on synthetic datasets. Separately, Yan et al. [14] evaluated multiple algorithms including k-nearest neighbors (KNN), logistic regression, support vector machines (SVM), and artificial neural networks (ANN) for both classification and regression tasks. These studies reported accuracy levels exceeding 90%, with ANN achieving up to 99.9% accuracy. However, a fundamental limitation of classification models is their binary outcome—they only indicate whether a lightpath meets establishment criteria without providing specific QoT estimates. This lack of quantitative information complicates lightpath deployment in low-margin networks.
Regression models offer significant advantages over classification approaches by providing quantitative estimates of QoT parameters and associated margins. Among ML-based regression techniques, artificial neural networks (ANNs) have emerged as particularly effective for QoT prediction. An OSNR regression model based on ANN was proposed and verified on a practical platform [17]; the experimental results show that the proposed model achieves high accuracy in the actual transmission system, and the RMSE of the model is less than 1 dB. Azzimonti et al. [18] examined multiple ML-based Q factor prediction models across three transmission networks, finding that ANN-based approaches delivered the best generalization performance with 99% accuracy. Similarly, Wan et al. [19] introduced a dual-stage algorithm architecture that achieved OSNR estimation accuracy exceeding 99% for low-margin elastic optical networks.
While ANN-based QoT estimation shows considerable promise for margin reduction and capacity enhancement, existing methods predominantly focus on prediction precision. For example, studies such as [20,21] aim to reduce uncertainties in generalized signal-to-noise ratio (GSNR) computation and enhance QoT model accuracy, yet they overlook the assessment of global network performance from a capacity perspective. Relying solely on statistical properties of estimation errors is insufficient for achieving optimal global network capacity [22]. Current ANN-based QoT estimators typically employ symmetric loss functions—such as mean square error (MSE) or mean absolute error (MAE)—that apply equal penalties to both overestimation and underestimation errors [2,23,24]. This approach is suboptimal because overestimation and underestimation have fundamentally different impacts on network capacity. Underestimation primarily reduces the capacity of individual lightpaths, while overestimation can necessitate larger design margins that degrade capacity across the entire network.
Traditional ANN models with symmetric loss functions cannot control prediction bias effectively. Furthermore, these models typically ignore maximum overestimation, leading to inflated design margins, conservative modulation format selection, and consequently diminished network capacity.
In contrast to existing approaches, we pioneer the use of loss functions to direct both model training and prediction characteristics, specifically investigating asymmetric loss functions for ANN-based QoT estimation [25]. This paper introduces a novel QoT estimation framework that jointly optimizes network margin design with the objective of maximizing network capacity. We systematically analyze the impacts of maximum overestimation and underestimation on lightpath deployment and develop ANN-based prediction models with asymmetric loss functions to enhance network capacity.
3. ML-Based QoT Estimation Models
Machine Learning is considered an effective method to improve the accuracy of QoT prediction for low-margin optical networks. The QoT metric essentially refers to the OSNR of the lightpaths, which is affected by several factors, e.g., optical amplifier amplified spontaneous emission (ASE) noise and nonlinear interference (NLI) [26]. There are three types of margins in optical networks, i.e., system margins, unallocated margins, and design margins [2]. Design margins account for the inaccuracy of QoT prediction models. This paper studies how to reduce design margins through a novel OSNR estimator with an asymmetric loss function, and aims to improve network capacity. In the prediction process, the variation in the system margin and the unallocated margin are ignored, and this paper focuses on the decrease in margins. Thus, the margin here refers to the design margin. Based on the above analysis, the OSNR margin for the lightpath is calculated as follows [27]:
In this paper, denotes the prediction values of OSNR, is defined as the design margin, and is the threshold of modulation format used for the lightpaths, i.e., the minimum value for signals to recover error-free.
Since the design margin accounts for the inaccuracy of QoT prediction models, to maintain the network reliability, the design margin here is denoted as the maximum value of the predicted value minus the actual value for all lightpaths, i.e., the maximum overestimation, which is expressed as follows:
where is the actual value. Based on the above analysis, it implies that is crucial for the used modulation format of lightpath, which determines the bitrate directly.
S denotes the set of all the lightpaths in the network, and i is used to index the lightpaths. Here, the network capacity is defined as the sum of the transmission rates of all lightpaths in the optical network, i.e.,
where denotes the capacity of lightpath i, i.e.,
In (4), denotes the mapping relation between the modulation format and the capacity of lightpaths. The relationship between prediction value and the actual value has two situations, i.e., and . When , it is the desired situation that the optimal transmission data capacity can be obtained, while for , the used modulation format and network capacity will be affected accordingly. Here we study the influence of overestimation (i.e., ) and underestimation (i.e., ) in Figure 1.
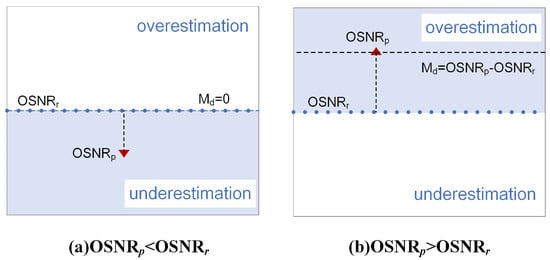
Figure 1.
Overestimation and underestimation.
Based on the analysis above, we know that overestimation decreases network capacity more than underestimation; thus, this paper tries to improve network capacity by reducing overestimation predictions. Since loss function is the crucial factor in determining the prediction results, this paper studies the loss function for ANN-based prediction models and proposes a novel prediction method by jointly considering the network capacity and the impact of prediction results. Note that this paper considers flexible modulation format selection, where for each optical path the modulation format is chosen based on (1) and (2). To guarantee link reliability, a design margin is typically introduced. The key contribution of our work is the adoption of an asymmetric prediction model that significantly reduces such overestimation. In our design, the global margin remains determined by the maximum prediction deviation across all links, thereby ensuring network reliability while effectively mitigating the risk of over optimistic predictions.
4. QoT Estimation Method with Asymmetric Loss Functions
There are three main factors that affect ML-based prediction models, i.e., training set, the network structure of the model, and loss function [7]. The loss function controls the training direction of the network and affects the prediction values significantly. Most prediction models only focus on the network structure of the models and then improve the accuracy. Here, we study the relationship between the loss functions and the outputs (i.e., prediction values), based on which this paper controls the prediction values and improves network capacity.
4.1. Design Asymmetric Loss Functions
Traditional ANN-based estimation models leverage MSE or MAE to train their neural network. In these models, the symmetric loss functions give the same penalty for overestimation (i.e., ) and underestimation (i.e., ), without distinguishing the different impact on network capacity. Based on the analyses above, this paper studies two asymmetric loss functions to reduce the influence incurred by overestimation.
4.1.1. Asymmetric Loss Function Based on MSE (ALFbMSE)
The curve of the loss function MSE is symmetrical, that is, when the prediction value is (y + ) and (), the loss function of MSE has the same value, i.e., . According to the analysis above, when > , if the prediction value is (y + ), the loss function is much more than . With the increase in prediction value, the loss function rises dramatically; we therefore introduce a penalty term to describe the additional loss for the asymmetric loss functions.
Here, y represents the real value, represents the predicted value and is a penalty coefficient. According to the analyses above, an asymmetric loss function based on MSE (ALFbMSE) is proposed, which is expressed as follows.
The cost function of the whole learning process can be derived as follows:
Then we use forward and back propagation to update the weights of neurons (w and b) with the objective of minimizing the cost function . Since the asymmetric loss function, ALFbMSE, gives more punishment by adjusting the value of when the predicted value is greater than the real value, the overestimation can be reduced.
4.1.2. Asymmetric Loss Function Based on MAE (ALFbMAE)
Similarly to ALFbMSE, this paper also investigates the asymmetric loss function based on MAE (ALFbMAE). Based on the loss function of MAE, we define as the additional loss for ALFbMAE; thus,
where is a penalty coefficient for ALFbMAE. Thus, the asymmetric loss function of ALFbMAE is expressed as follows:
According to (21), the cost function of the whole learning process for ALFbMAE can be derived as follows:
5. The Training Process of Asymmetric Loss Functions
The training process of asymmetric loss functions mainly contains three phases. The first is dataset generation. This phase aims to acquire the dataset and feature engineering, and then the processed data is used for the training and testing of the model. The second is the parameter design of ANN models, which is performed to determine the main hyperparameters, including the structural parameters and training parameters of the models. The third phase is the training of the ANN model with asymmetric loss functions. The processed dataset is input into the QoT prediction model, and the training Algorithm 1 is used to find the optimal models, which can provide the maximum network capacity for network designing.
| Algorithm 1 Network capacity-based iterative search algorithm (EASIER). |
|
5.1. Dataset Generation
Generally, the dataset contains a training set and a test set, where a training set with a sufficient sample size is used to initialize the neural network, and the test set is used to check the accuracy of the neural network.
We consider two common network scenarios as test networks, i.e., the 14-node, 21-link NSF and Japan networks [18]. Synthetic data is first generated for model training and testing, based on which this paper evaluates the performance of the proposed loss function and model according to the lightpath deployment method mentioned above. The parameters of two optical networks are presented in Table 1. Suppose that each network has 80 wavelengths, the center frequency is 193.1 THz, and the channel spacing is 50 GHz. The fiber links are composed of single-mode fiber (SMF), which works with a second-order dispersion parameter of 16.7 ps2/km and a nonlinear coefficient of 1.31/W/km. We assume that the attenuation coefficient is 0.20 dB/km, and the span length is set at most 40 km and 100 km for the Japan and NSF networks, respectively. Assume that EDFA is used to fully compensate for the span loss; the noise figure of the EDFA’s is set as 5 dB. It is assumed that the baud rate of the signal is 32 Gbaud and the input power of the fiber for all channels is 0 dBm.

Table 1.
Configuration of ANN model.
For data generation, several requests are firstly generated from the source nodes to the destination nodes. Secondly, when a new connection request arrives, the RWA algorithm [6,28] is used for routing and wavelength assignment. In this paper, classic RWA algorithms, i.e., K-Shortest Path Routing (KSP) and First Fit (FF), are used. KSP is used to select the routing for the demands, and First Fit (FF) is used to assign wavelengths for the selected routing. Thirdly, the OSNR value of the lightpath is calculated based on the Gaussian noise (GN) model, where the GN model has been demonstrated as an approximate but accurate QoT prediction tool by lots of experiments. Finally, the corresponding data samples are saved into the dataset. Note that when the state of the adjacent wavelength of the existing lightpaths changes due to the establishment of the new lightpath, the OSNR value of the existing lightpath is recalculated, and the corresponding information is restored in the data set.
To summarize, the process of data generation is stated as follows. Firstly, several requests are firstly generated from the source nodes to the destination nodes. Secondly, when a new connection request arrives, the RWA algorithm is used for routing and wavelength assignment. Thirdly, the OSNR value of the lightpaths is calculated based on the Gaussian noise (GN) model. Finally, the corresponding data samples are saved into the dataset.
Due to the limitation of network capacity, when the number of connection requests exceeds a certain number, the blocking rate gradually increases, and it is impossible to assign appropriate routes and wavelengths to new connections. Through multiple rounds of validation, it has been determined that the network reaches its congestion threshold when the number of generated data entries reaches 1776. Thus, we here generated 1000 data samples to obtain the data with no blocking; that is the certain number of data samples here can be considered as the generated number.
5.2. Design Parameters of ANN Models
Since it takes a long time to adjust and determine these hyperparameters manually, this paper chooses a grid algorithm to search these hyperparameters automatically. In this grid algorithm, the input layer contains 61 neurons, corresponding to a 61-dimensional input vector. The 61-dimensional input vector refers to the total length of the lightpaths, the longest link length, the pans number of lightpaths, the number of hops, the wavelength occupied by the lightpaths, and the opening status of the four adjacent channels around each link segment of the lightpaths. The output layer contains one neuron, corresponding to a one-dimensional vector, i.e., the OSNR of the lightpath. The 4 adjacent channels means 8 dimensions, while the maximum number of links is 7; thus, there are 56 dimensions. The other five dimensions refer to the total lightpath length, the longest link length, the number of pans, hop count, wavelength used. Thus, the input vectors are 61-dimensional.
The proposed ANN model contains one input layer, one output layer, and two hidden layers. The first hidden layer is , and the number conversion range of neurons for the second hidden layer is . The learning rate is , batch size parameter is , and the number of iterations is .
When the hyperparameters are determined, all the neural network models are constructed by traversing all combinations and then selecting the model with the lowest loss as the final QoT prediction model. Finally, the structure of the optimal neural network model is , and the configuration of hyperparameters and ANN model are presented in Table 2.
Table 2.
Configuration of hyperparameters.
5.3. Design Parameters of Asymmetric Loss Functions
According to the training of the ANN-based prediction model, the optimal and should be found to construct the prediction models with the objective of maximizing network capacity. Here, we propose a network capacity-based iterative search algorithm (EASIER) to find the global network capacity and the optimal value of and , as shown in Algorithm 1.
In the training process, Adaptive Moment Estimation (Adam) is chosen as a stochastic gradient descent method to update the parameters of ANN. The Adaptive Moment Estimation algorithm (Adam) is a commonly used optimization algorithm, widely applied in the field of deep learning. Compared with other traditional gradient descent methods, the Adam algorithm has the characteristics of adaptive learning rate and second-order moment estimation, which can accelerate the convergence of the model and improve the training effect. Thus, in the training process, Adam is chosen as a stochastic gradient descent method to update the parameters of ANN. The parameters of batch size, epochs, and learning rate are set as 64, 100, and 0.001, respectively.
To validate the optimality of the selected step size, we plotted line charts of network capacity for values of 0.05, 0.1, and 0.5. Figure 2 corresponds to the ALFbMAE loss function for the NSF network, showing that step sizes of 0.05, 0.1, and 0.5 all lead to similar optimal capacities.Figure 3 shows the ALFbMSE loss function for the NSF network, which demonstrates that using the finer step size of 0.05 fails to identify any points with higher capacity than that achieved with a step size of 0.1, while the step size of 0.5 yields the lowest capacity. However, as indicated in Table 3, the step size of 0.05 requires a significantly longer training time. Taking into account both network performance and computational resources, = 0.1 is determined to be the optimal step size choice.
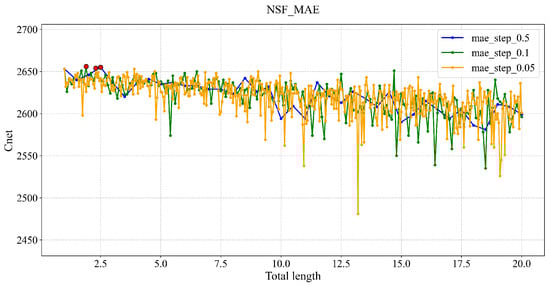
Figure 2.
ALFbMAE for network capacity versus = 0.05, 0.1, and 0.5.
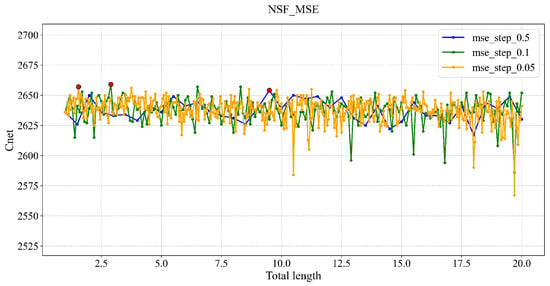
Figure 3.
ALFbMSE for network capacity versus = 0.05, 0.1, and 0.5.
Table 3.
Time comparison.
In this paper, the modulation format of lightpaths are select as QPSK, 8QAM, 16QAM, 32QAM, and 64QAM, as shown in Table 4; the corresponding transmission bitrates are 100 Gbit/s, 150 Gbit/s, 200 Gbit/s, 250 Gbit/s, and 300 Gbit/s, respectively. The baud rate of the signal is 32 Gbaud. The FEC is calculated based on Equation (1), i.e., the prediction values of OSNR minus the design margin.
Table 4.
Corresponding of formats, data rates, and the according thresholds of FEC.
After the iterative learning process, we can find that when the lightpaths are deployed based on the prediction model ALFbMSE, the network capacity has the maximum value of 213.55 Tbit/s when is equal to 2.8. As for the prediction model ALFbMAE, the maximum network capacity is 213.75 Tbit/s when is 14. In short, the optimal values of are 2.8 and 14 for the prediction model ALFbMSE and ALFbMAE, shown as follows:
Similarly, for the NSF network, when and are 2.3 and 15.8, the network capacity base on ALFbMSE and ALFbMAE can reach the maximum values of 127.55 Tbit/s and 127.45 Tbit/s, respectively. This illustrates that the optimal solution of and is 2.3 and 15.8 for prediction model ALFbMSE and ALFbMAE, shown as follows:
In summary, this paper obtains the optimal prediction models ALFbMSE and ALFbMAE with asymmetric loss functions for Japan and NSF networks.
6. Simulation and Results Analysis
The predicted results for the Japan network and NSF network are shown in Figure 4 and Figure 5, respectively. Here, the black solid line means that the estimated value is equal to the real value. According to the test results, the prediction results of the models based on MSE and MSE are evenly distributed on both sides of the baseline, and the results of the model based on MAE are slightly better than those of MSE. That is because MSE is the average of all prediction values, and the MAE value is the midpoint of all prediction values of samples. Due to the fact that the median value is more robust than the mean value, thus the prediction of models with MAE is slightly better than that of MAE without controlling the prediction results.
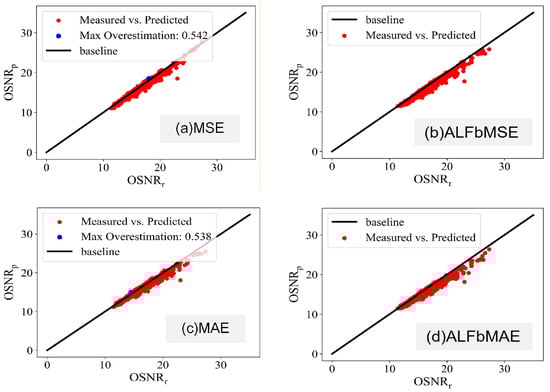
Figure 4.
Testing results of Japan network.
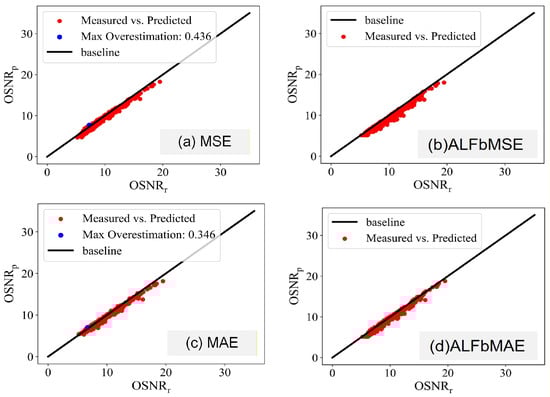
Figure 5.
Testing results of NSF network.
This paper aims to compare the relative performance of different loss functions within a consistent simulation framework. As a commonly used predictive model, the GN model has been widely adopted in numerous studies [13,29]. With a mean deviation of 0.2 dB in its predictions, the asymmetric loss function-based prediction method investigated in this paper remains unaffected by the inherent characteristics of the GN model.
We also employed the Bayesian optimization method, with the experimental results presented in Figure 6, which consistently demonstrates asymmetric effects of the proposed models.
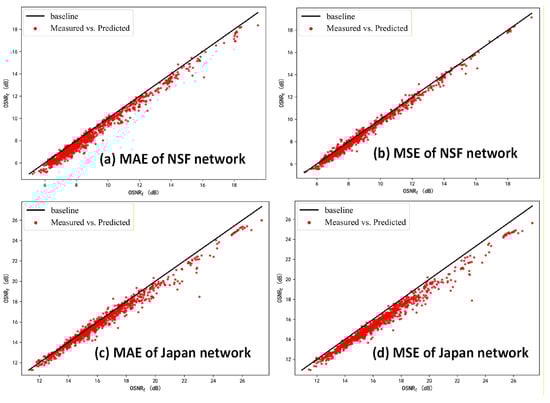
Figure 6.
Testing results of Bayesian optimization.
We have also introduced another ML model convolutional neural network (CNN); our proposed asymmetric losses (ALFbMSE/ALFbMAE) are also effective. Figure 7 shows the prediction OSNR based on CNN model versus the real OSNR values in the Japan network. The results demonstrate that both the CNN model and the ANN model adopted in this paper can successfully implement asymmetric prediction. This confirms the generalizability of our proposed method, which can be effectively realized using various supervised learning models to achieve the desired asymmetric prediction effect.
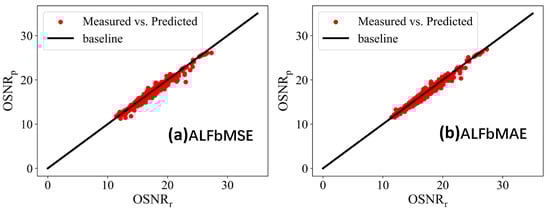
Figure 7.
CNN model for Japan network.
We evaluate the maximum overestimation about the four prediction models with different loss functions. As shown in Figure 8 and Figure 9, it can be seen that the performance of the models based on MSE and MAE are basically the same. In the Japan network, compared with the QoT estimator based on MSE, the maximum overestimation decreased significantly from 1.956 to 0.542 with the QoT estimator based on ALFbMSE, and the difference is 1.239. Meanwhile, compared with the QoT estimator based on MAE, the maximum overestimation decreased significantly from 1.889 to 0.538 with the QoT estimator based on ALFbMAE, and the difference is 1.351. With the decrease in the maximum overestimation, the accuracy also decreased slightly; that is, the ALFbMSE and ALFbMAE is increased about 0.2db compared with the model based on MSE and MAE. The results of the NSF network are similar to those of the Japan network. This suggests that the design margin is greatly decreased for the proposed prediction models with ALFbMSE and ALFbMAE. Based on the above analysis, when reduces, the available capacity of all the lightpaths will enlarge, which enhances the whole network capacity.
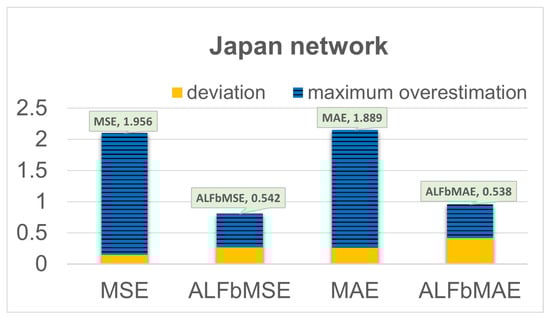
Figure 8.
Estimation results for Japan network.
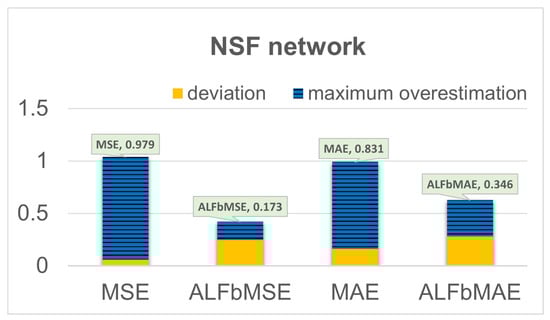
Figure 9.
Estimation results for NSF network.
In this section, we evaluate the network capacity of Japan and NSF networks using various prediction models. The results of network capacity are presented in Figure 10 and Figure 11. When using the prediction ANN models based on MSE and MAE, the network capacity of the Japan network is 205.4 Tbit/s and 206.35 Tbit/s, respectively. As for the proposed models based on ALFbMSE and ALFbMAE, the network capacity is 213.55 Tbit/s and 213.75 Tbit/s, which is more than the traditional ANN model based on MSE and MAE. Similarly, the network capacity of the NSF network is 121.9 Tbit/s and 124.1 Tbit/s when adopting the prediction ANN models based on MSE and MAE, while the network capacity is 127.55 Tbit/s and 127.45 Tbit/s. In short, the proposed models with asymmetric loss functions can increase the network capacity of the Japan and NSF networks significantly.
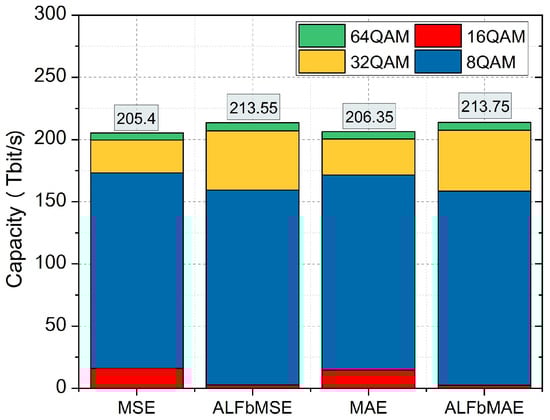
Figure 10.
Japan network capacity with various prediction models.
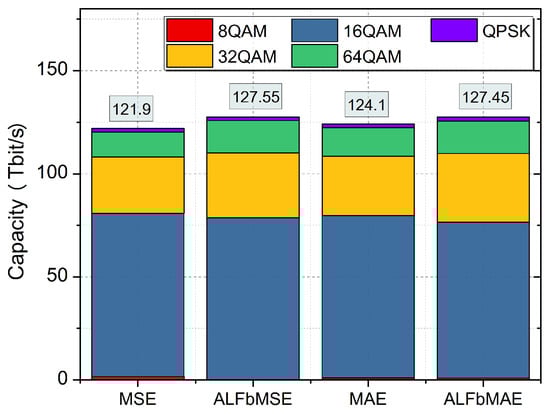
Figure 11.
NSF network capacity with various prediction models.
The reason for this is that compared to the QoT estimation model based on MSE, the model based on ALFbMSE can significantly reduce the maximum overestimation (i.e., ); thus, higher modulation formats can be selected for the lightpaths. As shown in Table 5, in the Japan network, the proportion of used modulation formats 8QAM is reduced from 7.8% to 1.3% and the proportion of used higher−order modulation formats 32QAM increased significantly from 12.8% to 22.2%; therefore, the total capacity increases from 205.4 Tbit/s to 213.55 Tbit/s, which improves 4.0% compared to the model based on MSE. Similarly, compared to QoT estimation model based on MAE, the proposed model based on ALFbMAE can increase network capacity from 206.35 Tbit/s to 213.75 Tbit/s, which is a 3.6% improvement. This is because the proportion of low-order modulation formats used, such as 8QAM, is reduced from 7.1% to 7.2% and the usage of 32QAM is increased from 14% to 22.9% in the NSF network.
Table 5.
Modulation format selection for Japan network.
As for the NSF network, as shown in Table 6, the proportion of low-order modulation formats such as QPSK is reduced from 65% to 61.6%, while the proportion of used higher-order modulation formats, such as 8QAM, is increased significantly from 22.4% to 24.7%, and the proportion of 16QAM increases from 9.9% to 12.3% in the NSF network; therefore, the whole network capacity increases from 121.9 Tbit/s to 127.55 Tbit/s when the proposed prediction model with the asymmetric loss function ALFbMSE is used.
Table 6.
Modulation format selection for NSF network.
In addition, due to the long length of the lightpath in the NSF network, the OSNR value of some ligthpaths is about 5 dB. Since the minimum modulation format is QPSK, the corresponding is 5.3 db. When the predicted value of the lightpath minus the corresponding maximum overestimation is less than 5.3 db, this suggests that the whole lightpath can be established in the NSF network. Compared to the QoT estimation model based on MSE, the number of lightpaths that cannot be connected has been reduced from 1.3% to 0% with the QoT estimator based on ALFbMSE. The total capacity increased from 121.9 Tbit/s to 127.55 Tbit/s, corresponding to a 4.6% improvement. In a similar way, compared to MAE, the proposed model based on ALFbMAE can make the total capacity increase from 124.1 Tbit/s to 127.45 Tbit/s, corresponding to a 2.7% improvement.
7. Conclusions
This paper investigates the influence of loss functions for low-margin network capacity enhancement. We propose novel ANN-based QoT prediction models with asymmetric loss functions (i.e., ALFbMAE and ALFbMAE) to reduce the maximum overestimation, thereby improving network capacity. Simulation results show that the proposed prediction models can converge quickly, and compared to the common ANN model, the proposed models make the network capacity of Japan and NSF networks increase without changing the structure of the models. In addition, this paper suggests that the intelligent optimization of the optical networks should not only focus on intelligent technologies, and more new indicators need to be further explored from the view of the whole network configuration.
Author Contributions
Methodology, Z.G.; Formal analysis, X.Q., Z.G., Y.D., W.C., X.J., Z.L. and X.H.; Investigation, W.C.; Writing–original draft, Z.G.; Writing– review & editing, W.C.; Supervision, Z.G.; Project administration, Z.G. and R.G. All authors have read and agreed to the published version of the manuscript.
Funding
This work was supported by the National Key R & D Program of China (2023YFB2905400).
Data Availability Statement
The data used to support the findings of this study are available from the corresponding author upon request.
Conflicts of Interest
The authors declare no conflicts of interest.
References
- Fiorani, M.; Monti, P.; Skubic, B.; Martensson, J.; Wosinska, L. Challenges for 5G transport networks. In Proceedings of the IEEE International Conference on Advanced Networks & Telecommuncations Systems, Kolkata, India, 15–18 December 2015. [Google Scholar]
- Pointurier, Y. Design of low-margin optical networks. J. Opt. Commun. Netw. 2017, 9, A9–A17. [Google Scholar] [CrossRef]
- Karandin, O.; Ferrari, A.; Musumeci, F.; Pointurier, Y.; Tornatore, M. Low-Margin Optical-Network Design with Multiple Physical-Layer Parameter Uncertainties. In Proceedings of the 2022 European Conference on Optical Communication (ECOC), Basel, Switzerland, 18–22 September 2022; pp. 1–4. [Google Scholar]
- Gu, Z.; Qin, T.; Zhou, Y.; Zhang, J.; Ji, Y. Sample-distribution-matching-based transfer learning for QoT estimation in optical networks. J. Opt. Commun. Netw. 2023, 15, 649–663. [Google Scholar] [CrossRef]
- Morais, R.M.; Pereira, B.; Pedro, J. Fast and High-Precision Optical Performance Evaluation for Cognitive Optical Networks. In Proceedings of the 2020 Optical Fiber Communications Conference and Exhibition (OFC), San Diego, CA, USA, 8–12 March 2020; pp. 1–3. [Google Scholar]
- Ouyang, Z.; Chen, X.; Liu, Z.; Chen, X.; Zhu, Z. Overview of ML-aided QoT Estimation in Optical Networks: A Perspective of Model Generalization. In Proceedings of the 2024 IEEE 24th International Conference on Communication Technology (ICCT), Chengdu, China, 18–20 October 2024; pp. 130–136. [Google Scholar] [CrossRef]
- Huang, Y.; Wang, Y.; Tai, Y.; Liu, X.; Shen, P.; Li, S.; Li, J.; Huang, F. CurricularFace: Adaptive Curriculum Learning Loss for Deep Face Recognition. In Proceedings of the 2020 IEEE/CVF Conference on Computer Vision and Pattern Recognition (CVPR), Seattle, WA, USA, 14–19 June 2020; pp. 5900–5909. [Google Scholar] [CrossRef]
- Sakthivel, S.; Alam, M.M.; Sajak, A.A.B.; Suud, M.M.; Belgaum, M.R. Enhancing Performance and Quality of Transmission Through Knowledge-Driven Machine Learning-Based FWM Mitigation. IEEE Access 2024, 12, 190650–190665. [Google Scholar] [CrossRef]
- Zhou, Y.; Gu, Z.; Zhang, J.; Ji, Y. Evolutionary neuron level transfer learning for QoT estimation in optical networks. J. Opt. Commun. Netw. 2024, 16, 432–448. [Google Scholar] [CrossRef]
- Lin, B.; Lai, Q.; Ghassemlooy, Z.; Tang, X. A Machine Learning Based Signal Demodulator in NOMA-VLC. J. Light. Technol. 2021, 39, 3081–3087. [Google Scholar] [CrossRef]
- Rottondi, C.; Barletta, L.; Giusti, A.; Tornatore, M. Machine-Learning Method for Quality of Transmission Prediction of Unestablished Lightpaths. IEEE/OSA J. Opt. Commun. Netw. 2018, 10, A286–A297. [Google Scholar] [CrossRef]
- Jing, S.; Xiaojun, L.; Kumar, S. Comparison of Split-Step Fourier Schemes for Simulating Fiber Optic Communication Systems. IEEE Photonics J. 2014, 6, 1–15. [Google Scholar] [CrossRef]
- Poggiolini, P. The GN Model of Non-Linear Propagation in Uncompensated Coherent Optical Systems. J. Light. Technol. 2012, 30, 3857–3879. [Google Scholar] [CrossRef]
- Yan, S.; Khan, K.N.; Mavromatis, A.; Gkounis, D.; Simeonidou, D. Field trial of Machine-Learning-assisted and SDN-based Optical Network Planning with Network-Scale Monitoring Database. In Proceedings of the ECOC 2017, Gothenburg, Sweden, 17–21 September 2017. [Google Scholar]
- Savory, S.J.; Vincent, R.J.; Ives, D.J. Design considerations for low-margin elastic optical networks in the nonlinear regime [Invited]. J. Opt. Commun. Netw. 2019, 11, C76. [Google Scholar] [CrossRef]
- Aladin, S.; Tremblay, C. Cognitive Tool for Estimating the QoT of New Lightpaths. In Proceedings of the 2018 Optical Fiber Communications Conference and Exposition (OFC), San Diego, CA, USA, 11–15 March 2018. [Google Scholar]
- Chen, X.; Li, B.; Proietti, R.; Liu, C.Y.; Yoo, S. Demonstration of Distributed Collaborative Learning with End-to-End QoT Estimation in Multi-Domain Elastic Optical Networks. Optics Express 2019, 27, 35700–35709. [Google Scholar] [CrossRef] [PubMed]
- Azzimonti, D.; Rottondi, C.; Giusti, A.; Tornatore, M.; Bianco, A. Active vs Transfer Learning Approaches for QoT Estimation with Small Training Datasets. In Proceedings of the Optical Fiber Communication Conference, San Diego, CA, USA, 8–12 March 2020. [Google Scholar]
- Wan, Z.; Yu, Z.; Shu, L.; Hu, S.; Xu, K. Dual-Stage Multiple Parameters Estimation for Low-Margin Elastic Optical Networks. IEEE Photonics Technol. Lett. 2020, 32, 109–112. [Google Scholar] [CrossRef]
- Khan, I.; Bilal, M.; Umar Masood, M.; D’Amico, A.; Curri, V. Lightpath QoT computation in optical networks assisted by transfer learning. J. Opt. Commun. Netw. 2021, 13, B72–B82. [Google Scholar] [CrossRef]
- Usmani, F.; Khan, I.; Masood, M.U.; Ahmad, A.; Shahzad, M.; Curri, V. Transfer learning Aided QoT Computation in Network Operating with the 400ZR Standard. In Proceedings of the 2022 International Conference on Optical Network Design and Modeling (ONDM), Warsaw, Poland, 16–19 May 2022; pp. 1–6. [Google Scholar] [CrossRef]
- Lonardi, M.; Pesic, J.; Zami, T.; Seve, E.; Rossi, N. The Glass of Machine Learning for Quality of Transmission Estimation Is Half Full. In Proceedings of the 2022 European Conference on Optical Communication (ECOC), Basel, Switzerland, 18–22 September 2022; pp. 1–4. [Google Scholar]
- Sartzetakis, I.; Christodoulopoulos, K.; Varvarigos, E. Accurate Quality of Transmission Estimation with Machine Learning. J. Opt. Commun. Netw. 2019, 11, 140–150. [Google Scholar] [CrossRef]
- Ibrahimi, M.; Abdollahi, H.; Rottondi, C.; Giusti, A.; Ferrari, A.; Curri, V.; Tornatore, M. Machine learning regression for QoT estimation of unestablished lightpaths. J. Opt. Commun. Netw. 2021, 13, B92–B101. [Google Scholar] [CrossRef]
- Shi, Y.; Gu, Z.; Zhang, J.; Zhou, Y.; Ji, Y. An ANN-based QoT Estimation Model with Asymmetric Loss Function for Networks Capacity Improvement. In Proceedings of the Conference on Lasers and Electro-Optics (CLEO), San Jose, CA, USA, 15–20 May 2022. [Google Scholar]
- Delezoide, C.; Ramantanis, P.; Layec, P. Leveraging Field Data For The Joint Optimization of Capacity and Availability in Low-Margin Optical Networks. J. Light. Technol. 2020, 38, 6709–6718. [Google Scholar] [CrossRef]
- Lin, B.; Yang, J.; Yu, H.; Chao, J.; Luo, J.; Huang, Y.; Yan, S.; Ghassemlooy, Z. A Deep Learning-Based CSS Modulation for NLOS Visible Light Communications. J. Light. Technol. 2025, 43, 5217–5224. [Google Scholar] [CrossRef]
- He, J.; Brandt-Pearce, M.; Subramaniam, S. Analysis of Blocking Probability for First-Fit Wavelength Assignment in Transmission-Impaired Optical Networks. IEEE/OSA J. Opt. Commun. Netw. 2011, 3, 411–425. [Google Scholar] [CrossRef]
- Roberts, I.; Kahn, J.M.; Harley, J.; Boertjes, D.W. Channel Power Optimization of WDM Systems Following Gaussian Noise Nonlinearity Model in Presence of Stimulated Raman Scattering. J. Light. Technol. 2017, 35, 5237–5249. [Google Scholar] [CrossRef]
Disclaimer/Publisher’s Note: The statements, opinions and data contained in all publications are solely those of the individual author(s) and contributor(s) and not of MDPI and/or the editor(s). MDPI and/or the editor(s) disclaim responsibility for any injury to people or property resulting from any ideas, methods, instructions or products referred to in the content. |
© 2025 by the authors. Licensee MDPI, Basel, Switzerland. This article is an open access article distributed under the terms and conditions of the Creative Commons Attribution (CC BY) license (https://creativecommons.org/licenses/by/4.0/).