Abstract
The refractive index (RI) is one of the liquid’s most important physical parameters of liquid. The change of RI usually indicates the change of liquid properties, and this relation leads to broad application. This paper proposes a method based on optical coherence tomography (OCT) to measure the RI of liquid in real time. A series of targeted image-processing techniques play a vital role in this method. Benefiting from the advantages of OCT, this method does not require the operators to come into direct contact with liquids. Moreover, the principles and techniques adopted in this method imply that the measuring range of RI of unknown liquids is unlimited. The effectiveness of this method is validated by the experiment measuring the RI of sucrose liquids with gradient concentration. Another experiment thoroughly verifies this method’s feasibility in predicting sucrose concentration based on real-time measured RI. This simple and easy proposed method indicates an immense potential application prospect in the industry and scientific research.
1. Introduction
The refractive index (RI) is a very important physical quantity of substances, especially for liquids. The concentration, purity, dispersion, and diffusion coefficient of the liquid can all be analyzed by its RI [1,2,3]. Therefore, RI is widely used in various fields of industrial production, such as the chemical industry, pharmacy, light industry, food and beverage, and environmental protection. This paper aims to provide a novel method for real-time measurement of liquids’ RI and monitoring their concentrations.
Numerous methods have been proposed to measure the RI of liquids [4,5,6,7,8,9,10,11,12,13,14,15]. Furthermore, they can be divided into refractometers and interferometers according to their operational principles. The operational principle of a refractometer is based on the phenomenon of refraction or reflection of light passing through the surface of an object. Then, the RI is measured according to the law of refraction or reflection [14,15]. These measurement methods are relatively simple, but they are widely and commercially used.
Among them, the most commonly used refractometers are based on the principle of total reflection. When light is incident from an optically denser medium to an optically sparser medium, the angle of refraction is always greater than the angle of incidence. When the angle of refraction reaches the critical value, total reflection occurs, and an obvious dividing line will appear between a light and dark field of view. The Abbe refractometer (AR) is a popular refractometer that measures RI based on this physical phenomenon [15]. The precision of AR is high, and a large measurement range of RI values can be reached, which is about 1.7000. However, there are also some disadvantages of AR, such as large size, requirement of manual operation, and disability of real-time measurement.
In recent years, liquid lenses have been proposed in RI measurement [16,17,18]. The latest research also introduces voltage driving to change the curvature of the electrowetting lens in real time, thereby changing the position of the optical focus and realizing the real-time measurement of the RI. The measurement accuracy of this study reaches 10−4, but the measurement range of RI is limited to 1.3300~1.4040 [19]. The practicality of such methods remains to be investigated.
Another traditional method for measuring RI is to utilize the interference or diffraction caused by the wave nature of light. Although the measurement accuracy of this method can resolve 10−6 theoretically, a tedious calculation is required [20]. Some measuring instruments are usually precise but complex, and more liquids are required for measurement [21,22]. The latest research indicates that microfluidic technology and special grating can reduce measured sample consumption and computational complexity [23,24]. However, the maturity and practicability of these technologies still need to be further verified.
This paper adopted optical coherence tomography (OCT), a mature optical interference imaging technology widely applied in various fields, primarily the biomedical domain [25,26,27,28]. Structurally, it is similar to the Michelson interferometer. However, it adopts low-coherence light to obtain 2D tomographic and 3D images of scattering media (e.g., biological tissue).
Up to now, OCT technology has been mainly used to obtain tomographic images of scanned objects. Although there have been some studies that applied OCT in RI measurement of biological or medical materials [28,29,30,31], it hasn’t been used to achieve real-time measurement of RI based on this proposed method to our knowledge.
Herein, the existing OCT system, the digital image processing techniques, and the simple supporting devices could be combined to provide a new method for RI real-time measurement.
2. Principles and Methods
- (1)
- Physical Principles
The related research on the RI measurement by OCT provides the relevant formula for measuring the RI of solid biological samples based on optical path matching [30,31,32]. Inspired by this, we assumed that the liquid flowed in a square tube and obtained the OCT image of this tube (see Figure 1). According to the matching relation between the optical path length and the image distance (pixels), we can extract the image distance from the OCT scan image using digital image processing technology and infer the RI of the liquid filled in the tube. Since the OCT system can continuously take tomographic images, the real-time measurement of refractive index and solution concentration can be realized.
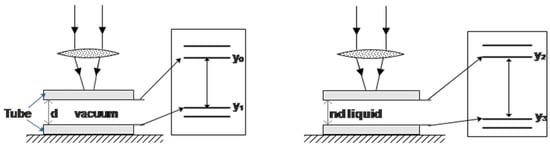
Figure 1.
Schematic diagram of the measuring principle and method.
Figure 1 illustrates the relationship between optical path length and OCT image distance. When the liquid tube is empty, the refractive index is set to 1 since it contains only air, which is close to the vacuum. The distance ‘’ between the upper and lower inner walls of the square tube is equal to the optical path length. The equation calculates the image distance corresponding to variable ‘’ in the OCT image. The equation to calculate ‘’ is
Assuming the measured liquid has an RI of , the optical path is ‘’, and the OCT image distance can be calculated after the tube is filled, and the corresponding equation is
Combining Equations (1) and (2), the RI of the measured liquid can be calculated as
Equation (3) illustrates that the measurement of RI can be converted to the measurement of OCT image distance. While Equation (4) provides a way to evaluate the measurement precision of RI, the RI value corresponding to image distance can be obtained in this study.
- (2)
- Image Processing Algorithm
According to the measurement principle, we introduce the Hough transform (HT) to extract the distance from the image quickly and exactly [33]. HT is the core technique in our OCT image processing.
Nevertheless, some image pre-processing needs to be done before HT can be applied. We need to take the OCT image and convert it into a grayscale image, then followed by edge extraction.
The method relies on edge extraction, where digital algorithms like the Canny operator process the grayscale image to locate tube wall edges in OCT images. However, this technique only provides discrete edge points, and image distance parameters remain unobtainable. Spatial deviations and missed points may also occur. The Hough transform (HT) provides a perfect solution, as shown in Figure 2.
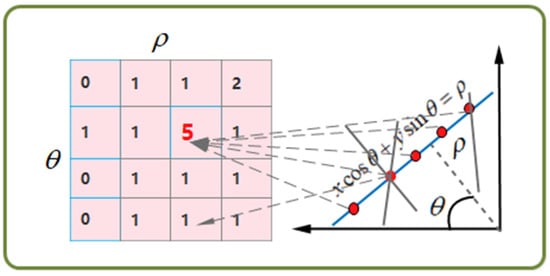
Figure 2.
Schematic diagram of principle of Hough transform. The number in the matrix Symbolically exhibits the number of received votes, which means corresponding number of points are on the specific straight line with the parameters ().
HT can recognize straight lines and circular figures using a general algorithm. For straight-line recognition, the equation in the coordinate space is . However, if the line is perpendicular to the -axis, will tend towards infinity. Therefore, the equation is transformed into a new parameter space called space and expressed as:
To determine , a 2D matrix of feasible solutions is created with initial values of zero. The canny operator is used to identify boundary points, and those that satisfy a specific line equation get a vote. The matrix element with the highest voting rate is selected to obtain . This method is less prone to interference than fitting a straight-line using image boundary points.
In the case of Figure 1, the HT helps to identify the tube’s inner wall and calculates its distance as a result of the simple image configuration, the inner and outer walls of the flow tube in OCT images can be recognized as four straight lines. By sorting the ρ values extracted by the HT of these four straight lines, it is possible to filter the two straight lines corresponding to the inner wall and simultaneously acquire the image distance between the inner wall. We used Quartz slides with a thickness of 0.1 mm to construct our flow tube, ensuring that the thickness of the flow tube wall does not impact the distance accuracy. The remaining task involves performing the requisite calculations based on values. If the fluid sample has a higher RI, we will narrow it down due to the limited scanning depth.
Since the direction of the parallel line is fixed, the angle is unchanged in the obtained parameter (), which can simplify the processing. Finally, the image distances, the ρ values, substituted in Equation (3), complete the corresponding calculation.
The overall workflow for image correlation processing due to OCT is given in Figure 3. A corresponding algorithm achieves each process link, automating the whole operation procedure. Firstly, the Hough transform is capable of accurately identifying straight and circular objects in digital images based on the edge points. Secondly, the voting statistical features of the algorithm exhibit high resistance to noise and interference. Furthermore, the robustness of the HT in this method is ensured by the long edge of the tube in OCT images, which maintains the stability and accuracy of the parameter of straight lines.
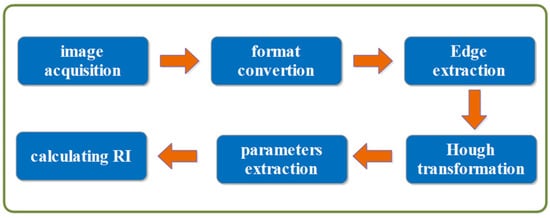
Figure 3.
Flow chart of image processing.
3. Experimental Setup and Materials
The principal instrument in this paper is a medical-type OCT system (Nanjing Furuiling Biotechnology Co., Ltd., Nanjing, China). This OCT system applies a single super luminescent diode with an 830 nm central wavelength and an over 20 nm spectral bandwidth as the light source. It is a spectral domain optical coherence tomography (SD-OCT) with superior capturing speed, signal-to-noise ratio, and sensitivity. It has high lateral resolution (~12 µm) and axial resolution (~8 µm), corresponding to the spatial resolution of each pixel of the OCT image. In addition, its imaging depth is ~2 mm in the air.
The tube containing the liquid is constructed of quartz glass. The liquid sample should fill the entire tube for each measurement to avoid coarse errors.
For the experimental materials, we first measured air and pure water. Then, a series of known concentrations of sucrose solutions were measured to build a quantitative relationship between RI, image distance, and concentration.
To confirm the possibility of real-time measurement, an experiment was conducted to measure the RI of sucrose solution with gradually changing concentrations.
In addition, our experiment was carried on under controlled conditions of air-conditioning, ensuring a stable environmental humidity (~45%) and temperature (~25 °C). Sometimes, the utilization of distilled water as a calibration value may prove to be an advisable option.
4. Results
We conducted OCT scans and post-processing on a 5% sucrose solution using the flow chart in Figure 3. Figure 4A displays the original OCT scan image. Figure 4B extracts the edge and boundary and realizes the image’s grayscale. Figure 4C presents the parameter space () by HT, and Figure 4 redraws the edge line diagram from the extracted parameters (). The algorithm’s effectiveness is validated by the line’s high consistency with the original images’ edges.
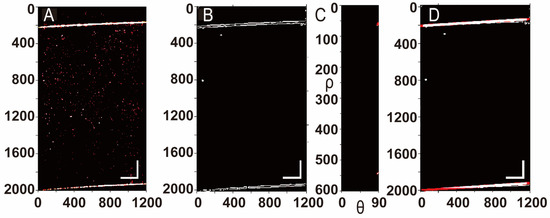
Figure 4.
(A) The original OCT image of 5% sucrose. (B) Grayscale of the original image and its boundary. (C) The parameter space (). (D) The redrawn edges according to the extracted parameters (). Scale bar 200 μm.
Then, a series of OCT images of sucrose solutions with different concentrations are implemented (see Figure 5A). Using the corresponding program, we automatically extract the corresponding parameters (see Table 1) and redraw the boundary (straight line) corresponding to the parameters (see Figure 5B). The corresponding results further verify the effectiveness of this method.
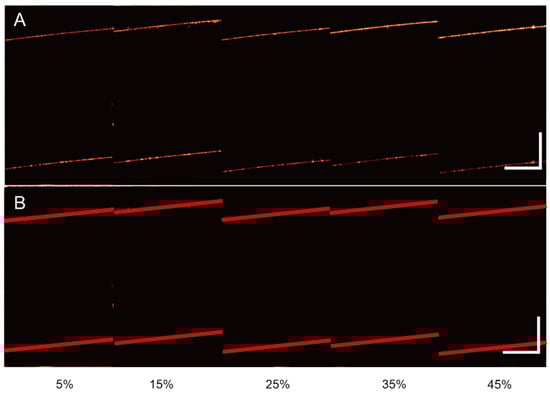
Figure 5.
(A) The original OCT images of different concentrations of sucrose solutions. (B) The processed images by the algorithm. Scale bar 400 μm.

Table 1.
The parameters obtained from OCT images of sucrose solutions with different concentrations.
Linear fitting is used to find the quantitative relation between solution concentration and RI. The concentration-RI and concentration-image distance curves are shown in Figure 6A,B, respectively. They indicate that the concentration RI and the concentration-image distance are nearly linear. This experimental design and algorithm can be used to automatically extract image distances in OCT images and obtain solution concentrations in real time. Equation (4) shows that the RI resolution is 0.0038/pixel, and the concentration resolution is 0.32%/pixel. The results of low-concentration sucrose solution exhibit the limit of detection (LOD) approaches 1% according to the 3S statistical index, and the resolution of sucrose concentration has the equivalent value.
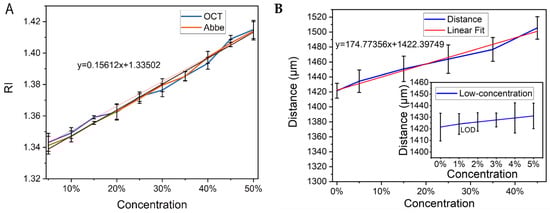
Figure 6.
(A) The fitting curve of concentration-RI. (B) The fitting curve of concentration-image distance and the subfigure displays the relation between low-concentration sucrose solution and image distances. ‘LOD’ is the label of the limit of detection.
Figure 7 displays OCT images and concentration curves of a continuously diluted sucrose solution at one-minute intervals. Table 2 provides the numerical values obtained by the algorithm. As the solution dilutes, concentration, RI, and edge distance decrease in Figure 7A. The algorithm extracts image distance values using HT, which can be substituted into the fitting equation to calculate the corresponding concentration. OCT scans can continuously or periodically monitor the real-time RI and concentration of liquids.
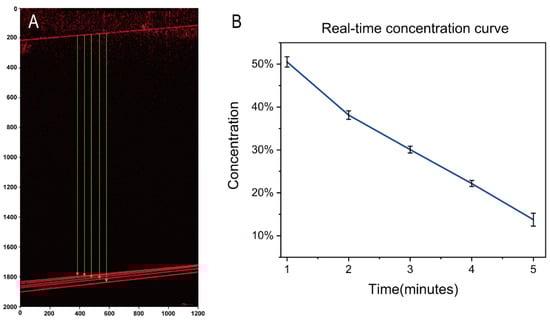
Figure 7.
(A) OCT images of continuously diluted sucrose solution sharing the edge of up inner wall. (B) the corresponding measured concentration curve of diluted sucrose solution.
Table 2.
Calculation results of Figure 7.
5. Discussion
These findings demonstrate the practicality and usefulness of the proposed method, which is unaffected by the range of RI values and offers a high level of safety and stability. The measurement can be taken non-invasively in a closed space, and the radius of the tube can be adjusted to suit liquids with high or low RI values, ensuring an appropriate image distance. Therefore, this method has an unlimited range for measuring the RI of liquids. Additionally, it is worth noting that the method is not affected by the volatility of the liquid, which makes up for the limitations of the Abbe refractometer.
However, compared to the Abbe refractometer, this method has lower measurement accuracy, with an accuracy of 0.0001. The RI resolution is adjusted virtually by the geometric distance, as per Equation (2). The imaging depth of OCT is primarily limited by the depth of penetration of the light source in the sample and the finite number of pixels and optical resolution in Fourier-domain OCT. The imaging depth is determined by the sampling rate of the spectral data and is governed by the Nyquist theorem.
Virtually, the current configuration and parameters of the OCT system in this research affect the penetration depth and the axis resolution to a considerable extent, which is targeted for medical utility. A new configuration of the OCT system, with longer scanning depth and higher axial and image resolution, will improve the accuracy of measurement. Comparative research has confirmed the feasibility of this configuration [32,33,34,35,36], with advancements such as the number of pixels per A-line reaching 4096 and the extended depth range up to 24 mm [35,36]. These advancements have greatly improved the application prospect of this research, leading to a more optimistic outlook.
6. Conclusions
The principle of the proposed method is quite simple. Moreover, from a technical point of view, it is also a fusion of two existing and mature technologies, i.e., OCT and digital image processing technologies. Therefore, the technical realization is easy, so its feasibility and practicability are optimistic.
In brief, this study provided a new and powerful competitive solution for measuring the RI of fluids, especially in real-time.
Author Contributions
Conceptualization, H.F. and J.Z.; methodology, H.F.; validation, H.F. and W.G.; formal analysis, Z.L. and Z.Z.; investigation, H.F.; resources, J.Z.; data curation, H.F. and W.G.; writing—original draft preparation, H.F. and W.G.; writing—review and editing, H.F. and W.S.; supervision, J.Z.; project administration, J.Z.; funding acquisition, J.Z. All authors have read and agreed to the published version of the manuscript.
Funding
This research is supported by the National Key R&D Program of China (2022YFC2304205).
Institutional Review Board Statement
Not applicable.
Informed Consent Statement
Not applicable.
Data Availability Statement
The data presented in this study are available on request from the corresponding author. The data are not publicly available due to further study.
Conflicts of Interest
The authors declare no conflict of interest.
References
- Singh, V.K.; Jaswal, B.B.S.; Kumar, V.; Prakash, R.; Rai, P. Application of He-Ne laser to study of the variation of refractive index of liquid solutions with the concentration. J. Integr. Sci. Technol. 2013, 1, 13–18. [Google Scholar]
- Syed, M.B. Analysis of biodiesel by high-performance liquid chromatography using refractive index detector. MethodsX 2017, 4, 256–259. [Google Scholar] [CrossRef] [PubMed]
- Hifzhi, A.; Soedarmawan, L.; Pambudi, S.; Sudarmaji, A.; Handoko, D. Simple Liquid-Liquid Diffusion Coefficient Measurement System Based on Refractive Index Gradients. In Proceedings of the 2017 International Seminar on Sensor, Instrumentation, Measurement and Metrology: Innovation for the Advancement and Competitiveness of the Nation, ISSIMM 2017, Surabaya, Indonesia, 25–26 August 2017; Institute of Electrical and Electronics Engineers Inc.: Piscataway, NJ, USA, 2017; pp. 65–68. [Google Scholar]
- Yan, X.; Li, B.; Cheng, T.; Li, S. Analysis of high sensitivity photonic crystal fiber sensor based on surface plasmon resonance of refractive indexes of liquids. Sensors 2018, 18, 2922. [Google Scholar] [CrossRef] [PubMed]
- Mitu, S.A.; Aktar, M.N.; Ibrahim, S.M.; Ahmed, K. Surface Plasmon Resonance–Based Refractive Index Biosensor: An External Sensing Approach. Plasmonics 2022, 17, 1581–1592. [Google Scholar] [CrossRef]
- Yang, A.; Li, W.; Yuan, G.; Dong, J.; Zhang, J. Measuring the refractive indices of liquids with a capillary tube interferometer. Appl. Opt. 2006, 45, 7993–7998. [Google Scholar] [CrossRef]
- Khashan, M.A.; Nassif, A.Y. Accurate measurement of the refractive indices of solids and liquids by the double-layer interferometer. Appl. Opt. 2000, 39, 5991–5997. [Google Scholar] [CrossRef] [PubMed]
- Tang, J.; Qiu, G.; Zhang, X.; Wang, J. A 3D-cascade-microlens optofluidic chip for refractometry with adjustable sensitivity. Lab Chip 2021, 21, 3784–3792. [Google Scholar] [CrossRef]
- Polynkin, P.; Polynkin, A.; Peyghambarian, N.; Mansuripur, M. Evanescent field-based optical fiber sensing device for measuring the refractive index of liquids in microfluidic channels. Opt. Lett. 2005, 30, 1273–1275. [Google Scholar] [CrossRef]
- Calixto, S.; Aguilar, M.R.; Hernandez, D.M.; Milkovich, V.P. Capillary refractometer integrated in a microfluidic configuration. Appl. Opt. 2008, 47, 843–848. [Google Scholar] [CrossRef]
- Chen, M.; Jia, W.; He, J.; Geiser, M.; Zheng, G. A miniaturized system for measurement of the refractive index of sub-microliter liquid. Chin. Opt. Lett. 2019, 17, 041201. [Google Scholar] [CrossRef]
- Tai, Y.H.; Wei, P.K. Sensitive liquid refractive index sensors using tapered optical fiber tips. Opt. Lett. 2010, 35, 944–946. [Google Scholar] [CrossRef]
- Murade, C.U.; Oh, J.M.; Van den Ende, D.; Mugele, F. Electrowetting driven optical switch and tunable aperture. Opt. Express 2011, 19, 15525–15531. [Google Scholar] [CrossRef]
- Singh, S. Measuring the refractive index of a liquid using a laser. Phys. Educ. 2002, 37, 152. [Google Scholar] [CrossRef]
- Rheims, J.; Köser, J.; Wriedt, T. Refractive-index measurements in the near-IR using an Abbe refractometer. Meas. Sci. Technol. 1997, 8, 601. [Google Scholar] [CrossRef]
- Liu, C.; Wang, D.; Wang, Q.H. Variable aperture with graded attenuation combined with adjustable focal length lens. Opt. Express 2019, 27, 14075–14084. [Google Scholar] [CrossRef] [PubMed]
- Xu, M.; Liu, Y.; Yuan, Y.; Lu, H.; Qiu, L. Variable-focus liquid lens based on electrically responsive fluid. Opt. Lett. 2022, 47, 509–512. [Google Scholar] [CrossRef]
- Duangkanya, K.; Kopwitthaya, A.; Chanhorm, S.; Infahsaeng, Y. Oxygen plasma treatment time induced hydrophilicity of polydimethylsiloxane (PDMS) thin films for liquid lenses application. Mater. Today Proc. 2022, 65, 2442–2445. [Google Scholar] [CrossRef]
- Li, S.L.; Nie, Z.Q.; Tian, Y.T.; Liu, C. Liquid refractive index measurement system based on electrowetting lens. Micromachines 2019, 10, 515. [Google Scholar] [CrossRef]
- Goodman, J.W. Introduction to Fourier Optics, 2nd ed.; McGraw-Hill, Inc.: New York, NY, USA, 1996; pp. 32–61. [Google Scholar]
- Sun, J.H.; Wang, M. Measuring the refractive index of liquid by optical fiber Young’s interference experiment. Phys. Exp. Coll. 2005, 18, 8–10. [Google Scholar]
- Deng, G.; Cai, Z.; Zhang, Y.; Xu, Y.; Wu, S.; Zhou, J. Refraction index measurement of transparent materials by using diffraction grating and CCD. Acta Opt. Sin. 2004, 24, 99–103. [Google Scholar]
- Calixto, S.; Bruce, N.C.; Rosete-Aguilar, M. Diffraction grating-based sensing optofluidic device for measuring the refractive index of liquids. Opt. Express 2016, 24, 180–190. [Google Scholar] [CrossRef]
- Calixto, S.; Piazza, V.; Gonzalez-Suarez, A.M.; Garcia-Cordero, J.L.; Bruce, N.C.; Rosete-Aguilar, M.; Garnica, G. Liquid refractive index measured through a refractometer based on diffraction gratings. Opt. Express 2019, 27, 34705–34720. [Google Scholar] [CrossRef] [PubMed]
- Lin, Y.; Xiang, X.; Chen, T.; Mao, G.; Deng, L.; Zeng, L.; Zhang, J. In vivo monitoring the dynamic process of acute retinal hemorrhage and repair in zebrafish with spectral-domain optical coherence tomography. J. Biophoton. 2019, 12, e201900235. [Google Scholar] [CrossRef] [PubMed]
- Lin, Y.; Chen, T.; Mao, G.; Qiu, T.; Lan, Y.; Xiang, X.; Huang, J.; Huang, J.; Lu, T.; Gan, S.; et al. Long-term and in vivo assessment of Aβ protein-induced brain atrophy in a zebrafish model by optical coherence tomography. J. Biophoton. 2020, 13, e202000067. [Google Scholar] [CrossRef]
- Huang, D.; Swanson, E.A.; Lin, C.P.; Schuman, J.S.; Stinson, W.G.; Chang, W.; Hee, M.R.; Flotte, T.; Gregory, K.; Puliafito, C.A.; et al. Optical coherence tomography. Science 1991, 254, 1178–1181. [Google Scholar] [CrossRef] [PubMed]
- Sun, J.; Lee, S.J.; Wu, L.; Sarntinoranont, M.; Xie, H. Refractive index measurement of acute rat brain tissue slices using optical coherence tomography. Opt. Express 2012, 20, 1084–1095. [Google Scholar] [CrossRef] [PubMed]
- Tearney, G.J.; Brezinski, M.E.; Southern, J.F.; Bouma, B.E.; Hee, M.R.; Fujimoto, J.G. Determination of the refractive index of highly scattering human tissue by optical coherence tomography. Opt. Lett. 1995, 20, 2258–2260. [Google Scholar] [CrossRef]
- Knuettel, A.R.; Boehlau-Godaum, M. Spatially confined and temporally resolved refractive index and scattering evaluation in human skin performed with optical coherence tomography. J. Biomed. Opt. 2000, 5, 83–92. [Google Scholar] [CrossRef]
- Binding, J.; Arous, J.B.; Léger, J.F.; Gigan, S.; Boccara, C.; Bourdieu, L. Brain refractive index measured in vivo with high-NA defocus-corrected full-field OCT and consequences for two-photon microscopy. Opt. Express 2011, 19, 4833–4847. [Google Scholar] [CrossRef]
- Photiou, C.; Pitris, C. Dual-angle optical coherence tomography for index of refraction estimation using rigid registration and cross-correlation. J. Biomed. Opt. 2019, 24, 106001. [Google Scholar] [CrossRef]
- Duda, R.O.; Hart, P.E. Use of the Hough transformation to detect lines and curves in pictures. Commun. ACM 1972, 15, 11–15. [Google Scholar] [CrossRef]
- Spaide, R.F.; Koizumi, H.; Pozonni, M.C. Enhanced depth imaging spectral-domain optical coherence tomography. Am. J. Ophthalmol. 2008, 146, 496–500. [Google Scholar] [CrossRef] [PubMed]
- Shao, Y.; Tao, A.; Jiang, H.; Shen, M.; Zhu, D.; Lu, F.; Karp, C.L.; Ye, Y.; Wang, J. Long scan depth optical coherence tomography on imaging accommodation: Impact of enhanced axial resolution, signal-to-noise ratio and speed. Eye Vis. 2018, 5, 16–27. [Google Scholar] [CrossRef] [PubMed]
- Gong, Z.; Shi, Y.; Wang, R.K. De-aliased depth-range-extended optical coherence tomography based on dual under-sampling. Opt. Lett. 2022, 47, 2642–2645. [Google Scholar] [CrossRef] [PubMed]
Disclaimer/Publisher’s Note: The statements, opinions and data contained in all publications are solely those of the individual author(s) and contributor(s) and not of MDPI and/or the editor(s). MDPI and/or the editor(s) disclaim responsibility for any injury to people or property resulting from any ideas, methods, instructions or products referred to in the content. |
© 2023 by the authors. Licensee MDPI, Basel, Switzerland. This article is an open access article distributed under the terms and conditions of the Creative Commons Attribution (CC BY) license (https://creativecommons.org/licenses/by/4.0/).