Abstract
The buildup dynamics of diode-pumped passively mode-locked solid-state laser is thoroughly explored using the real-time measurement with temporal sampling rate of up to 40 GHz. A concise cavity is developed to ensure the transient dynamics purely arising from the gain medium and saturable absorber. Experimental results reveal that the laser output in the buildup process exhibits numerous passively Q-switched pulses followed with a damped relaxation oscillation prior to the stable mode locking. Furthermore, it is confirmed that the laser output has already displayed single clean mode-locked pulses inside the first several Q-switched envelopes before stepping into the stage of relaxation oscillation. The present real-time exploration is expected to provide important information for practical applications with temporal modulation of the pump intensity.
1. Introduction
Techniques used to achieve mode locking in lasers can be classified as “active” or “passive”. Active techniques typically involve the use of external signals to induce modulation of light within the cavity. On the other hand, passive techniques do not use external signals, but instead rely on putting some components into the laser cavity, which induce the self-modulation of the light. Passively continuous-wave mode-locked (CWML) solid-state lasers with saturable absorbers [1,2,3] have been widely used in various applications of time-resolved measurements, material processing, and other precise spectroscopies [4,5,6]. Saturable absorbers, such as semiconductor saturable absorber mirror (SESAM) and carbon nanotube, can be deliberately introduced into the laser cavity to self-start mode locking by providing nonlinearity [7,8,9]. Understanding the phase locking process of a large number of longitudinal cavity modes is greatly helpful for designing passively mode-locked lasers and valuable for finding the novel applications of ultrafast laser sources [10,11,12,13]. Several theoretical models have been proposed to explain the observed threshold power for the self-starting of the mode locking and to explore the buildup dynamics using the Ginzburg–Landau equation [14,15]. In theoretical models, the initial optical wave is generally assumed to be a single-pulse fluctuation residing on a continuous background [16,17,18,19]. However, it has been recently found that the initial multiple-pulse phase and pulse-splitting phase last for a long time in the buildup dynamics in self-starting of soliton mode-locked fiber lasers [20]. Furthermore, the relaxation oscillations were observed to speed up the starting process in dissipative-soliton fiber lasers [21]. In contrast, it is worth noting that there are no previous experimental reports on the transient process of initial pulse evolutions and the role of relaxation oscillations in passively CWML solid-state lasers. Therefore, exploring the transient pulse evolution in real-time measurements is important for understanding the starting dynamics of passively CWML solid-state lasers [22,23,24,25].
So far, the cavity structures used in the passively mode-locked solid-state lasers mainly comprise the V-shaped [26], Z-shaped [27,28], and W-shaped [29] configurations. In spite of different configurations, the common purposes are to satisfy the designed requirements of the cavity length related to the pulse repetition rate, the mode size on the gain medium for pumping overlap, and the mode size of the saturable absorber for obtaining stable CWML. The complexity of the cavity configuration somewhat introduces additional influences on the transition dynamics of the mode locking buildup. Consequently, it is greatly useful for exploring the buildup dynamics to construct a passively mode-locked solid-state laser with minimal components in the cavity configuration.
In this work, we perform the real-time measurement to explore the starting dynamics of diode-pumped passively CWML laser. The laser cavity is designed to contain only three components of a Nd:YVO4 crystal, a SESAM device, and a focusing lens to eliminate the unwanted influence on the buildup dynamics. A fast photodetector and a digital oscilloscope with 40 Giga sampling rate are used to directly measure the transient behaviors in various expanded time scales. Experimental results reveal that the laser output in the buildup process consists of a series of passively Q-switched pulses followed with a damped relaxation oscillation prior to the stable mode locking. The number of passively Q-switched pulses and the damping time of the relaxation oscillation decrease with increasing the pump power. Furthermore, the temporal traces inside the first several Q-switched envelopes clearly manifest the transient evolution of the laser output from a random set of spikes to the emergence of a single clean pulse within each round-trip period. It is indicated that the buildup time for the complete phase locking is significantly shorter than that for the stable mode locking. To the best of our knowledge, this result is the first direct observation of the buildup dynamics of a passively mode-locked solid-state laser with SESAM. The present real-time measurement is believed to provide useful insights into applications with temporal modulation of the pump intensity.
2. Experimental Setup
Figure 1 shows the experimental setup of passively mode-locked solid-state laser for exploring the buildup dynamics in the turn-on process. To investigate the transient dynamics purely arising from the gain medium and saturable absorber, the laser cavity was designed to comprise only three components of a Nd:YVO4 crystal, a SESAM device, and a focusing lens. The pump source was a fiber-coupled semiconductor laser with wavelength at 808 nm, where the fiber had a core diameter of 200 μm and a numerical aperture of 0.16. The gain medium was a a-cut 0.35 at.% Nd:YVO4 crystal with a dimension of 3 × 3 × 8 mm3. One facet of the Nd:YVO4 crystal was a plane surface that was coated as a rear mirror with high reflection (HR) at 1064 nm (reflectance > 99.8%) and high transmission at 808 nm (transmittance > 95%). The other facet of the laser crystal with a wedged angle of 0.5° for avoiding the internal etalon effect had an anti-reflection (AR) coating at 808 nm and 1064 nm (reflectance < 0.2%). The Nd:YVO4 crystal wrapped with indium foil was mounted in water-cooled copper block with temperature held at 20 °C. The saturable absorber was a SESAM device that was simultaneously designed as an output coupler, abbreviated as SESAMOC [4,5]. The SESAM device was monolithically grown on an undoped GaAs substrate with the method of metalorganic chemical vapor deposition. The SESAMOC was composed of 10 pairs of distributed Bragg reflectors (DBRs) that were formed by AlAs/GaAs quarter-wavelength layers with the effective reflectivity of approximately 96.5% at 1064 nm. The absorbing material of the SESAMOC was made of two 8 nm In0.34Ga0.66As quantum well that provided an effective modulation depth of 0.8% with the saturable fluence of 50 μJ/cm2. Furthermore, the back side of the 350 μm GaAs substrate was coated for AR at 1064 nm (reflectance < 0.5%). The SESAMOC device was soldered on a copper holder with temperature maintained at 20 °C. A focusing lens with a focal length of f = 100 mm was used to satisfy the criterion of self-starting CWML cavity. Both sides of the focusing lens were coated for AR at 1064 nm (reflectance < 0.5%). Experimental optical spectra were measured using a Michelson interferometer-based Fourier spectrometer (Advantest Q8347) with a resolution of up to 0.003 nm. Temporal characteristics of mode-locked pulses were measured using a high-speed InGaAs photodetector (Electro-Optics Technology Inc., (Idar, Germany) ET-3500 with rise time of 35 ps), whose output signal was recorded using a digital oscilloscope (Teledyne LeCroy, Chestnut Ridge, NY, USA, Wave Master 820Zi-A) with a 20 GHz electrical bandwidth and the sampling rates of 25 ps. Moreover, the output signal detected by the photodetector was also connected to an RF spectrum analyzer (Agilent, 8563EC, Santa Clara, CA, USA) with a bandwidth of 26.5 GHz to measure the output power spectrum. The second-order autocorrelation traces were measured using a commercial autocorrelator (APE pulse check, Angewandte Physik and Elektrnic GmbH, Berlin, Germany) to analyze the effective pulse width.
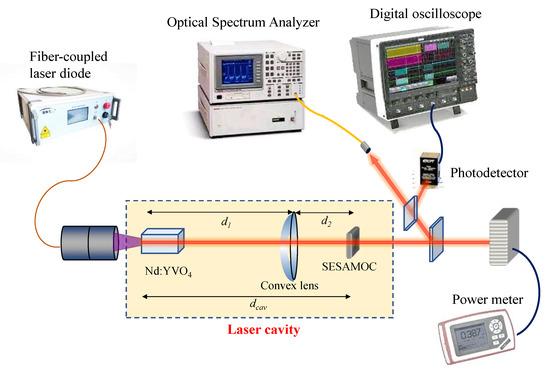
Figure 1.
Experimental setup of passively mode-locked solid-state laser for exploring the buildup dynamics in the turn-on process.
3. Analysis of Cavity Mode Sizes
As shown in Figure 1, d1 is the effective optical length between the HR side of the laser crystal and the focusing lens, and d2 is the effective optical length between the focusing lens and the output plane of the SESAMOC. By using the ABCD matrix method, the mode radius for the TEM00 at the HR side of Nd:YVO4 crystal can be derived as
where λ is the laser wavelength. On the other hand, the cavity mode radius at the output plane of the SESAMOC can be found to be
In the experiment, the distances of d1 and d2 are designed be 460 and 125 mm, respectively. Substituting the values of f, d1, and d2 into Equations (1) and (2), the mode radii and can be calculated to be approximately 203 and 53 μm, respectively. The values of and will be used in the following section. The optical length of the laser cavity is approximately 585 mm corresponding to the repetition rate of 256 MHz.
4. Criterion for the Regimes of Q-Switched and CW Mode Locking
Saturable absorbers can be used in solid-state lasers to start up the CWML; however, they also usually drive lasers into the so-called Q-switched mode-locked (QML) states. In the QML operation, the laser output exhibits the characteristic of mode-locked pulses in a Q-switched envelope. Due to the conventional cavity length, mode-locked pulse repetition rates are typically in the order of 100 MHz, while typical Q-switched modulations are in the order of 100 kHz. These Q-switch instabilities are undesirable for many applications requiring constant pulse energy and high repetition rates. However, for certain applications, such as nonlinear wavelength conversion, laser micromachining, or ablation applications, the QML mechanism may be attractive because the pulse energy is significantly increased but still concentrated in ultrashort mode-locked pulses. Regardless, understanding QML-related solid-state laser dynamics is important to explore the transition dynamics of CWML.
For a passively mode-locked solid-state laser under the CW pumping scheme, there is a critical intracavity pulse energy, , which is the minimum intracavity pulse energy for obtaining stable CWML, i.e., for , the CWML operation can be achieved, and for , the laser output is displayed in the QML state, where is the energy of a mode-locked pulse in the cavity. As shown in Figure 2, the QML state (Figure 2a) exhibits that the pulse energy is modulated with a strongly peaked Q-switching envelope, while in the CWML regime (Figure 2b), the laser output displays a train of mode-locked pulses with constant pulse energy. The experimental results shown in Figure 2a,b were obtained with the present laser cavity at the pump powers of 1.0 and 2.0 W, respectively.
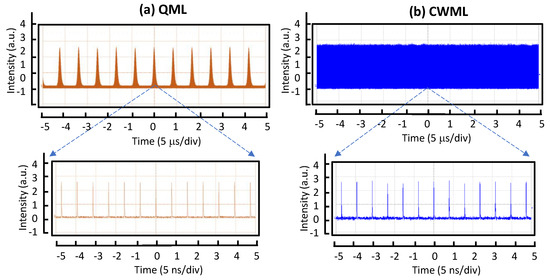
Figure 2.
Measured oscilloscope traces at two different time spans for (a) the operation of QML obtained at the pump power of 1.0 W and (b) the operation of CWML obtained at the pump power of 2.0 W.
Figure 3a shows the average output power versus the pump power for the laser operation. At a pump power of 6.3 W, the output power for stable passive mode locking is approximately 1.3 W, corresponding to the optical-to-optical conversion efficiency of 20.6%. The pump power for lasing threshold was found to be around 0.1 W, whereas pump power as high as 1.2 W was required for stable mode locking. Figure 3b shows the measured power spectral density at a pump power of 3.0 W for a representative case of the experimental results. The power spectral density reveals a signal-to-noise ratio higher than 60 dB, indicating the excellent quality of stable mode locking. Figure 3c shows the measured oscilloscope traces at four different time spans ranging from 10 ns to 50 μs to display good stability and CW mode locking. From the autocorrelation trace, the real pulse duration of CW mode locking was estimated to be approximately 20 ps based on the assumption of the Gaussian-shaped profile.
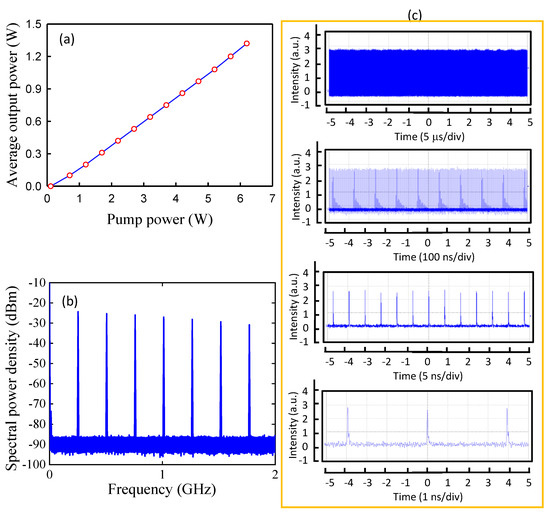
Figure 3.
(a) Average output power versus the pump power for the laser operation. (b) Measured power spectral density at a pump power of 3.0 W for a representative case of the experimental results. (c) Measured oscilloscope traces at four different time spans ranging from 10 ns to 50 μs.
Hönninger et al. [30] used the rate equations for the intracavity power, gain, and saturable absorption to derive a stability criterion against QML by performing a linearized stability analysis analogous to the derivation of the Q-switching criterion [31,32]. With certain approximations, the critical intracavity pulse energy as the square root of the QML parameter can be derived as [30]
where is the saturation fluence of the gain medium, the effective laser mode area inside the gain medium, is the saturation fluence of the saturable absorber, the effective laser mode area inside the saturable absorber, and is the modulation depth of the absorber. The saturation fluence of the gain medium is given by , where is the photon energy, σ is the stimulated emission cross section, and the factor m is the number of passes through the gain element per cavity round trip. For a ring cavity, , while for a simple standing wave cavity .
In the present experiment, the average output power for the critical transition from QML to CWML was found to be around 0.2 W, corresponding to the intracavity power of 5.5 W. Accordingly, the critical pulse energy can be experimentally determined to be approximately 21.5 μJ. On the other hand, Equation (3) can be used to calculate the theoretical value for the critical pulse energy . By using the physical parameters of nJ/cm2, nJ/cm2, cm2, cm2, and , the theoretical value for the critical pulse energy can be calculated to be 20.5 μJ. The theoretical value can be seen to agree very well with experimental result. In the following study, the transition dynamics will be explored with the pulse pumping scheme.
5. Results and Discussion
For exploring the transient or dynamic behavior of laser oscillators, it is necessary to clarify the terminologies used in the description of experimental phenomena. The terms of spikes, relaxation oscillations, and gain switching refer to various kinds of comparatively slow but different amplitude oscillations that are often observed by many solid-state lasers, either when the laser is first turned on, or when the laser is suddenly perturbed by any kind of small fluctuation in gain, cavity loss, or cavity alignment. The term “spike” is used to refer to the discrete, sharp, large-amplitude pulses that typically occur during the initial turn-on phase. The term “relaxation oscillation” is used to describe the small-amplitude, quasi-sinusoidal, exponentially damped oscillations near the steady-state amplitude, following the initial spiking behavior. Spikes and relaxation oscillations are characteristic phenomena of most solid-state lasers, semiconductor lasers, and fiber lasers, where the recovery time of the population inversion of the excited state is much longer than the cavity decay time. In this exploration, the occurrence of spikes includes the influence of the saturable absorber. Therefore, we use the term of passively Q-switched pulse instead of spikes for discussing the experimental observations.
To explore the buildup dynamics, the pump source of the laser diode was electronically operated at a pump duration of 500 μs with a pump frequency of 1 kHz. The pump-on duration of 500 μs is sufficiently long to observe the pulse evolution. Furthermore, the pump-off cycle of 500 μs is also long enough to clean up the residual population density, since the upper-state lifetime tf is approximately 90 μs. The laser output was directly measured using a digital oscilloscope with 40 Giga sampling rate with a fast photodetector. Based on thorough experimental observations, it is confirmed that under the optimal cavity alignment the buildup process of the mode locking mainly depended on the pumping strength, rather insensitive to environmental perturbations, such as air flow, acoustic noise, and thermal variations. Consequently, experimental results could be utterly reproducible. Figure 4a–e show the oscilloscope traces for the transient turn-on behavior measured at different pump powers in the time span of 500 μs. The transient feature of the buildup process can be found to comprise a series of passively Q-switched pulses followed with damped relaxation oscillations. The number of passively Q-switched pulses can be clearly seen to decrease with increasing the pump strength. From the results shown in Figure 4, the buildup time for the stable mode locking, tML, can be identified as the duration from the turn-on time of the pump power to the end of the damped relaxation oscillation. Referring to tf = 90 μs, the buildup time tML decreases from a few times to a fraction of the upper-level lifetime for the pump power increasing from 1.5 to 5.0 W.
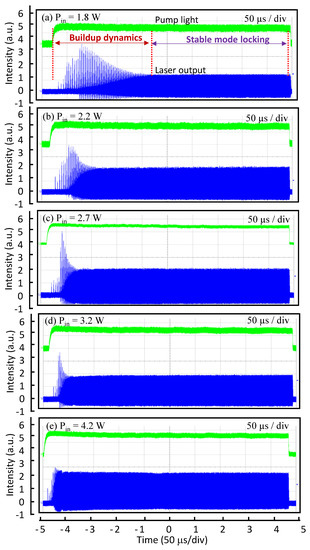
Figure 4.
(a–e) Oscilloscope traces for the transient turn-on behavior measured at different pump powers in the time span of 500 μs; green lines: pump light; blue lines: laser output.
The formation process for the phase locking in the transient turn-on dynamics can be comprehended from the temporal characteristics inside the passively Q-switched envelopes. Figure 5a shows the oscilloscope traces for the transient dynamics measured at a pump power of 2.6 W in a time span of 55 μs. It can be found that each passively Q-switched pulse is approximately a fraction of a microsecond wide and spaced a few microseconds apart. After growing to a maximum, the Q-switched pulses are gradually transformed into a quasi-sinusoidal relaxation oscillation, then damping to the stable mode locking. The phase locking process between lasing longitudinal modes in the buildup dynamics can be further explored by looking into the temporal behaviors inside the Q-switched envelopes. The six plots with labels (1)–(6) in Figure 5b show the temporal traces in a time span of 50 ns measured from the intensities inside the first six Q-switched envelopes shown in Figure 5a, respectively. From the left-hand column of Figure 5b for the first three Q-switched pulses, the laser output can be seen to consist not of single clean pulses but of a random set of spikes, essentially a noise-like feature, with the spikes distributed throughout the entire round-trip period. Nevertheless, it can be found that the signal output is still strictly periodic in time, that is, it repeats exactly after one cycle. The signature of random spikes within each round-trip cycle indicates that the laser output consists of a large number of longitudinal modes with random phases, regardless of whether the amplitude distribution is random or more orderly. Precisely, the laser output in the first three Q-switched pulses can be called a case of mode coupling that does not achieve the phase locking. The cubic–quintic complex Ginzburg–Landau equation may describe qualitatively well this observation [33]. From the right-hand column of Figure 5b for the Q-switched pulses with labels (4)–(6), the transient evolution of phase locking can be clearly observed. From the plot (6) in Figure 5b, the laser output has already displayed a single clean pulse within each round-trip period. In other words, the lasing longitudinal modes have been arrayed all in phase to reach a phase-locked situation.
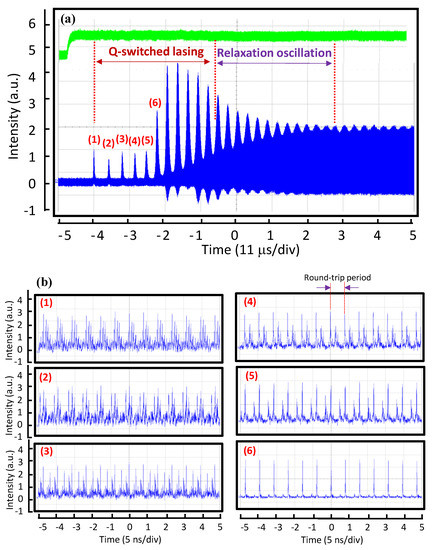
Figure 5.
(a) Oscilloscope traces for the transient dynamics measured at a pump power of 2.6 W in a time span of 55 μs; green lines: pump light; blue lines: laser output. (b) Temporal traces in a time span of 50 ns measured from the intensities inside the first six Q-switched envelopes shown in (a).
It is worth mentioning the distinction between mode coupling and mode locking. Any superposition of a set of longitudinal modes equally spaced in frequency, regardless of their relative magnitudes and phases, will certainly result in an output signal envelope that is periodic in time with a fundamental period equal to the reciprocal of the interval between adjacent longitudinal modes. Thus, any such state can generally be referred to as a mode-coupling situation, regardless of the signal variation over a period, since the modes are all coupled together with fixed (even if irregular) amplitude and phase. On the other hand, the term of mode locking is only used for conditions in which the longitudinal modes are all arranged in phase; under these circumstances, constructive interference between the superposed longitudinal modes can lead to the laser output to be a train of extremely short pulses. The buildup time for the complete phase locking, tPL, can be ascertained as the duration from the turn-on time of the pump power to the emergence of a single clean pulse within each round-trip period. Figure 6 shows the experimental results for the buildup times tPL and tML versus the pump power. Clearly, the buildup time tPL for the complete phase locking is significantly shorter than the time tML for the stable mode locking.
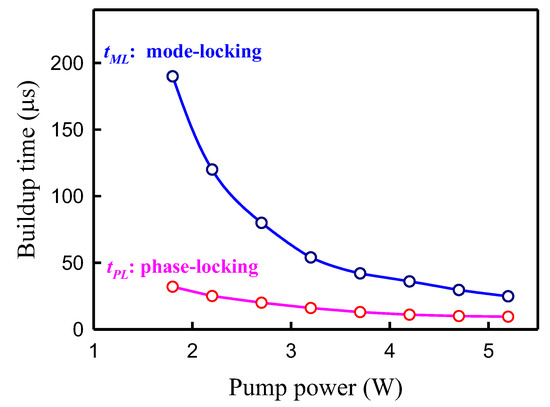
Figure 6.
Experimental results for the buildup times for the complete phase locking and stable mode locking versus the pump power.
6. Conclusions
In summary, we have explored the buildup dynamics of diode-pumped passively mode-locked solid-state laser by means of the real-time measurement with temporal sampling rate up to 40 GHz. We have designed the laser cavity comprising only three components to ensure the transient dynamics purely arising from the gain medium and saturable absorber. The laser output in the buildup process was observed to exhibit a number of passively Q-switched pulses followed with a damped relaxation oscillation prior to the stable mode locking. The buildup time for the stable mode locking was found to decrease from a few times to a fraction of the upper-level lifetime for the pump power increasing from slightly to far above lasing threshold. Furthermore, we have experimentally confirmed that the laser output has already displayed single clean mode-locked pulses inside the first several Q-switched envelopes, which indicates that the buildup rate for the complete phase locking is substantially faster than that for the stable mode locking. It is believed that the present real-time exploration can offer important information for practical applications with temporal modulation of the pump intensity.
Author Contributions
Conceptualization, P.-W.C. and Y.-F.C.; validation, P.-W.C. and H.-C.L.; formal analysis, P.-W.C. and Y.-F.C.; resources, Y.-H.H. and X.-W.C.; writing—original draft preparation, Y.-F.C.; writing—review and editing, P.-W.C., H.-C.L. and Y.-F.C.; supervision, Y.-F.C. All authors have read and agreed to the published version of the manuscript.
Funding
This work is supported by National Science and Technology Council of Taiwan (contract number 109-2112-M-009-015-MY3).
Institutional Review Board Statement
Not applicable.
Informed Consent Statement
Not applicable.
Data Availability Statement
All data reported in the paper are presented in the main text. Any other data will be provided on request.
Conflicts of Interest
The authors declare no conflict of interest.
References
- Chen, C.J.; Wai, P.K.A.; Menyuk, C.R. Self-starting of passively mode-locked lasers with fast saturable absorbers. Opt. Lett. 1995, 20, 350–352. [Google Scholar] [CrossRef]
- Haus, H.A. Mode-Locking of Lasers. IEEE J. Sel. Top. Quantum Electron. 2000, 6, 1173–1185. [Google Scholar] [CrossRef]
- Soto-Crespo, J.M.; Akhmediev, N.; Town, G. Continuous-wave versus pulse regime in a passively mode locked laser with a fast saturable absorber. J. Opt. Soc. Am. B 2002, 19, 234–242. [Google Scholar] [CrossRef]
- Picqué, N.; Hänsch, T.W. Frequency comb spectroscopy. Nat. Photonics 2019, 13, 146–157. [Google Scholar] [CrossRef]
- Phillips, K.C.; Gandhi, H.H.; Mazur, E.; Sundaram, S.K. Ultrafast laser processing of materials: A review. Adv. Opt. Photon. 2015, 7, 684–712. [Google Scholar] [CrossRef]
- Diddams, S.A.; Vahala, K.; Udem, T. Optical frequency combs: Coherently uniting the electromagnetic spectrum. Science 2020, 369, eaay3676. [Google Scholar] [CrossRef] [PubMed]
- Keller, U. Recent developments in compact ultrafast lasers. Nature 2003, 424, 831–838. [Google Scholar] [CrossRef]
- Chernysheva, M.; Rozhin, A.; Fedotov, Y.; Mou, C.; Arif, R.; Kobtsev, S.M.; Dianov, E.M.; Turitsyn, S.K. Carbon nanotubes for ultrafast fibre lasers. Nanophotonics 2017, 6, 1–30. [Google Scholar] [CrossRef]
- Rafailov, W.S.E.U.; Cataluna, M.A. Mode-locked quantum-dot lasers. Nat. Photonics 2007, 1, 395–401. [Google Scholar] [CrossRef]
- Herink, G.; Jalali, B.; Ropers, C.; Solli, D.R. Resolving the build-up of femtosecond mode-locking with single-shot spectroscopy at 90 MHz frame rate. Nat. Photonics 2016, 10, 321–326. [Google Scholar] [CrossRef]
- Liu, X.; Cui, Y. Revealing the behavior of soliton buildup in a mode-locked laser. Adv. Photon. 2019, 1, 016003. [Google Scholar] [CrossRef]
- Liu, X.; Pang, M. Revealing the buildup dynamics of harmonic mode-locking states in ultrafast lasers. Laser Photon. Rev. 2019, 13, 1800333. [Google Scholar] [CrossRef]
- Liu, X.; Popa, D.; Akhmediev, N. Revealing the Transition Dynamics from Q Switching to Mode Locking in a Soliton Laser. Phys. Rev. Lett. 2019, 123, 093901. [Google Scholar] [CrossRef]
- Popov, M.; Gat, O. Pulse growth dynamics in laser mode locking. Phys. Rev. A 2018, 97, 011801. [Google Scholar] [CrossRef]
- Uzunov, I.M.; Georgiev, Z.D.; Arabadzhiev, T.N. Transitions of stationary to pulsating solutions in the complex cubic-quintic Ginzburg-Landau equation under the influence of nonlinear gain and higher-order effects. Phys. Rev. E 2018, 97, 052215. [Google Scholar] [CrossRef]
- Haus, H.A.; Ippen, E.P. Self-starting of passively mode-locked lasers. Opt. Lett. 1991, 16, 1331–1333. [Google Scholar] [CrossRef]
- Krausz, F.; Brabec, T.; Spielmann, C. Self-starting passive mode locking. Opt. Lett. 1991, 16, 235–237. [Google Scholar] [CrossRef]
- Krausz, F.; Brabec, T. Passive mode locking in standing-wave laser resonators. Opt. Lett. 1993, 18, 888–890. [Google Scholar] [CrossRef]
- Hermann, J. Starting dynamic, self-starting condition and mode-locking threshold in passive, coupled-cavity or Kerr-lens mode locked solid-state lasers. Opt. Commun. 1993, 98, 111–116. [Google Scholar] [CrossRef]
- Liu, S.; Chen, Y.; Huang, L.; Cao, T.; Qin, X.; Ning, H.; Yan, J.; Hu, K.; Guo, Z.; Peng, J. Optimal conditions for self-starting of soliton mode-locked fiber lasers with a saturable absorber. Opt. Lett. 2021, 46, 2376–2379. [Google Scholar] [CrossRef]
- Li, H.; Ouzounov, D.G.; Wise, F.W. Starting dynamics of dissipative-soliton fiber laser. Opt. Lett. 2010, 35, 2403–2405. [Google Scholar] [CrossRef] [PubMed]
- Wei, W.; Liu, R.; Zhao, S.; Yang, K.; Li, D.; Guo, L.; Wang, Y. Simulation of the passively mode-locked laser with a SESAM. Optik 2012, 123, 2191–2194. [Google Scholar] [CrossRef]
- Waritanant, T.; Major, A. High efficiency passively mode-locked Nd:YVO4 laser with direct in-band pumping at 914 nm. Opt. Express 2016, 24, 12851–12855. [Google Scholar] [CrossRef] [PubMed]
- Waritanant, T.; Major, A. Discretely selectable multiwavelength operation of a semiconductor saturable absorber mirror mode-locked Nd:YVO4 laser. Opt. Lett. 2017, 42, 3331–3334. [Google Scholar] [CrossRef]
- He, H.; Liu, X.; Song, Y.; Wang, C.; Cao, M.; Yan, A.; Wang, Z. LD end-pumped Nd: YVO4 high energy high beam quality 1064 nm picosecond laser with a semiconductor saturable absorber mirror. Optik 2018, 175, 172–176. [Google Scholar] [CrossRef]
- Iliev, H.; Buchvarov, I.; Choi, S.Y.; Kim, K.; Rotermund, F.; Petrov, V. 1.34 μm Nd:YVO4 laser mode-locked by a single-walled carbon nanotube saturable absorber. In Proceedings of the Solid State Lasers XXI: Technology and Devices, San Francisco, CA, USA, 22–25 January 2012; Volume 8235, p. 82350I. [Google Scholar]
- Chen, Y.F.; Tsai, S.W.; Lan, Y.P.; Wang, S.C.; Huang, K.F. Diode-end-pumped passively mode-locked high-power Nd:YVO4 laser with a relaxed saturable Bragg reflector. Opt. Lett. 2001, 26, 199–201. [Google Scholar] [CrossRef] [PubMed]
- Liu, Y.H.; Xie, Z.D.; Pan, S.D.; Lv, X.J.; Yuan, Y.; Hu, X.P.; Lu, J.; Zhao, L.N.; Chen, C.D.; Zhao, G.; et al. Diode-pumped passively mode-locked Nd:YVO4 laser at 1342 nm with periodically poled LiNbO3. Opt. Lett. 2011, 36, 698–700. [Google Scholar] [CrossRef]
- Yang, Y.; Xu, J.-L.; He, J.-L.; Yang, X.-Q.; Zhang, B.-Y.; Yang, H.; Liu, S.-D.; Zhang, B.-T. Diode-pumped passively mode-locked Nd:YAG laser at 1338 nm with a semiconductor saturable absorber mirror. Appl. Opt. 2001, 50, 6713–6716. [Google Scholar] [CrossRef]
- Hönninger, C.; Paschotta, R.; Morier-Genoud, F.; Moser, M.; Keller, U. Q-switching stability limits of cw passive mode locking. J. Opt. Soc. Am. B 1999, 16, 46–56. [Google Scholar] [CrossRef]
- Haus, H.A. Parameter ranges for cw passive modelocking. IEEE J. Quantum Electron. 1976, 12, 169–176. [Google Scholar] [CrossRef]
- Kärtner, F.X.; Brovelli, L.R.; Kopf, D.; Kamp, M.; Calasso, I.; Keller, U. Control of solid-state laser dynamics by semiconductor devices. Opt. Eng. 1995, 34, 2024–2036. [Google Scholar] [CrossRef]
- Tél, T.; Lai, Y.C. Chaotic transients in spatially extended systems. Phys. Rep. 2008, 460, 245–275. [Google Scholar] [CrossRef]
Disclaimer/Publisher’s Note: The statements, opinions and data contained in all publications are solely those of the individual author(s) and contributor(s) and not of MDPI and/or the editor(s). MDPI and/or the editor(s) disclaim responsibility for any injury to people or property resulting from any ideas, methods, instructions or products referred to in the content. |
© 2023 by the authors. Licensee MDPI, Basel, Switzerland. This article is an open access article distributed under the terms and conditions of the Creative Commons Attribution (CC BY) license (https://creativecommons.org/licenses/by/4.0/).