Abstract
The main bearing of the shield machine has a huge structure and severe service conditions, which are prone to wear and fatigue damage. To improve the anti-wear and anti-fatigue ability of the raceway surface of the shield main bearing, laser transformation hardening under different parameters of the shield main bearing raceway material 42CrMo steel was researched. The effects of laser power and scanning speed on the phase transformation of 42CrMo steel and the depth of the hardened layer were studied. The numerical model was verified using the theoretical and experimental results. Orthogonal tables of laser processing parameters are established. The results show that the depth of the hardened raceway layer increases with increased laser power and decreased laser scanning speed. According to the results of orthogonal primary and secondary analyses and fuzzy comprehensive evaluation, the depth of the hardened layer of the raceway can reach 1.08 mm, and the hardened layer is relatively uniform (laser power, 2250 W; scanning speed, 20 mm/s; spot length, 5 mm). The research in this paper provides a theoretical basis and technological innovation for the processing methods and engineering applications of high-reliability and long-life shield main bearings, which is of great engineering significance.
1. Introduction
Shield machines are core equipment essential to the building of roads, railways, tunnels and other major national infrastructure. The main bearing of the shield machine is one of the core components of a shield machine that connects the blade to the shield body. The failure of the main bearing makes the shield machine unable to work. The shield’s main bearing has a huge structural size and is subjected to huge loads, as shown in Figure 1. Thousands of internal friction pairs are difficult to lubricate and replace in the case of failure. The rapid heating and cooling characteristics of laser phase change hardening enable the laser-phase-change-hardened surface to have higher hardness and wear resistance than conventional quenching. Laser phase change hardening increases the hardness of the hardened layer by 15–20% compared to conventional quenching, and wear resistance can also be significantly increased.
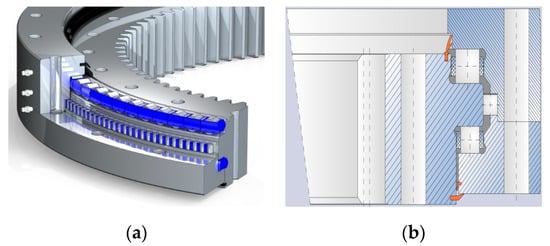
Figure 1.
(a) Shield main bearing; (b) Shield main bearing structure.
Much research has been conducted in regard to laser phase hardening theory, processes and experiments. Wang et al. [1] performed numerical simulations of the laser quenching process, and their model allows for the optimization of process parameters based on layer depth. Soukieh et al. [2] developed a mathematical model for the laser treatment of double-layer alloys to predict the temperature field distribution in the heating region. Amado et al. [3] used the Laplace transform boundary element method to solve the Gaussian distributed heat source of transient heat transfer. Takayoshi et al. [4] used a finite difference model to simulate the variation of heat flow with time using the 3D finite element method for the laser quenching temperature field, and the experimental results were in better agreement with the theoretical results. In terms of process advantages, Orazi et al. [5] conducted a comparative test of laser hardening and induction hardening on columnar 25CrNiMo specimens, highlighting the high energy efficiency and flexibility of laser hardening. Karabutov et al. [6] used optical measurements to study the absorption and radiation of energy after the laser irradiation of a material surface. Komanduri et al. [7] analyzed the effect of three different forms of the energy distribution of the spot on quenching properties and optimized the quenching efficiency of AISI 1036 material. Rana et al. [8] performed laser hardening experiments on carbon steel specimens with different carbon contents, examined and analyzed the characterization of the hardened zones, selected the optimum process parameters and analyzed the optimum spacing between two adjacent hardened zones. Kim et al. [9] performed multi-pass lap laser hardening on SM45C and analyzed the effect of the latter lap on the hardness of the former pass. Miokovic et al. [10] studied the laser hardening of AISI 4142 steel with laser quenching and self-tempering and studied the effect of temperature cycling on tissue formation. Liu et al. [11] conducted a semiconductor laser single- and multi-pass hardening path study on grey cast iron, analyzed the tissue characteristics of the superimposed zone and optimized the processing parameters. Devgun et al. [12] carried out laser phase hardening on 52100 bearing steel, and the hardness and wear resistance of the bearing steel were greatly improved. Rana et al. [13] carried out laser phase hardening on carbon steel based on a CO2 laser and optimized the uniformity and effect of phase hardening through repeated tests. Lus et al. [14] used ANSYS simulation to solve the temperature variation pattern of the laser phase hardening process for ring parts and verified the results with AISI1045 steel phase hardening experiments. The results were verified through the experimental phase hardening of AISI 1045 steel.
The mechanisms of the laser phase hardening of shield main bearings are very complex, and further experimental work and theoretical research are needed. Some of the above scholars focused on the experimental parts of the study, the simulation of laser phase hardening of the specimen is mostly only to simulate its temperature field changes, and the change of each phase of the specimen under different experimental parameters is less studied. The temperature field and the evolution of each phase in the laser phase hardening process of 42CrMo steel are analyzed in this paper. The heat conduction time and temperature gradient in the phase hardening process are controlled through the optimization of process parameters to obtain a finer martensite organization, uniform hardness distribution and higher hardening layer depth, providing a better theoretical basis for the laser phase hardening experiment, which is of great engineering significance for improving the wear and fatigue resistance of shield main bearings.
2. Numerical Model for Laser Phase Hardening of Shield Main Bearing Raceway Surfaces
2.1. Material 42CrMo Parameters of Shield Main Bearing Raceway
The inner and outer ring material of the shield main bearing is 42CrMo, and the material composition is shown in Table 1. During the laser treatment process, the material temperature will change drastically, and its thermophysical property parameters will change with the change of temperature under the effect of heat. The variation of the thermal property parameters of each tissue of the material with temperature obtained from the SYSWELD database is shown in Figure 2.

Table 1.
42CrMo chemical composition.
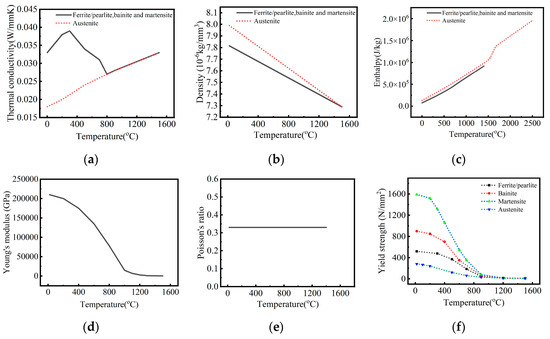
Figure 2.
42CrMo material parameters in SYSWELD software material library (a) Thermal conductivity; (b) Density; (c) Enthalpy; (d) Young’s modulus; (e) Poisson’s ratio; (f) Yield strength.
2.2. Numerical Model of Laser Phase Hardening of Shield Main Bearing Raceways
Laser quenching is mainly a solid heat transfer process, without considering flow heat generation, viscous heat generation, pressure heat generation, etc., and the heat source is added in the form of a boundary, so its heat transfer control equation is shown in Formula (1), where , and are the density, specific heat capacity and the thermal conductivity of the material.
The action layer of the laser on the sample includes the heating layer that directly absorbs the laser and the heating layer caused by heat transfer [15,16]. It is assumed that the laser energy is all transferred from the light spot irradiation area on the upper surface of the plate. The laser heat flux density is set as Flux, the light spot area is set as , the length and width are and , respectively, and the flat-top rectangular light spot is used so it can be considered that the heat flux density at the laser irradiation is equal. The absorptivity of the material to the laser is . The depth of the laser hardening layer under different absorptivity is simulated and compared with the experimental results. Finally, the value is set as 0.85 through temperature measurement verification. Since the surface of the sample is polished, and the upper surface of the sample is preset with a light-absorbing coating, it is assumed that only the upper surface has radiation and heat dissipation, and the radiation coefficient is .
The boundary control conditions of the upper surface of the sample are shown in Formula (2), where is the Boltzmann constant, t1 is the working time from the start of the laser to the stop, Text is the external temperature (293.15 K), T is the sample temperature and t< t1 represents the time from 0 to t1.
The boundary control conditions of the sample are analyzed, and the corresponding values of h0 and h1 are calculated. For the natural convection heat transfer coefficient, h1, of the horizontal and vertical walls, this paper uses the Rayleigh number (Ra) to judge the change in the heat transfer law under different flow patterns. By deducing the energy equation of natural convection, Equation (5) can be obtained.
Different Ra values determine the fluid flow pattern in a natural convection state, according to the literature [15,17], by calculating that the Nusset Nu and convective heat transfer coefficient h have the following two conditions:
(1) The situation of the horizontal plate is shown in Formula (6), where T>Text indicates that the sample temperature is greater than the outside temperature; that is, the hot side is upward.
(2) For the natural convection of a vertical wall, the convective heat transfer coefficient is as shown in Formula (7).
To improve the efficiency of the laser phase hardening simulation, the raceway surface laser phase hardening model was built as a rectangular body with a length of 40 mm, a width of 30 mm and a height of 10 mm. The workpiece is usually blackened before laser phase hardening to improve the absorption rate. A 50% absorption rate was chosen for the blackened state of the workpiece. The model is shown in Figure 3. The heat source model used the Gaussian heat source, a red arrow direction for the laser spot movement direction, a yellow dashed box for the heat-affected zone and the rest of the air-cooled zone. The bottom surface is fixed when simulating the actual laser phase hardening. The white dot indicated by the arrow is node 42,713 of the model. The temperature at this point is relatively smooth, in line with the actual working conditions. The simulation will use this point as the data collection point. The selected laser head spot is a circular uniform spot with a 5 mm diameter.
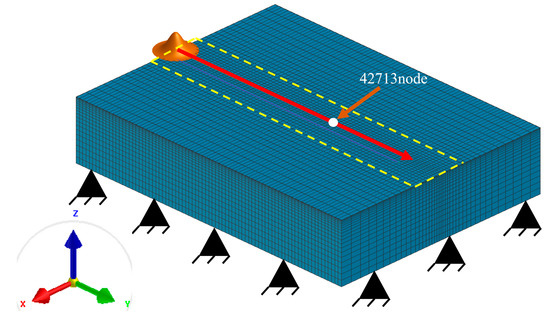
Figure 3.
Laser phase transformation hardening model of shield main bearing.
2.3. Numerical Model Validation of Laser Phase Hardening of Shield Main Bearing Raceways
To verify the validity of the shield main bearing raceway laser phase hardening numerical model established in this paper, the same laser process parameters and substrate materials as Zhang et al. [15] were used for verification. The experimental equipment parameters are shown in Table 2. Figure 4a shows the actual heat source cross-section image obtained from the experiment, and Figure 4b shows the simulated heat source martensite content map obtained from the SYSWELD software simulation. The comparison shows that the actual heat source cross-section and the simulated heat source cross-section are similar, and the simulated and experimental results are in good agreement.
Table 2.
Main parameters of semiconductor laser.
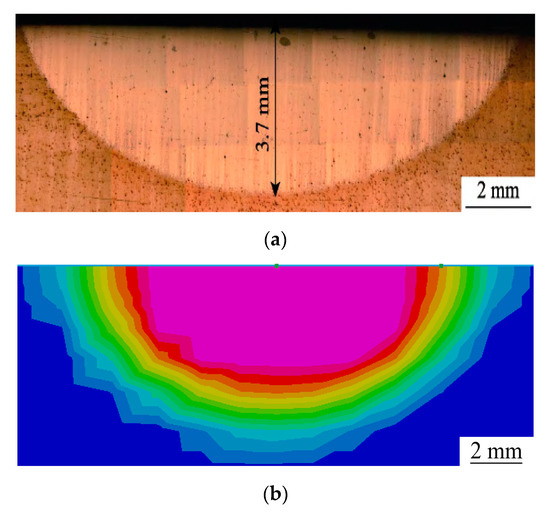
Figure 4.
Comparative results (a) Cross-sectional image of the actual heat source obtained from the experiment; (b) Simulated heat source cross-section.
According to the empirical equation for the effect of the alloying elements on the martensitic transformation point (Ms point) [16]:
where C is the Carbon, Cr is the Chromium, Mn is the Manganese, Ms is the martensitic transformation, Mo is the Molybdenum, Ni is the Nickel, Si is the Silicon and W is the Tungsten.
A vertical line is drawn at the starting point when the martensite transformation begins, as shown in Figure 5a, and the intersection with the abscissa is the time when the transformation begins. A vertical line is drawn at the time point when martensite begins to transform, and the abscissa temperature value that intersects the curve is the temperature at which martensite begins to transform, as shown in Figure 5b. By comparing with the empirical formula to verify the analysis, the simulation results in the simulation of the occurrence of a martensitic transformation temperature of 356 °C. According to the empirical Equation (1), the beginning of the martensitic transformation point, Ms, has a temperature of 363.05 °C. The error is 2.5%. The numerical simulation and the theoretical formula obtained from the martensite transformation temperature error are small, and the temperature of the martensite transformation point is verified. In summary, the established numerical model of laser phase transformation strain on the surface of the shield main bearing raceway is valid and can be used for the subsequent analysis of the laser process parameters.
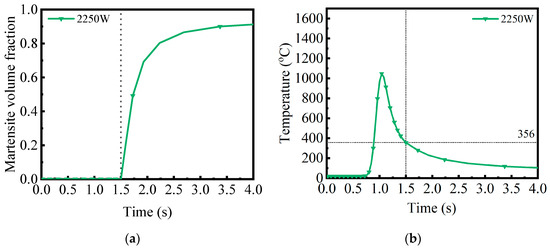
Figure 5.
Martensite result validation (a) Martensite volume fraction; (b) Time–temperature graph.
3. Results and Discussion
The Ac1 of 42CrMo steel is about 730 °C and Ac3 is about 775 °C [18]. The high heating rate of laser phase hardening leads to an increase in the phase change temperature [19]. The phase change temperature of 42CrMo is taken to be 800 °C in this paper, and the maximum temperature does not exceed the melting point of 1400°C [15]. The experiments were divided into several groups according to different laser scanning speeds and different laser powers. The spot diameter was 5 mm, and the spot scanning speed was increased gradually from 15 mm/s in 5 mm/s steps to 30 mm/s. The power was increased gradually from 1500 W to 2250 W in 250 W steps.
3.1. Power and Scanning Speed Effect of Laser Phase Hardening on the Surface of Shield Main Bearing Raceways
The maximum shield main bearing raceway surface temperature increases with increasing laser power at the same laser scanning speed, as shown in Figure 6a. The faster the scanning speed, the shorter the time the laser acts on the surface of the substrate at the same power. The less heat is input, and the area of the material surface that can be heated above the austenitizing temperature is reduced, leading to a reduction in the width and depth of the hardened layer. The maximum shield main bearing raceway surface temperature is 1348 °C at a laser scanning speed of 15 mm/s and a laser power of 2250 W, which is close to the melting temperature of 42CrMo steel. The maximum surface temperature of the shield main bearing raceway is 671 °C at a laser scanning speed of 30 mm/s and a laser power of 1500 W, which is not close to the austenitic phase transformation temperature of 42CrMo steel. The maximum martensite content on the raceway surface of the shield main bearing increases with increasing laser power at the same laser scanning speed, as shown in Figure 6b. When the laser phase hardening temperature reaches the raceway surface to reach austenite temperature, the maximum martensite content of the shield main bearing raceway surface remains at around 95%. The laser is used for phase hardening to obtain a high martensite content, which is beneficial for improving the hardness and wear resistance of the raceway surface.
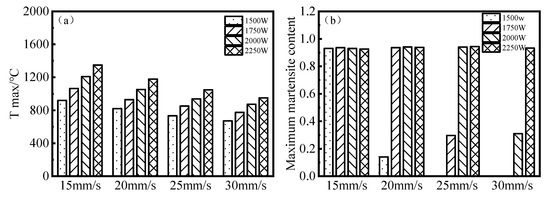
Figure 6.
(a) Highest temperature under each parameter; (b) Maximum martensite content for each parameter.
Based on the results in Figure 6, the experimental group with a scanning speed of 25 mm/s in Figure 7 was selected as an example, and the temperature variation curve of node 42,713 on the surface of model Figure 3 and the volume fraction variation curves of ferrite, martensite and austenite were collected to analyze the effect of different powers on the effect of phase hardening at the same scanning speed. According to the maximum temperature–time plot at node 42,713 and the maximum volume fraction of martensite after sufficient cooling, the peak temperature at this node increases with increasing laser power, the maintenance time of the high-temperature section increases, and the heating and cooling rates increase. The ferrite volume fraction plot and the austenite volume fraction plot at this point show that as the laser power increases, the ferrite transforms into austenite more. It is completely transformed after 2250 W power. In contrast, most of the austenite transforms to martensite over time under the effect of matrix self-cooling, as shown from the martensite volume fraction diagram, with a small proportion transforming to bainite. As the power increases, martensite transformation also increases and tends to a stable amount.
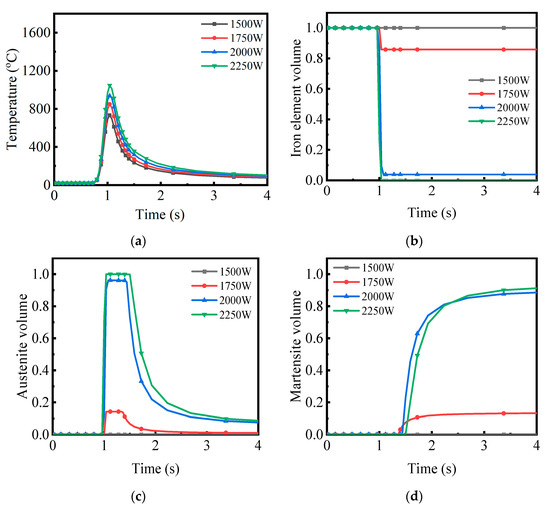
Figure 7.
(a) Temperature-time variation graph; (b) Iron element volume change curve; (c) Austenite volume change curve; (d) Martensite volume change curve.
Figure 8 shows the maximum temperature at each length of the scan line perpendicular to the scan direction at node 42,173 on the surface of Figure 3 at a laser scan speed of 25 mm/s. After the laser phase hardening treatment, the carbon content in the martensite is relatively high due to the laser phase hardening being a rapid hot and cold process. The carbon is not homogenized in the austenite in time, resulting in finer martensite and higher hardness. The alloying elements dissolved in the ferrite also distort the iron lattice, and the result of this solid solution strengthening also increases the strength and hardness of the tissue. The higher carbon content in martensite, martensite refinement and very high dislocation density is the reason that laser phase hardening can obtain greater hardness. As the raceway hardening layer of a rotary bearing is usually defined as the location where the hardness is greater than 52.5 HRC from the raceway surface to the inside of the raceway, the length of the transition layer is generally 0.1 times the hardening layer depth, therefore, the minimum depth value from the raceway surface to the substrate is 110% of the minimum value of the raceway hardening layer depth [20]. The martensite depth of the model after sufficient cooling is measured, and then the hardening layer depth of the workpiece can be obtained through calculation, as shown in Figure 9. When the laser scanning speed is certain, the higher the laser power, the greater the hardened layer depth, as shown in Figure 9. When the laser power is 2250 W and the scanning speed is 15 mm/s, the maximum temperature on the surface of the material is 1348 °C, which is close to the melting point temperature of the material at 1400 °C. Laser power is not as high as possible. When the maximum temperature of the material surface is below the melting point temperature of the material, a properly increased laser power can effectively increase the depth of the hardened layer. When the power density is too large, the surface of the material is melted, which affects the hardness and wear resistance of the material. Therefore, it is necessary to carefully select the appropriate process parameters.
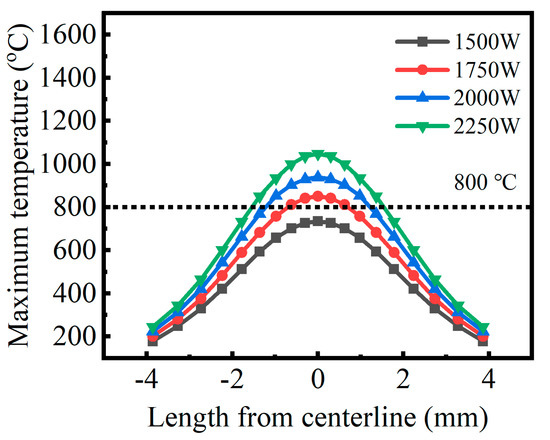
Figure 8.
Maximum temperature distribution.
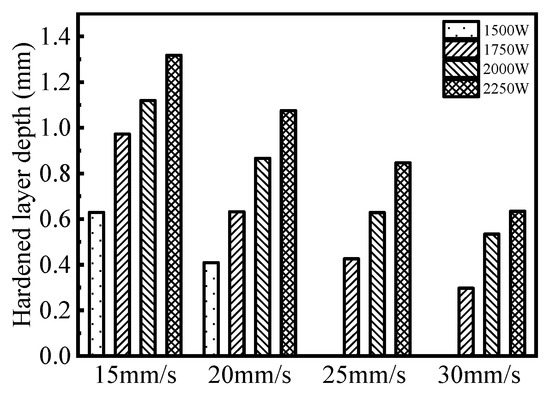
Figure 9.
Hardened layer depth.
3.2. Primary and Secondary Factors Analysis of Laser Phase Change Hardening Process Parameters on Shield Main Bearing Raceway Surfaces
According to the simulation results, the factors that play a role in the effect of laser phase change hardening are laser power and scanning speed. The influence of the interaction between the process parameters on the effect of phase change hardening is ignored in this paper, and a two-factor four-level test is used. Overall, 16 trials are required, and the orthogonal table can be shown as L16 (42). The specific experimental factors and their level numbers are shown in Table 3, and the orthogonal test results are shown in Table 4.
Table 3.
Two factors and four levels.
Table 4.
Results of orthogonal experiments.
After the model has been hardened by laser phase change, its indicators, including the depth of the hardened layer, the width of the hardened layer and the uniformity of the hardened layer, all change to some extent, affecting the performance of the material. As the hardened layer uniformity is difficult to measure directly, the standard deviation of the temperature above the 800 °C point is used on the specimen surface perpendicular to the advancing direction of the light spot as a way of evaluating hardened layer uniformity. Therefore, this experiment sets the hardened layer depth, the hardened layer width and the temperature standard deviation of each process parameter above 800 °C as the performance evaluation index, where the temperature standard deviation is one, and several groups of data not reaching above 800 °C are not considered.
3.2.1. Effect on the Width of the Hardened Layer on the Surface of the Shield Main Bearing Raceway
According to the orthogonal test in Table 4, the hardened layer width in the evaluation index was used for the analysis of polar differences. The sum K of the test indicators, mean value k, polar difference R of the four process parameters at different factor levels as well as the major and minor ranking of the significant degree of influence were obtained, and the results are shown in Table 5.
Table 5.
Data analysis sheet for hardened layer width.
Factors and levels are the horizontal coordinates, and the average value of the phase hardening layer width is the vertical coordinate. The influence of the law is shown in Figure 10. 42CrMo steel surface laser phase hardening process parameters on the surface hardening layer width of the specimen for the size of the impact in Table 5: laser power (A) than the scanning speed (B).
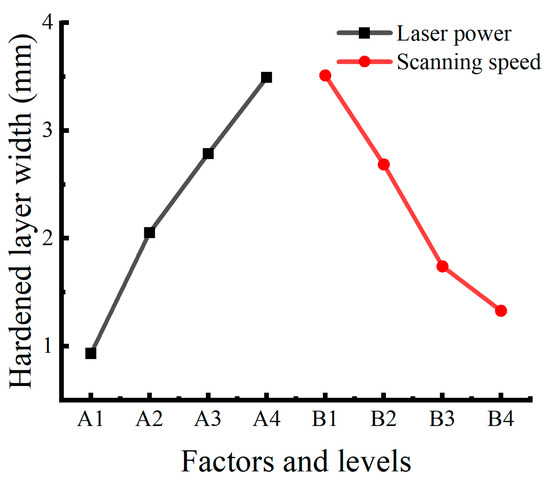
Figure 10.
Main effects plot of hardened layer width.
3.2.2. Effect on the Depth of the Hardened Layer on the Surface of the Shield Main Bearing Raceway
According to the results of the orthogonal test in Table 4, the hardened layer depth in the evaluation index was used for the polar difference analysis. The sum K of the test indicators, mean value k, polar difference R and the major and minor ranking of the significant degree of influence of the four process parameters at different factor levels were obtained, and the results are shown in Table 6.
Table 6.
Data analysis sheet for hardened layer depth.
From the analysis in Table 6 and Figure 11, 42CrMo steel surface laser phase hardening process parameters on the surface hardening layer depth of the specimen are affected more by the size of the laser power (A) than the scanning speed (B). The simulation software does not consider the problem of material melting; thus, the larger the laser power, the better and the smaller the scanning speed, without exceeding the material melting temperature. As the surface temperature of the specimen approaches the melting point, the depth of the hardened layer eventually tends to a stable range.
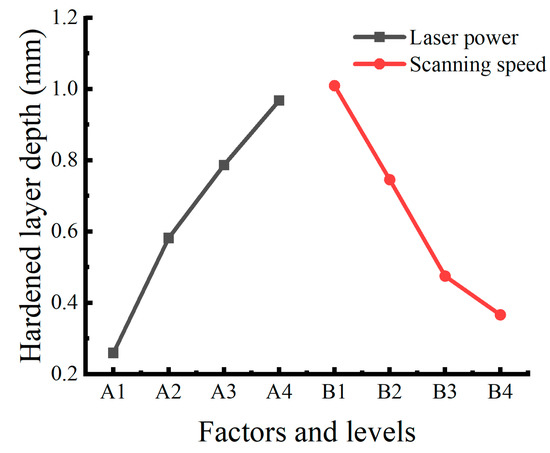
Figure 11.
Main effects plot of hardened layer depth.
3.2.3. Effect on the Uniformity of the Hardened Layer on the Surface of the Shield Main Bearing Raceway
According to the orthogonal test in Table 4, the homogeneity of the hardened layer in the evaluation index was subjected to a polar difference analysis. The sum K of the test indicators, mean value k, polar difference R of the four process parameters at different factor levels as well as the major and minor ranking of the significant degree of influence were obtained, the results of which are shown in Table 7.
Table 7.
Data Analysis Sheet for Hardened Layer Uniformity.
Factors and levels are the horizontal coordinates, perpendicular to the spot forward direction above 800 °C point of temperature standard deviation, which are the vertical coordinates. 42CrMo steel surface laser phase hardening process parameters on the surface hardening layer uniformity of the specimen are the size of the influence of the laser power (A) than the scanning speed (B) in Table 7. As the temperature standard deviation is used for the analysis of uniformity, the smaller these data are, the better the uniformity. The lower the laser power and the higher the scanning speed, the better the uniformity, as shown in Figure 12. While the uniformity is good, the depth and width of the hardened layer will decrease.
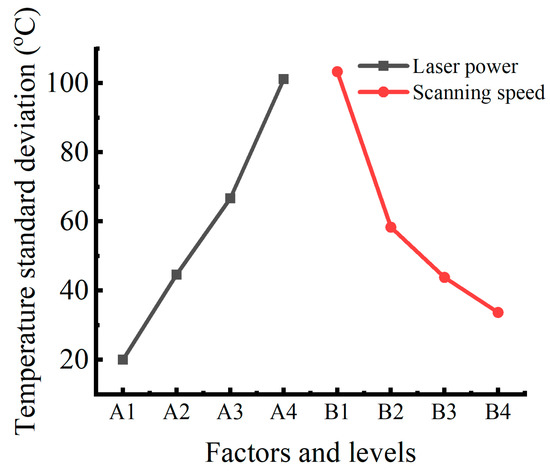
Figure 12.
Main effects plot of temperature standard deviation.
3.2.4. Multi-Indicator Evaluation of Laser Phase Change Hardening of Shield Main Bearing Raceway Surfaces
The influence of the two laser phase transformation hardening process parameters on the three surface performance evaluation indexes of the specimens studied in this paper has its own emphasis. Range analysis is more suitable for single-objective optimization. The comprehensive influence of every single factor should be considered for multi-objective optimization. Multiple evaluation indicators are transformed into a single objective for optimization analysis using the normalization method. This section uses the weight distribution method to analyze the degree of influence of each process parameter on the reinforcement effect of the specimen. Considering that the depth of the hardened layer and the uniformity of the hardened layer is more important to the reinforcement effect, the weights of the three performance evaluation indicators of the hardened layer width, hardened layer depth and hardened layer uniformity are set at 25, 35 and 40. The formula for calculating the comprehensive scoring value is as follows:
where is the weight of the hardened layer width indicator, is the weight of the hardened layer depth indicator, is the weight of the hardened layer uniformity indicator, is the test number and is the combined score value of the th test number.
When the fuzzy comprehensive evaluation method for multi-objective optimization is used, the affiliation function chooses the S-shaped function with better monotonicity. The obtained affiliation value is also higher, thus making the results of the comprehensive evaluation more reasonable. As the three performance evaluation indicators have different magnitudes, the S-shaped affiliation function can be used to map them to the [0, 1] interval to complete the dimensionless, and the S-shaped function is calculated as
where i is the performance evaluation index, i for surface residual compressive stress, surface roughness and surface microhardness are 1, 2 and 3, respectively, Xji is the result of the jth test number corresponding to the ith performance evaluation index and Yji is the mapping of the jth test number corresponding to the ith performance evaluation index.
The parameters in the S-shaped affiliation functions of the three performance evaluation indicators are analyzed, and the values of (a, c) in the hardened layer width, hardened layer depth and hardened layer uniformity functions were determined to be (1, 3), (4, 0.7) and (−0.02, 60). The comprehensive scoring results of laser phase change hardening of the specimen surface were calculated according to the formula, and the results are shown in Table 8.
Table 8.
Laser phase transformation hardening comprehensive scoring results.
The primary and secondary analyses revealed that the influence of laser power on the hardened layer is greater than the influence of scanning speed on the hardened layer for all three evaluation indicators. The best factor level with the highest overall score was A4B2 (laser power 2250 W and scanning speed 20 mm/s). This process parameter combination scheme is the optimal process combination scheme among the set parameter values. Figure 13a shows the surface temperature cloud of the workpiece. The temperature cloud of the cross-section at the highest temperature is shown in Figure 13b. Figure 13c shows a cross-section of the martensite volume fraction observed after sufficient cooling. The effect of the hardening layer can be roughly determined by measuring the area where the martensitic phase transformation occurs.
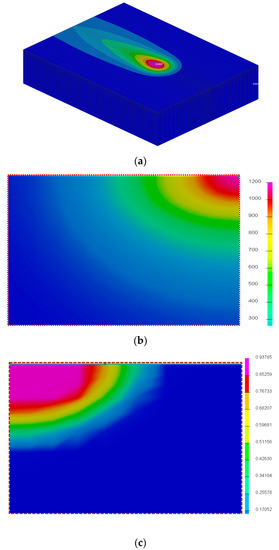
Figure 13.
(a) Workpiece surface temperature cloud map; (b) Cross-section temperature cloud map; (c) Cross-section Martensite cloud diagram.
4. Conclusions
As the scanning speed increases, the peak thermal cycle temperature of the surface layer of the phase transformation zone decreases and the maximum heating and cooling rate increases. The martensite content and range increase as the scanning speed decreases. The peak thermal cycle temperature of the surface layer of the phase transformation zone and the depth of the hardened layer increase with increased laser power. The effect of laser power on the hardened layer is higher than the effect of scanning speed on the hardened layer. The optimum hardening band effect was obtained with an input power of 2250 W, a scanning speed of 20 mm/s, a hardening band width of 3.84 mm and a hardening band depth of 1.08 mm, with a gentle hardening band depth and a good temperature distribution on the raceway surface. The lower the laser power and the higher the scanning speed, the better the uniformity. However, while the uniformity is good, the depth and width of the hardened layer will decrease.
Author Contributions
All authors have contributed to the development of the Wresearch and in the elaboration of this paper. Particularly, P.H., Y.D. and Y.W. contributed to the writing, the investigation and the simulation; H.Z., S.J. and T.S. carried out the experimental research and edited the manuscript. All authors have read and agreed to the published version of the manuscript.
Funding
The authors gratefully acknowledge the support provided by the National Natural Science Foundation of China (No. 52105259) and China Postdoctoral Science Foundation (No. 2022M721371).
Institutional Review Board Statement
Not applicable.
Informed Consent Statement
Not applicable.
Data Availability Statement
Not applicable.
Conflicts of Interest
The authors declare no conflict of interest.
References
- Wang, X.; Lu, X.; Chen, G.; Hu, S.; Su, Y. Research on the temperature field in laser hardening. Opt. Laser Technol. 2006, 38, 8–13. [Google Scholar] [CrossRef]
- Soukieh, M.; Ghani, B.A.; Hammadi, M. Numerical calculations of temperature distribution of double layer metallic surface treated by laser beams. Opt. Laser Technol. 2004, 36, 523–528. [Google Scholar] [CrossRef]
- Amado, J.; Tobar, M.; Ramil, A.; Yáñez, A. Application of the Laplace transform dual reciprocity boundary element method in the modelling of laser heat treatments. Eng. Anal. Bound. Elements 2005, 29, 126–135. [Google Scholar] [CrossRef]
- Kusuhara, T.; Morimoto, J.; Abe, N.; Tsukamoto, M. 3-D Finite element temperature field modelling for direct diode laser hardening of carbon steel. In Proceedings of the 2011 Fourth International Conference on Modeling, Simulation and Applied Optimization, Kuala Lumpur, Malaysia, 19–21 April 2011; pp. 1–4. [Google Scholar] [CrossRef]
- Orazi, L.; Liverani, E.; Ascari, A.; Fortunato, A.; Tomesani, L. Laser surface hardening of large cylindrical components utilizing ring spot geometry. CIRP Ann. 2014, 63, 233–236. [Google Scholar] [CrossRef]
- Karabutov, A.; Sogoyan, M. Interaction of IR laser radiation with periodic metal surfaces. Infrared Phys. Technol. 1995, 36, 191–216. [Google Scholar] [CrossRef]
- Komanduri, R.; Hou, Z. Thermal analysis of laser surface transformation hardening—Optimization of process parameters. Int. J. Mach. Tools Manuf. 2004, 44, 991–1008. [Google Scholar] [CrossRef]
- Rana, J.; Goswami, G.; Jha, S.; Mishra, P.; Prasad, B. Experimental studies on the microstructure and hardness of laser-treated steel specimens. Opt. Laser Technol. 2007, 39, 385–393. [Google Scholar] [CrossRef]
- Kim, J.-D.; Lee, M.-H.; Lee, S.-J.; Kang, W.-J. Laser transformation hardening on rod-shaped carbon steel by Gaussian beam. Trans. Nonferr. Met. Soc. China 2009, 19, 941–945. [Google Scholar] [CrossRef]
- Mioković, T.; Schulze, V.; Vöhringer, O.; Löhe, D. Influence of cyclic temperature changes on the microstructure of AISI 4140 after laser surface hardening. Acta Mater. 2007, 55, 589–599. [Google Scholar] [CrossRef]
- Liu, A.; Previtali, B. Laser surface treatment of grey cast iron by high power diode laser. Phys. Procedia 2010, 5, 439–448. [Google Scholar] [CrossRef]
- Devgun, M.S.; Molian, P.A. Experimental study of la-ser heat-treated bearing steel. J. Mater. Process. Technol. 1990, 23, 41–54. [Google Scholar] [CrossRef]
- Lusquiños, F.; Conde, J.; Bonss, S.; Riveiro, A.; Quintero, F.; Comesaña, R.; Pou, J. Theoretical and experimental analysis of high power diode laser (HPDL) hardening of AISI 1045 steel. Appl. Surf. Sci. 2007, 254, 948–954. [Google Scholar] [CrossRef]
- Yánez, A.; Álvarez, J.; López, A.; Nicolás, G.; Pérez, J.; Ramil, A.; Saavedra, E. Modelling of temperature evolution on metals during laser hardening process. Appl. Surf. Sci. 2002, 186, 611–616. [Google Scholar] [CrossRef]
- Zhang, Q.; Tong, W.; Chen, Z.; Yao, J.; Li, Z.; Feng, K.; Kovalenko, V.S. Influence of spot size on geometric characteristics of laser deep quenching hardened layer of 42CrMo steel. Surf. Technol. 2020, 49, 254–261. [Google Scholar]
- Carslaw, H.S.; Jaeger, J.C. Conduction of Heat in Solids; Oxford University Press: Oxford, UK, 1959. [Google Scholar]
- Landau, L.D.; Lifshitz, E.M. Statistical Physics; Butterworth-Heinemann: Oxford, UK, 1980. [Google Scholar]
- Tani, G.; Fortunato, A.; Ascari, A.; Campana, G. Laser surface hardening of martensitic stainless steel hollow parts. CIRP Ann. 2010, 59, 207–210. [Google Scholar] [CrossRef]
- Zhao, J. High Energy Rate Heat Treatment; Ordnance Industry Press: Beijing, China, 1997. [Google Scholar]
- He, P.; Liu, R.; Hong, R.; Wang, H.; Yang, G.; Lu, C. Hardened raceway calculation analysis of a three-row roller slewing bearing. Int. J. Mech. Sci. 2018, 137, 133–144. [Google Scholar] [CrossRef]
Disclaimer/Publisher’s Note: The statements, opinions and data contained in all publications are solely those of the individual author(s) and contributor(s) and not of MDPI and/or the editor(s). MDPI and/or the editor(s) disclaim responsibility for any injury to people or property resulting from any ideas, methods, instructions or products referred to in the content. |
© 2023 by the authors. Licensee MDPI, Basel, Switzerland. This article is an open access article distributed under the terms and conditions of the Creative Commons Attribution (CC BY) license (https://creativecommons.org/licenses/by/4.0/).