1. Introduction
Plasmonics is the area of photonics based on the coupling of electromagnetic waves with free electrons and polaritons in metals or semiconductors. There are two main types of plasmon excitation in metals, which yield surface plasmons (SPs) and localized surface plasmons (LSPs). The known SPs are electron waves propagating along a metal-dielectric interface, whereas LSPs are localized electron oscillations in metal nanoparticles [
1]. Because of the remarkable ability to confine light on a metal surface within a subwavelength region, SPs and LSPs have various applications, such as ultra-high-resolution imaging [
2], nanoplasmonic waveguides [
3], improved light collection in solar cells [
4], and luminescence amplification [
5]. These properties and phenomena are associated with the dielectric permittivity of metals. Negative dielectric permittivity leads to the emergence of an evanescent wave on the metal-dielectric interface, penetrating both the metal medium and the dielectric one. However, highly localized and confined SPs exist only in the visible and infrared ranges. In the low-frequency range, metals behave like almost perfect electric conductors and as consequence, only a small part of the electric field penetrates the metal. It leads to weak confinement of plasmons by the surface of the metal and rapid destruction of this state [
6].
Metamaterials are artificial materials typically consisting of the periodically placed subwavelength unit cell (‘meta-atoms’). These unit cells are built from dielectric or metallic materials, but their exact shape and geometry can drastically affect the interaction of light with them. The use of metamaterials significantly expanded the potential capabilities of current photonic materials and devices in controlling electromagnetic waves. Based on the metamaterial approach, scientists realized exciting concepts such as negative refraction [
7] and cloaking [
8,
9]. In addition to these well-known concepts, in 2004, Pendry et al. suggested a new metamaterial approach, which enabled the demonstration of the excitation of surface waves on a metal surface structured by tiny holes [
10]. Comparing the dispersion curves and mode profiles, they found that electromagnetic waves propagating along such surfaces in the spectrum from microwave to far-infrared are close analogs of the familiar SPs at optical frequencies. As a consequence, these waves were called ‘spoof’ surface plasmons [
11]. Another way to generate SSPs is using a 1D periodic grating with a period less than half of the wavelength of the incident wave. In this case, such a structure can be considered as a metamaterial or an effective medium with a dielectric permittivity of the Drude type, depending on the parameters of the grating [
12]. Subwavelength gratings supporting spoof plasmons are valuable for sensing applications. For instance, Ng Binghao et al. were the first who experimentally demonstrated the measurement of the refractive index of nitrogen and various liquids with such gratings, using time-domain spectroscopy in 2013 [
13]. Yi Huang et al. realized ultraprecision THz SSPR sensors with direct phase readout capacity [
14]. The last article in which Yao H. et al. raised the question of spectral analysis of molecules with subwavelength grating-based sensors was published in 2022 [
15].
However, the bulkiness and low efficiency of SSP devices limited their opportunities until Shen et al. [
16] developed and investigated ultrathin periodic metal strips similar to compressed 1D gratings with near-zero thickness. Conformal surface plasmons propagating on them have opened the route to new flexible miniature tools [
11]. Further investigations showed that a spoof plasmon polariton concept also enabled the imitation of features of localized surface plasmon polaritons in the low-frequency range. A subwavelength grating compressed and rolled into a closed surface can be described as a 2D topologically closed flat metamaterial (or metasurface), which supports spoof localized SPs. The first metamaterial of this type was demonstrated by Pors in 2012 [
17]. This work was followed by a large number of studies devoted to periodically textured cylinders and the improvement of their resonance and excitation performances [
11,
18,
19]. In particular, it was shown that aside from fundamental modes imitating the familiar localized plasmons, a C-shaped resonator placed in the vicinity of a textured cylinder can excite dark modes. These dark modes had higher quality factors [
20]. Lately, only two works related to sensing were published, which demonstrated that an LSSP metamaterial can be used as a microfluidic sensor in the microwave and terahertz frequency ranges [
21,
22].
Although spoof localized resonance modes have been observed on periodically textured cylinders, they are not subwavelength in the lateral directions because their lowest resonance frequency of them is limited by their size. This can be overcome via either integration of the high-index materials of the substrate with such metamaterials, which is too difficult, or the usage of spiral grooves. The longer the spiral, the longer the SPR resonance wavelength, and as a consequence, it exceeds the size of the structure, which leads to stronger electromagnetic field localization near the surface. The first work devoted to spiral metallic metamaterials was published in 2014. Huidobro with his colleagues supposed and demonstrated experimentally that magnetic SLSPRs can be excited on such metastructures [
23]. A year later, a group of scientists combined a spiral metamaterial with a corrugated metallic strip, which enabled the coupling of spoof SPs to spoof LSPs at microwave frequencies [
24]. In 2016, Gao Z. et al. investigated stereo metamaterials based on a stack of metallic spiral structures and found strong magnetic coupling effects [
25]. Then Gao Z. with other colleagues showed that a complementary metallic spiral structure supports higher-order spoof-LSPs [
26]. In the same year, two articles were written by Liao Z. et al. [
27,
28]. In the first one, the authors described an analytical model of localized spoof plasmons in spiral geometries within the framework of the effective medium theory, whereas, in the second work, the researchers showed that ultrathin metallic spirals support both electric and magnetic localized spoof plasmons in the terahertz frequency range. In addition, the electromagnetically induced transparency effect was demonstrated. Zhang J. et al. studied the interaction of two closely spaced spiral meta-atoms and the excitation of hybrid plasmon modes enhancing electric fields in 2017 [
29]. After that, Huang Y. et al. replaced symmetrical spiral metamaterials with nonconcentric structures and considered their influence on mode hybridization and field enhancement within nanogaps [
30]. In 2018, Hai Su et al. suggested another application of these metamaterials [
31]. They excited deep-subwavelength near-field electromagnetic spoof plasmons with an orbital angular momentum. In the ensuing year, scientists generated enhanced magnetic localized spoof plasmons using two vertical conductively-connected metallic spiral structures [
32]. Another group of researchers studied different configurations of spiral metamaterials for the sensing application of thin films in the terahertz frequency range [
33].
To sum up, it was shown that THz spoof LSPs have several advantages over the familiar LSPs in the visible range for creating high-performance sensors. SLSPRs depend on the geometry of the meta-particle, which provides flexibility in designing the electromagnetic properties of structures. Spoof LSP metasurfaces can provide high field confinement, and large field enhancement in the vicinity of the surface. Moreover, the ohmic losses, which limit the sensitivity of sensors in the visible range, can be neglected at low frequencies. As a result, the Q-factor of resonances and their figure of merits achievable in the THz frequency range are comparable or higher than that in the optical range, and it is possible to realize sensors for solving the problems of investigations of thin layers [
34], as well as spectroscopy of tiny biological objects at the terahertz frequencies [
35]. Refractive index sensing or spectroscopy in the THz region is of great interest for biological and medical applications because many absorption spectral lines of complex molecules lie in the THz range.
In this paper, we examine, both numerically and experimentally, the sensing capabilities of various resonant modes supported by metamaterials comprising Archimedean spirals with C-shaped resonators in the THz range. For our study, we have used a loss-less analyte of different thicknesses, coating the metamaterial. We compared the sensitivity, Q factor, and figure of merit (FOM) obtained from the amplitude and phase transmission spectra. The paper is organized as follows. First, we discuss physical phenomena that lie in the excitation of modes on such metamaterial and the reasons for choosing metamaterial parameters. Second, we introduce numerical and experimental schemes for obtaining transmission spectra. Next, the features of the fabrication of metamaterials by means of the conventional lithographic process are described. Finally, we compare and analyze the sensor characteristics of the proposed metamaterial. The results are summarized in the concluding section. Our research made it possible to improve the resonance performance of the high-sensitivity THz sensor, allowing measuring the refractive index and thickness of different substances.
2. Design of Spiral Metasurface
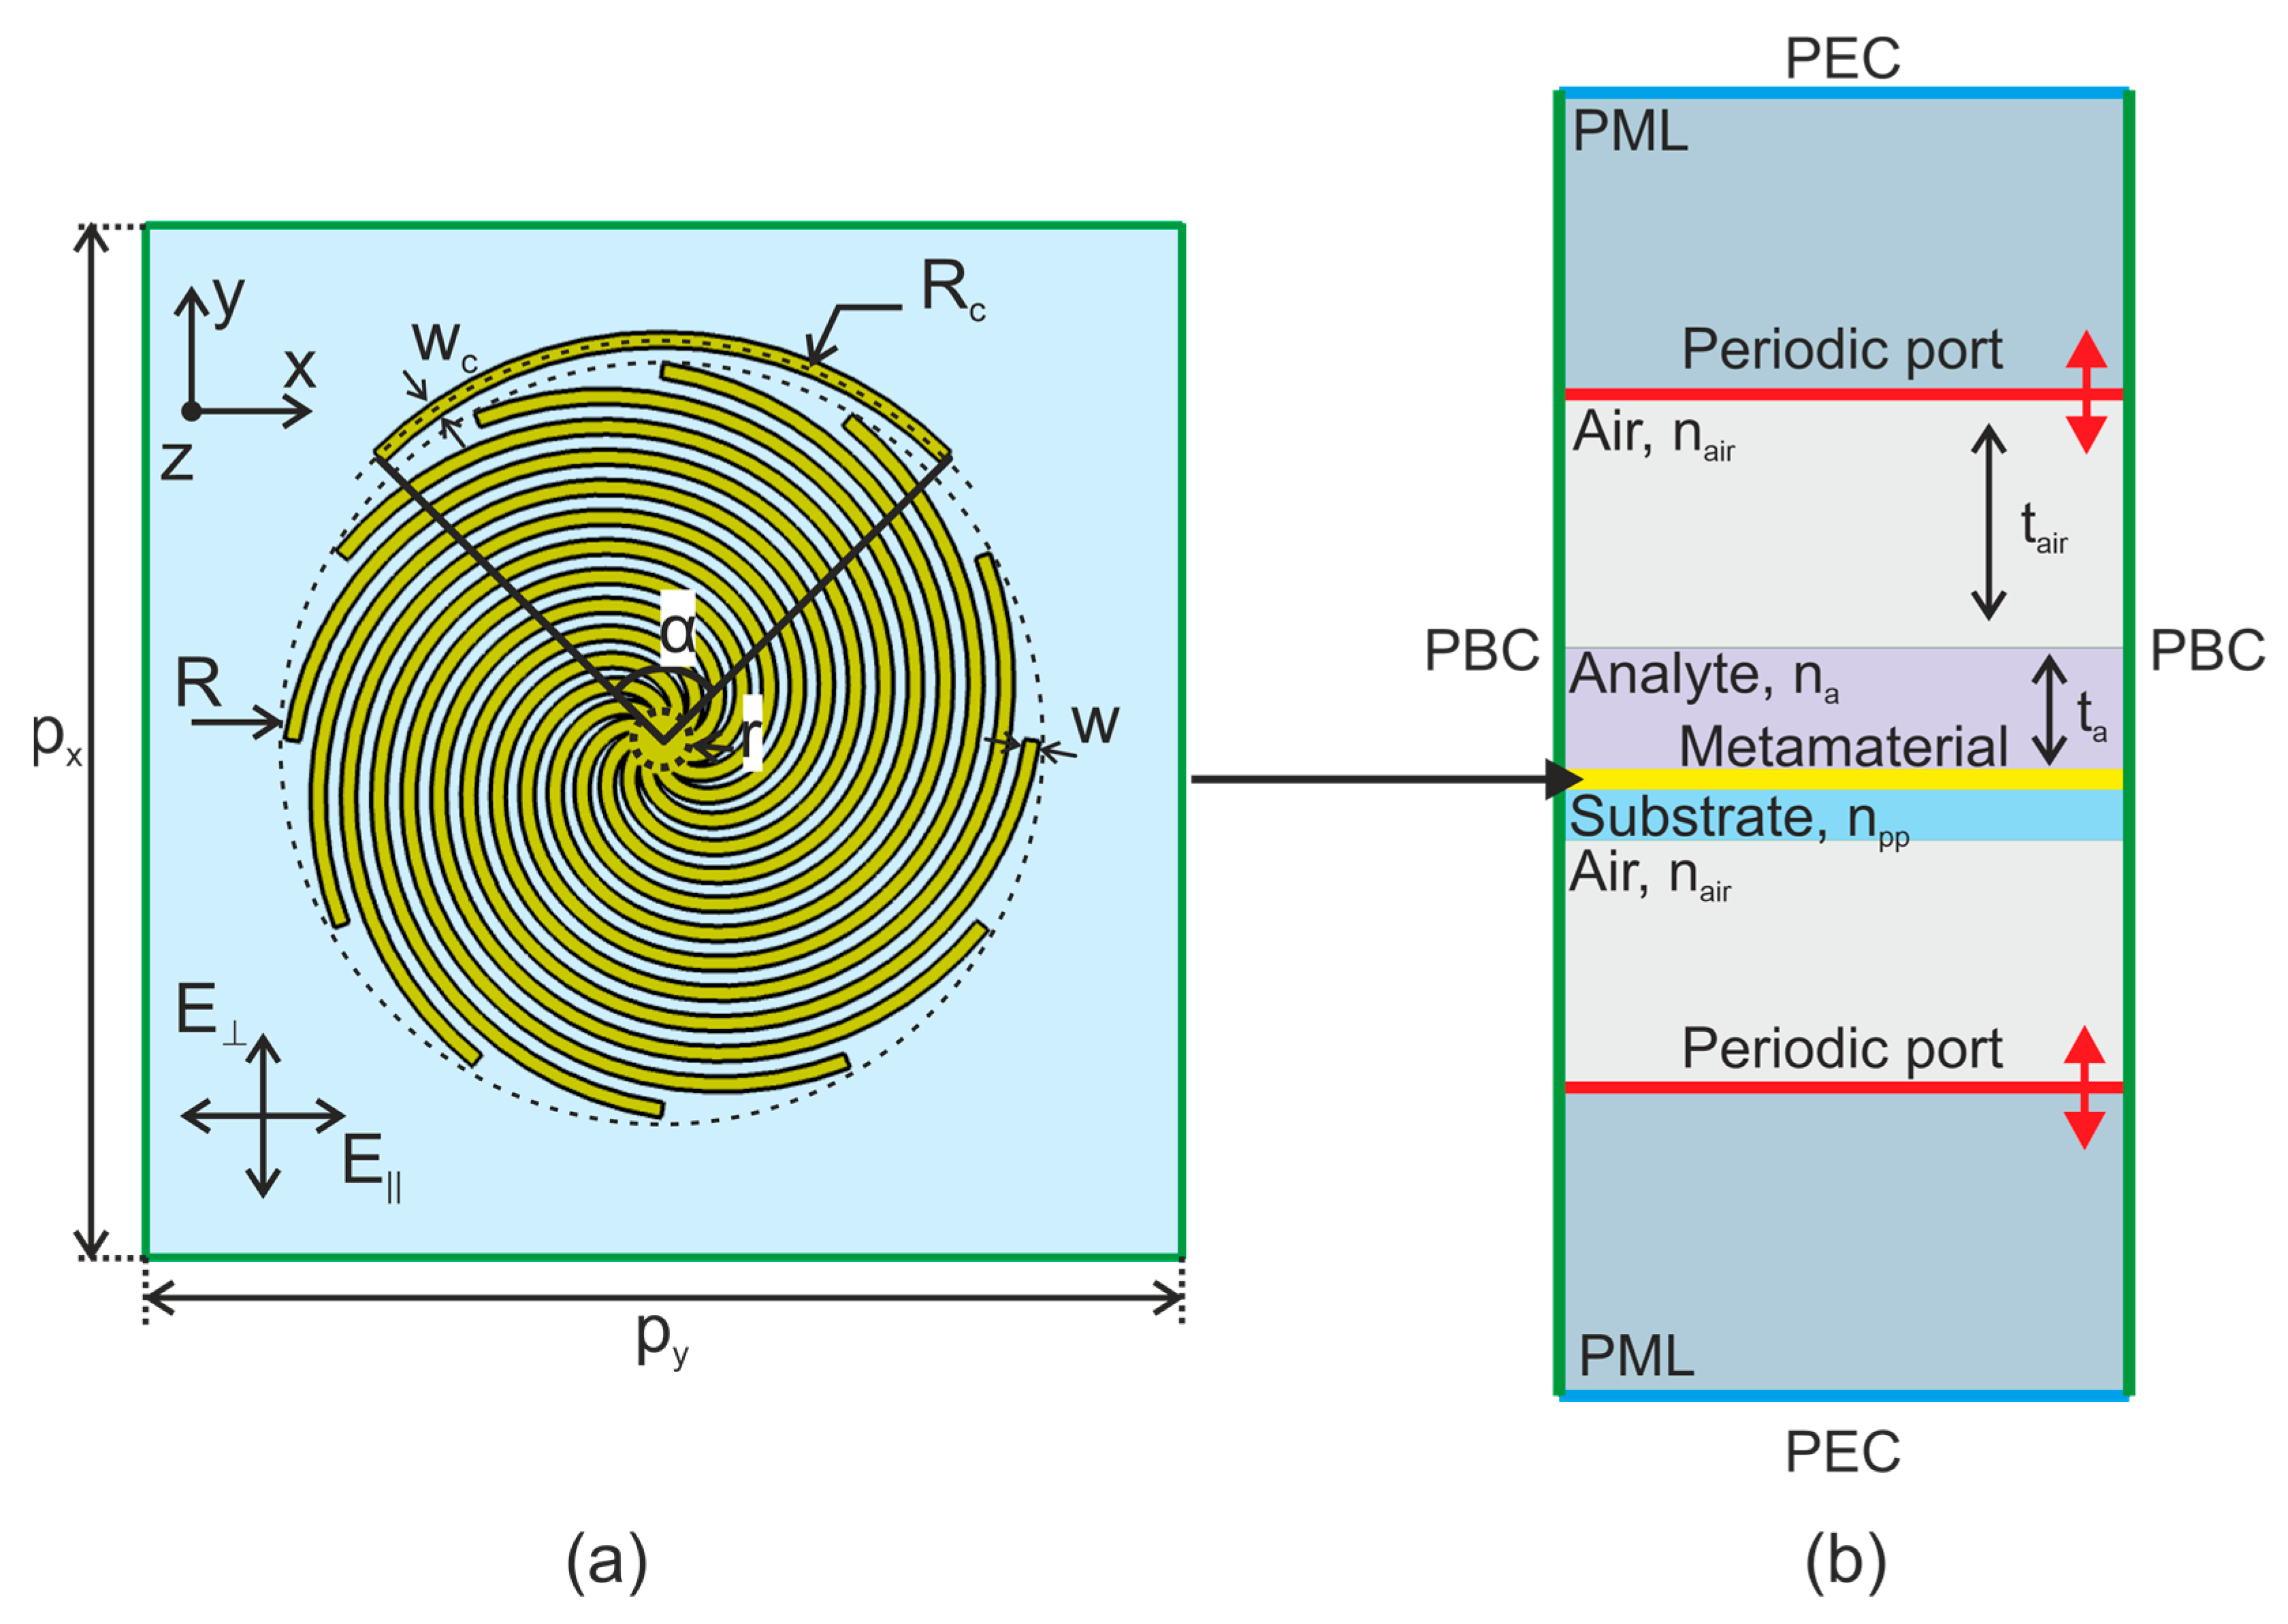
A design of an Archimedean-spiral metamaterial with a C-shaped resonator is demonstrated in
Figure 1a. The spiral structure can be described with the following parametric equations [
36]:
where
is the radius of the spiral,
is the distance of the starting point from the origin (it was
in our case),
is the number of arms, and
is the angle of the spiral in the range from
to
.
Spoof localized plasmons excited on such structures are standing waves on a loop. With an increase in the length of the loop, the resonance shifts to a lower frequency, which makes the structure deeply subwavelength with high confinement of the LSPR modes near the surface. On the other hand, since the Archimedean spiral structure is a compressed and rolled subwavelength grating, the asymptotic frequency corresponding to the maximum operating frequency can be estimated as [
18]
where
is the length of the arm and
is the refractive index of the substrate, and
c is the speed of light. We used thin polypropylene (PP) with dielectric permittivity
[
37,
38] as a substrate, which allowed us to minimize the dielectric losses and diminish the interference effects in the PP layer. The number of arms and their width
are limited by the radius of the structure and fabrication process.
influences the number of high-order modes that can be excited, nonlocal effects, and stability against the angle of incidence [
27,
29]. In our case, these parameters were
and
µm. Based on previous investigations [
33], we have chosen the structure radius
µm. Thus, using Equation (2), we can calculate the asymptotic frequency
THz, and this frequency lies on the upper side of the operating frequency range of our terahertz source.
Another parameter of the metamaterial is the lateral periodicity of spiral structures in the x- and y- directions (
and
, correspondingly). It affects the interaction of fields from adjacent structures (hybridization effect) and the emergence of diffraction modes. The position of diffraction modes can be calculated with [
39]
where
is the diffraction order,
is the refractive index of the surrounding media, and
is the incident angle. The period of the structure
µm was chosen so that the diffraction dip was far from other metamaterial resonances and the hybridization effect was negligible.
The spiral metamaterial supports a low
Q factor fundamental dipole ‘bright’ mode and high
Q factor ‘dark’ modes. To excite a fundamental mode, it is sufficient to illuminate the structure with a plane wave under normal incidence, while dark modes can be excited by means of grazing incidence, C-shaped dipole resonator, spoof LSP resonator, or near-field coupling [
20]. In this work, we used a C-shaped dipole resonator to produce the dark modes with far-field excitations at normal incidence. The principle is that, after excitation of the auxiliary resonator by a plane wave, dark modes are excited by the evanescent coupling. Since dark modes are more sensitive and have a higher figure of merit than the fundamental mode, they are more promising for sensor applications. The C-shaped resonator was placed as close as possible to the spiral structure to increase the efficiency of the excitation, and the distance to the central part of the resonator
µm and its width
µm were limited by the fabrication process. According to [
33], the resonator arc angle
was chosen to be 90°.
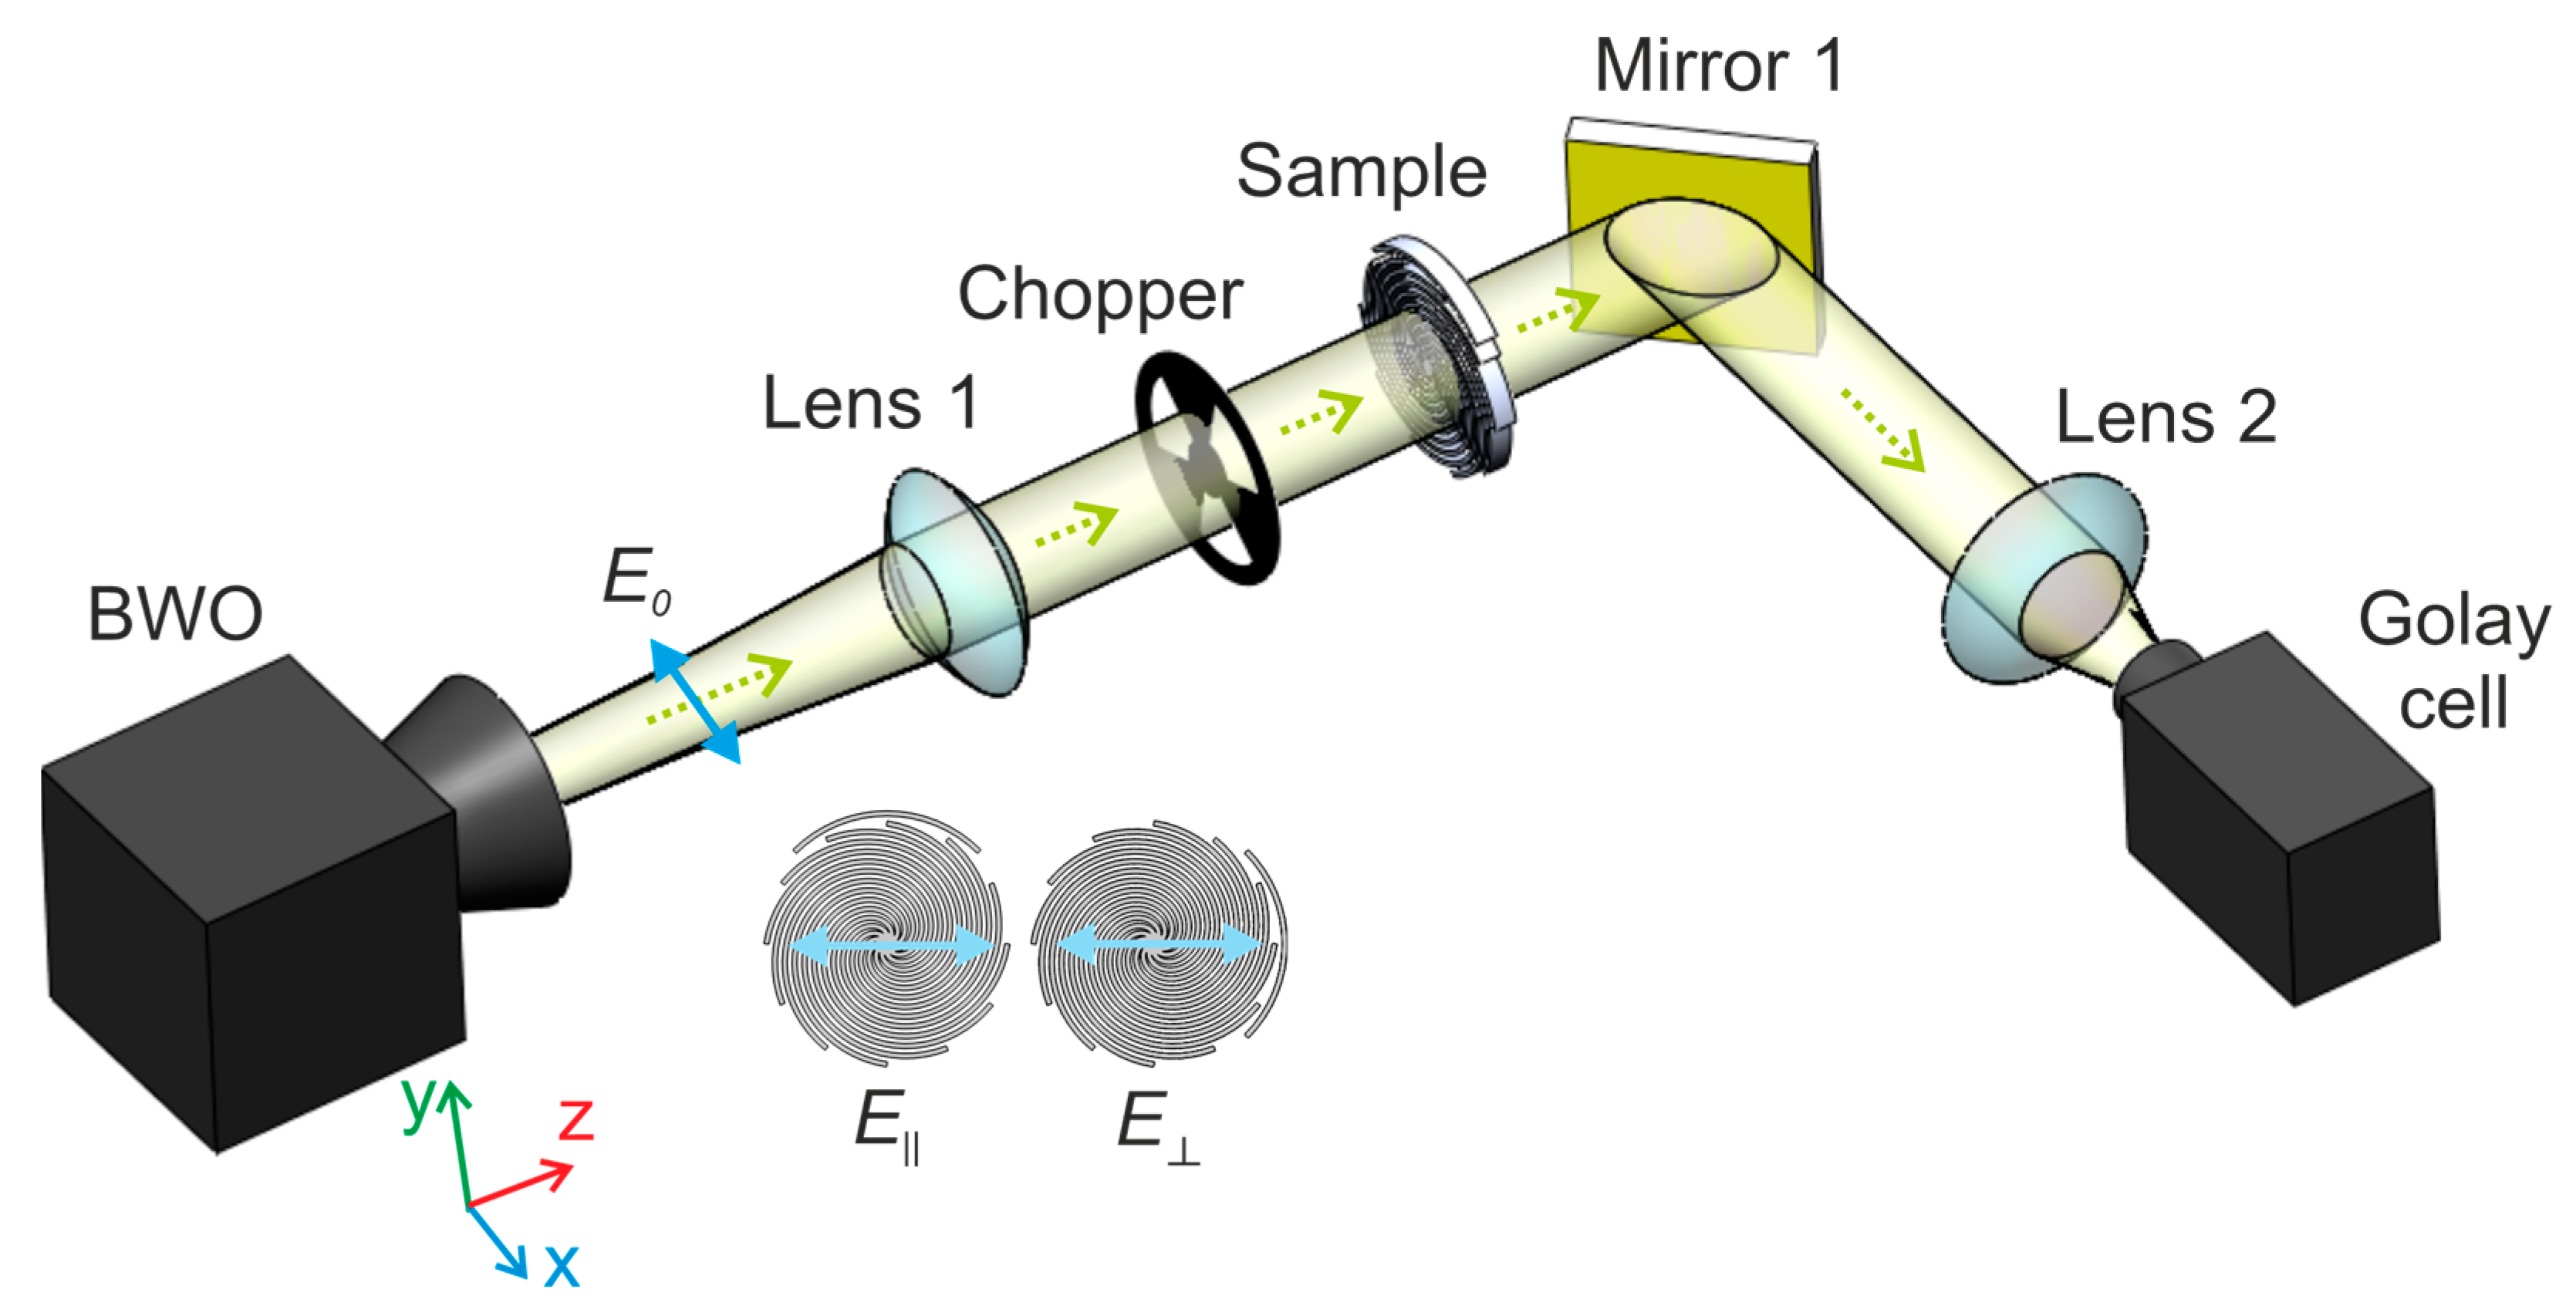
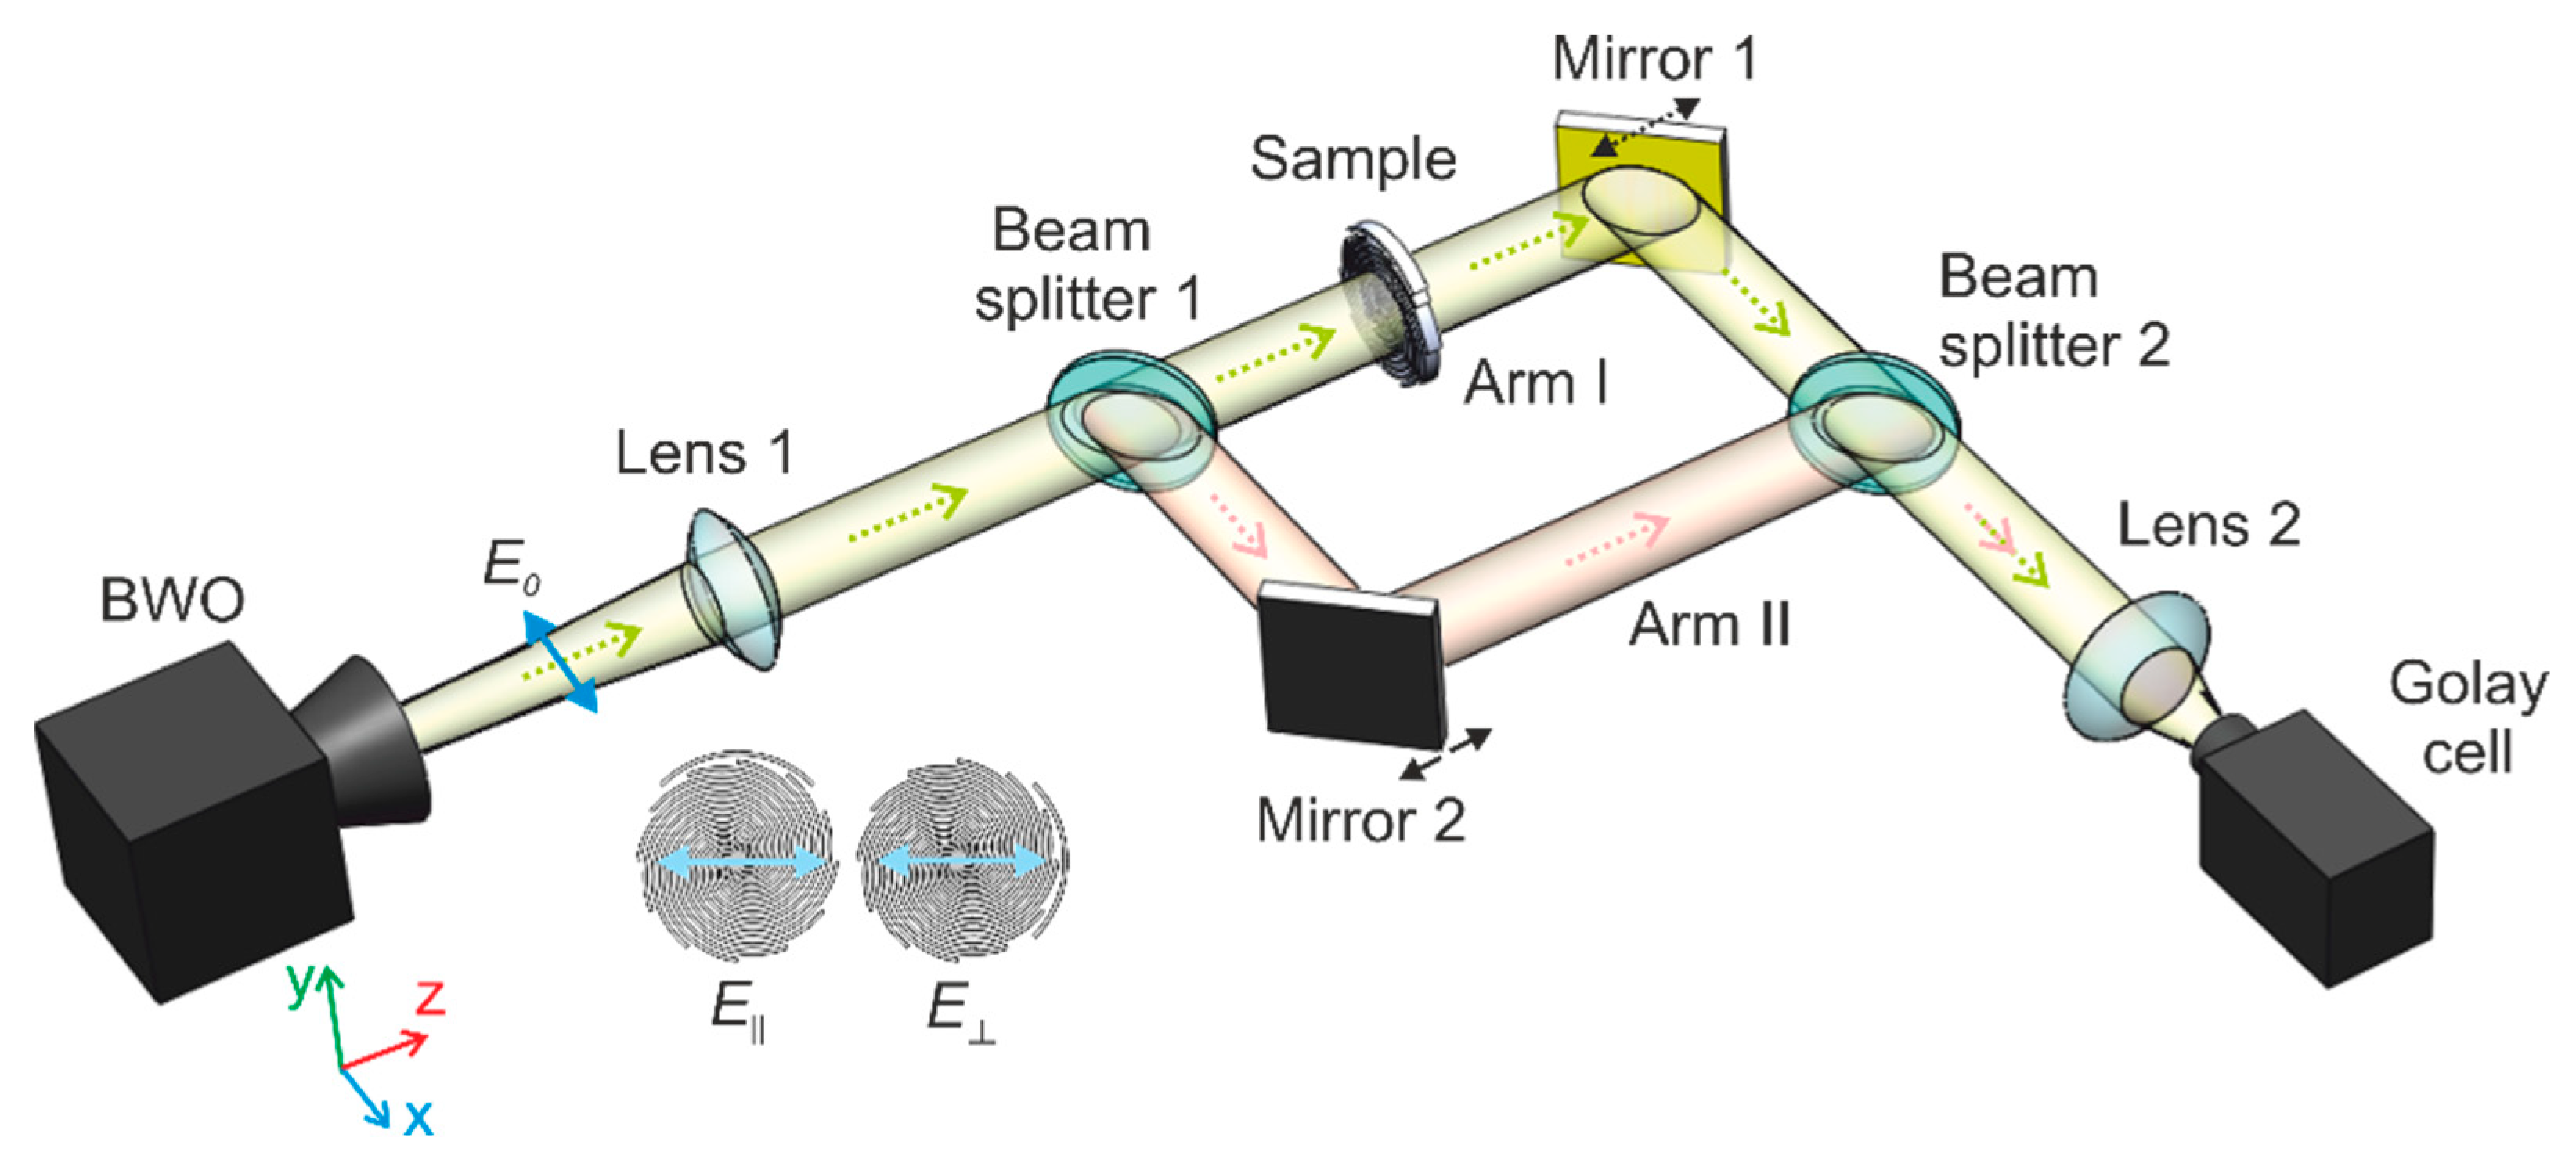
3. Numerical Scheme
To predict the resonance characteristics of spiral sensors we used the COMSOL Multiphysics software, which enabled the calculation of the metasurfaces by the finite element method. The 2D metamaterial was simulated in the 3D space. An elementary Floquet cell consisted of a metal Archimedean spiral with a C-shaped resonator. It was limited by periodic boundary conditions on its four sides for the calculation of an infinite 2D array as shown in
Figure 1b. The Al metal layer was modeled as a transition boundary condition with the electrical conductivity
S/m [
37,
38] and thickness
μm. A thin layer of analyte was calculated as a conventional domain, but a structured mesh was used for modeling it.
Perfectly matched layers (PMLs) were applied to the lowest and highest parts of the Floquet cell, and two periodic ports were placed between the air regions and PMLs. The excitation port injected either an electric field parallel to the C-resonator or an electric field perpendicular to it. Both the excitation and listener ports were set to pass the highest modes and diffraction modes of the metamaterial that were absorbed by the PMLs after passing. This allowed us to track the energy change in the initially excited waves and avoid setting many extra diffraction ports, which would increase the calculation time. In addition, these ports were far away enough, and we were able to exclude the capture of excited resonance modes. The Floquet cell was closed with perfect electric boundary conditions (PECs). Since the radiation absorbed by the PMLs passed through the ports, these boundary conditions had almost no effect.
For obtaining the transmitted spectra, we calculated the squared amplitude of the S-parameter
. Meanwhile, to retrieve the phase change
induced by the metamaterial, we excluded from the argument of the parameter
the phase shift induced by the air medium with thickness
and the substrate with thickness
μm:
6. Results and Discussion
6.1. Comparison of the Simulation and Experimental Results
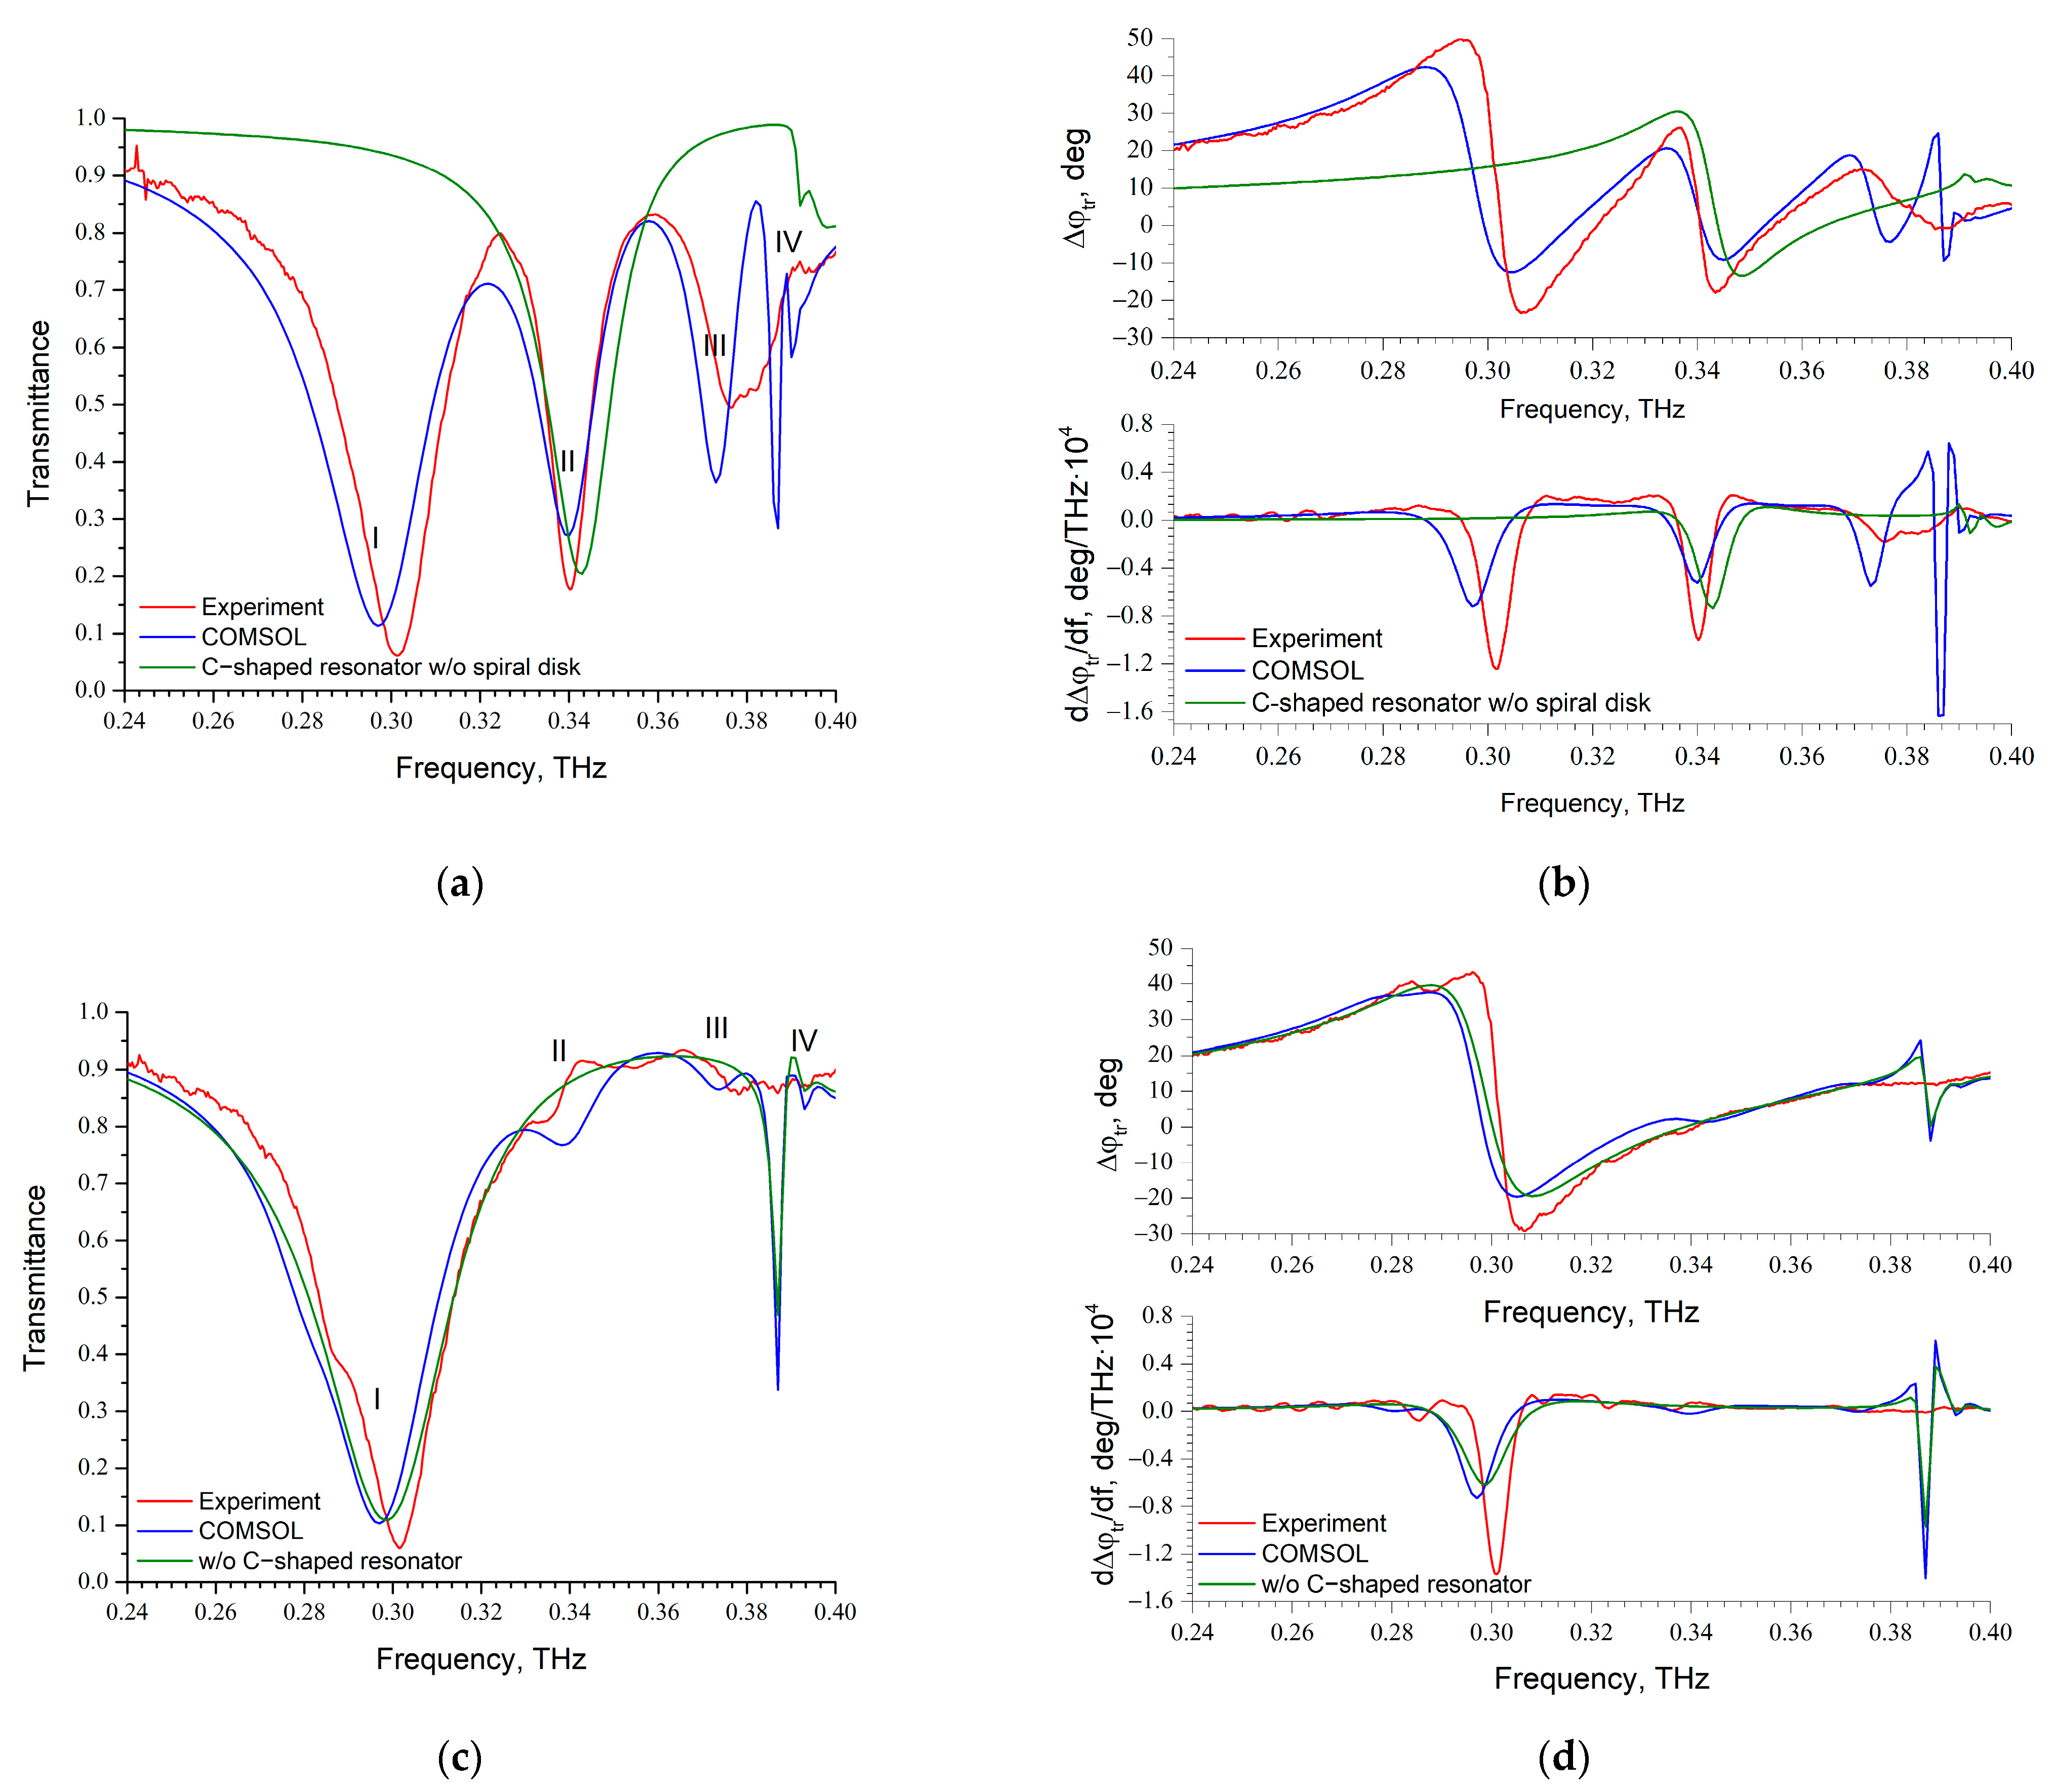
We first compared the amplitude, phase, and absolute gradient of the phase change spectra of the spiral metamaterial without analyte for the two polarization states obtained from the experiments and COMSOL simulations, as shown in
Figure 5. The phase change was found via Equation (6), whereas the absolute gradient of the phase change was determined as
. We excited four modes with a
-polarized wave due to the C-resonator (
Figure 5a). The first mode (I) emerged at 0.297 THz and 0.302 THz in the experiments and the simulations, correspondingly. Since the same resonance was observed with a
-polarized beam and was excited on the structure without a C-shaped resonator (
Figure 5c), we can conclude that those were the fundamental modes. For the explanation of the following dip occurring at 0.34 THz (II), we calculated the phase and transmission spectra of a C-shaped resonator without a spiral disk, as can be seen in
Figure 5a. The resonance position of this structure was close (0.343 THz) to the second dip. Thus, the resonance (II) comes from the LSP mode supported by the single C-shaped resonator, and it is a hybrid mode. The third dip emerged at 0.373 THz (III) and corresponded to the dark dipole mode. The narrowest resonances (IV) at 0.388 THz were the diffraction modes for both polarizations.
The main difference between the experiments and simulations is the absence of the well-defined diffraction mode and dark dipole mode at 0.373 THz in the experiment with the metamaterial without any coating. The primary reason is that in this measurement, these two dips merged with each other because of the diffraction mode broadening in the experiment due to the finite size and diffractive divergence of the incident beam. It should be noted that they became distinguishable (see
Section 6.3) in the experimental spectra measured for the different analyte thicknesses due to different mode sensitivities. For this reason, the further analysis does not include experimental points of the diffraction mode obtained from the experiment.
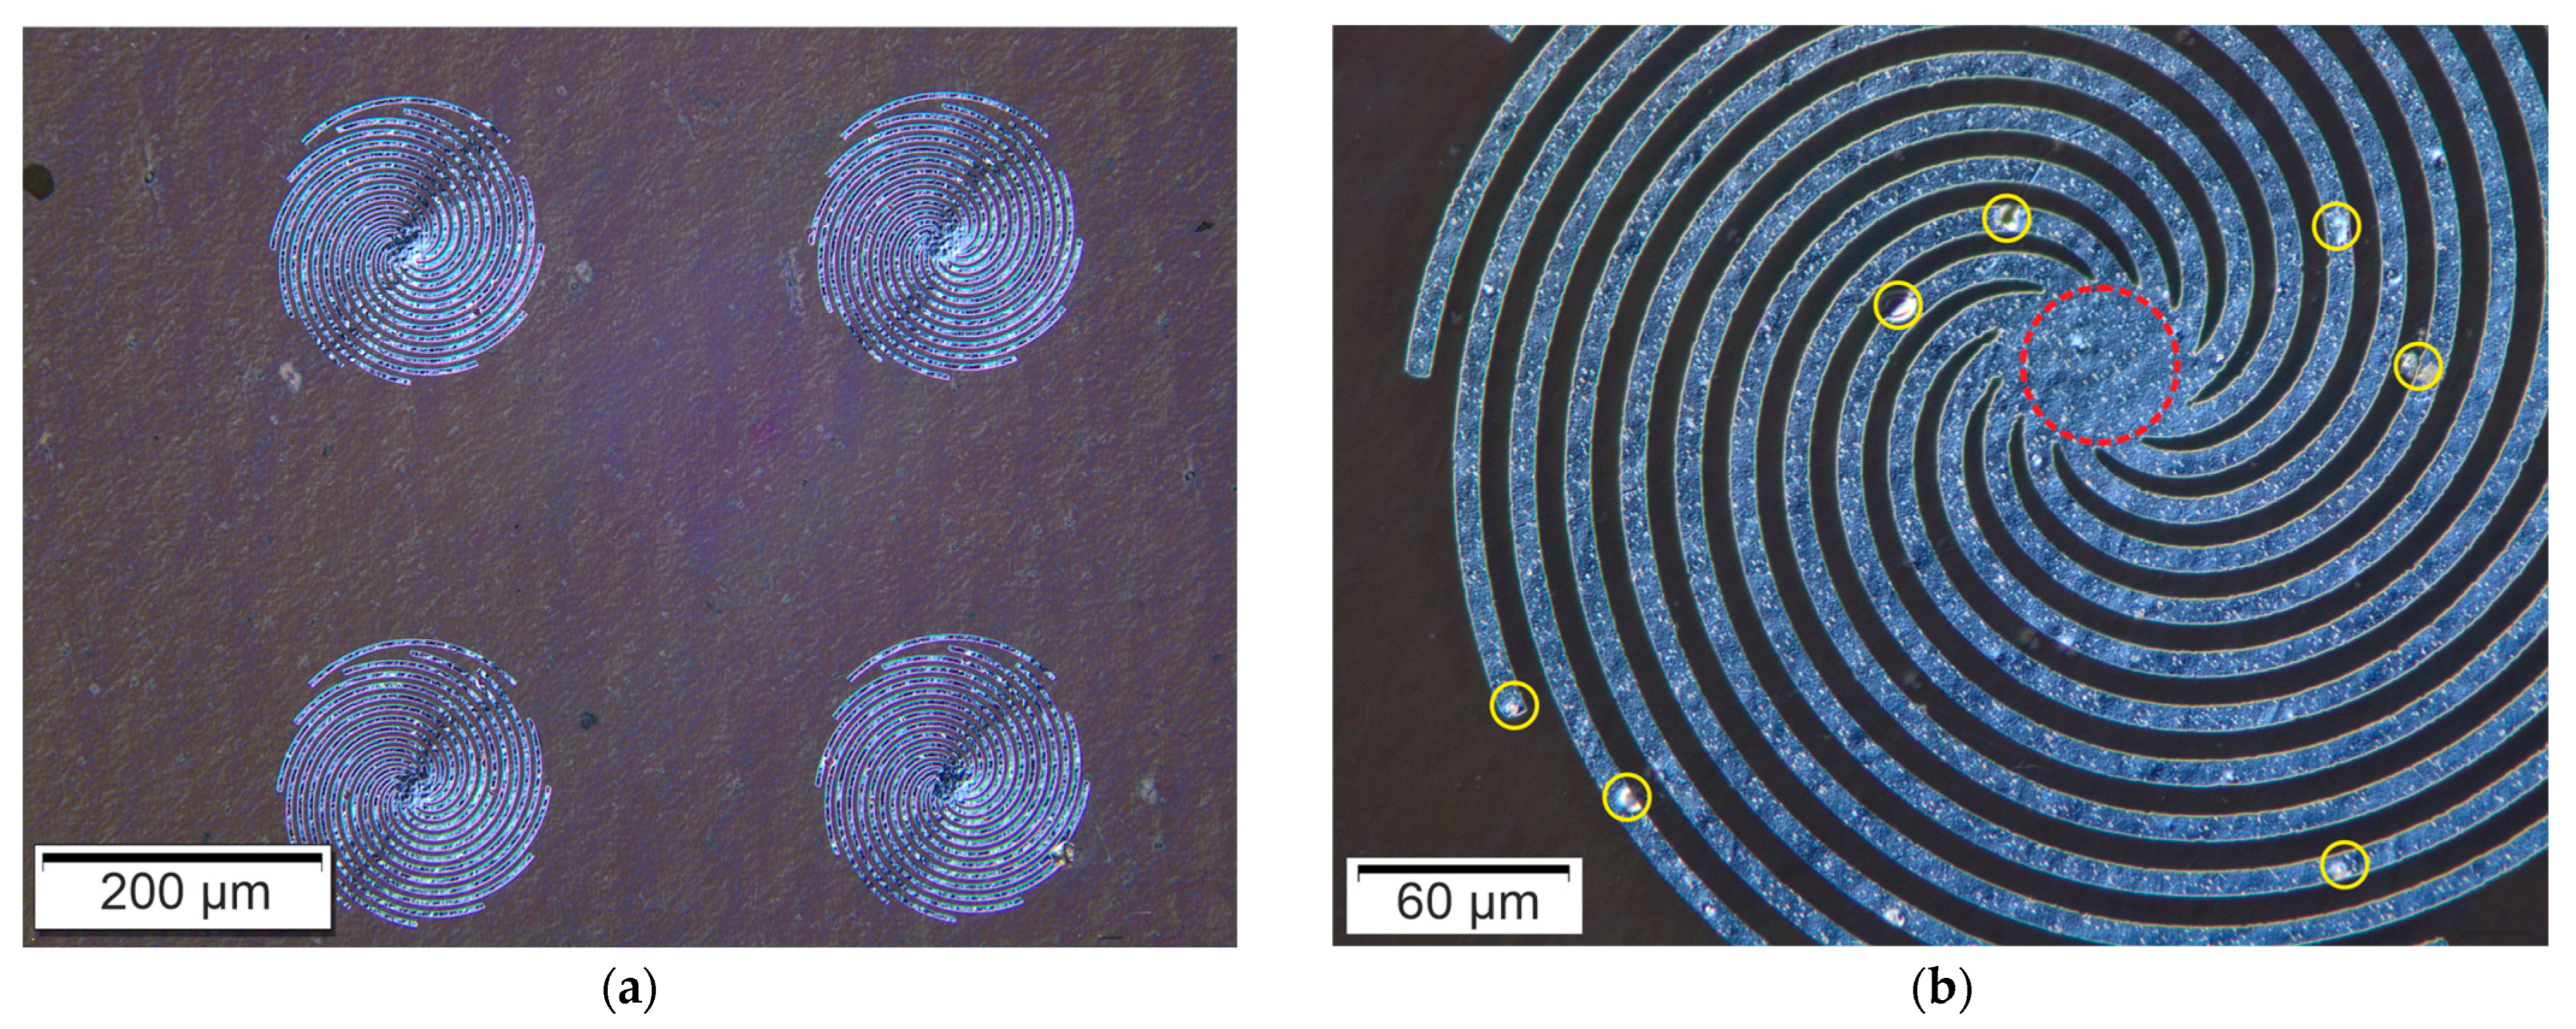
Another distinction corresponds to the absolute amplitude dips. The experimental resonance dips were deeper than the simulated ones, which are associated with the increase in the absorption losses caused by the structural imperfections in the fabricated metasurfaces and diffraction effects. Moreover, there was a deviation between the resonance frequencies of the fundamental dipole mode in the experiment and the simulation. The simulated dipole mode was excited at 0.297 THz, while the experimental one emerged at 0.302 THz. The resonance frequency of the spiral structure strongly depends on its parameters (for instance, see Equation (2)). This discrepancy is due to parameter fluctuations caused by manufacturing inaccuracies (see
Section 4).
Finally, because the dips of the fundamental and diffraction modes are identical for both polarization states, we only analyzed the spectra corresponding to . Moreover, the phase spectra do not enable improvements in the sensor performance, and for this reason, we studied only the gradient of the phase change spectra.
6.2. Simulation Results: Resonant Mechanism of Metamaterial
The vertical electric fields of the metamaterial were collected at the resonant dip frequencies for illustration of the resonant physical mechanism in resonant modes excited by
. The distributions of the electric field
are shown in
Figure 6. The low-frequency resonance mode (
Figure 6a) at
THz corresponds to the fundamental mode that can be excited without any C-resonator. The minimum and maximum of the electric field concentrate on the different sides of the spiral structure, forming the electric dipole resonance. Adding C-resonator enables the excitation of additional modes.
Figure 6b,c depict the electric fields of the metamaterial structure at two resonant frequencies (
THz and
THz), which maxima vary along the radial direction. Thus, we can conclude that these two resonances are magnetic dipole resonances. Besides, the resonance
f2 is very close to the fundamental mode of the C-resonator, which correspond to hybridized nature of
f2. The position of the fourth resonance is determined via Equation (3), which is the diffraction resonance mode at
THz.
6.3. Sensing Performance
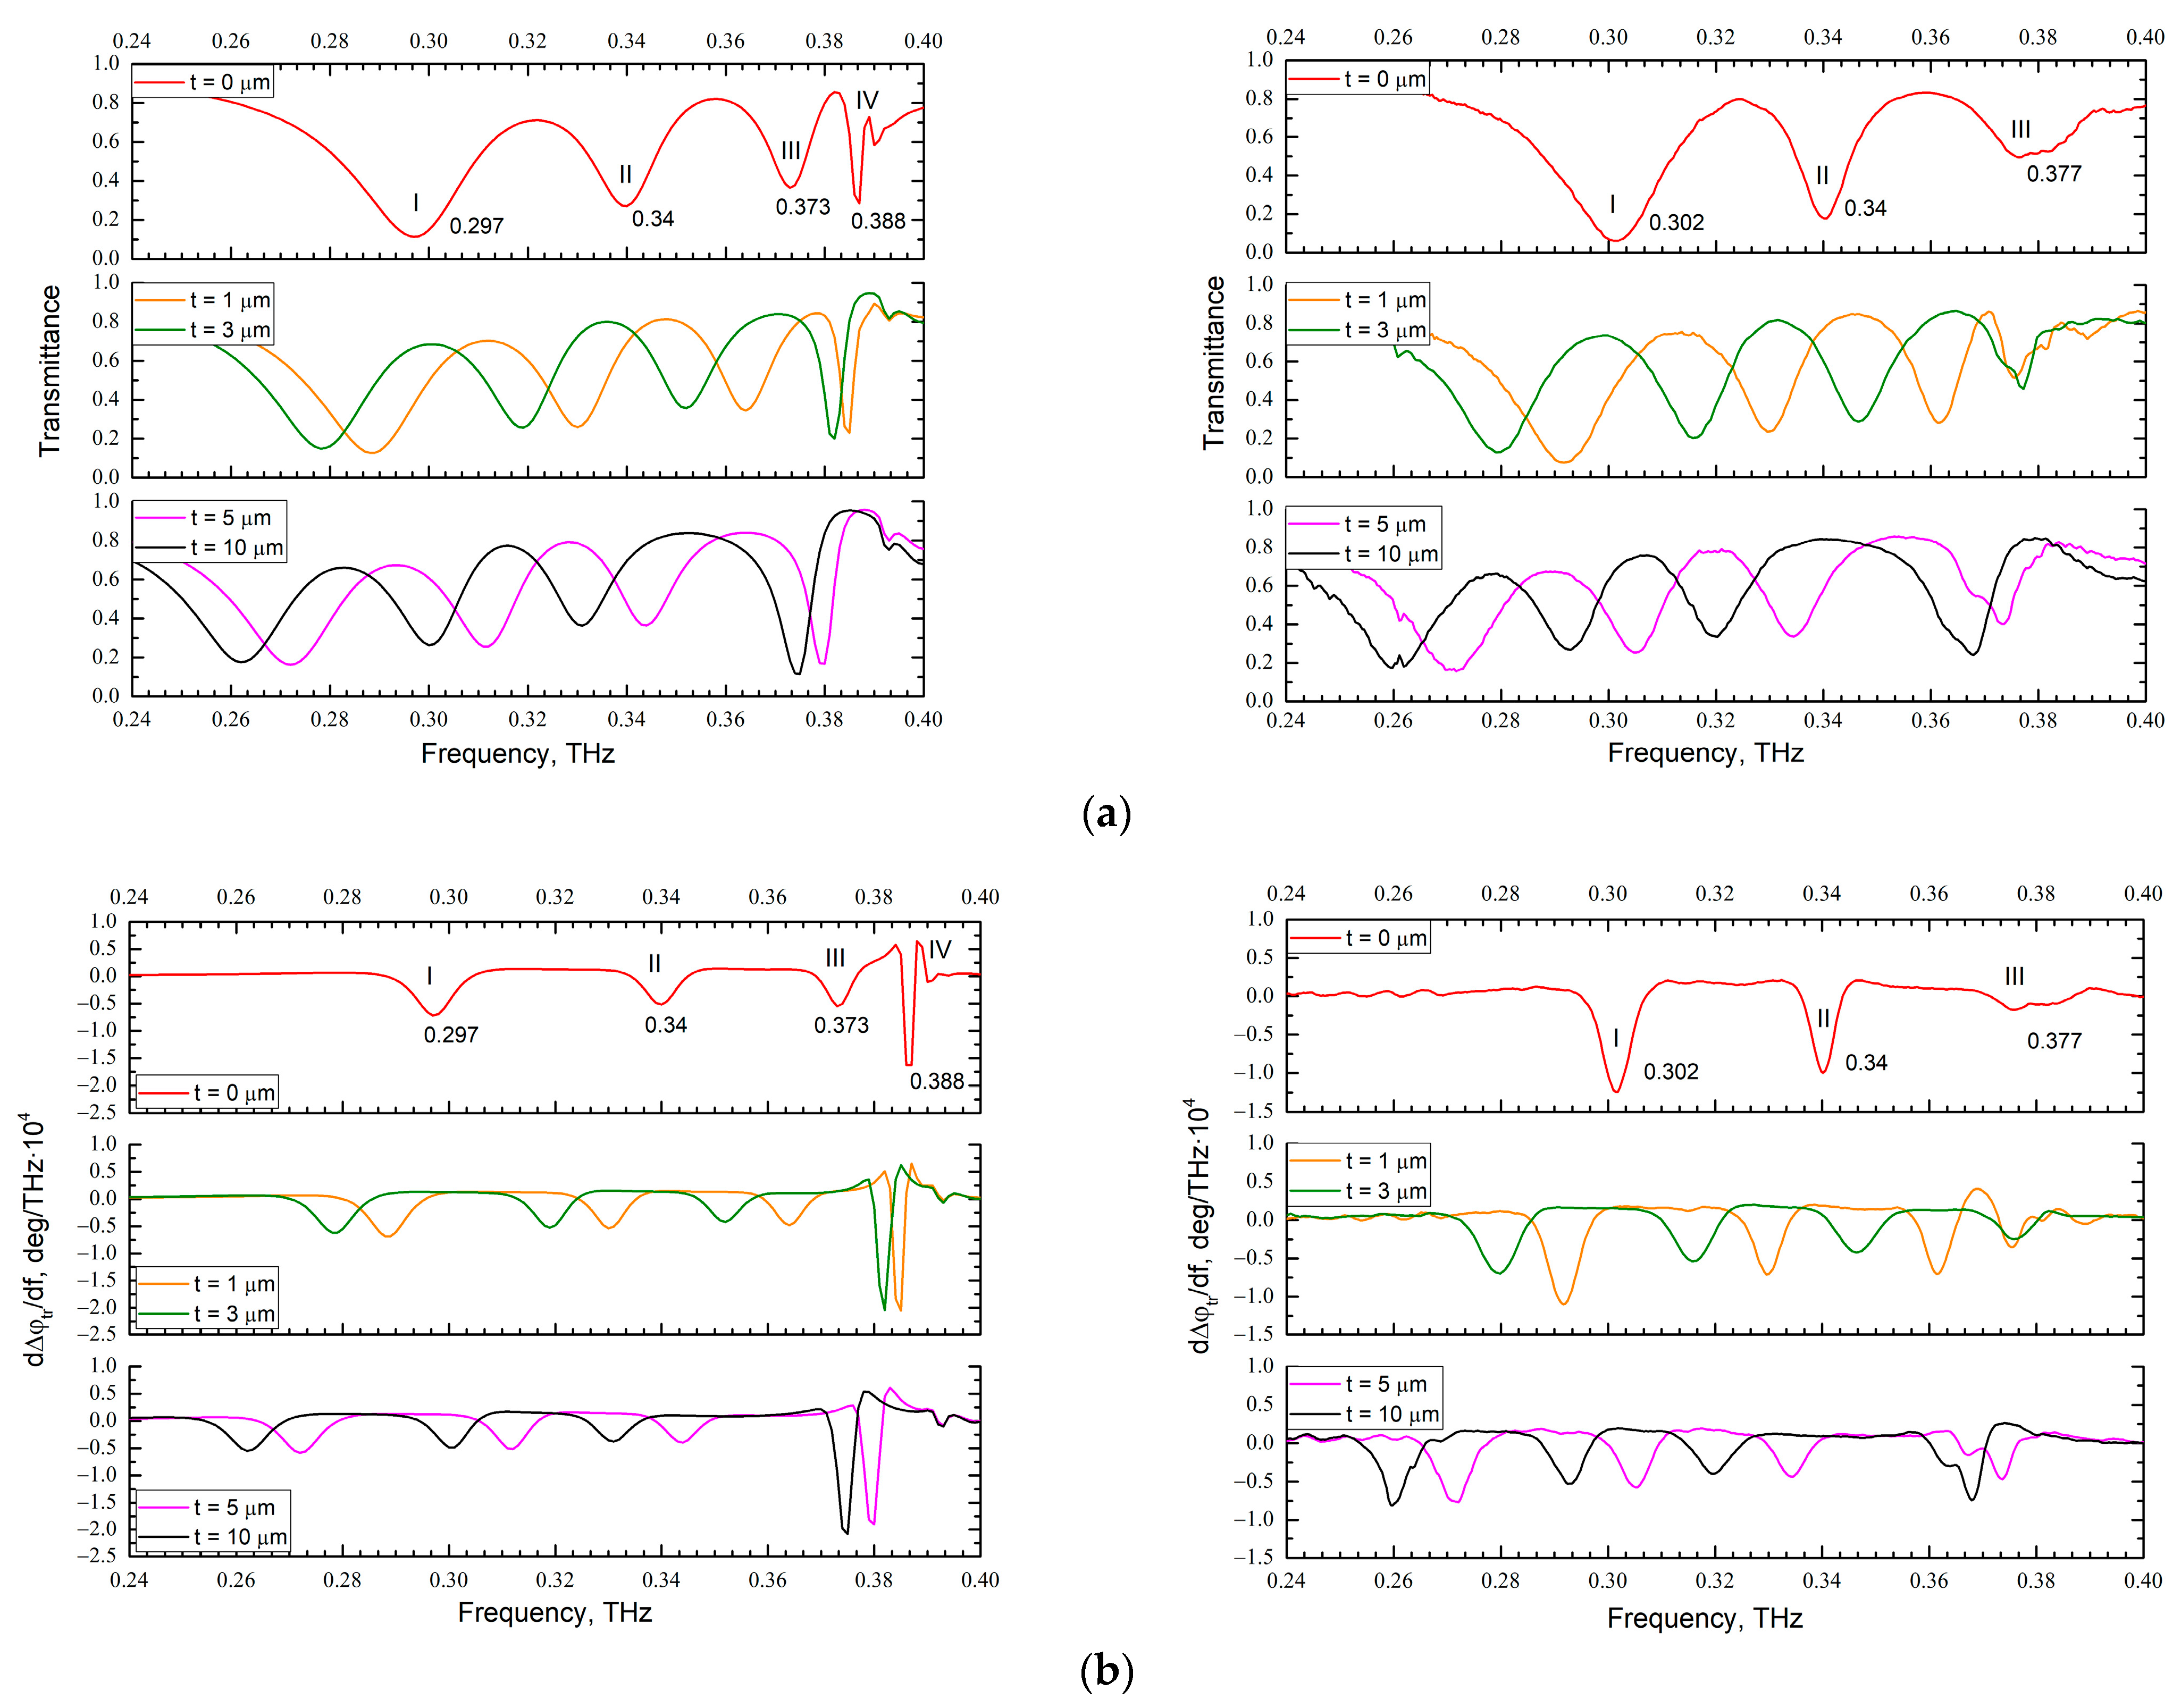
The terahertz metamaterial can be used as a sensor for substance detection. The analytes covering the surface of the metamaterial lead to a change in the ambient dielectric permittivity, which in turn results in the shift of the resonant frequency of the THz transmission spectrum of the metamaterial. It is possible to estimate the refractive indices of the analytes via measurement of the offset of the resonance dips and distinguish different substances. In addition, if the parameters of samples are known, the metamaterial can be used for thickness measurement based on the fact that the frequency offset depends on the thickness. To quantify the performance of the sensors we conducted experiments and simulations with the proposed metamaterial coated with dielectric layers; the results are shown in
Figure 7.
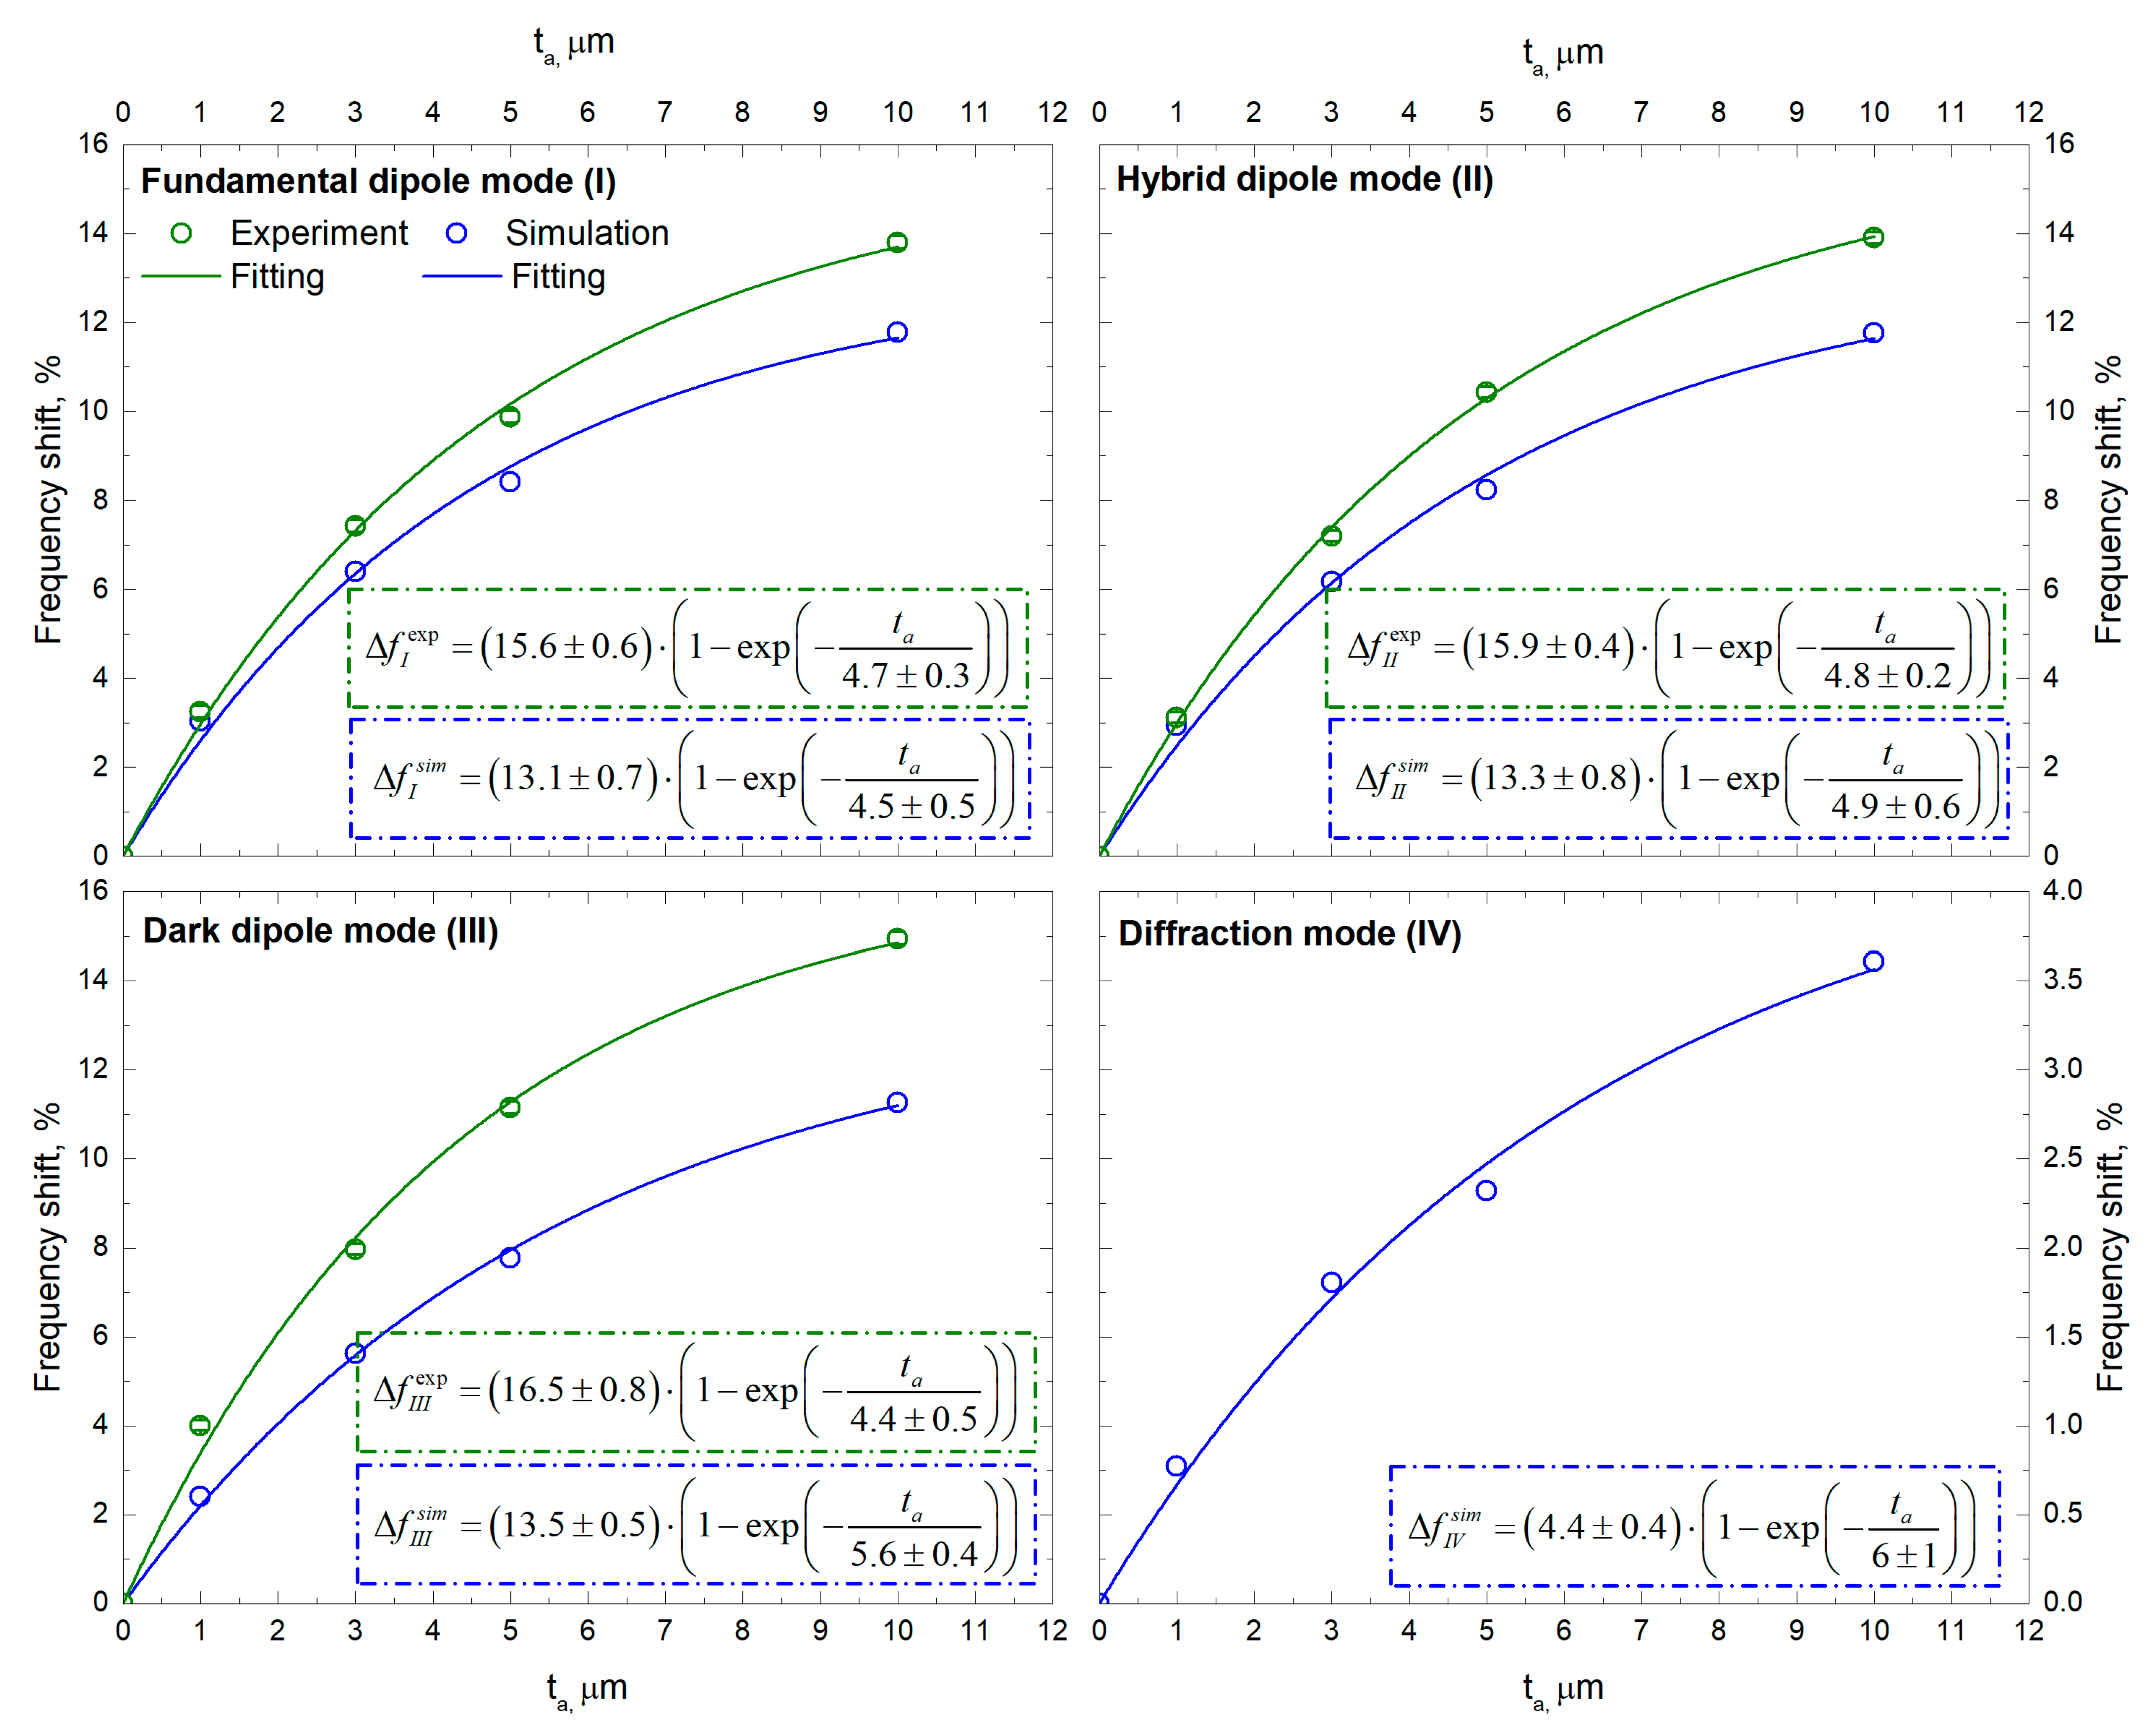
To obtain further insight into the resonances capabilities of the spiral structure, we defined the frequency shift as
, where
is the resonance frequency of the spiral metamaterial coated with an analyte with thickness
, and
is the resonance frequency of the metamaterial without any analyte coating. We plotted the measured and simulated frequency shifts of the spiral metamaterials in
Figure 8. The fitting function can be described as
, where
is the saturation frequency shift and
is the saturation thickness of the sensor. We fitted the simulation and experimental results, and the good match of this approximation with the data indicates that the boundary fields exponentially decayed from the top surface of the sensor. Meanwhile, the experimental data show a systematic deviation from the simulation results. This is due to the fluctuations in the refractive index of the analyte over time, as was described in
Section 4.
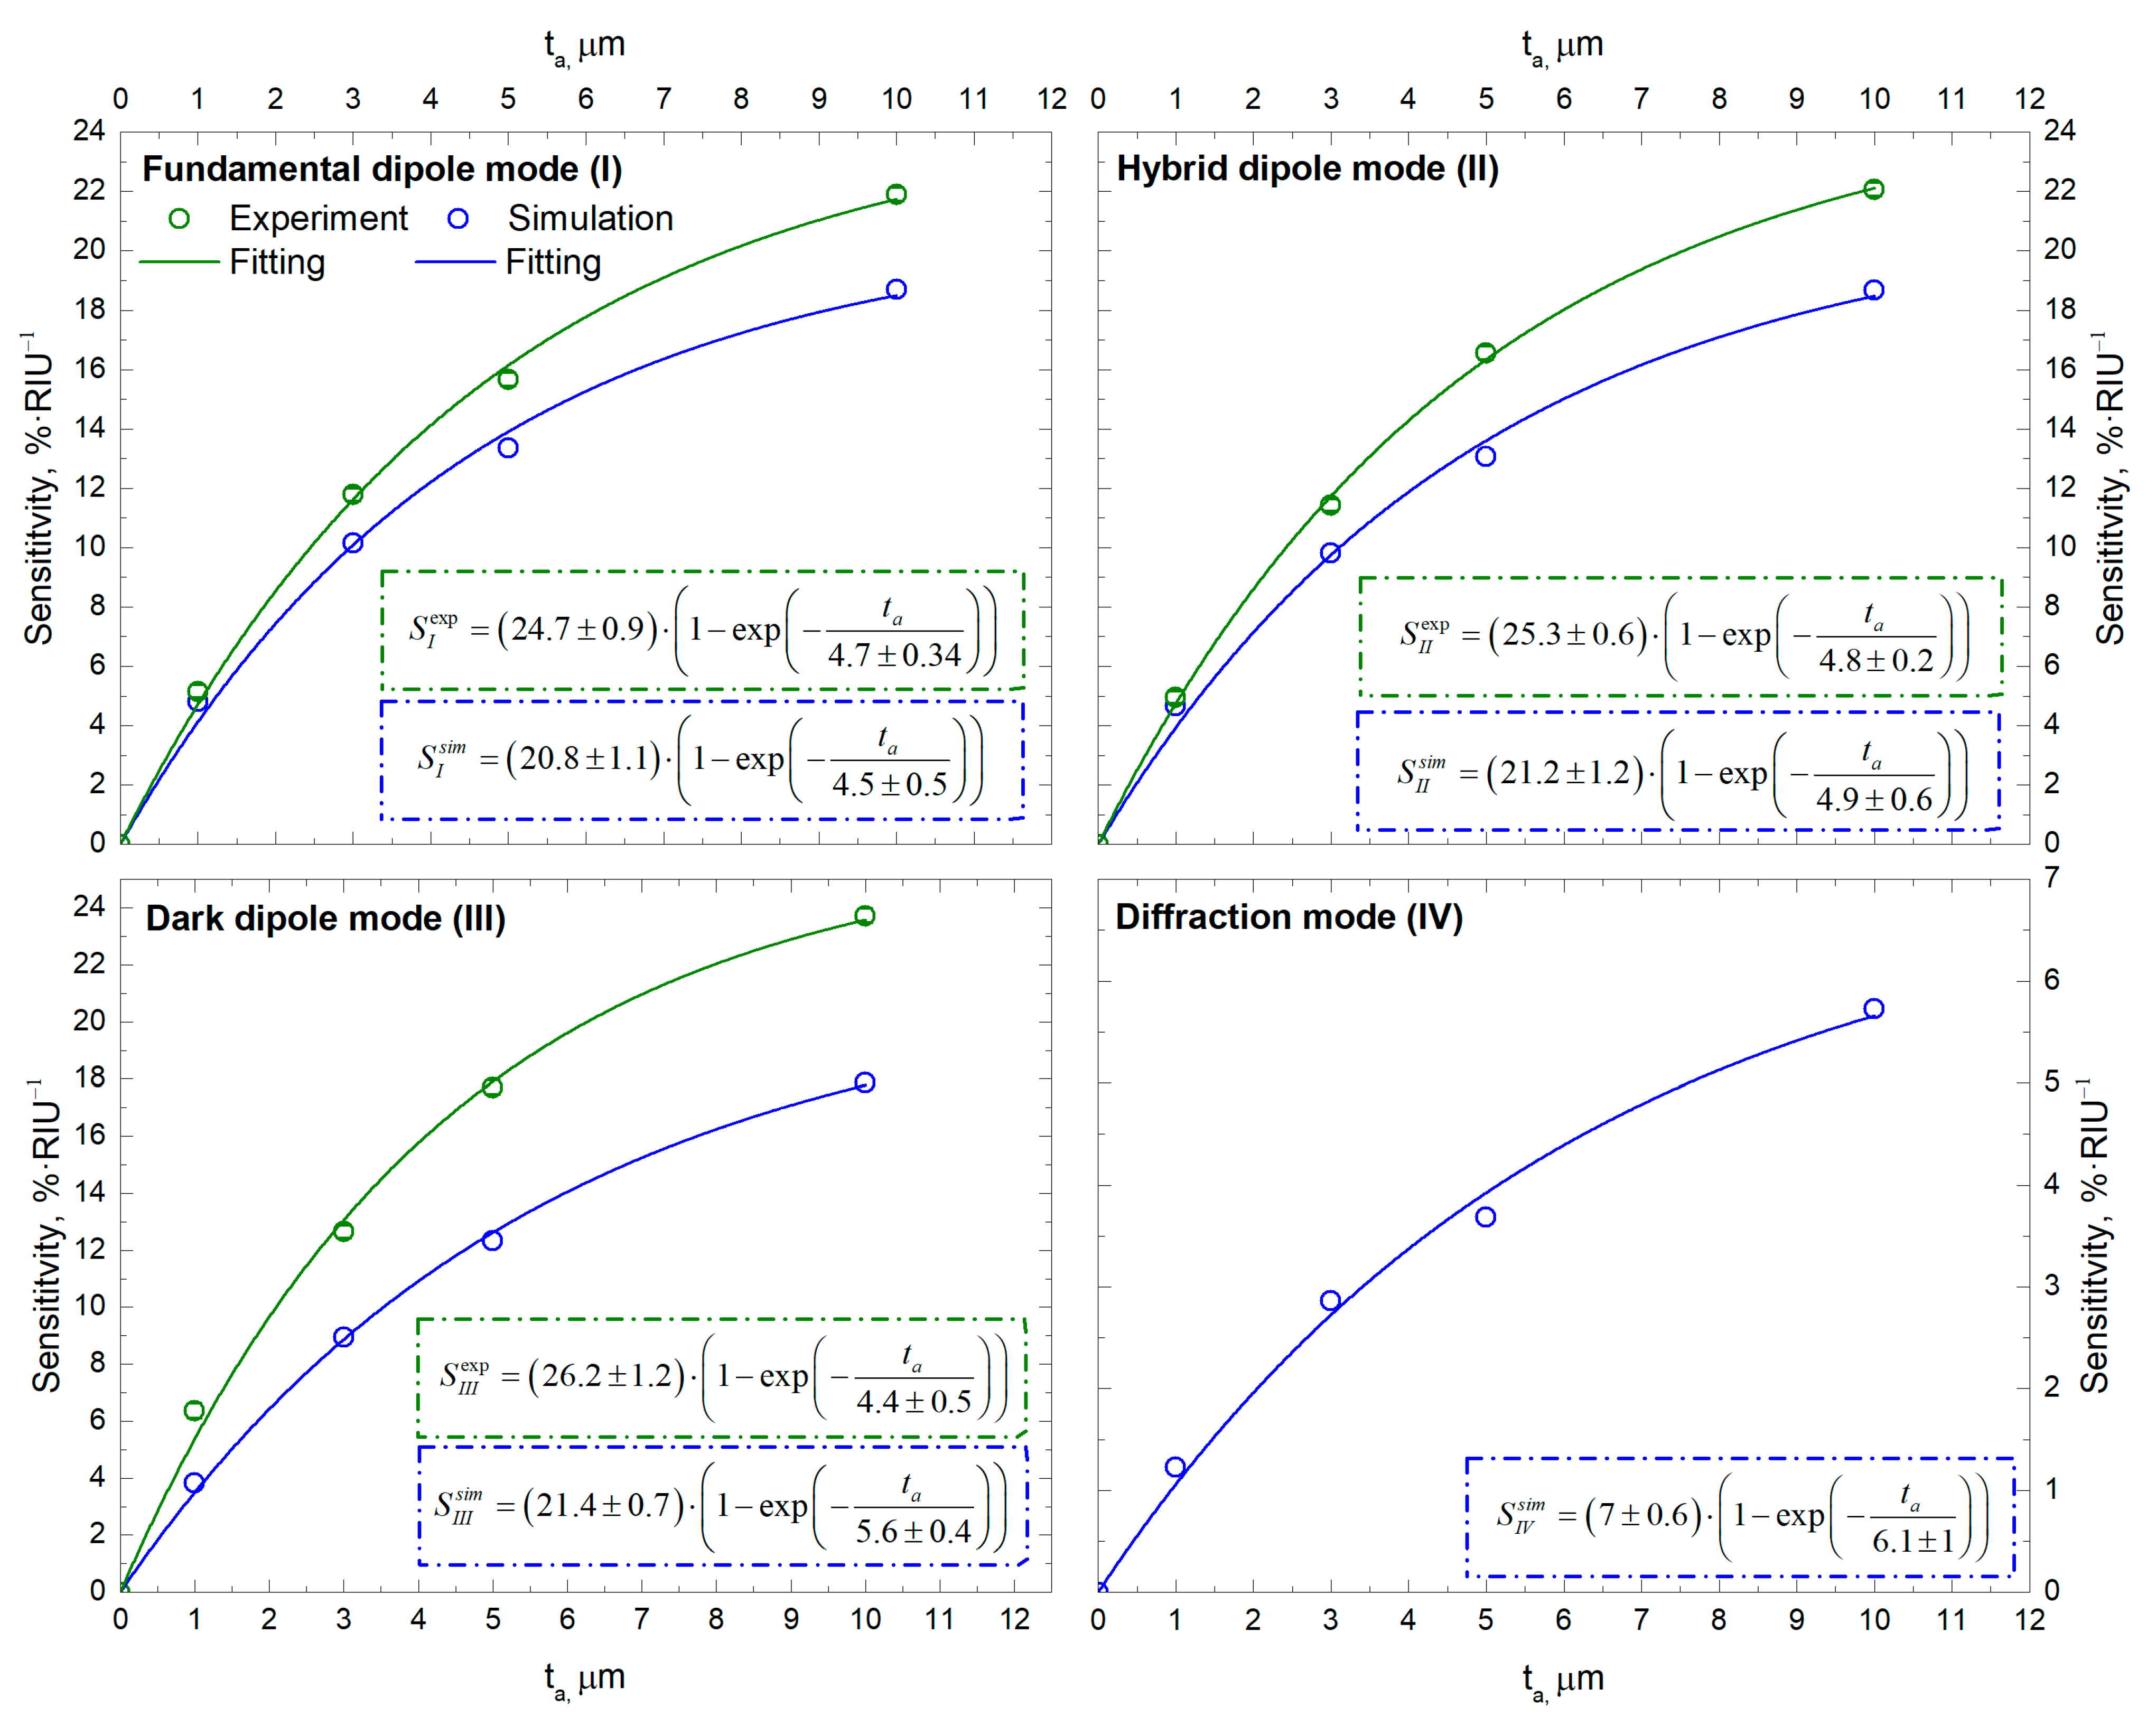
In general, three main parameters enable the evaluation of the sensing performance of the metamaterials: refractive index sensitivity (S), Q factor (Q), and figure of merit (FOM). The sensitivity reflects the relationship between the resonant frequency shift induced by the addition of analytes and the change in the refractive index , that is, . Because we have analytes with similar refractive indices, but different thicknesses, we can formally estimate the sensitivity by assuming that the resonance frequency shift is in a linear dependence on the refractive index , where is the refractive index of the media surrounding the bare metamaterial. Thus, taking into account the influence of the analyte thickness on the sensitivity, we obtain .
As shown in
Figure 9, as the thickness of the analyte layer increased, the refractive index sensitivity of the sensor significantly grew. The sensitivity went up with the factor
with the layer thickness
, which corresponds to 63% of the maximum sensitivity
. From the point of sensing applications, we assumed that the optimal thickness was
(
of
), because after that no increase in the refractive index sensitivity was evident anymore. The analyte thickness was beyond the range of the distance that the electromagnetic field affects, which alternatively influences the sensing performance of the sensor. The maximum sensitivity can be determined as
.
The fundamental and dark resonance modes are dipole modes, but they work at different frequencies; within the observational error, they have the same sensitivities. We estimated the sensitivities of the dipole modes as %/RIU for the modeling results. As was mentioned earlier, the refractive index of the analyte differed from the simulated value. It is possible to estimate the experimental refractive index of the analyte based on the measurements. Assuming that , we obtain , and then the experimental sensitivity is %/RIU.
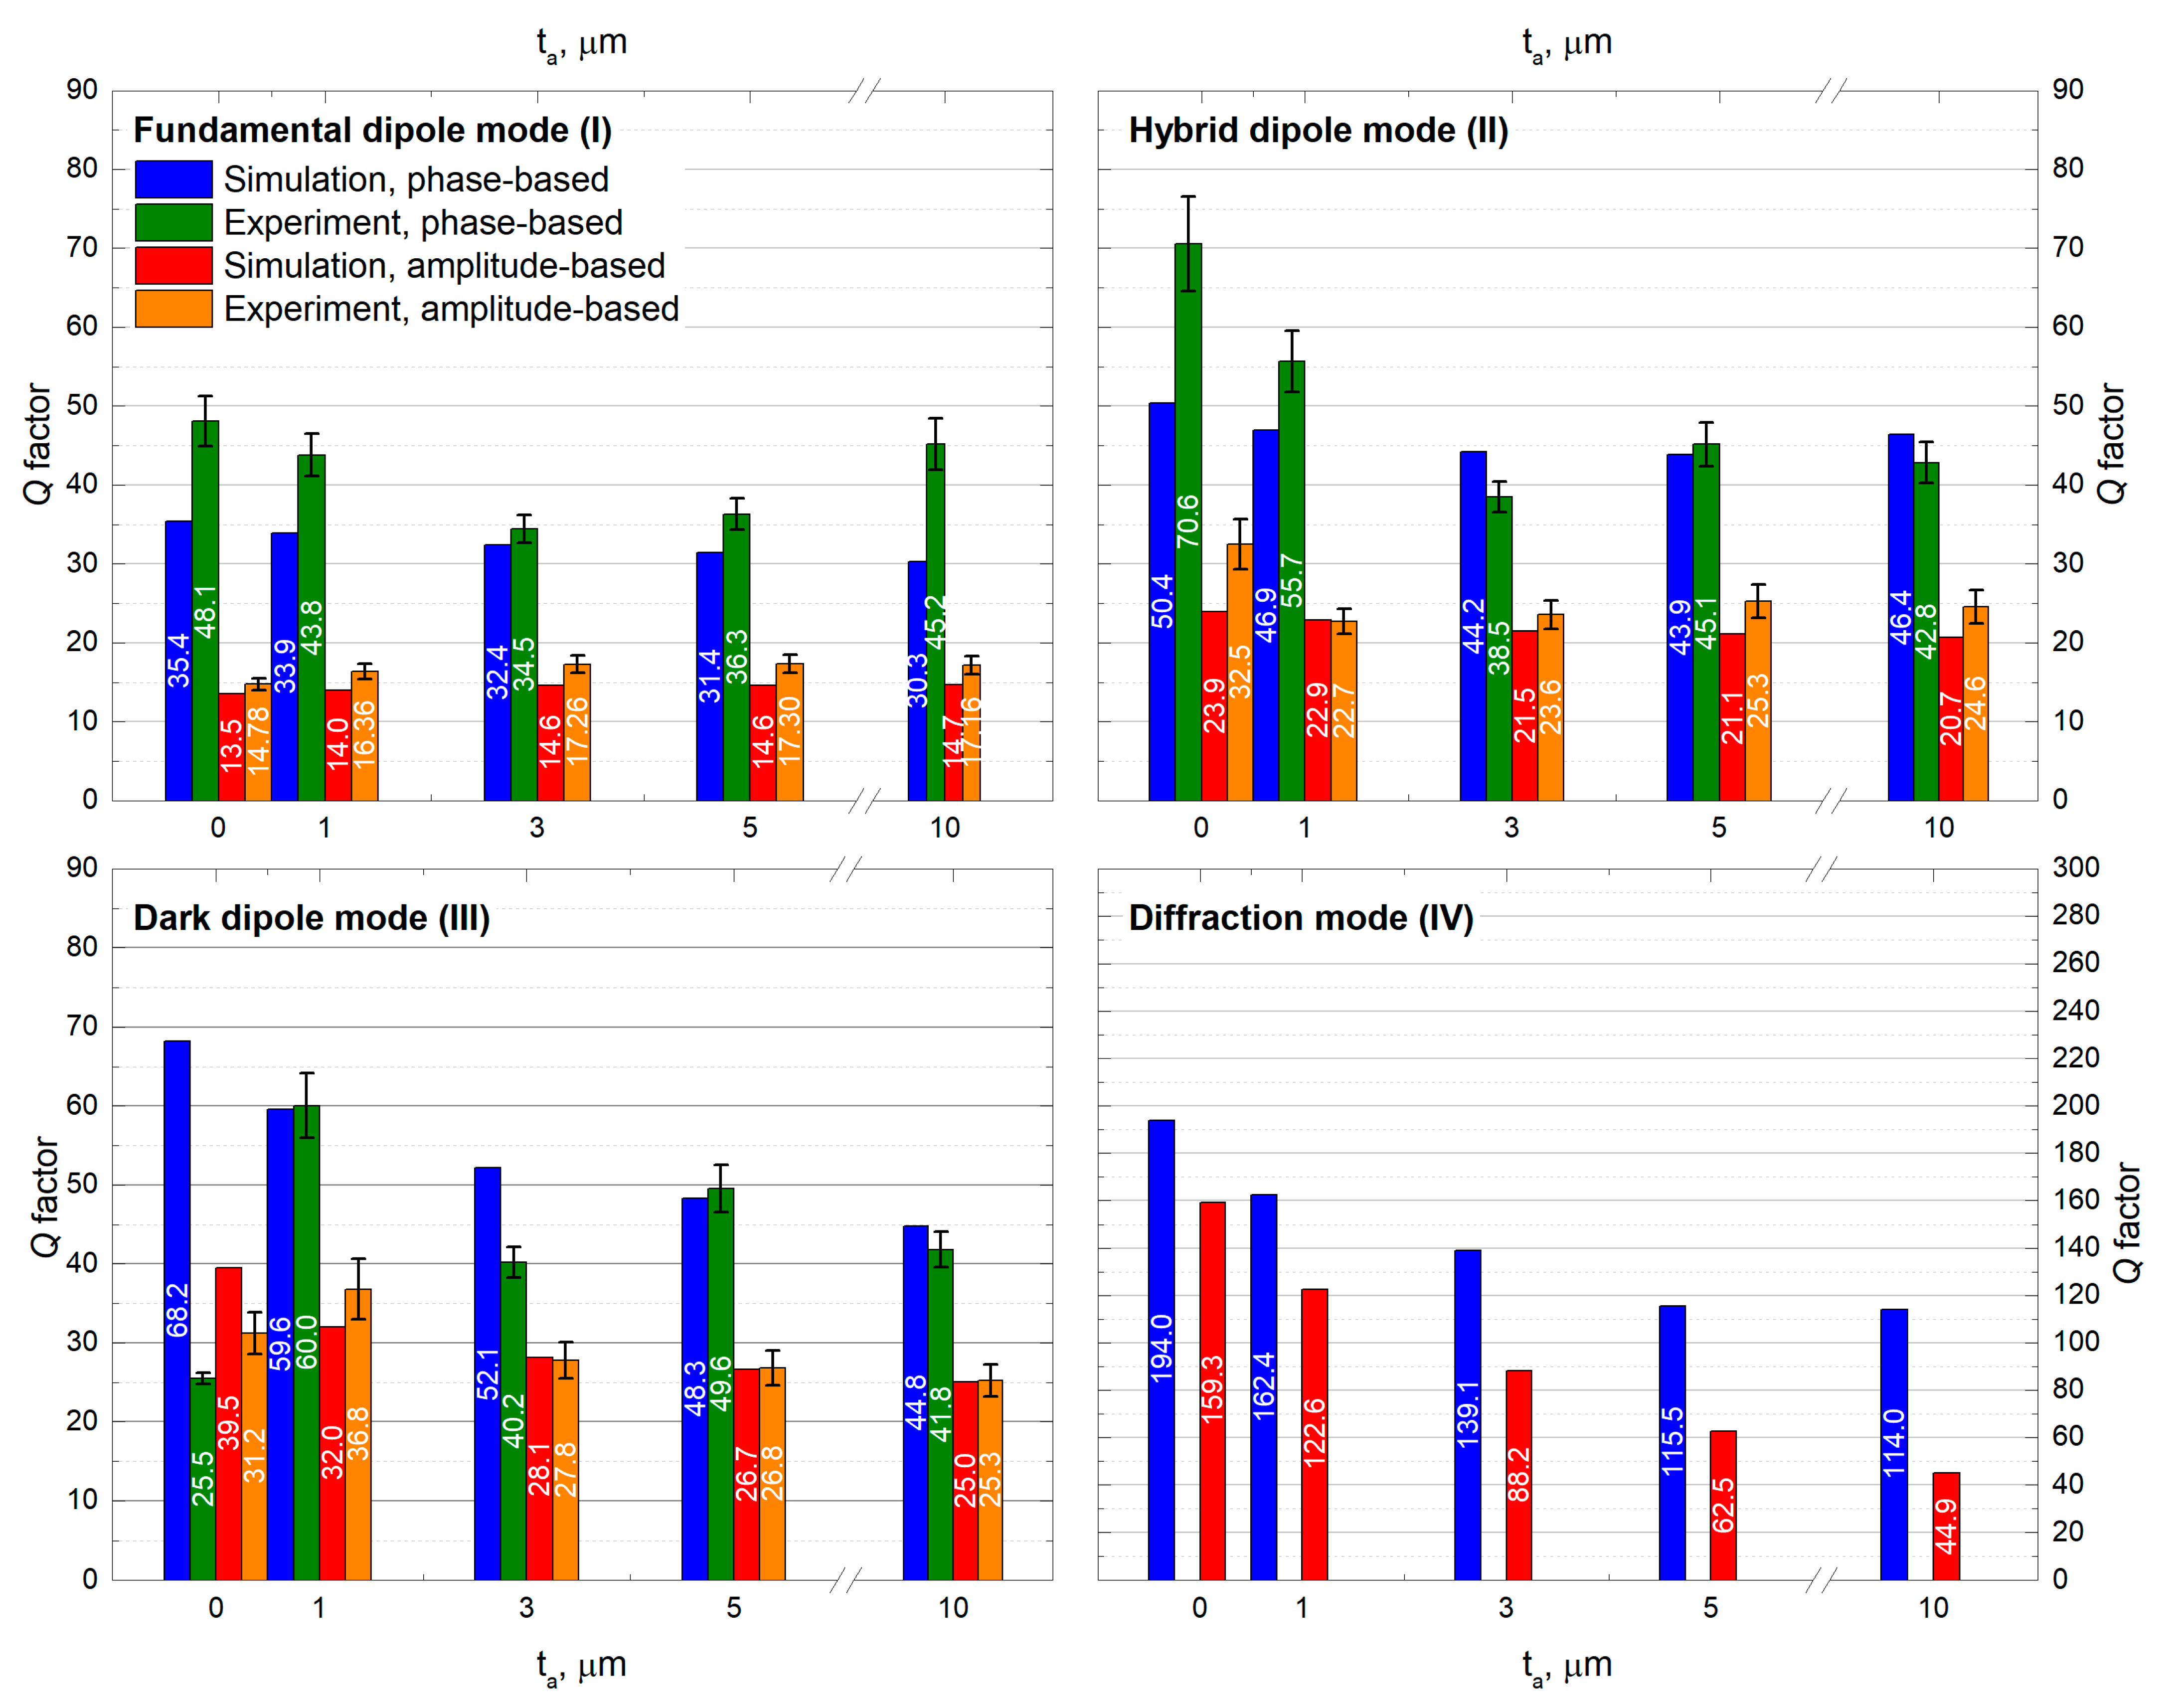
The next parameter of the sensor is the quality factor
, where
is the full width at half-minimum of the resonant dip. The higher the
Q factor (the narrower is
), the easier is it to distinguish the offset of the resonant dip. The quality factor changed slightly with a variation in the analyte thickness (see
Figure 10).
In the amplitude measurements, the best Q factor was observed for the dipole modes excited with the C-shaped resonator; it was for the modeling and for the experimental results, whereas for the fundamental dipole mode, it was and , correspondingly. The Q factor of the hybrid dipole mode at 0.34 THz was better in the experiment because it was clearly distinguishable. In terms of this parameter, the dark dipole mode is almost three times better than the fundamental mode. To compare the quality factor obtained from the phase measurement, almost twice the best quality factor is shown. So, the results were , , , and . Increasing the quality factor is the main reason for using phase measurements for dark dipole modes in sensor applications.
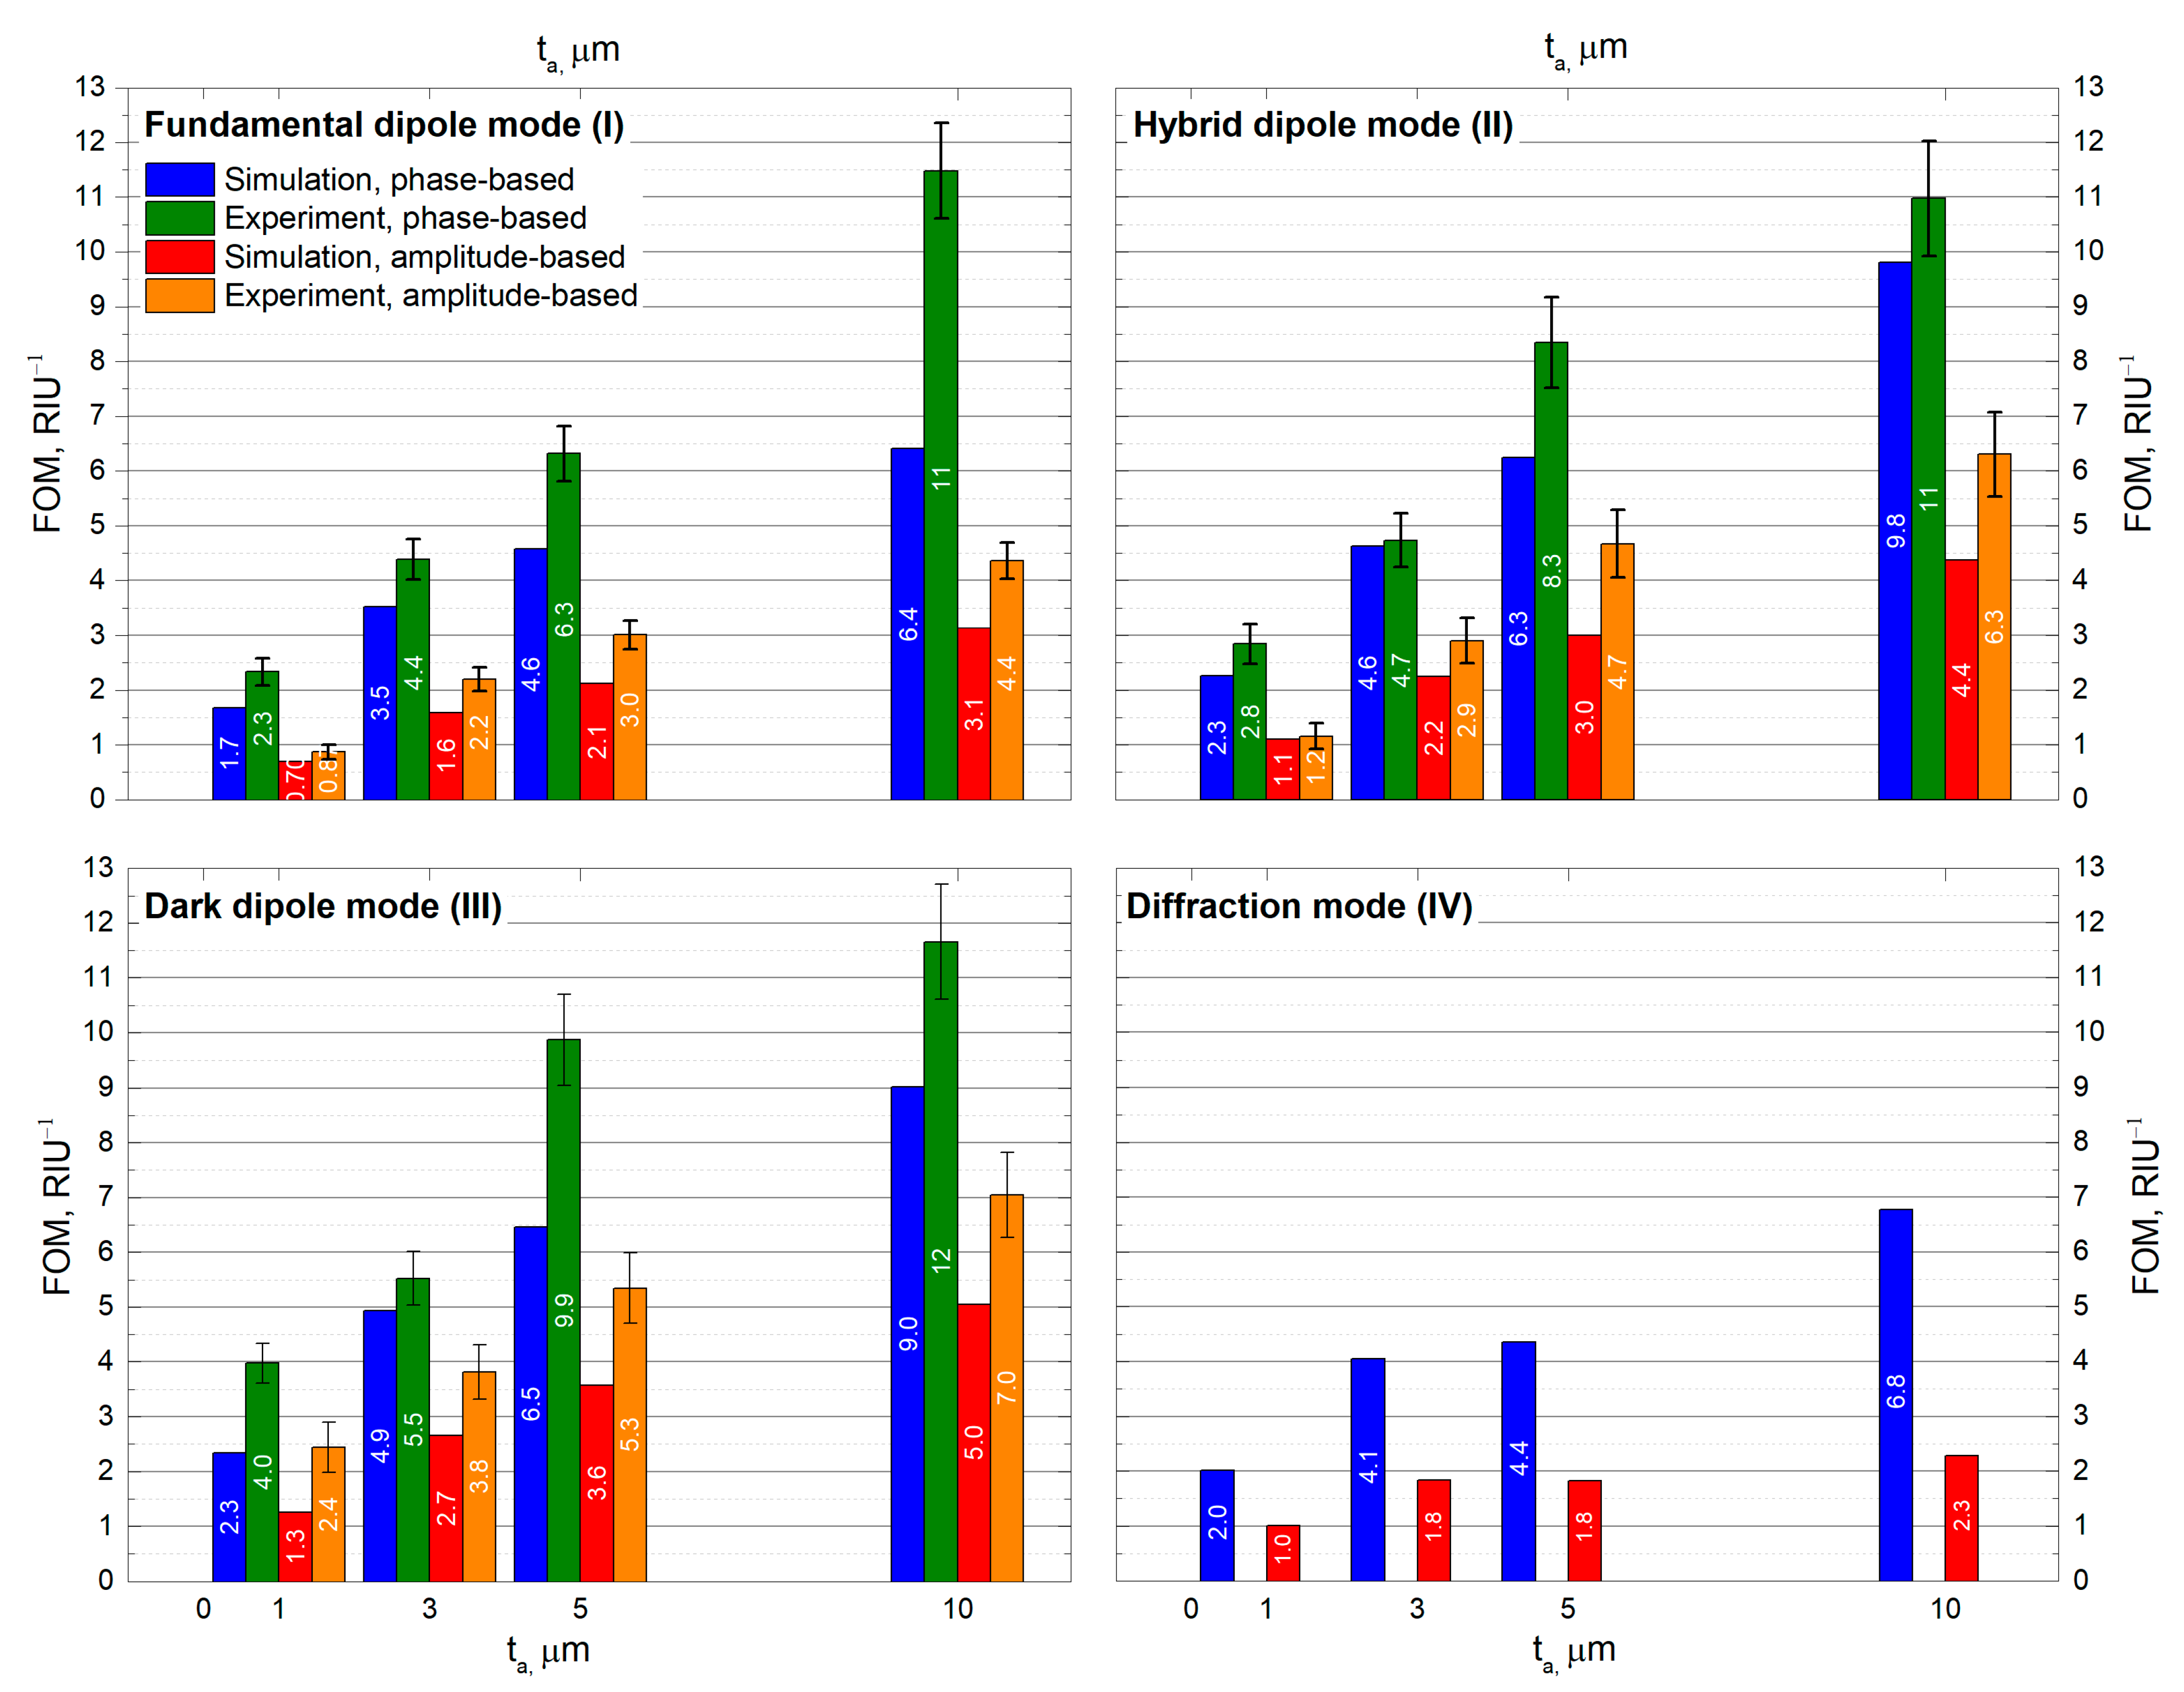
For a further quantitative description of the proposed sensor, we calculated the figure of merit (FOM), which is regularly used for comparison of the sensing performance of the sensor in different frequency bands. Higher FOM values correspond to better sensing performance. We defined the FOM as
, where
is the quality factor of the resonance of the bare metamaterial. The results are demonstrated in
Figure 11. The FOM goes up with increasing analyte thickness because this parameter is inversely proportional to the sensitivity. We can estimate the maximum FOM as
. For the amplitude and phase measurements, they were
RIU
−1 and
RIU
−1 correspondingly.
As can be seen in
Table 1, the sensing performance of the proposed sensor is comparable to or better than those recently reported in the literature. It could be concluded that the spiral metamaterial provides one of the highest FOMs and
Q factors among analogs. Moreover, due to its several resonance modes, it can characterize identical samples at multiple frequencies, thereby increasing the selectivity and sensitivity of detection.


