
Field Study to Evaluate Water Loss in the Irrigation Canals of Middle Egypt: A Case Study of the Al Maanna Canal and Its Branches, Assiut Governorate


Abstract
1. Introduction
1.1. Seepage Losses
1.1.1. Experimental Formulas for Measuring Seepage Losses
1.1.2. The Field Ponding Method for Measuring of Seepage Losses
1.2. Evaporation Losses
1.3. Evapotranspiration Losses
2. Materials and Methods
2.1. Methodology
2.2. Study Area
2.3. Soil Types
2.4. Meteorological Data
2.5. Field Data
2.5.1. Field Parameters of Seepage Losses
2.5.2. Field Parameters of Evaporation Losses
2.5.3. Field Parameters of Evapotranspiration Losses
3. Results and Discussion
3.1. Seepage Losses
3.2. Evaporation Losses
3.3. Evapotranspiration Losses
3.4. An Economic Study of the Lining Process in the Study Area
4. Conclusions
- The results obtained using the most widely used equations for predicting the estimated values of seeping water from the Al Maanna Canal were notably different. This is due to the varying conditions and properties of the soil in which the experiments were conducted, which resulted in each equation.
- The results obtained using the Moleth–Worth formula were most consistent with the measured seeping quantities of water using the field ponding method. The measured seeping quantities from the Al Maanna canal were around 1.563 million m3/month, while the calculated quantities using the Moleth–Worth equation were 1.617 million m3/month. Additionally, the approximate seepage losses from the Al Manna canal branches were 0.506 and 0.580 million m3/month, respectively, indicating a tolerable approximation difference.
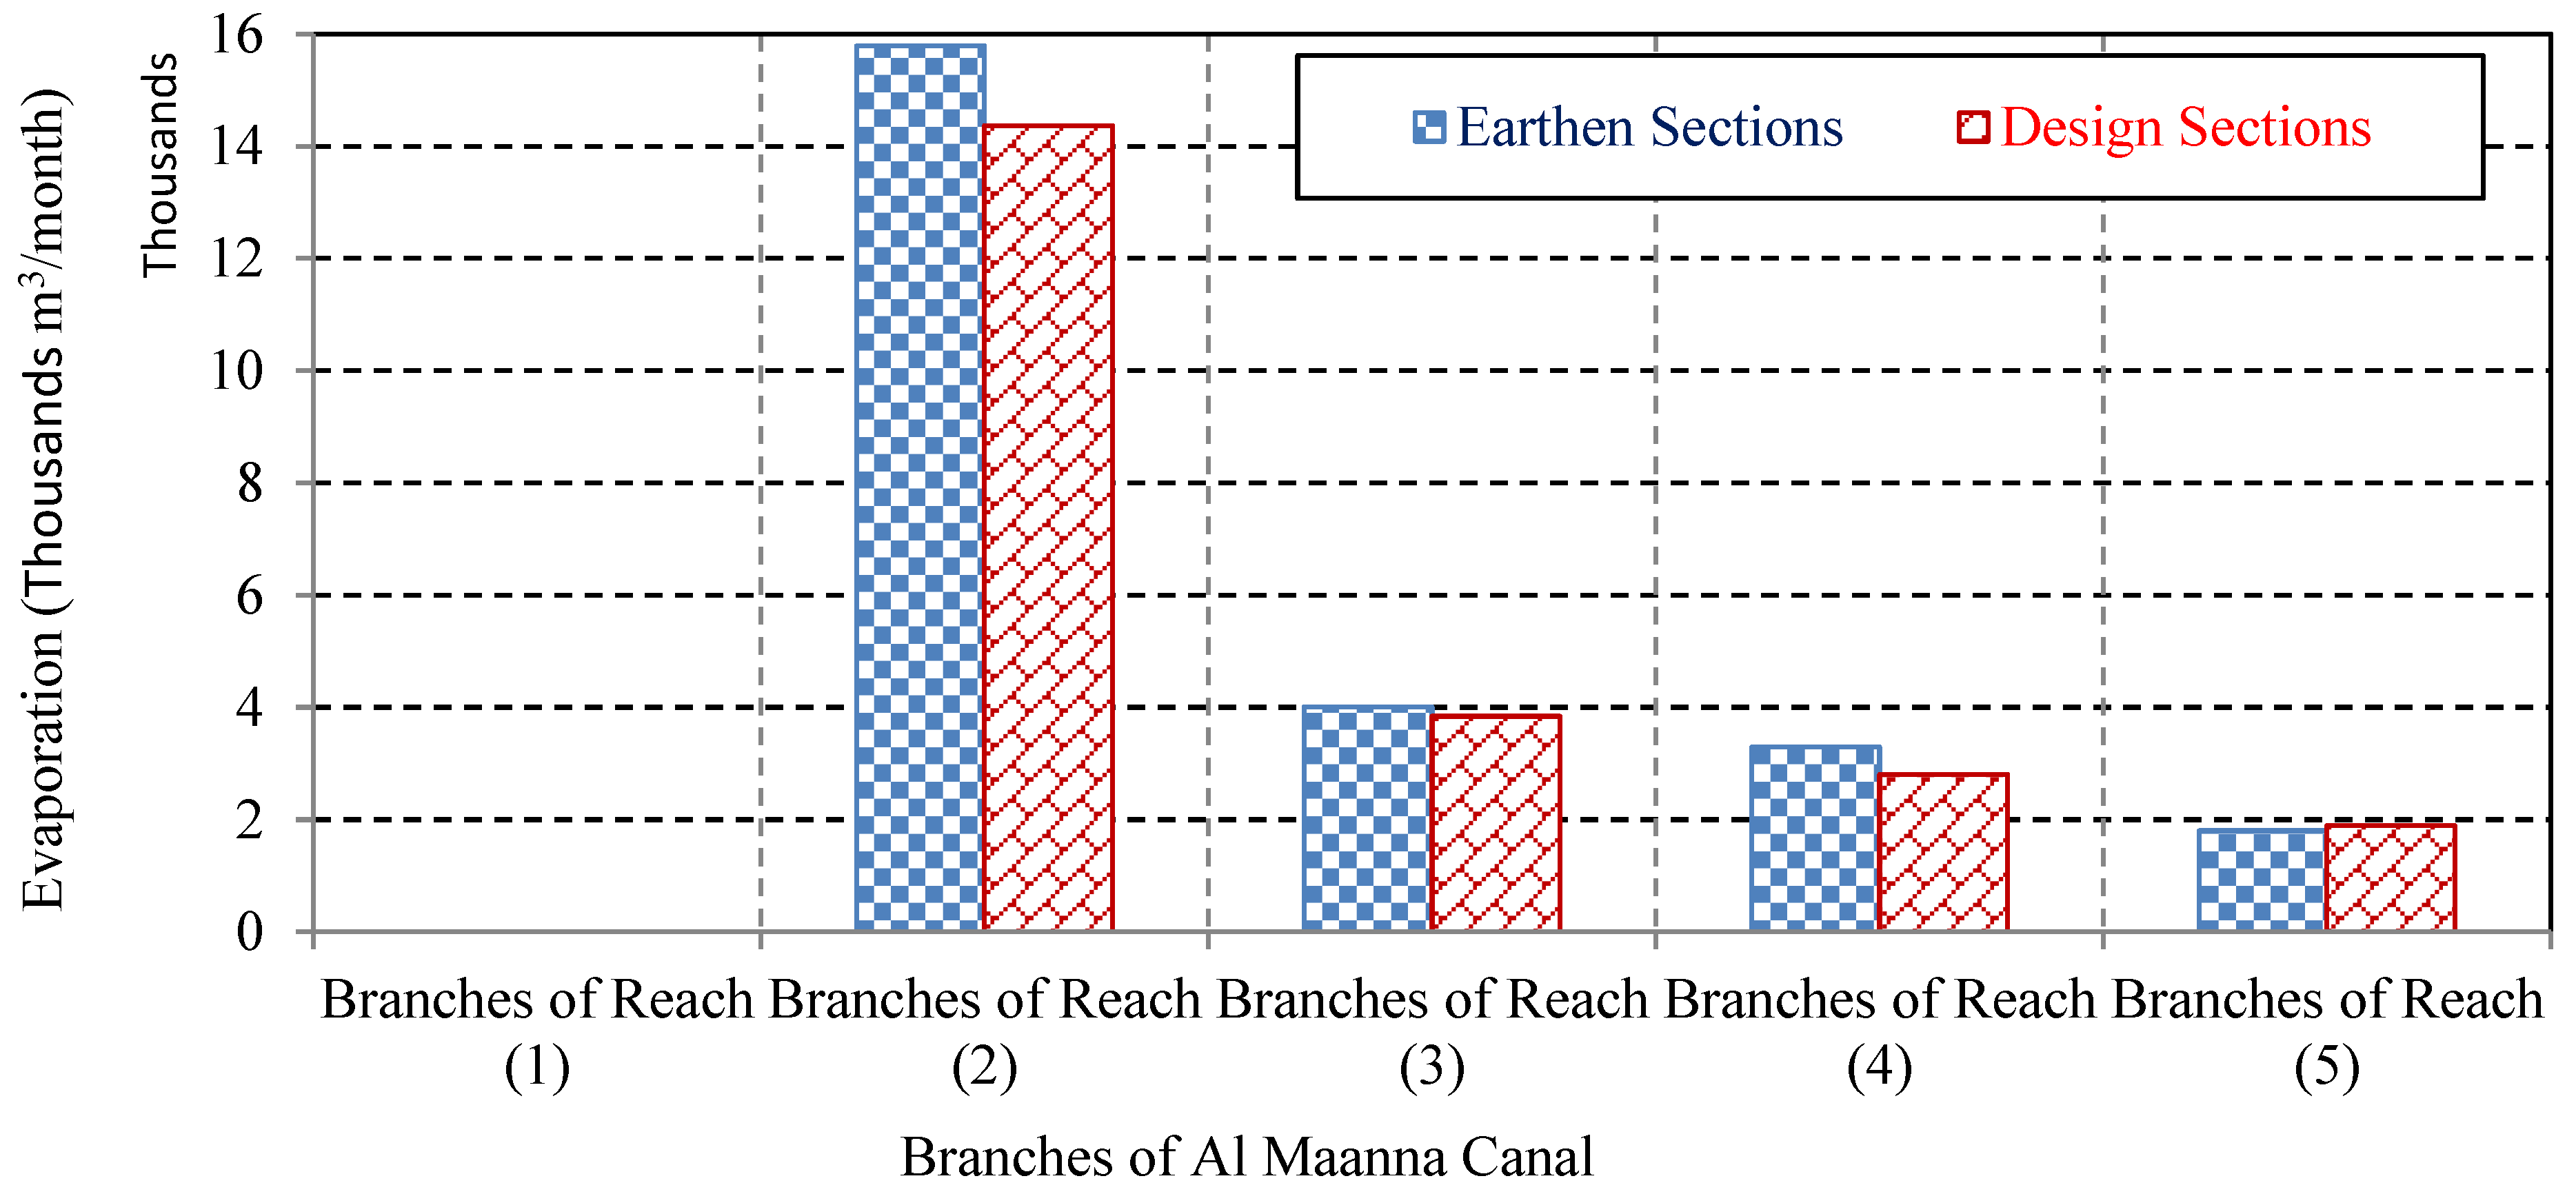
- The maximum calculated evaporation and evapotranspiration losses from the Al Maanna canal were roughly 0.061 and 0.736 million m3/month, respectively, while the maximum evaporation and evapotranspiration losses from the Al Maanna canal branches were calculated to be approximately 0.0249 and 0.397 million m3/month, respectively.
- The overall seepage, evaporation, and evapotranspiration losses from the Al Maanna canal network are estimated to be around 3.42 million m3/month, accounting for approximately 13.63% of the Al Maanna canal’s total discharge.
- Following the lining process, the field ponding method was used to estimate seepage losses from the Al Maanna canal and its branches, which were approximately 0.472 million m3/month. Additionally, evaporation losses can be decreased to roughly 0.075 million m3/month after the rehabilitation procedure, while evapotranspiration losses are ignored.
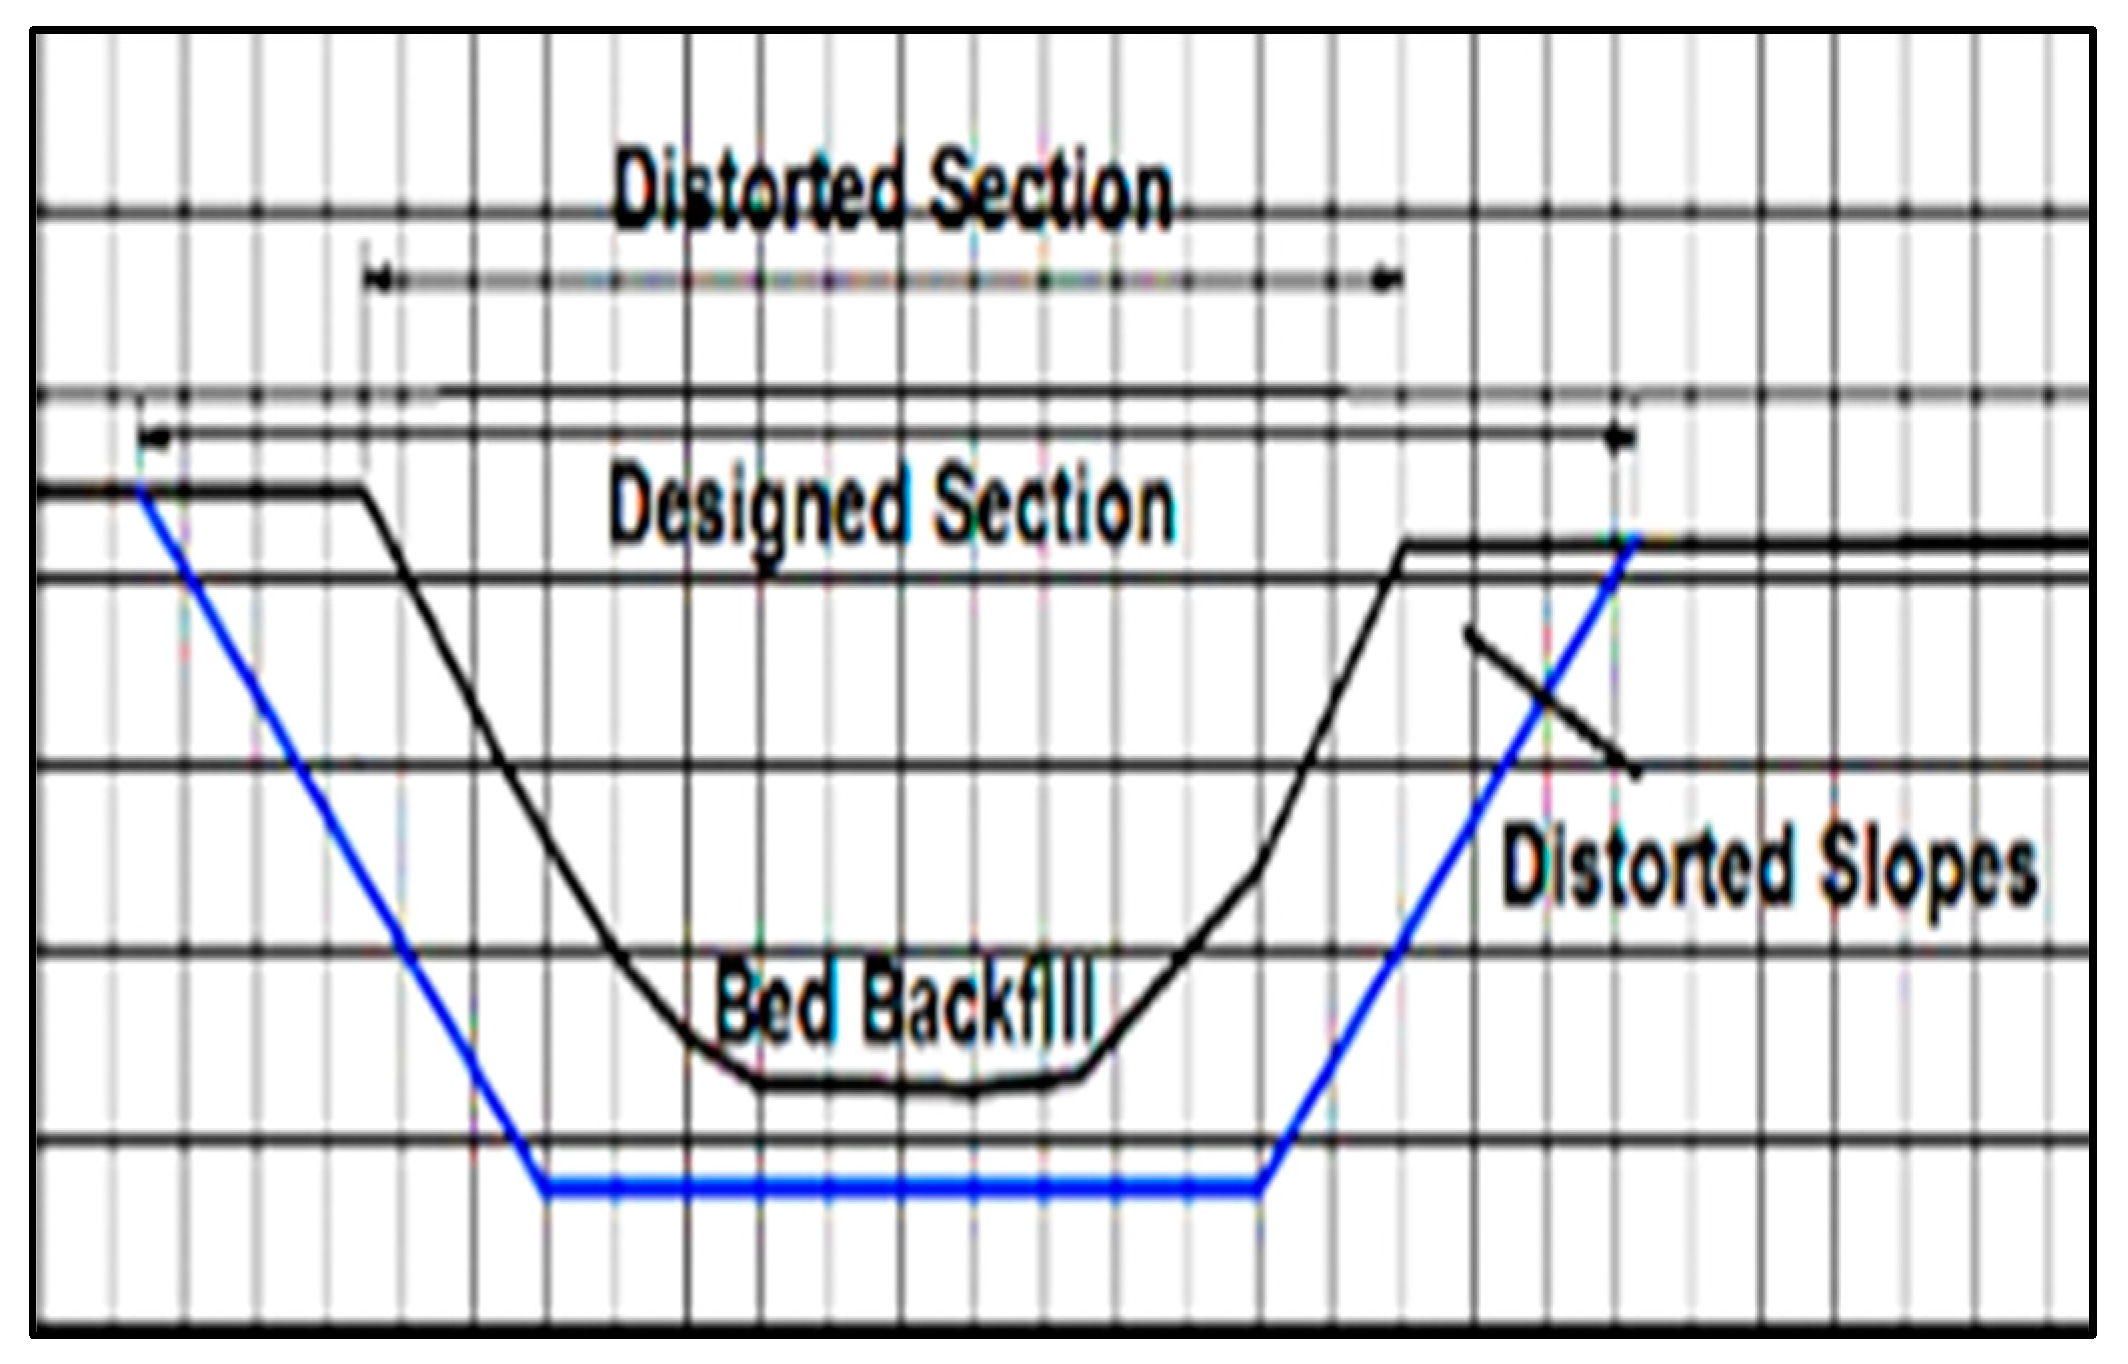
- The lining of distorted sections of the Al Maanna canal and its branches can reduce water losses by approximately 84%, which is good and sufficient to recommend and encourage lining processes where the gained quantities of water will be more valuable and important than the cost of implementation.
- Estimated savings would be no less than EGP 5.84 million per year and EGP 1.50 million per year on the costs of periodic maintenance and removal of weeds for Al Maanna canal’s sections and branches.
Author Contributions
Funding
Data Availability Statement
Acknowledgments
Conflicts of Interest
Appendix A


| Dominant Soil Group | Associated Soil and Inclusions | ||
|---|---|---|---|
| Coverage | SOTWIS | ||
| Soil Mapping Unit | 16,413 | ||
| FL—Fluvisols | |||
| Sequence | 1 | 2 | 3 |
| Share in Soil Mapping Unit (%) | 50 | 25 | 25 |
| Database ID | 16,219 | 16,220 | 16,221 |
| Soil Unit Symbol (FAO 74) | - | - | - |
| Soil Unit Name (FAO74) | - | - | - |
| Soil Unit Symbol (FAO 85) | - | - | - |
| Soil Unit Name (FAO 85) | - | - | - |
| Soil Unit Symbol (FAO 90) | FLc | GLe | VRe |
| Soil unit Name (FAO 90) | Calcaric Fluvisols | Eutric Gleysols | Eutric Vertisols |
| Topsoil Texture | Medium | Medium | Fine |
| Reference Soil Depth (cm) | 100 | 100 | 100 |
| PHASE1 | - | - | - |
| PHASE2 | - | - | - |
| Obstacles to Roots (ESDB) (cm) | - | - | - |
| Impermeable Layer (ESDB) (cm) | - | - | - |
| Soil Water Regime (ESDB) | - | - | - |
| Drainage Class (0–0.5% slope) | Moderately Well | Poor | Poor |
| AWC (mm) | 150 | 150 | 125 |
| Gelic Properties | No | No | No |
| Vertic Properties | No | No | Yes |
| Petric Properties | No | No | No |
| Topsoil Sand Fraction (%) | 41 | 40 | 21 |
| Topsoil Silt Fraction (%) | 39 | 31 | 25 |
| Topsoil Clay Fraction (%) | 20 | 29 | 54 |
| Topsoil USDA Texture Classification | Loam | Clay Loam | Clay (Light) |
| Topsoil Reference Bulk Density (kg/dm3) | 1.4 | 1.35 | 1.22 |
| Topsoil Bulk Density (kg/dm3) | 1.43 | 1.34 | 1.51 |
| Topsoil Gravel Content (%) | 1 | 1 | 1 |
| Topsoil Organic Carbon (% Weight) | 0.47 | 0.93 | 1.07 |
| Topsoil pH (H2O) | 8 | 6.1 | 6.9 |
| Topsoil CEC (clay) (cmol/kg) | 56 | 34 | 68 |
| Topsoil CEC (soil) (cmol/kg) | 13 | 13 | 40 |
| Topsoil Base Saturation (%) | 100 | 81 | 100 |
| Topsoil TEB (cmol/kg) | 13 | 10.5 | 40 |
| Topsoil Calcium Carbonate (% Weight) | 10.9 | 0 | 0.4 |
| Topsoil Gypsum (% weight) | 0.2 | 0 | 0.1 |
| Topsoil Sodicity (ESP) (%) | 3 | 2 | 1 |
| Topsoil Salinity (ECe) (dS/m) | 0.6 | 0 | 0.3 |
| Database ID | 16,219 | 16,220 | 16,221 |
| Subsoil Sand Fraction (%) | 42 | 37 | 20 |
| Subsoil Silt Fraction (%) | 38 | 28 | 24 |
| Subsoil Clay Fraction (%) | 20 | 35 | 56 |
| Subsoil USDA Texture Classification | Loam | Clay Loam | Clay (Light) |
| Subsoil Reference Bulk Density (kg/dm3) | 1.41 | 1.31 | 1.21 |
| Subsoil Bulk Density (kg/dm3) | 1.46 | 1.43 | 1.58 |
| Subsoil Gravel Content (%) | 1 | 1 | 1 |
| Subsoil Organic Carbon (% weight) | 0.34 | 0.33 | 0.56 |
| Subsoil pH (H2O) | 8.1 | 6.4 | 7.5 |
| Subsoil CEC (clay) (cmol/kg) | 60 | 38 | 70 |
| Subsoil CEC (soil) (cmol/kg) | 13 | 14 | 41 |
| Subsoil Base Saturation (%) | 100 | 86 | 100 |
| Subsoil TEB (cmol/kg) | 13 | 12 | 41 |
| Subsoil Calcium Carbonate (% weight) | 11.2 | 0.1 | 1.4 |
| Subsoil Gypsum (% weight) | 0.4 | 0 | 0.1 |
| Subsoil Sodicity (ESP) (%) | 3 | 2 | 2 |
| Subsoil Salinity (ECe) (dS/m) | 0.4 | 0 | 0.3 |
| Dominant Soil Group | Associated Soil and Inclusions | ||
| Coverage | SOTWIS | ||
| Soil Mapping Unit | 16,468 | ||
| Dominant Soil Group | LP—Leptosols | ||
| Sequence | 1 | 2 | 3 |
| Share in Soil Mapping Unit (%) | 60 | 30 | 10 |
| Database ID | 16,347 | 16,348 | 16,349 |
| Soil Unit Symbol (FAO 74) | - | - | - |
| Soil Unit Name (FAO74) | - | - | - |
| Soil Unit Symbol (FAO 85) | - | - | - |
| Soil Unit Name (FAO 85) | - | - | - |
| Soil Unit Symbol (FAO 90) | LPe | LPq | FLc |
| Soil unit Name (FAO 90) | Eutric Leptosols | Lithic Leptosols | Calcaric Fluvisols |
| Topsoil Texture | Medium | Medium | Medium |
| Reference Soil Depth (cm) | 30 | 10 | 100 |
| PHASE1 | - | - | - |
| PHASE2 | - | - | - |
| Obstacles to Roots (ESDB) (cm) | - | - | - |
| Impermeable Layer (ESDB) (cm) | - | - | - |
| Soil Water Regime (ESDB) | - | - | - |
| Drainage class (0–0.5% slope) | Imperfectly | Imperfectly | Moderately Well |
| AWC (mm) | 50 | 15 | 150 |
| Gelic Properties | No | No | No |
| Vertic Properties | No | No | No |
| Petric Properties | No | No | No |
| Topsoil Sand Fraction (%) | 50 | 43 | 41 |
| Topsoil Silt Fraction (%) | 30 | 29 | 39 |
| Topsoil Clay Fraction (%) | 20 | 28 | 20 |
| Topsoil USDA Texture Classification | loam | clay loam | loam |
| Topsoil Reference Bulk Density (kg/dm3) | 1.42 | 1.36 | 1.4 |
| Topsoil Bulk Density (kg/dm3) | 1.35 | 1.31 | 1.43 |
| Topsoil Gravel Content (%) | 31 | 32 | 1 |
| Topsoil Organic Carbon (% weight) | 0.72 | 0.39 | 0.47 |
| Topsoil pH (H2O) | 6.5 | 7.5 | 8 |
| Topsoil CEC (clay) (cmol/kg) | 49 | 51 | 56 |
| Topsoil CEC (soil) (cmol/kg) | 12 | 16 | 13 |
| Topsoil Base Saturation (%) | 87 | 100 | 100 |
| Topsoil TEB (cmol/kg) | 10.4 | 16 | 13 |
| Topsoil Calcium Carbonate (% weight) | 0.2 | 3.1 | 10.9 |
| Topsoil Gypsum (% weight) | 0.1 | 0.1 | 0.2 |
| Topsoil Sodicity (ESP) (%) | 2 | 1 | 3 |
| Topsoil Salinity (ECe) (dS/m) | 0.1 | 0.4 | 0.6 |
| Database ID | 16,347 | 16,348 | 16,349 |
| Subsoil Sand Fraction (%) | - | - | 42 |
| Subsoil Silt Fraction (%) | - | - | 38 |
| Subsoil Clay Fraction (%) | - | - | 20 |
| Subsoil USDA Texture Classification | - | - | loam |
| Subsoil Reference Bulk Density (kg/dm3) | - | - | 1.41 |
| Subsoil Bulk Density (kg/dm3) | - | - | 1.46 |
| Subsoil Gravel Content (%) | - | - | 1 |
| Subsoil Organic Carbon (% weight) | - | - | 0.34 |
| Subsoil pH (H2O) | - | - | 8.1 |
| Subsoil CEC (clay) (cmol/kg) | - | - | 60 |
| Subsoil CEC (soil) (cmol/kg) | - | - | 13 |
| Subsoil Base Saturation (%) | - | - | 100 |
| Subsoil TEB (cmol/kg) | - | - | 13 |
| Subsoil Calcium Carbonate (% weight) | - | - | 11.2 |
| Subsoil Gypsum (% weight) | - | - | 0.4 |
| Subsoil Sodicity (ESP) (%) | - | - | 3 |
| Subsoil Salinity (ECe) (dS/m) | - | - | 0.4 |
| Dominant Soil Group | Associated Soil and Inclusions | ||
| Coverage | SOTWIS | ||
| Soil Mapping Unit | 16,511 | ||
| Dominant Soil Group | WR—Water Bodies | ||
| Sequence | 1 | ||
| Share in Soil Mapping Unit (%) | 100 | ||
| Database ID | 16,444 | ||
| Soil Unit Symbol (FAO 74) | - | ||
| Soil Unit Name (FAO74) | - | ||
| Soil Unit Symbol (FAO 85) | - | ||
| Soil Unit Name (FAO 85) | - | ||
| Soil Unit Symbol (FAO 90) | WR | ||
| Soil unit Name (FAO 90) | Water Bodies | ||
| Topsoil Texture | - | ||
| Reference Soil Depth (cm) | - | ||
| PHASE1 | - | ||
| PHASE2 | - | ||
| Obstacles to Roots (ESDB) (cm) | - | ||
| Impermeable Layer (ESDB) (cm) | - | ||
| Soil Water Regime (ESDB) | - | ||
| Drainage class (0–0.5% slope) | - | ||
| AWC (mm) | - | ||
| Gelic Properties | No | ||
| Vertic Properties | No | ||
| Petric Properties | No | ||
| Topsoil Sand Fraction (%) | - | ||
| Topsoil Silt Fraction (%) | - | ||
| Topsoil Clay Fraction (%) | - | ||
| Topsoil USDA Texture Classification | - | ||
| Topsoil Reference Bulk Density (kg/dm3) | - | ||
| Topsoil Bulk Density (kg/dm3) | - | ||
| Topsoil Gravel Content (%) | - | ||
| Topsoil Organic Carbon (% weight) | - | ||
| Topsoil pH (H2O) | - | ||
| Topsoil CEC (clay) (cmol/kg) | - | ||
| Topsoil CEC (soil) (cmol/kg) | - | ||
| Topsoil Base Saturation (%) | - | ||
| Topsoil TEB (cmol/kg) | - | ||
| Topsoil Calcium Carbonate (% weight) | - | ||
| Topsoil Gypsum (% weight) | - | ||
| Topsoil Sodicity (ESP) (%) | - | ||
| Topsoil Salinity (ECe) (dS/m) | - | ||
| Database ID | 16,444 | ||
| Subsoil Sand Fraction (%) | - | ||
| Subsoil Silt Fraction (%) | - | ||
| Subsoil Clay Fraction (%) | - | ||
| Subsoil USDA Texture Classification | - | ||
| Subsoil Reference Bulk Density (kg/dm3) | - | ||
| Subsoil Bulk Density (kg/dm3) | - | ||
| Subsoil Gravel Content (%) | - | ||
| Subsoil Organic Carbon (% weight) | - | ||
| Subsoil pH (H2O) | - | ||
| Subsoil CEC (clay) (cmol/kg) | - | ||
| Subsoil CEC (soil) (cmol/kg) | - | ||
| Subsoil Base Saturation (%) | - | ||
| Subsoil TEB (cmol/kg) | - | ||
| Subsoil Calcium Carbonate (% weight) | - | ||
| Subsoil Gypsum (% weight) | - | ||
| Subsoil Sodicity (ESP) (%) | - | ||
| Subsoil Salinity (ECe) (dS/m) | - | ||
References
- Ashour, A.; Tawab, E.; Abu-Zaid, S.; AbdAllah, A. A comparative technical study for estimating seeped water from irrigation canals in the Middle Egypt (Case study: El-Sont branch canal network). Ain Shams Eng. J. 2023, 14, 101875. [Google Scholar] [CrossRef]
- Ahram Online. Egypt Rehabilitates over 3000 km of Irrigation Canals: Minister. 2021. Available online: https://english.ahram.org.eg/News/438280.aspx (accessed on 8 November 2021).
- Elrazek, E.M. The economic role of the national project to slow down the main and sub canals and irrigation channels in mitigating the negative effects of the renaissance dam. J. Agric. Econ. Soc. Sci. 2021, 12, 303–311. [Google Scholar] [CrossRef]
- El Nour, S.; Elaydi, H. Thirst revolution: Practices of contestation and mobilisation in rural Egypt. Contemp. Levant 2021, 6, 169–184. [Google Scholar] [CrossRef]
- Mowafy, H.M. Seepage Losses in Ismailia Canal. In Proceedings of the Sixth International Water Technology Conference (IWTC), Alexandria, Egypt, 23–25 March 2001; pp. 195–211. [Google Scholar]
- Bakry, M.F.; Awad, A.A. Practical Estimation of Seepage Losses along Earthen Canals in Egypt. Water Resour. Manag. 1997, 11, 197–206. [Google Scholar] [CrossRef]
- Mahesh, M.K.; Panke, R.A.; Hangargekar, P.A. Seepage Losses Through Canals & Minors. Int. J. Eng. Res. Technol. 2013, 2, 1125–1134. [Google Scholar]
- Adnan, T.A.; Khan, K.S.; Laghari, M. Relationship between Seepage and Discharge for Kabul River in District Nowshera. Pak. J. Agric. Agric. Eng. Vet. Sci. 2015, 31, 249–259. [Google Scholar]
- Eshetu, B.D.; Alamirew, T. Estimation of Seepage Loss in Irrigation Canals of Tendaho Sugar Estate, Ethiopia, Eshetu and Alamirew. Irrig. Drain. Syst. Eng. 2018, 7, 2–5. [Google Scholar]
- Leigh, W.E. Evaluation of Methods for Predicting Seepage Loss Rates for the Hard-Lined Irrigation Canal of the Lower Rio Grande Valley of Texas. Master’s Thesis, University of Texas, A&M University, College Station, TX, USA, 2014. [Google Scholar]
- Dolatkhah, S.; Kazemiazar, F.; Deljou, P.; Nourmand, B. Simulation of Seepage from Earthen Canals of Moghan Irrigation and Drainage Network Using Seep/w Model. Bull. Environ. Pharmacol. Life Sci. 2015, 4, 430–435. [Google Scholar]
- Vivekanand, I.; Chandan, R.; Shashank, S.S. Determination of Canal Seepage Loss in Arrah Main Canal: A Case Study. Irrig. Drain. 2021, 3, 1–9. [Google Scholar]
- Liu, S.H.; Wang, W.Z.; Makito, I.; Tetsuo, K. Estimating the Evaporation from Irrigation Canals in Northwestern China Using the Double-Deck Surface Air Layer Model. Adv. Meteorol. 2016, 2016, 3670257. [Google Scholar] [CrossRef]
- El-Enany, M.A.; El-Alfy, K.S.; Sobeih, M.F.; Armanious, S.D.; Gergis, E.S. Modification of the Improved Irrigation System in the Old Lands in Egypt. Mansoura Eng. J. 2004, 29, 21–45. [Google Scholar] [CrossRef]
- Hanks, R.J. Model for Predicting Plant Yield as Influenced by Water Use. Agron. J. 1974, 66, 660–665. [Google Scholar] [CrossRef]
- Paul, K.K.; Gylan, L.D.; Nelton, O.S. Chapter 2: Irrigation Water Requirements. In National Engineering Handbook; United States Department of Agriculture, Soil Conservation Service: Washington, DC, USA, 1993. [Google Scholar]
- Jensen, M.E.; Burman, R.D.; Allen, R.G. Evapotranspiration and Irrigation Water Requirements; ASCE: New York, NY, USA, 1990. [Google Scholar]
- Abu-Zaid, T.S.; Sabery, M. A New Approach for Water Allocation Scheduling in Irrigation Open Channels (Case Study: Al Maanna Main Canal, and Its Branches). J. Eng. Sci. Assiut Univ. Fac. Eng. 2021, 49, 354–377. [Google Scholar] [CrossRef]
- Arab Al Awamer Weather Station (AAWS). Meteorological Data of Abnoub Cropped Area during the Period from 2014 to 2019 as Documented in the Arab Al Awamer Weather Station; AAWS: Assiut, Egypt, 2020. [Google Scholar]
- Allen, G.R.; Pereira, L.S.; Raes, D.; Smith, M. Crop Evapotranspiration: Guidelines for Computing Crop Water Requirements; FAO: Rome, Italy, 1998; Number 56; Available online: https://www.fao.org/3/x0490e/x0490e00.htm (accessed on 15 July 2023).
- MWRI. Ministry of Water Resources and Irrigation; Assiut Department: Assiut, Egypt, 2020. [Google Scholar]


| Reference | The Study | Country | Major Findings |
|---|---|---|---|
| [5] | Seepage losses from Al Ismailia canal using empirical and analytical formulas. | Egypt | Minimum seepage losses occurred from reach 1 and maximum seepage losses occurred from reach 4. |
| The maximum seepage losses from reach 2 are 0.5753 (m3s−1km−1), and maximum seepage losses from reach 3 are 0.645 (m3s−1km−1). | |||
| [6] | Seepage losses from two main conveyance canals (Port Said and Suez canals). | Egypt | Developed four equations based on the inflow–outflow method. The relations are applicable for canals having discharges ranging between 2 and 20 (m3/s): ; ; ; ; where: S—seepage losses (m3s−1km−1); Q—discharge (m3s−1); d—water depth (m); P—wetted perimeter (m). |
| [7] | Seepage losses from canals and minor canals in Paithan Left Bank Canal and Lassina Left Bank Canal. | Pakistan | Average seepage losses from lined and unlined canals were 0.836 and 7.063 (cumec/Mm2), respectively. |
| Average seepage losses from lined and unlined minor canals were 3.01 and 4.93 (cumec/Mm2), respectively. | |||
| [8] | Seepage losses from Kabul River in Nowshera District. | Afghanistan | Developed mathematical relationships between seepage and discharge: Linear solution: S = 0.00024Q + 0.298; Logarithmic solution: S = 0.294 ln (Q) − 1.453; Power solution: S = 0.018Q0.494; where: S—seepage losses (m3s−1km−1); Q—discharge (m3s−1). |
| [9] | Seepage losses from irrigation canals in Tendaho Sugar Estate. | Ethiopia | Average seepage losses were 0.55% per 100 m and 0.84% per 100 m from lined and unlined primary canals, respectively. |
| Formula Name | Seepage (S) | Factors | Units |
|---|---|---|---|
| Mortis 1 | S = | Clay: C = 0.34. Sand: C = 2.2 | American |
| Moleth–Worth and Yennidunia 1 | S = | Clay: C = 0.0015. Sand: C = 0.003 | SI |
| Indian 1 | S = | C = (1.1: 1.8). a = Area of wetted perimeter (million ft2) | American |
| Pakistani 1 | ----- | American | |
| Davis–Wilson 2 | C = (1: 70) depends on bed material | SI | |
| Inghum 3 | S = | C = (1.5: 5.5) | SI |
| Offengenden 4 | α | (α, β) = (0.7, 0.3), (1.9, 0.4) and (3.4, 0.5) for low, medium, and high permeable soil, respectively | SI |
| Nazeer Ahmed 5 | ----- | SI |
| Reaches of Al Maanna Canal | Branches of Al Maanna Canal | ||||||||||
|---|---|---|---|---|---|---|---|---|---|---|---|
| No. | Beginning | End | Length | Area Served | Designed Discharge * | Location of Off-Taking Branches | Branches | Length | Area Served | Measured Discharge * | |
| Direct Irrigation from Al Maanna Canal | Branches of Al Maanna Canal | Secondary Branches | |||||||||
| Km | Km | Km | Feddan | Feddan | m3/s | Km | Km | Feddan | m3/s | ||
| 1 | 0.0000 | 10.45 | 10.450 | zero | zero | 19.34 | |||||
| 2 | 10.450 | 16.45 | 6.0000 | 1140 | 4850 | 21.79 | 10.500 | Al Maanna Side | 5.827 | 1000 | 2.05 |
| 10.500 | Al Hammam | 9.000 | 3400 | 4.39 | |||||||
| 1.0000 | Arab Moter | 2.000 | 600 | 1.45 | |||||||
| 3.0000 | Arab Al Atawla | 2.400 | 500 | 1.65 | |||||||
| 6.3000 | Zafaran | 2.300 | 400 | 1.34 | |||||||
| 6.9400 | Al Taweel | 2.400 | 500 | 2.92 | |||||||
| 12.500 | Shew | 2.300 | 450 | 1.26 | |||||||
| 3 | 16.450 | 23.06 | 6.6100 | 868 | 2680 | 14.65 | 16.500 | East Al Awamer | 0.670 | 400 | 0.04 |
| 16.500 | West Al Awamer | 0.800 | 200 | 1.38 | |||||||
| 17.800 | North Al Awamer | 1.400 | 780 | 1.93 | |||||||
| 19.800 | Deir Shew | 1.000 | 400 | 0.50 | |||||||
| 21.800 | East Al Kadadeeh | 1.000 | 400 | 0.74 | |||||||
| 22.800 | Al Hager | 4.200 | 500 | 0.95 | |||||||
| 4 | 23.060 | 26.40 | 3.3400 | zero | 1700 | 8.23 | 23.800 | South Al Gabrawe | 2.200 | 500 | 2.01 |
| 23.800 | Bani Ibraheem | 1.400 | 800 | 1.74 | |||||||
| 0.250 | Bani Ibraheem | 1.350 | 400 | 1.45 | |||||||
| 25.650 | North Al Gabrawe | 1.350 | 400 | 0.81 | |||||||
| 5 | 26.400 | 32.80 | 6.4000 | 562 | 1700 | 7.55 | 26.450 | Aswalem | 1.800 | 700 | 1.93 |
| 27.600 | Alam Aldeen | 1.600 | 500 | 0.90 | |||||||
| 28.350 | Al Haraga | 2.100 | 500 | 1.15 | |||||||
| Total | 32.800 | 2570 | 10,930 | 47.097 | 10,930 | ||||||
| 13,500 | |||||||||||
| Equation | Units | Clay | Clay + Silt | Sand |
|---|---|---|---|---|
| Molesworth and Yennidunia (Egyptian) | m3/s | 0.0015 | 0.0026 | 0.003 |
| Molesworth and Yennidunia (Analytical) | m3/s | 0.375 | 0.56 | 0.75 |
| Moritz | ft3/s | 0.41 | 0.53 | 0.66 |
| Davis and Wilson | ft3/s | 12 | 18 | 25 |
| Indian | ft3/s | 1.1 | 1.4 | 1.8 |
| Ingham | m3/s | 1.5 | 3 | 5.5 |
| Month | Temperature (T) | RH | Ep | Wind Speed | SH/Day | ||
|---|---|---|---|---|---|---|---|
| Max. | Min. | Avg. | |||||
| °C | % | mm/Day | km/Hour | ||||
| January | 18 | 6.50 | 22.40 | 60.30 | 2.80 | 16.00 | 08.90 |
| February | 22.5 | 11.20 | 26.10 | 52.60 | 3.20 | 17.30 | 9.70 |
| March | 25 | 14.20 | 30.50 | 42.90 | 4.40 | 19.80 | 9.90 |
| April | 29 | 17.10 | 35.10 | 36.50 | 6.40 | 21.30 | 10.30 |
| May | 32 | 22.00 | 38.10 | 35.10 | 6.60 | 20.30 | 11.40 |
| June | 36 | 24.90 | 40.70 | 37.40 | 6.90 | 21.00 | 12.30 |
| July | 37 | 25.30 | 39.10 | 41.50 | 7.40 | 19.50 | 12.20 |
| August | 34.5 | 24.80 | 40.30 | 40.70 | 8.00 | 19.80 | 11.90 |
| September | 29 | 23.80 | 38.50 | 46.20 | 7.00 | 21.70 | 10.80 |
| October | 29 | 20.90 | 33.00 | 51.30 | 5.70 | 19.20 | 10.00 |
| November | 27 | 13.20 | 27.00 | 54.70 | 5.00 | 15.20 | 09.40 |
| December | 22.5 | 9.00 | 23.20 | 63.20 | 3.10 | 16.80 | 09.00 |
| Reaches of Al Maanna Canal | Branches of Al Maanna Canal | ||
|---|---|---|---|
| Reach No. | Area of Weeds (Feddan) | Branches | Area of Weeds (Feddan) |
| Secondary Branches | |||
| Reach 1 | 37.17 | ||
| Reach 2 | 20.91 | Al Maanna Side | 6.91 |
| Al Hammam | 10.21 | ||
| Arab Moter | 3.80 | ||
| Arab Al Atawla | 4.90 | ||
| Zafaran | 6.66 | ||
| Al Taweel | 2.48 | ||
| Shew | 3.22 | ||
| Reach 3 | 24.39 | East Al Awamer | 0.66 |
| West Al Awamer | 0.92 | ||
| North Al Awamer | 1.09 | ||
| Deir Shew | 1.26 | ||
| East Al Kadadeeh | 1.31 | ||
| Al Hager | 4.70 | ||
| Reach 4 | 11.62 | South Al Gabrawe | 1.77 |
| Bani Ibraheem | 0.65 | ||
| Bani Ibraheem | 2.12 | ||
| North Al Gabrawe | 2.03 | ||
| Reach 5 | 22.07 | Aswalem | 1.82 |
| Alam Aldeen | 2.09 | ||
| Al Haraga | 4.01 | ||
| Total | 116.16 | 62.61 | |
| 178.77 Feddan | |||
| Reach | Costs of Bed Dredging | Costs of Weeds’ Removal | ||||||
|---|---|---|---|---|---|---|---|---|
| Reach No. | Reach Length | Fill Area | Costs/m3 | Total Costs | Designed Bed Width | Covered Length of Weeds | Costs/ Km | Total Costs |
| m | m2 | EGP * | L.E. | m | Km | EGP * | EGP | |
| {1} | {2} | {3} | {4} = {1} × {2} × {3} | {5} | {6} | {7} | {8} = {6} × {7} | |
| Reach 1 | 10,450 | 39.030 | 8.00 | 3,262,908 | 10.00 | 7.80595 | 5000 | 39,029.75 |
| Reach 2 | 6000 | 15.380 | 738,240 | 7.50 | 4.87872 | 24,393.60 | ||
| Reach 3 | 6610 | 15.590 | 824,399.2 | 6.00 | 5.73967 | 28,698.35 | ||
| Reach 4 | 3340 | 7.560 | 202,003.2 | 4.00 | 4.06560 | 20,328.00 | ||
| Reach 5 | 6400 | 5.400 | 276,480 | 3.00 | 6.17971 | 30,898.55 | ||
| Total | 82.960 | 5,304,030 | 28.66965 | 143,348.30 | ||||
| Al Maanna Canal Branches | Length of Branch | Costs of Bed Dredging | Costs of Weed Removal | ||||
|---|---|---|---|---|---|---|---|
| Fill Area | Costs/m3 | Total Costs | Covered Length of Weeds | Costs/Km | Total Costs | ||
| Branches | m | m2 | EGP * | EGP | Km | EGP * | EGP |
| Secondary Branches | {1} | {2} | {3} | {4} = {1} × {2} × {3} | {5} | {6} | {7} = {5} × {6} |
| Al Maanna Side | 5827 | 0.852775 | 8.00 | 39,752.96 | 5.277 | 5000 | 26,385 |
| Al Hammam | 9000 | 1.834167 | 132,060 | 9 | 45,000 | ||
| Arab Moter | 2000 | 1.783 | 28,528 | 1.9 | 9500 | ||
| Arab Al Atawla | 2400 | 0.8625 | 16,560 | 2.400 | 12,000 | ||
| Zafaran | 2300 | 1.493478 | 27,480 | 2.295 | 11,475 | ||
| Al Taweel | 2400 | 1.455 | 27,936 | 2.400 | 12,000 | ||
| Shew | 2300 | 1.453043 | 26,735.99 | 2.299 | 11,495 | ||
| East Al Awamer | 670 | 1.022687 | 5481.602 | 0.660 | 3300 | ||
| West Al Awamer | 800 | 1.5275 | 9776 | 0.800 | 4000 | ||
| North Al Awamer | 1400 | 2.315714 | 25,936 | 1.400 | 7000 | ||
| Deir Shew | 1000 | 1.1244 | 8995.2 | 0.998 | 4990 | ||
| East Al Kadadeeh | 1000 | 1.392 | 11,136 | 1.000 | 5000 | ||
| Al Hager | 4200 | 1.192143 | 40,056 | 4.187 | 20,935 | ||
| South Al Gabrawe | 2200 | 1.319318 | 23,220 | 2.197 | 10,985 | ||
| Bani Ibraheem | 1400 | 1 | 11,200 | 1.400 | 7000 | ||
| Bani Ibraheem | 1350 | 1.044074 | 11,276 | 1.350 | 6750 | ||
| North Al Gabrawe | 1350 | 1.549259 | 16,732 | 1.343 | 6715 | ||
| Aswalem | 1800 | 1.995556 | 28,736.01 | 1.800 | 9000 | ||
| Alam Aldeen | 1600 | 1.860375 | 23,812.8 | 1.463 | 7315 | ||
| Al Haraga | 2100 | 1.068571 | 17,951.99 | 2.100 | 10,500 | ||
| Total | 28.14556 | 533,362.6 | 46.269 | 231,345 | |||
Disclaimer/Publisher’s Note: The statements, opinions and data contained in all publications are solely those of the individual author(s) and contributor(s) and not of MDPI and/or the editor(s). MDPI and/or the editor(s) disclaim responsibility for any injury to people or property resulting from any ideas, methods, instructions or products referred to in the content. |
© 2023 by the authors. Licensee MDPI, Basel, Switzerland. This article is an open access article distributed under the terms and conditions of the Creative Commons Attribution (CC BY) license (https://creativecommons.org/licenses/by/4.0/).
Share and Cite
Ashour, M.A.; Abdel Nasser, M.S.; Abu-Zaid, T.S. Field Study to Evaluate Water Loss in the Irrigation Canals of Middle Egypt: A Case Study of the Al Maanna Canal and Its Branches, Assiut Governorate. Limnol. Rev. 2023, 23, 70-92. https://doi.org/10.3390/limnolrev23020005
Ashour MA, Abdel Nasser MS, Abu-Zaid TS. Field Study to Evaluate Water Loss in the Irrigation Canals of Middle Egypt: A Case Study of the Al Maanna Canal and Its Branches, Assiut Governorate. Limnological Review. 2023; 23(2):70-92. https://doi.org/10.3390/limnolrev23020005
Chicago/Turabian StyleAshour, Mohamed A., Mahmoud S. Abdel Nasser, and Tarek S. Abu-Zaid. 2023. "Field Study to Evaluate Water Loss in the Irrigation Canals of Middle Egypt: A Case Study of the Al Maanna Canal and Its Branches, Assiut Governorate" Limnological Review 23, no. 2: 70-92. https://doi.org/10.3390/limnolrev23020005
APA StyleAshour, M. A., Abdel Nasser, M. S., & Abu-Zaid, T. S. (2023). Field Study to Evaluate Water Loss in the Irrigation Canals of Middle Egypt: A Case Study of the Al Maanna Canal and Its Branches, Assiut Governorate. Limnological Review, 23(2), 70-92. https://doi.org/10.3390/limnolrev23020005