Abstract
This paper introduces a new extension of exponentiated standard logistic distribution. Some important statistical properties of the novel family of distributions are discussed. A simulation study is also conducted to observe the behavior of the estimated parameter using several estimation methods. The adaptability as well as the flexibility of the new model is checked through two real-life applications. A comprehensive financial risk assessment is conducted using multiple actuarial risk measures: Peaks Over Random Threshold Value-at-Risk, Value-at-Risk, Tail Value-at-Risk, the risk-adjusted return on capital and the Mean of Order P. These indicators offer a nuanced view of risk by capturing different aspects of tail behavior, which are critical in understanding potential extreme losses. These risk indicators are applied to analyze actuarial financial claims data, providing a robust framework for assessing financial stability and decision-making in the face of uncertainty.
Keywords:
Bi-modality; skew logistic; financial claims data; mean of order P; Value-at-Risk; peaks over a random threshold Value-at-Risk MSC:
35A01; 65L10; 65L12; 65L20; 65L70
1. Introduction
The logistic (L) distribution, created but not named by Poisson in 1824, is an important continuous probability distribution. The L distribution resembles the normal distribution in shape but has heavier tails (higher kurtosis). To improve the fit of the L model, many generalized types of the L distribution have been proposed.
Despite the introduction of numerous new distributions, limited attention has been given to those accommodating multiple modes. Some examples of distributions which allows the fitting of data with at most two modes include the alpha skew normal [1], alpha skew logistic [2], and bimodal tanh skew normal [3]. Distributions developed for up to three modes include the alpha beta skew logistic [4], generalized alpha beta skew normal [5], trimodal skew logistic [6], flexible alpha skew normal [7], flexible skew logistic [8], and others.
The L distribution is widely used in finance, economics, and insurance for modeling heavy-tailed data. It captures market volatility, financial risks, and extreme price changes. In insurance, it helps assess large claim sizes and extreme losses, aiding in premium calculation and reserve management (see [9,10]). We suggest a novel L extension specifically designed for financial claims data, motivated by its extensive usage.
In order to improve risk assessment in areas where existing models are inadequate, this research presents a novel logistic distribution that better captures severe market changes. We propose an economic risk estimator based on the PORT-VaR framework, incorporating adaptive threshold selection for greater accuracy. We evaluate the effectiveness of the model in balancing financial and economic objectives using MOO analysis. Our approach enhances risk management and decision-making in volatile markets.
Over the last five years, researchers have increasingly focused on insurance and financial risk analysis, utilizing various statistical tools and measures. Key works include [11] on threshold effects in asset allocation and [12] on TV premiums for elliptical portfolios, extending risk measures beyond VaR. Recent contributions include functional extensions to PORT analysis [13] and innovative risk models like the XGamma extension [14] and Bayesian risk frameworks [15]. Other advances, such as the extended Gompertz model [16] and new loss probability models [17], enhance risk assessment using MOO and other advanced methods.
This article addresses a new extension of the exponentiated standard logistic distribution [18], which demonstrates flexibility in fitting data with up to two modes. The article discusses important mathematical properties of the new distribution and provides graphical visualizations. Furthermore, the adaptability and utility of the new distribution are assessed using real-life datasets. Additionally, a comprehensive financial risk assessment is conducted using multiple actuarial risk measures, such as Peaks Over Random Threshold Value-at-Risk (PORT-VaR), Value-at-Risk (VaR), Tail Value-at-Risk (TVaR), the risk-adjusted return on capital (RAROC) and the Mean of Order P (MOO), which offer a nuanced view of risk by capturing different aspects of tail behavior, which are critical in understanding potential extreme losses. Together, these risk indicators are applied to explore and analyze actuarial financial claims data, providing a robust framework for assessing financial stability and decision-making in the face of uncertainty.
2. A New Extended Exponentiated Standard Logistic Distribution
In this section, a novel family of extended exponentiated standard logistic distribution is introduced along with its special cases.
Definition 1.
If X is a random variable, then X is said to follow extended exponentiated standard logistic distribution if its cumulative distribution function (CDF) is given by
where and are two shape parameters. It is denoted as .
Proposition 1.
The probability density function (PDF) of the probability distribution defined in (1) is given by
Some special cases of the distribution are obtained as follows:
- i.
- If , then X has an exponentiated standard logistic distribution [18].
- ii.
- If , then X has a standard logistic distribution.
Again, the PDF of the novel family of distributions is plotted in Figure 1 for different choices of the parameters. From the visualization, it is evident that the PDF is capable of fitting data with up to two modes. Specifically, for a fixed value of b, an increase in the value of a results in a higher peak towards the right tail (see Figure 1a). Moreover, for a fixed b, increasing a may sometimes cause the bimodality to gradually disappear (see Figure 1c). In addition, for certain combinations of a and b, the PDF shows a higher peak towards the left (see Figure 1b). Finally, when , the distribution reduces to the standard logistic distribution, while for , it may exhibit the exponentiated standard logistic form (see Figure 1d). Similarly, the CDF of the new distribution can be plotted in Figure 2 for different choices of the parameters exhibiting both unimodal and bimodal behaviors.
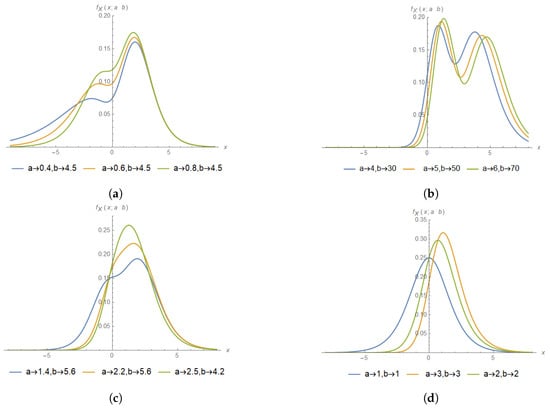
Figure 1.
PDF of with different choices of a and b. (a) PDF with large b and small a values to produce a left tail. (b) PDF with small b and large a values to concentrate the probability mass in support . (c) PDF with moderate a and large b values to concentrate the probability mass between and 5. (d) Moderate values of a and b to concentrate the probability mass around 0.
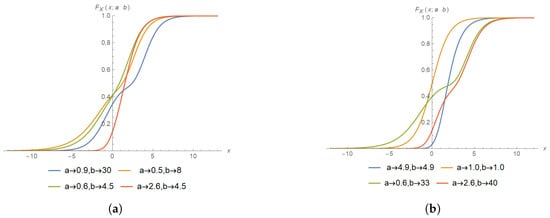
Figure 2.
CDF of distribution for different choices of parameters. (a) CDF in the positive support with large b and small a. (b) CDF concentrated between −5 and 1 in the negative support with small a and b values, and CDF with small a and b values to concentrate the CDF between and 2.
The can be used to depart from the Gaussian distribution with PDF . The similarity measure between our proposal and the is given by [19]
Numerical examination in Mathcad gives . Thus the is the in 96.7%. Some values are presented in Table 1.

Table 1.
Similarity measure between the and . Row I shows values of a when , and row II shows values of b when .
3. Main Properties
3.1. Asymptotics for CDF, PDF and Hazard Rate Function (hrf)
The asymptotics of the CDF, PDF and hrf of as are given by
The asymptotics of the CDF, PDF and hrf of as are given by
These equations show the effect of parameters a and b on the tails of distribution.
3.2. Mixture for CDF and PDF
Using geometric and generalized binomial expansions, we can express the CDF as follows:
Here, denotes the CDF of the standard logistic distribution. Equation (4) illustrates that the CDF of the distribution can be represented as a linear combination of exponentiated standard logistic distributions.
Furthermore, we can derive the PDF of as:
where represents the PDF of the standard logistic distribution, and
3.3. Moments and Incomplete Moments
The n-th order moment of EESL distribution is given by
where . Now, using the Taylor series expansion of the , we get
On the other hand, the n-th order incomplete moment of EESL distribution is given as
where . Now, using the Taylor series expansion of the , for , we get
Similarly, for , the incomplete moment can be evaluated.
3.4. Skewness and Kurtosis
Based on the order (non-central) moments , presented in Section 3.3 and using their relationships with the central moments
we can easily calculate the skewness and kurtosis of the distribution. Figure 3 shows as a function of a for selected b values (left) and as a function of b for selected a values (right). The is an increasing function for , especially for the initial values of the arguments and unimodal for , e.g., . If b increases, decreases. The is unimodal for and inverse-unimodal for , e.g., , . The function is strictly monotonical for the initial values of the arguments.
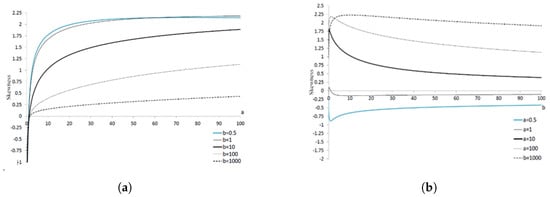
Figure 3.
Skewness of distribution as a function of a for selected b values (a), and as a function of b for selected a values (b).
Figure 4 shows as a function of a for selected b values (right). The is the inverse-bimodal function, e.g., , . If b increases, also increases. The is the unimodal function, e.g., . The and functions are strictly monotonical for the initial values of the arguments. As follows from Malakhov’s inequality [20], we obtain a not less than 1 (see among other series ).
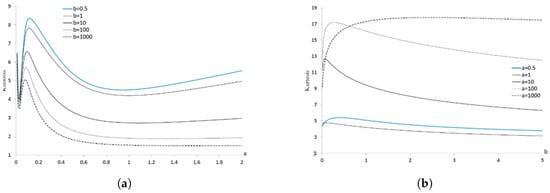
Figure 4.
Kurtosis of distribution as a function of a for selected b values (a), and as a function of b for selected a values (b).
We calculate and for random values of . Figure 5 presents a set of points located in a rectangle . Symbol MP denotes the Malakhov parabola . We obtain .
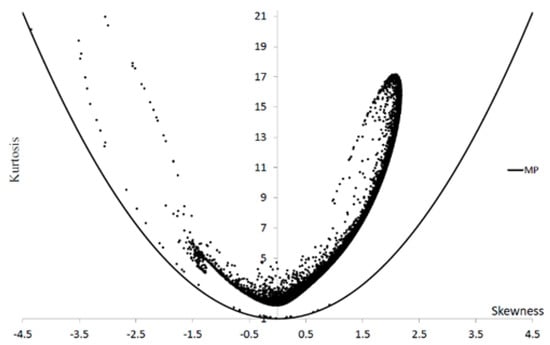
Figure 5.
A variability range of and of distribution.
The analysis of and can be investigated using quantiles, especially when moments do not exist. Quantile alternatives for and are Bowely’s B [21] and Moors’ M [22] measures, respectively, defined as
However, it should be noted that the values of quantile alternative measures differ significantly from classic ones, e.g., for and , we obtain , , and .
3.5. Quantiles for EESL
Let . Then the quantile is a solution of the equation
3.6. Moment-Generating Function
The moment-generating function of EESL distribution is derived here with some related results.
Theorem 1.
The expression for the mgf of EESL distribution is
where is the incomplete beta function.
Proof.
□
Corollary 1.
By inserting instead of t into Equation (8), the characteristic function of EESL distribution can be obtained, and the expression is given as
4. Characterization Results
4.1. Characterizations Based on Two Truncated Moments
This subsection deals with the characterizations of EESL distribution based on a relationship between two truncated moments. As stated in Theorem 2 below, the first characterization makes use of the Theorem of characterizations based on truncated moments provided in [23]. Clearly, the result holds as well when the H is not a closed interval. This characterization is stable in the sense of weak convergence; see [24].
Theorem 2
([23,24]). Let be a given probability space and let be an interval for some ( and are allowed). Let be a continuous random variable with CDF F and let k and h be two real functions defined on H, such that
is defined with some real function η. Assume that k, , and F is twice continuously differentiable and strictly monotone function on the set H. Finally, assume that the equation has no real solution in the interior of H. Then F is uniquely determined by the functions k, h and η, particularly
where the function s is a solution of the differential equation and C is the normalization constant, such that .
Proposition 2.
Let the random variable be continuous,
and for . Then, the density of X is given in (2) if and only if the function η defined in Theorem 2 is
Proof.
Corollary 2.
If is a continuous random variable and is as in Proposition 2, X has the PDF (2) if and only if there exist functions k and η defined in Theorem 2 satisfying the following first-order differential equation
Corollary 3.
The general solution of the above differential equation is
where D is a constant. A set of functions satisfying this differential equation is presented in Proposition 2 with . Clearly, there are other triplets satisfying the conditions of Theorem 2.
4.2. Characterization in Terms of the Reverse Hazard Function
The reverse hazard function, , of a twice-differentiable distribution function, F, is defined as , .
Remark 1
[23,24]. Let be a continuous random variable. The density of X is (2) if and only if the differential equation holds
with the boundary condition .
5. Maximum Likelihood Estimation
In this section, we introduce an extension of EESL distribution, considering the location parameter and scale parameter . This distribution is formulated through the transformation . Subsequently, the PDF of the extended EESL distribution is provided as follows:
where , , , , and . If Y has the PDF and CDF expressed in (10) and (11), respectively, then it is denoted as .
We considered that the most suitable and common method for parameter estimation is the maximum likelihood (ML) method. However, the parameters are also often estimated using other methods, e.g., the ordinary least squares (OLS) [25,26,27,28,29]. A very interesting proposal is using the natural estimation measure, i.e., least absolute weights (LAW). The LAW measure corresponds to the absolute values of the differences between the empirical and theoretical CDFs.
Following this, we delve into the procedure to estimate the parameter vector associated with the PDF . Consider a collection of n independent and identically distributed random variables, denoted as , drawn from the distribution. Subsequently, the log-likelihood equations for this set of four parameters is
Differentiating Equation (12) with respect to the set of parameters, the likelihood equations can be obtained as
where and .
Therefore, by solving the system of equations simultaneously, one can derive the estimates. However, obtaining a direct solution for the normal equations mentioned above is not explicit and a numerical procedure can be implemented in the R software [30].
To obtain the OLS and LAW estimates of the EESL parameters, we minimize the following objective functions, respectively:
where is given by (11).
6. Simulation Study
A simulation analysis is carried out in this section in order to evaluate the performance of the ML, OLS and LAW estimates for the . All calculations were performed in the R software using the fitdistr (for ML) and optim (for OLS and LAW) functions.
A simulation study was performed with samples with three distinct sample sizes (). The samples were drawn from the EESL with , where and . The simulation procedure is sensitive to the initial values, thus these values are equal to the input values of a random number generator using a quantile function.
The estimated statistics are presented in terms of biases and mean square errors (MSEs) of the estimates: where .
From Table 2, Table 3, Table 4, Table 5, Table 6, Table 7, Table 8, Table 9 and Table 10, it can be observed that the ML, OLS and LAW methods effectively estimate the model parameters. The results also shows that when sample size increases, the bias and MSE of the estimates decrease, indicating the asymptotic consistency of the estimates. Moreover, the lowest absolute average of bias and the lowest absolute average of MSE occur for the scale parameter . The MSE of the b parameter for the analyzed method increases with the a parameter values. The lowest average bias and the lowest average MSE are for the ML method.

Table 2.
Part I. Biases and MSEs of estimates obtained by the ML method. Samples of size n were drawn from the .

Table 3.
Part II. Biases and MSEs of the estimates obtained by the ML method. Samples of size n were drawn from the .

Table 4.
Part III. Biases and MSEs of the estimates obtained by the ML method. Samples of size n were drawn from the .

Table 5.
Part I. Biases and MSEs of the estimates obtained by the OLS method. Samples of size n were drawn from the .

Table 6.
Part II. Biases and MSEs of the estimates obtained by the OLS method. Samples of size n were drawn from the .

Table 7.
Part III. Biases and MSEs of the estimates obtained by the OLS method. Samples of size n were drawn from the .

Table 8.
Part I. Biases and MSEs of the estimates obtained by the LAW method. Samples of size n were drawn from the .

Table 9.
Part II. Biases and MSEs of the estimates obtained by the LAW method. Samples of size n were drawn from the .

Table 10.
Part III. Biases and MSEs of the estimates obtained by the LAW method. Samples of size n were drawn from the .
7. Applications
This section examines the flexibility as well as the applicability of the proposed distribution in comparison to other rival models under consideration, such as the Logistic (L), Extended L (EL) [18], Type-I Generalized L (IGL), Type-II GL (IIGL), Type-III GL (IIIGL) [31], Skew L (SL) [32], Alpha Skew L (ASL) [2], Alpha beta skew L (ABSL) [4], Modified SL (MSL) [33] and Exponentiated Exponential L (EEL) [34,35]. The PDFs of the models under consideration are presented in the Appendix B.
The EESL model was compared to the above models using visual techniques (see Figure 6) and numerical measures. The Akaike (AIC), Bayes (BIC), Hannan–Quinn (HQIC) information criteria (IC) and Kolmogorov–Smirnov statistics (KS) were calculated for the ML method, while KS and objective functions (see Equations (13) and (14)) were calculated for the OLS and LAW methods. Recall that the AIC, BIC and HQIC are defined as
where l is the log-likelihood function, n is the sample size and p is the number of model parameters.
All calculations were performed in the R program in two ways. The first way used the fitdistr and optim functions, and the second one used the GenSA function. To avoid local maxima (ML) and minima (OLS, LAW), the optimization procedure was performed times with random values of the initial parameters, which were widely scattered in the parameter space. Because we used two methods to obtain parameter estimates, the final parameter estimates were the better maximizing (see Equation (11)) or minimizing (see Equations (13) and (14)) values.
7.1. Environmental Performance Index Dataset
In this application, the Environmental Performance Index (EPI) dataset with observations which was analyzed previously by [36]. The summary of the data is presented in Table 11.

Table 11.
Summary of EPI dataset.
ML estimates (MLE), log-likelihood function (l), IC and KS values are given in Table 12. OLS estimates (OLSE), KS and objective function (13) values are given in Table 13. LAW estimates (LAWE), KS and objective function (14) values are given in Table 14. Better values are marked in bold. From Table 12, Table 13 and Table 14, it can be observed that the new distribution is more appropriate and better-fitted among other competitors in terms of used numerical measures. KS values are the lowest for the OLS method (except the ASL and MSL models). The adaptability of the ’s PDF can also be observed in Figure 6.

Table 12.
MLE, l, AIC, BIC, HQIC and KS values of models (M) fitted to 163 EPI observations.

Table 13.
OLSE, OLS and KS values of models (M) fitted to 163 EPI observations.

Table 14.
LAWE, LAW and KS values of models (M) fitted to 163 EPI observations.

Figure 6.
Observed frequencies and fitted densities (see the 11 models of Table 14) for EPI dataset. (a) L, EL, IGL, IIGL, IIIGL and EESL models. (b) SL, ASL, ABSL, MSL, EEL and EESL models.
7.2. Measurements of Gauge Length Dataset
The second application considers the measurements of the gauge length dataset reported by [37], previously. The summary of the data is presented in Table 15.

Table 15.
Descriptive statistics.
MLE, l, IC and KS values are given in Table 16. OLSE, KS and objective function (13) values are given in Table 17. LAWE, KS and objective function (14) values are given in Table 18. Better values are marked in bold. From Table 16, Table 17 and Table 18, it can be observed that the new distribution is more appropriate and better-fitted among the other competitors in terms of used numerical measures. KS values are the lowest for the OLS method (except the L, EL and IIIGL models). The adaptability of the ’s PDF can also be observed in Figure 7.

Table 16.
MLE, l, AIC, BIC, HQIC and KS values of models (M) fitted to measurements of gauge lengths.

Table 17.
OLS estimates and OLS and KS values of models (M) fitted to measurements of gauge lengths.

Table 18.
LAW estimates and LAW and KS values of models (M) fitted to measurements of gauge lengths.

Figure 7.
Observed frequencies and fitted densities (see the 10 models of Table 18) for measurements of gauge lengths. (a) L, EL, IGL, IIGL, IIIGL and EESL models. (b) EESL, ASL, ABSL, SL, and L models.
8. Risk Analysis for Financial Claims
8.1. The VaR Indicator
The VaR at a confidence level q for the EESL model is determined by identifying the quantile where the CDF of the EESL distribution equals q. This requires finding the threshold value below which the worst of losses are anticipated, utilizing the CDF formulation of the EESL model. This metric is essential for comprehending and mitigating extreme risk exposures in financial scenarios. The VaR at the confidence level q is defined by the quantile function, such that
which corresponds to the solution of Equation (7). This indicator estimates the maximum potential loss at the specified confidence level, relying on the assumptions and parameters of the selected distribution model. It is important to validate the model’s suitability and precision through historical data analysis and sensitivity assessments.
8.2. The TVaR Indicator
By definition, the TVR of random variable X is given by
where
The integral in (17) can be dealt with using numerical methods to obtain suitable approximate solutions in light of the difficulty of obtaining a closed form. For more applications, see [12].
8.3. MOO Analysis
The MOO analysis is a powerful statistical technique used in finance and risk assessment to study the central tendencies and key features of a dataset by evaluating its moments. This method involves raising each data point to the power of P (where P is a positive integer) and calculating the mean of these transformed values. Originally formalized by [38], the approach provides insights into different facets of the dataset’s distribution. The choice of P, often referred to as MOO, plays a crucial role in determining which moments are being focused on, whether this is the mean, variance, skewness, or higher moments. The selection of P influences how different characteristics of the data are captured, such as tail behavior or extreme values, which can be critical in risk evaluation. As highlighted in the works of [39], varying P allows for a more comprehensive analysis, often applied to multiple values of P (e.g., .) to assess the impact of different moments on the dataset. This multi-order analysis is especially useful in finance, where understanding both central trends and extreme risks is vital for making informed decisions.
8.4. The PORT-VaR Indicator
PORT-VaR is a method used in financial risk analysis, particularly in the context of measuring extreme risks and tail events. It builds upon the concept of Value-at-Risk (VaR), which quantifies the potential loss in value of a portfolio over a defined period for a given confidence interval. The steps to calculate PORT-VaR are as follows:
- Gather historical return data for the asset or portfolio being analyzed.
- Select an appropriate threshold level above which you will analyze exceedances. This could be based on historical percentiles or a predefined value.
- Filter the return data to identify only those returns that exceed the selected threshold.
- Fit an appropriate distribution to the exceedances. Common choices include generalized Pareto distribution (GPD) or other heavy-tailed distributions. A heavy-tailed distribution is a probability distribution whose tails decay more slowly than an exponential distribution. Formally, this can be defined in several equivalent ways, depending on the context and the specific properties of interest. One definition is as follows.Definition 2.If is the CDF of a random variable X and let represents the survival function (the probability that X exceeds x). A distribution is said to have a heavy tail ifThis means that the tail of the distribution decays more slowly than any exponential function as . See [40,41] for more details.
- Using the fitted model, estimate the VaR at the desired confidence level. This will provide an estimate of potential losses that could occur beyond the chosen threshold.
Financial institutions can use PORT-VaR to assess the risk of large losses and implement strategies to mitigate those risks. It can assist in meeting regulatory requirements for capital reserves against extreme loss scenarios; see [16,42] for more details.
9. RAROC Analysis
According to [43], RAROC is a financial performance metric that assesses returns on a risk-adjusted basis. It measures how much return an investment yields in relation to the risk involved, with risk typically quantified using VaR. The formula for RAROC is
where is the the expected return and is the expected loss. A high RAROC indicates a strong risk–return profile, where the expected return is substantial compared to the risk taken (low VaR). Conversely, a low RAROC suggests that the expected return is insufficient relative to the risk, implying that the investment or portfolio may not offer adequate compensation for the risk involved.
10. MOO Analysis for Financial Claims
Table 19 presents the MOO analysis under the P parameters ranging from 1 to 5, with several metrics such as true mean value (TMV), MOO, mean squared error (MSE), and bias. Each of these metrics plays a significant role in evaluating the financial claims dataset, particularly in managing risk, optimizing decision-making, and improving financial predictions. The values of P (1 to 5) represent different levels of optimization for the objective function used in the analysis. As P increases, the focus shifts from a simpler risk assessment towards more complex and comprehensive risk evaluation.

Table 19.
MOO assessment under for the financial claims.
The value TMV = 2702.571 represents the true mean of the distribution, emphasizing the central tendency of financial claims. It serves as a baseline against which other metrics, like MOO, can be compared. MOO values (340, 463.5, 518.6667, 628, 714.2) provide insight into how the mean value changes as the order P increases. These values represent averages that incorporate progressively higher orders of risk assessment. The increasing trend suggests higher mean values at higher P, signaling a potential rise in the magnitude of financial claims under extreme conditions. MSE values (5581744, 5013441, 4769440, 4303847, 3953621) indicate the precision of the model’s predictions. A lower MSE implies better predictive accuracy. The decreasing MSE across P shows that increasing the order P improves the model’s accuracy in forecasting financial claims, likely through better handling of complex interactions and risk factors. Bias values (2362.571, 2239.071, 2183.905, 2074.571, 1988.371) represent the difference between the predicted and actual claim values. A decreasing bias across increasing P suggests that higher-order models provide more accurate predictions, reducing systematic error in risk estimation. Moreover, Figure 8 and Figure 9 visually corroborate the numerical results detailed in Table 19.
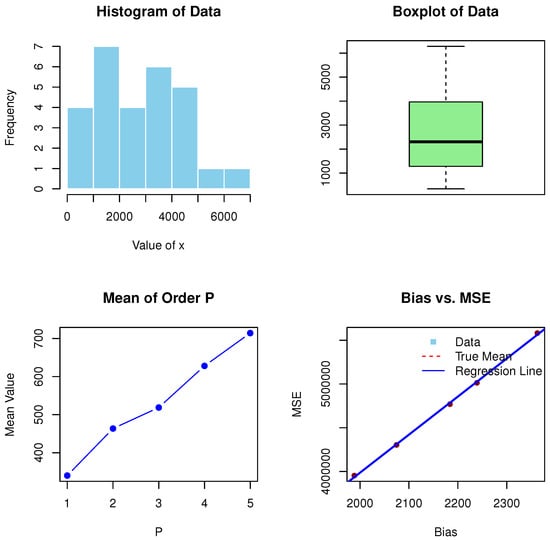
Figure 8.
Histogram, boxplot, MOOP, MSE and bias for the active repair times of Boston house price data.
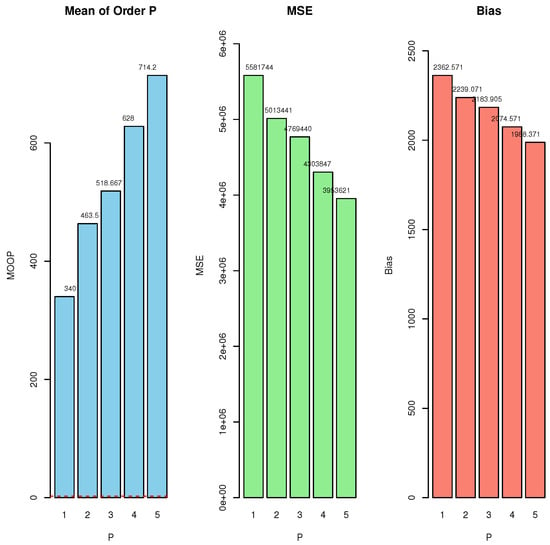
Figure 9.
Barplots of MOOP, MSE and bias for the active repair times of Boston house price data.
The increasing MOO values suggest that as P rises, the model becomes more sensitive to extreme financial claims. Financial institutions should pay attention to this trend and ensure that higher tail risks are adequately accounted for when making risk management decisions. The consistent improvement in MSE and bias with higher P demonstrates that models capturing more information about tail events perform better. Financial institutions should adopt higher-order models for more accurate predictions of claims, particularly in risk-prone sectors or periods of financial instability. Insurance or risk-based pricing should be adjusted to reflect the insights provided by higher P models. Given the growing MOO values, financial institutions may need to raise premiums or fees to account for the heightened risk of extreme claims. The reduction in bias across higher P values shows that more complex models result in more reliable predictions. Institutions should focus on using higher-order risk models to minimize prediction errors and ensure that extreme risks are not underestimated.
11. PORT-VaR Estimator for Financial Claims
Table 19 presents various risk measures for financial claims under CLs, with a focus on VaR, TVaR and PORT-VaR. The analysis evaluates the tail risk exposure and the number of extreme claims exceeding specified thresholds. The VaR measures the maximum potential loss at a given confidence level (CL). As the CL increases, VaR also rises, reflecting more extreme risk scenarios. The VaR at CL = 55% is 3080.75, meaning there is a 55% chance that financial losses will not exceed this amount. The VaR at CL = 95% is 4908.1, implying that in the worst 5% of cases, losses could exceed this amount. The TVaR provides the average loss given that the VaR threshold is breached, offering a more comprehensive view of tail risk. As expected, TVaR consistently exceeds VaR across all CLs, indicating that when extreme losses occur, they are substantially larger than the VaR values. The TVaR at CL = 55% is 4176.615, while the TVaR at CL = 95% is 5692.5, highlighting the increasing magnitude of losses when risk levels rise. The “N. of PORT” column shows the number of claims exceeding the threshold for PORT-VaR analysis. As the CL rises, the number of extreme claims considered also increases. At CL = 55%, 15 claims are above the threshold, and this number rises to 26 at CL = 95%. The minimum (Min.), first quartile (1st Qu.), Median, ExV, third quartile (3rd Qu.) and maximum (Max) sections provide summary statistics for the claims exceeding the threshold. For CL = 55%, the median claim is 3932, while for CL = 95%, it drops to 2768, reflecting a shift in the distribution of extreme claims as the threshold increases. The maximum claim across all CLs remains constant at 6283, indicating that the largest claim is an extreme outlier, but still relevant for high confidence levels. Figure 10 provides six histograms for the four CLs for extreme financial claims. Figure 11 shows the density plot of peaks across different thresholds.
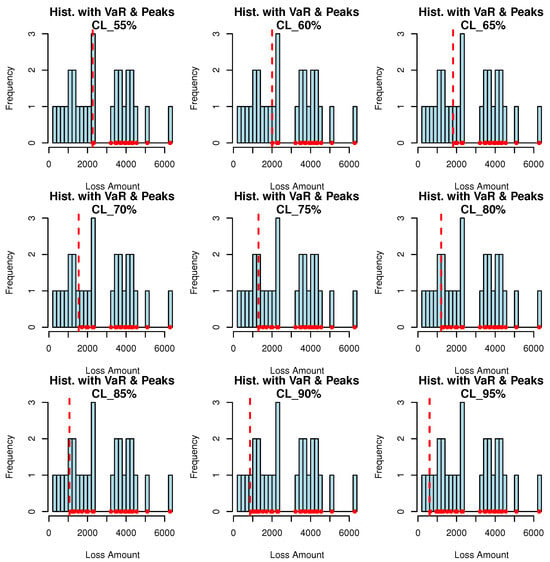
Figure 10.
PORT-VaR analysis for extreme claims.
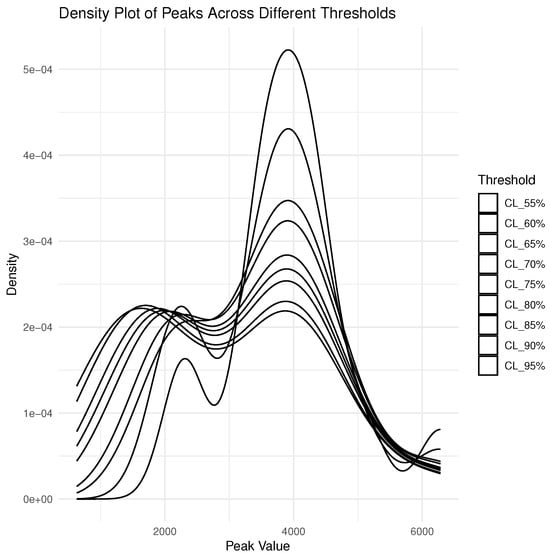
Figure 11.
Density plot of peaks above the VaR.
As both the VaR and TVaR increase with higher CLs, this indicates that potential losses could be substantial in adverse scenarios. Financial institutions should pay attention to the TVaR values, especially at higher CLs, as they represent the expected losses beyond the VaR. For instance, at CL = 95%, the TVaR is significantly higher (5692.5) than the VaR (4908.1), signaling that extreme losses can be much worse than initially estimated by VaR. Therefore, institutions should increase their capital reserves to cover not only the VaR but also potential losses captured by the TVaR, particularly at higher CLs. This is crucial for risk mitigation during periods of financial instability. The increasing number of claims exceeding the threshold (N. of PORT) as the CL rises shows that the tail of the distribution becomes thicker with higher confidence levels. This is supported by the summary statistics, where the ExV (expected value) decreases with rising CL, indicating that claims in the tail are more dispersed and less concentrated at higher levels. Then, financial institutions may want to explore reinsurance or hedging strategies, especially for portfolios exposed to high tail risks. The larger number of extreme claims beyond the threshold (at higher CLs) could overwhelm reserves if not adequately protected against.
As the TVaR increases significantly with the CL, the cost of insuring against extreme losses also rises. For example, the difference between TVaR at CL = 55% (4176.615) and CL = 95% (5692.5) is substantial, indicating the need to account for these extreme events when pricing risk-related products. Hence, insurance premiums and risk-based fees should be adjusted upward as the CL increases. Higher confidence levels reveal the potential for larger and more frequent extreme claims, which should be reflected in the cost structure for clients. The maximum claim value remains constant at 6283 across all CLs, suggesting that in the worst-case scenario, the institution could face this large claim regardless of the confidence level. This persistent risk points to the need for robust strategies to handle extreme outlier events. Therefore, institutions should conduct regular stress tests and extreme scenario analysis based on the maximum claim (6283) to ensure that they are prepared for catastrophic losses. Developing contingency plans for such outlier events will enhance resilience. The detailed breakdown of claims beyond the threshold (e.g., median, quartiles) provides valuable insights for risk reporting. Investors and regulators are increasingly concerned about transparency in how institutions manage extreme risk exposures. Then, institutions should use these results to communicate their risk exposure clearly to stakeholders. The use of advanced metrics like TVaR and PORT-VaR can demonstrate a more proactive approach to risk management, boosting investor confidence and regulatory compliance.
12. RAROC Results for the Financial Claims
RAROC is a crucial financial metric that evaluates the performance of financial claims relative to the risk taken. By defining RAROC as outlined in (18), we gain important insights into the risk–return profile of these claims. Values greater than 1 indicate that the expected value of returns surpasses the associated risk (as measured by VaR). For instance, at a 55% confidence level, a RAROC of 1.27 suggests that for every unit of risk taken, the expected return is 1.27 units. This indicates a well-compensated financial claim, appealing to risk-averse stakeholders.
High RAROC values may encourage firms to allocate more resources to these claims, enhancing overall profitability while maintaining acceptable risk levels. Ratios near 1, such as at the 65% confidence level (RAROC = 1.00), means a balance where expected returns align with the risks undertaken. This could indicate a stable environment for financial claims, though it might also imply limited growth opportunities. Investors should assess whether this risk–return balance aligns with their objectives.
Ratios below 1, especially at higher confidence levels (e.g., 95% with RAROC = 0.59), suggest that expected returns do not sufficiently compensate for the risks involved. This serves as a warning for investors, indicating that capital might be better deployed elsewhere or that the financial claim needs reevaluation for potential downsides. A declining trend in RAROC ratios (e.g., from 1.27 at 55% to 0.59 at 95%) underscores increasing risk without corresponding returns, necessitating a robust risk management strategy to mitigate potential losses.
Financial firms should prioritize financial claims with higher RAROC, reflecting better risk-adjusted returns. This approach optimizes capital allocation and improves overall performance. Regular assessment of RAROC enables proactive management of risks associated with financial claims, allowing for strategic adjustments based on evolving market conditions. Understanding RAROC can also support compliance with regulatory requirements by ensuring that capital reserves are adequate to cover potential risks, ultimately bolstering financial stability. High RAROC can enhance a firm’s reputation among investors, potentially leading to better access to capital and more favorable financing terms. Using RAROC as a framework for assessing the risk–return dynamics of financial claims provides a comprehensive view of performance. High ratios indicate strong performance and justify capital allocation, while lower ratios necessitate reevaluation of strategies. As market conditions change, continuous monitoring of these metrics is essential for maintaining financial performance and effectively managing risk.
Figure 12 presents heat maps that illustrate the RAROC analysis for extreme financial claims. These visualizations provide a detailed overview of the relationship between various confidence levels and key financial metrics, including VaR, and RAROC itself. The heat maps enable a quick assessment of how RAROC varies across different scenarios, highlighting areas of higher risk and potential return. This analysis is crucial for understanding the risk-adjusted performance of financial assets under extreme conditions, assisting in better decision-making and risk management strategies.
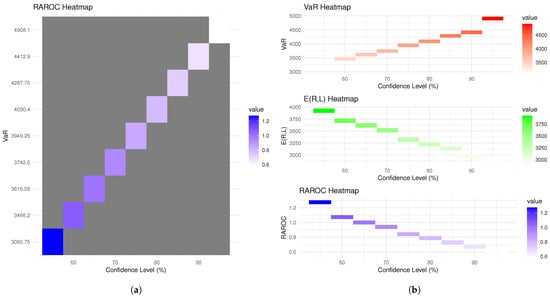
Figure 12.
Heat maps for the RAROC analysis of extreme financial claims about (a) the relationship between various confidence levels and key financial metrics, (b) VaR, and RAROC itself.
13. Conclusions
This article introduced a new extension of the exponentiated standard logistic distribution, expanding on the traditional model with enhanced flexibility to better capture the behavior of complex datasets. Some important statistical properties of this novel family of distributions are thoroughly discussed, accompanied by graphical presentations to visually demonstrate its characteristics. Furthermore, the paper provides a detailed characterization of the new distribution based on the relationship between two truncated moments, offering insights into its theoretical underpinnings. A comprehensive simulation study is also performed to examine the behavior of the estimated parameters, employing maximum likelihood (ML), ordinary least squares (OLS), and least absolute weights (LAW) methods, providing a comparison of their efficiency and robustness. In addition, the adaptability and flexibility of the proposed model are validated through two real-life applications, showing its potential for broad practical relevance in various fields. Moreover, the article highlights the importance of selecting the appropriate distribution for accurately modeling financial data, as it significantly influences risk assessment and decision-making processes. By extending the exponentiated standard logistic distribution, the proposed model allows for a better fit to empirical data, particularly in the presence of outliers and heavy tails often observed in financial claims. The comprehensive exploration of the statistical properties, including moments and asymptotic behavior, facilitates a deeper understanding of the underlying mechanisms driving the distribution’s behavior.
Furthermore, a thorough financial risk assessment is conducted using several actuarial risk measures, such as Peaks Over Random Threshold Value-at-Risk (PORT-VaR), Value-at-Risk (VaR), Tail Value-at-Risk (TVaR), the risk-adjusted return on capital (RAROC) and the Mean of Order P (MOO). These risk indicators are critical in understanding and quantifying potential extreme losses, especially under uncertain market conditions. The PORT-VaR method introduces a novel approach by incorporating randomness in threshold selection, improving the precision of risk estimation. VaR and TVaR provide a range of insights into financial losses, with TVaR offering a more comprehensive view of extreme tail risk. The incorporation of the MOO framework further allows for the optimization of investment portfolios by considering multiple objectives and constraints, thus enhancing strategic financial planning. The results derived from these risk assessments offer valuable guidance for investors and stakeholders in managing potential exposures and making informed decisions in turbulent market environments. Lastly, the findings of this study contribute to the broader field of financial risk management, providing a robust framework for evaluating financial risk and guiding decision-making processes in uncertain environments, and underscoring the need for continuous adaptation of risk models to capture the evolving dynamics of financial markets effectively.
Author Contributions
Conceptualization, P.S., M.A., J.D. and P.J.H.; methodology, J.D., P.J.H., M.A. and H.M.Y.; software, J.D., P.J.H. and H.M.Y.; validation, G.G.H. and J.E.C.-R.; formal analysis, J.D., P.J.H., M.A. and H.M.Y.; investigation, J.D., P.J.H., M.A. and H.M.Y.; resources, J.E.C.-R., M.A. and H.M.Y.; data curation, J.D., P.J.H. and H.M.Y.; writing—original draft preparation, P.S., M.A. and H.M.Y.; writing—review and editing, P.S., J.E.C.-R. and H.M.Y.; visualization, J.D., P.J.H. and H.M.Y.; supervision, M.A., J.E.C.-R. and H.M.Y.; project administration, M.A.; funding acquisition, J.E.C.-R., M.A. and H.M.Y. All authors have read and agreed to the published version of the manuscript.
Funding
This research received no external funding.
Data Availability Statement
Data and R codes are available at https://github.com/PiotrSule/NEELS.
Acknowledgments
The authors thank the editor and four anonymous referees for their helpful comments and suggestions. The third and fifth author would like to acknowledge Department of Science and Technology (DST), Government of India, for infrastructural support (SR/FST/MS-I/2023/125).
Conflicts of Interest
The authors declare no conflicts of interest.
Appendix A
R codes for PDF, CDF, quantile, mode, kth order moment, skewness, excess kurtosis, PDFs of order statistics, moments of order statistics and quantile function are available at https://github.com/PiotrSule/NEELS.
Appendix B
References
- Elal-Olivero, D. Alpha-skew-normal distribution. Proyecciones 2010, 29, 224–240. [Google Scholar] [CrossRef]
- Hazarika, P.J.; Chakraborty, S. Alpha-skew-logistic distribution. IOSR J. Math. 2014, 10, 36–46. [Google Scholar] [CrossRef]
- Das, J.; Hazarika, P.J.; Chakraborty, S.; Pathak, D.; Hamedani, G.; Karamikabir, H. A bimodal extension of the Tanh skew normal distribution: Properties and applications. Pak. J. Stat. Oper. Res. 2024, 20, 533–551. [Google Scholar] [CrossRef]
- Esmaeili, H.; Lak, F.; Alizadeh, M. The alpha-beta skew logistic distribution: Properties and applications. Stat. Optim. Inf. Comput. 2020, 8, 304–317. [Google Scholar] [CrossRef]
- Shah, S.; Hazarika, P.J.; Chakraborty, S.; Ali, M.M. A generalized-alpha–beta-skew normal distribution with applications. Ann. Data Sci. 2023, 10, 1127–1155. [Google Scholar] [CrossRef]
- Pathak, D.; Hazarika, P.J.; Chakraborty, S.; Das, J.; Hamedani, G. Modeling tri-model data with a new skew logistic distribution. Pak. J. Stat. Oper. Res. 2023, 19, 585–602. [Google Scholar] [CrossRef]
- Das, J.; Pathak, D.; Hazarika, P.J.; Chakraborty, S.; Hamedani, G. A new flexible alpha skew normal distribution. J. Indian Soc. Probab. Stat. 2023, 24, 485–507. [Google Scholar] [CrossRef]
- Das, J.; Hazarika, P.J.; Hamedani, G.G.; Alizadeh, M.; Contreras-Reyes, J.E. A new flexible skew logistic distribution: Properties and applications. Austrian J. Stat. 2025, 54, 18–43. [Google Scholar] [CrossRef]
- Balakrishnan, N. Handbook of the Logistic Distribution; CRC Press: Boca Raton, FL, USA, 1991. [Google Scholar]
- Tsay, R.S. Analysis of Financial Time Series; John Wiley & Sons: Hoboken, NJ, USA, 2005. [Google Scholar]
- Longin, F. The threshold effect in expected utility and mean-variance analysis: Results from a medium-term asset allocation. J. Bank. Financ. 2005, 29, 509–532. [Google Scholar]
- Furman, E.; Landsman, Z. Tail variance premium with applications for elliptical portfolio of risks. ASTIN Bull. J. IAA 2006, 36, 433–462. [Google Scholar] [CrossRef]
- Fondeville, R.; Davison, A.C. Functional peaks-over-threshold analysis. J. R. Stat. Soc. Ser. Stat. Methodol. 2022, 84, 1392–1422. [Google Scholar] [CrossRef]
- Alizadeh, M.; Afshari, M.; Ranjbar, V.; Merovci, F.; Yousof, H.M. A novel XGamma extension: Applications and actuarial risk analysis under the reinsurance data. São Paulo J. Math. Sci. 2024, 18, 407–437. [Google Scholar] [CrossRef]
- Ibrahim, M.; Emam, W.; Tashkandy, Y.; Ali, M.M.; Yousof, H.M. Bayesian and non-bayesian risk analysis and assessment under left-skewed insurance data and a novel compound reciprocal rayleigh extension. Mathematics 2023, 11, 1593. [Google Scholar] [CrossRef]
- Alizadeh, M.; Afshari, M.; Contreras-Reyes, J.E.; Mazarei, D.; Yousof, H.M. The extended Gompertz model: Applications, mean of order P assessment and statistical threshold risk analysis based on extreme stresses data. IEEE Trans. Reliab. 2025, 74, 2779–2791. [Google Scholar] [CrossRef]
- Elbatal, I.; Diab, L.; Ghorbal, A.B.; Yousof, H.M.; Elgarhy, M.; Ali, E.I. A new losses (revenues) probability model with entropy analysis, applications and case studies for value-at-risk modeling and mean of order-p analysis. AIMS Math. 2024, 9, 7169–7211. [Google Scholar] [CrossRef]
- Omukami, H.A. Generalizations of Logistic Distribution. Ph.D. Thesis, University of Nairobi, Nairobi, Kenya, 2022. [Google Scholar]
- Sulewski, P. Modified Lilliefors goodness-of-fit test for normality. Commun.-Stat.-Simul. Comput. 2020, 51, 1199–1219. [Google Scholar] [CrossRef]
- Malakhov, A.N. A Cumulant Analysis of Random Non-Gaussian Processes and Their Transformations; Soviet Radio: Moscow, Russia, 1978. (In Russian) [Google Scholar]
- Kenney, F.J.; Keeping, E.S. Mathematics of Statistics; D. Van Nostrand Company: Princeton, NJ, USA, 1962. [Google Scholar]
- Moors, J. A quantile alternative for kurtosis. J. R. Stat. Soc. Ser. D (Stat.) 1988, 37, 25–32. [Google Scholar] [CrossRef]
- Glänzel, W. A characterization theorem based on truncated moments and its application to some distribution families. In Mathematical Statistics and Probability Theory: Volume B Statistical Inference and Methods Proceedings of the 6th Pannonian Symposium on Mathematical Statistics, Bad Tatzmannsdorf, Austria, 14–20 September 1986; Springer: Dordrecht, The Netherlands, 1986; pp. 75–84. [Google Scholar]
- Glanzel, W. Some consequences of a characterization theorem based on truncated moments. Statistics 1990, 21, 613–618. [Google Scholar] [CrossRef]
- Almongy, H.M.; Almetwally, E.M.; Aljohani, H.M.; Alghamdi, A.S.; Hafez, E. A new extended Rayleigh distribution with applications of COVID-19 data. Results Phys. 2021, 23, 104012. [Google Scholar] [CrossRef]
- Almetwally, E.M. The odd Weibull inverse topp–leone distribution with applications to covid-19 data. Ann. Data Sci. 2022, 9, 121–140. [Google Scholar] [CrossRef]
- Afify, A.Z.; Mohamed, O.A. A new three-parameter exponential distribution with variable shapes for the hazard rate: Estimation and applications. Mathematics 2020, 8, 135. [Google Scholar] [CrossRef]
- Nassar, M.; Afify, A.Z.; Shakhatreh, M.K.; Dey, S. On a new extension of weibull distribution: Properties, estimation, and applications to one and two causes of failures. Qual. Reliab. Eng. Int. 2020, 36, 2019–2043. [Google Scholar] [CrossRef]
- Shama, M.S.; Alharthi, A.S.; Almulhim, F.A.; Gemeay, A.M.; Meraou, M.A.; Mustafa, M.S.; Hussam, E.; Aljohani, H.M. Modified generalized weibull distribution: Theory and applications. Sci. Rep. 2023, 13, 12828. [Google Scholar] [CrossRef] [PubMed]
- R Core Team. R: A Language and Environment for Statistical Computing; R Foundation for Statistical Computing: Vienna, Austria, 2024. [Google Scholar]
- Balakrishnan, N.; Leung, M. Order statistics from the type I generalized logistic distribution. Commun.-Stat.-Simul. Comput. 1988, 17, 25–50. [Google Scholar] [CrossRef]
- Nadarajah, S. The skew logistic distribution. AStA Adv. Stat. Anal. 2009, 93, 187–203. [Google Scholar] [CrossRef]
- Kumar, C.S.; Manju, L. On modified skew logistic regression model and its applications. Statistica 2015, 75, 361–377. [Google Scholar]
- Alzaatreh, A.; Lee, C.; Famoye, F. A new method for generating families of continuous distributions. Metron 2013, 71, 63–79. [Google Scholar] [CrossRef]
- Ghosh, I.; Alzaatreh, A. A new class of generalized logistic distribution. Commun.-Stat.-Theory Methods 2018, 47, 2043–2055. [Google Scholar] [CrossRef]
- Chakraborty, S.; Hazarika, P.J.; Ali, M.M. A multimodal skew Laplace distribution. Pak. J. Stat. 2014, 30, 253–264. [Google Scholar]
- Kundu, D.; Raqab, M.Z. Estimation of R=P(Y<X) for three-parameter weibull distribution. Stat. Probab. Lett. 2009, 79, 1839–1846. [Google Scholar]
- Rice, A.J. Mathematical Statistics and Data Analysis; Thomson/ Brooks/Cole: Belmont, CA, USA, 2007; Volume 371. [Google Scholar]
- Yousof, H.M.; Aljadani, A.; Mansour, M.M.; Abd Elrazik, E.M. A new Pareto model: Risk application, reliability MOOP and port value-at-risk analysis. Pak. J. Stat. Oper. Res. 2024, 20, 383–407. [Google Scholar] [CrossRef]
- Resnick, S.I. Heavy-Tail Phenomena: Probabilistic and Statistical Modeling; Springer Science & Business Media: New York, NY, USA, 2007; Volume 10. [Google Scholar]
- Fougères, A.L.; Soulier, P. Heavy-Tail Phenomena: Probabilistic and Statistical Modeling. SIAM Rev. 2008, 50, 391–393. [Google Scholar]
- Aljadani, A.; Mansour, M.M.; Yousof, H.M. A novel model for finance and reliability applications: Theory, practices and financial peaks over a random threshold value-at-risk analysis. Pak. J. Stat. Oper. Res. 2024, 20, 489–515. [Google Scholar] [CrossRef]
- Jordan, J.; Katz, S. Risk-adjusted return on capital and the regulatory environment. Risk Manag. 2018, 20, 281–298. [Google Scholar]
Disclaimer/Publisher’s Note: The statements, opinions and data contained in all publications are solely those of the individual author(s) and contributor(s) and not of MDPI and/or the editor(s). MDPI and/or the editor(s) disclaim responsibility for any injury to people or property resulting from any ideas, methods, instructions or products referred to in the content. |
© 2025 by the authors. Licensee MDPI, Basel, Switzerland. This article is an open access article distributed under the terms and conditions of the Creative Commons Attribution (CC BY) license (https://creativecommons.org/licenses/by/4.0/).