
Comparison of Interval Type-3 Mamdani and Sugeno Models for Fuzzy Aggregation Applied to Ensemble Neural Networks for Mexican Stock Exchange Time Series Prediction


Abstract
1. Introduction
2. Type-3 Fuzzy Systems
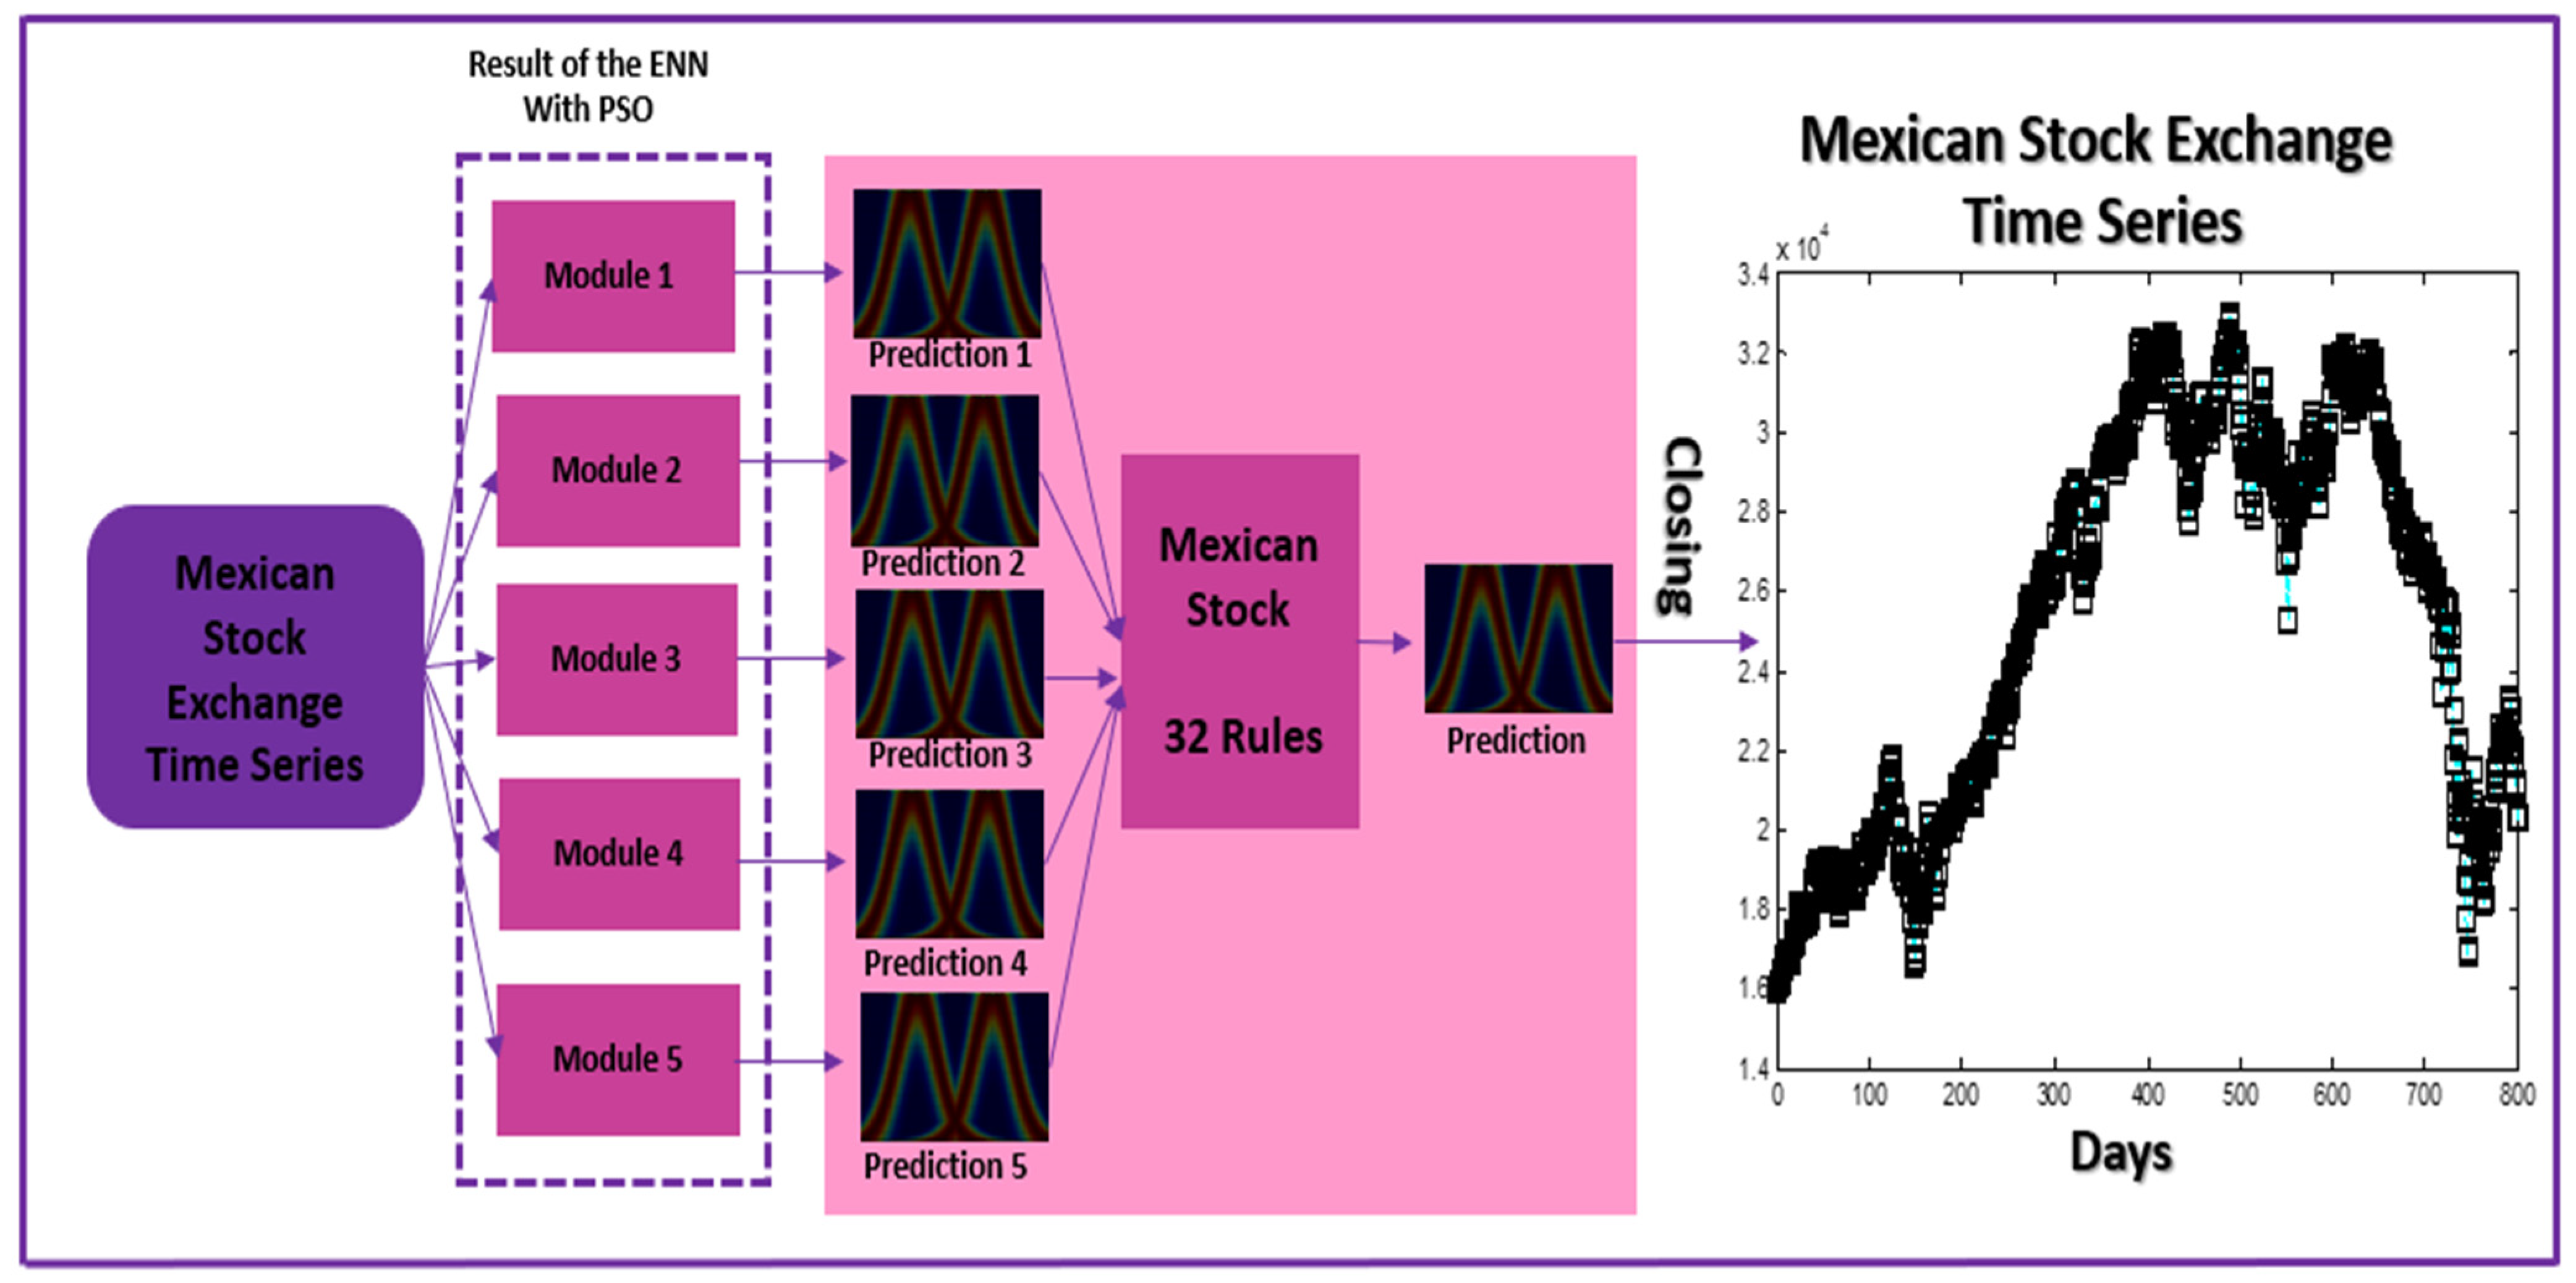
3. Model Description
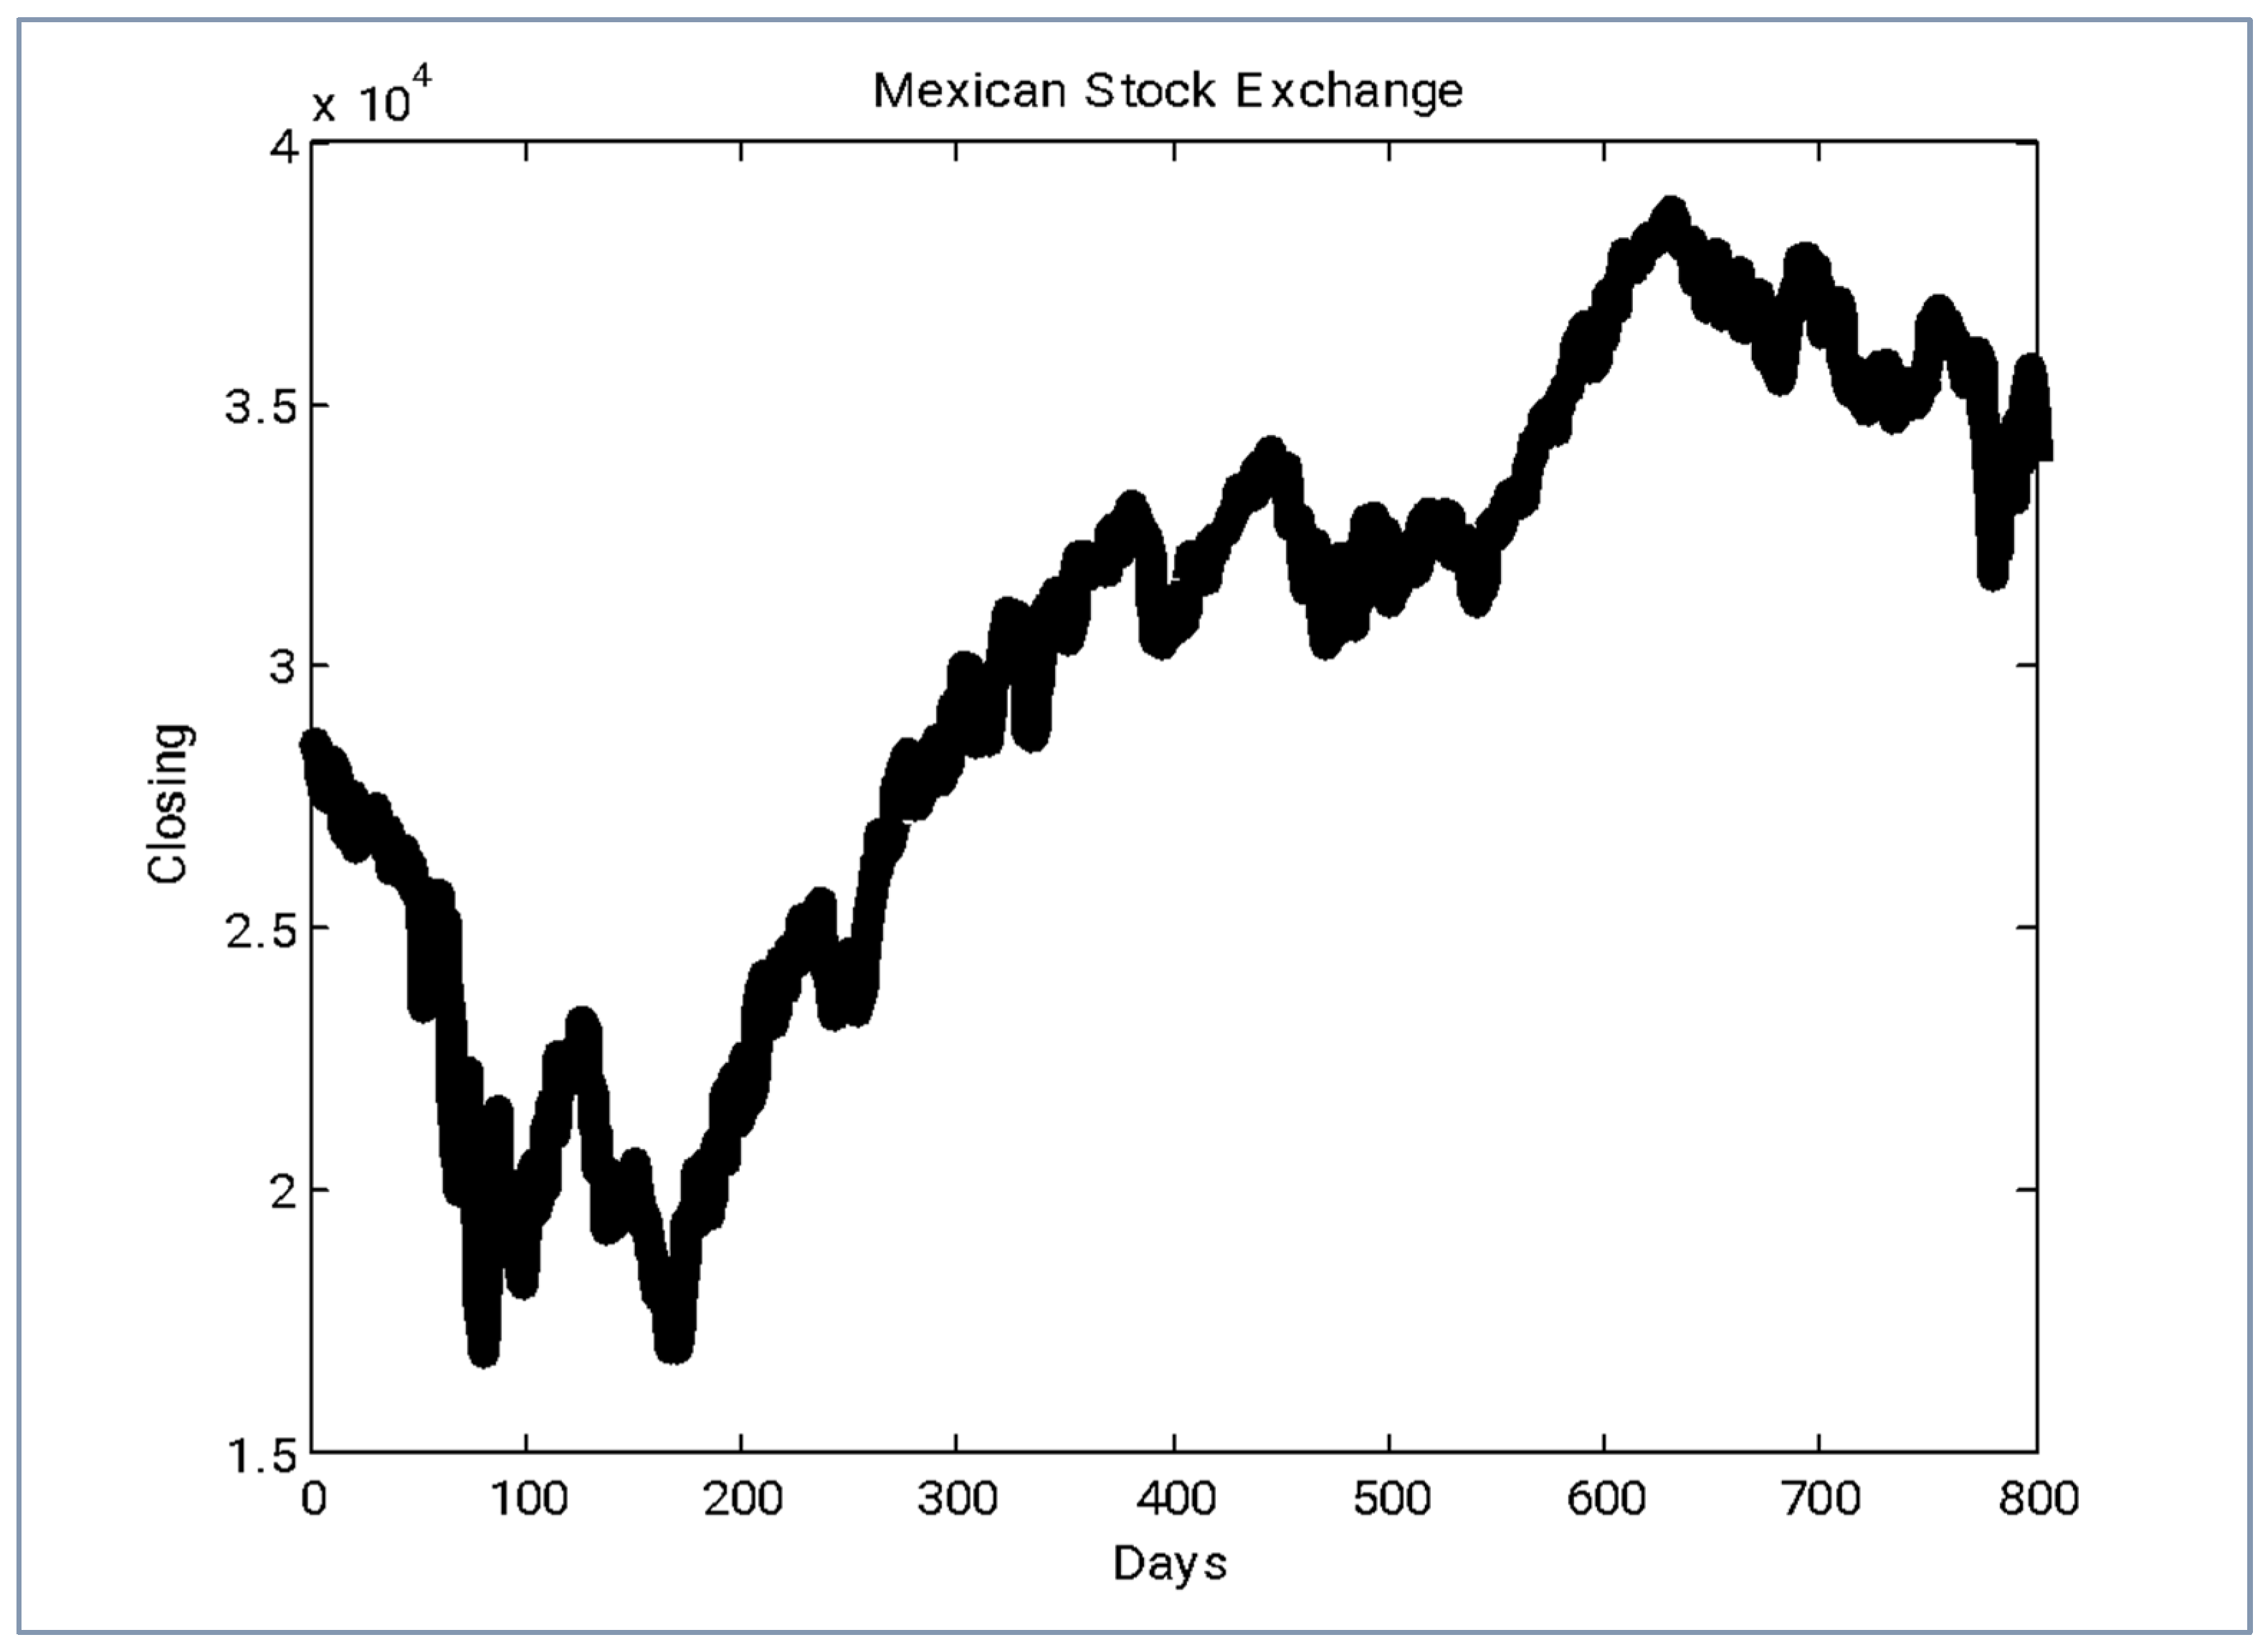
3.1. Time Series Prediction
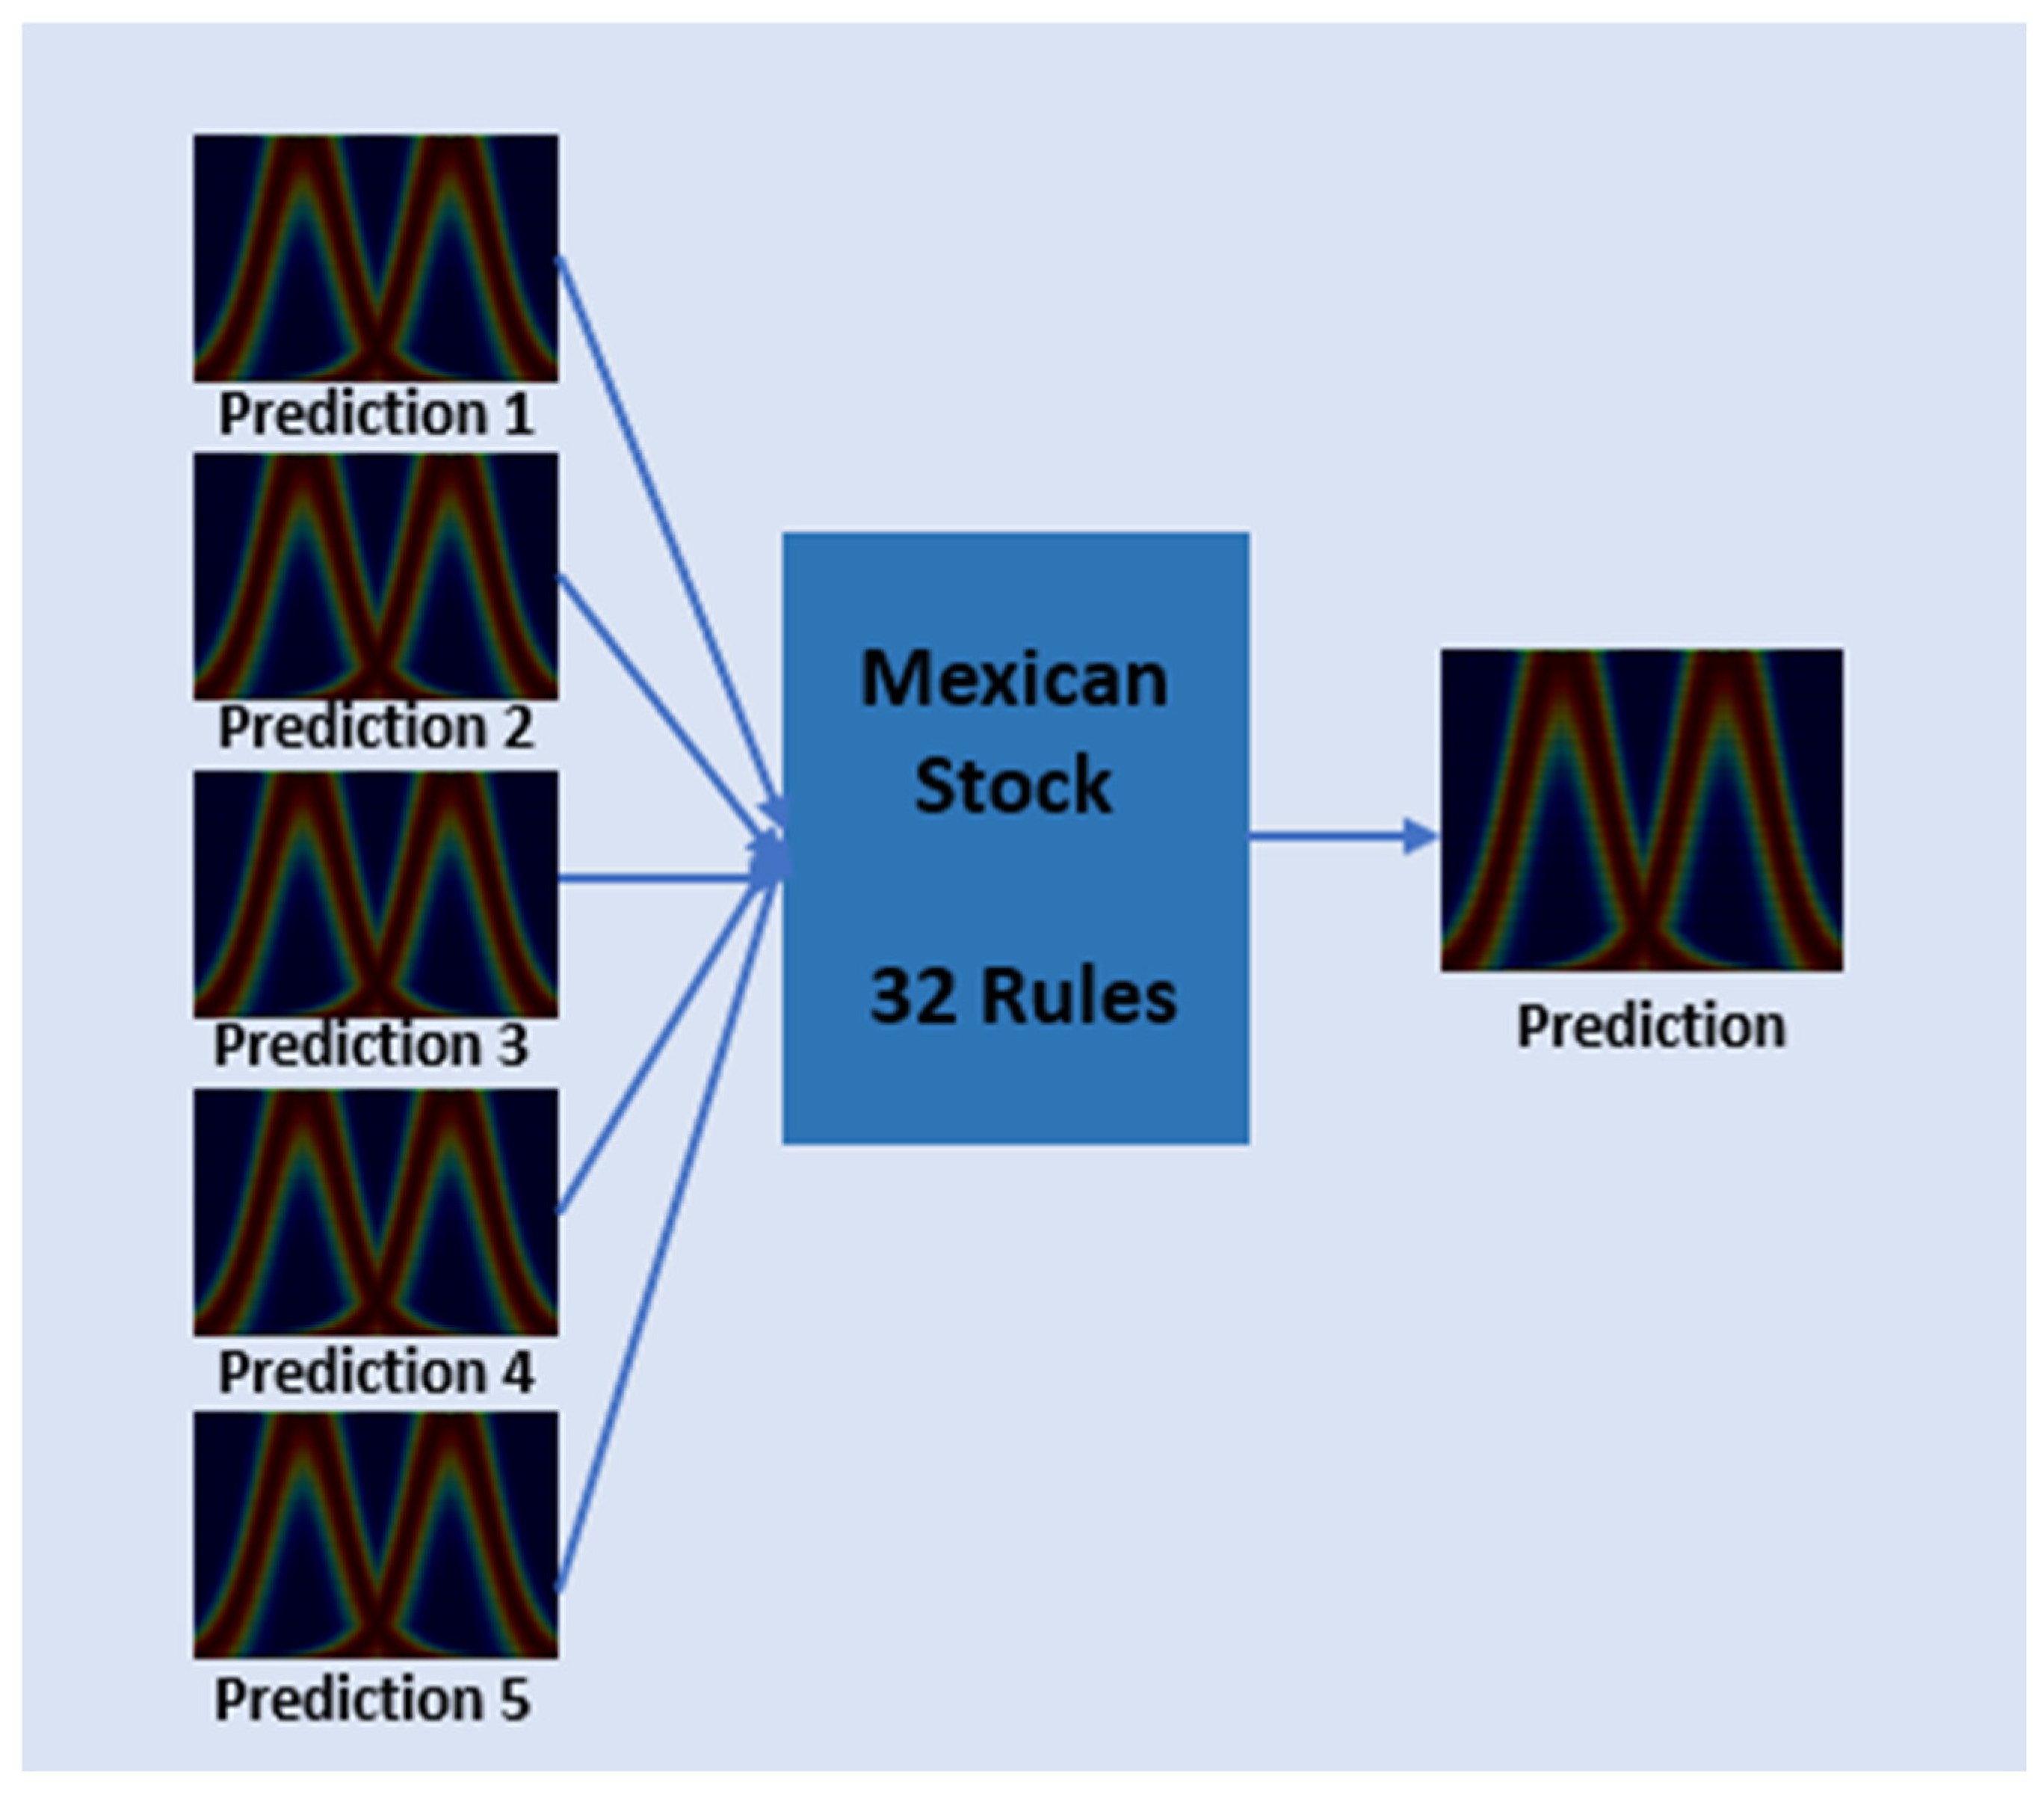
3.2. Type-2 and Type-3 Fuzzy Systems
4. Simulations and Comparison of Results
4.1. Comparison of Results
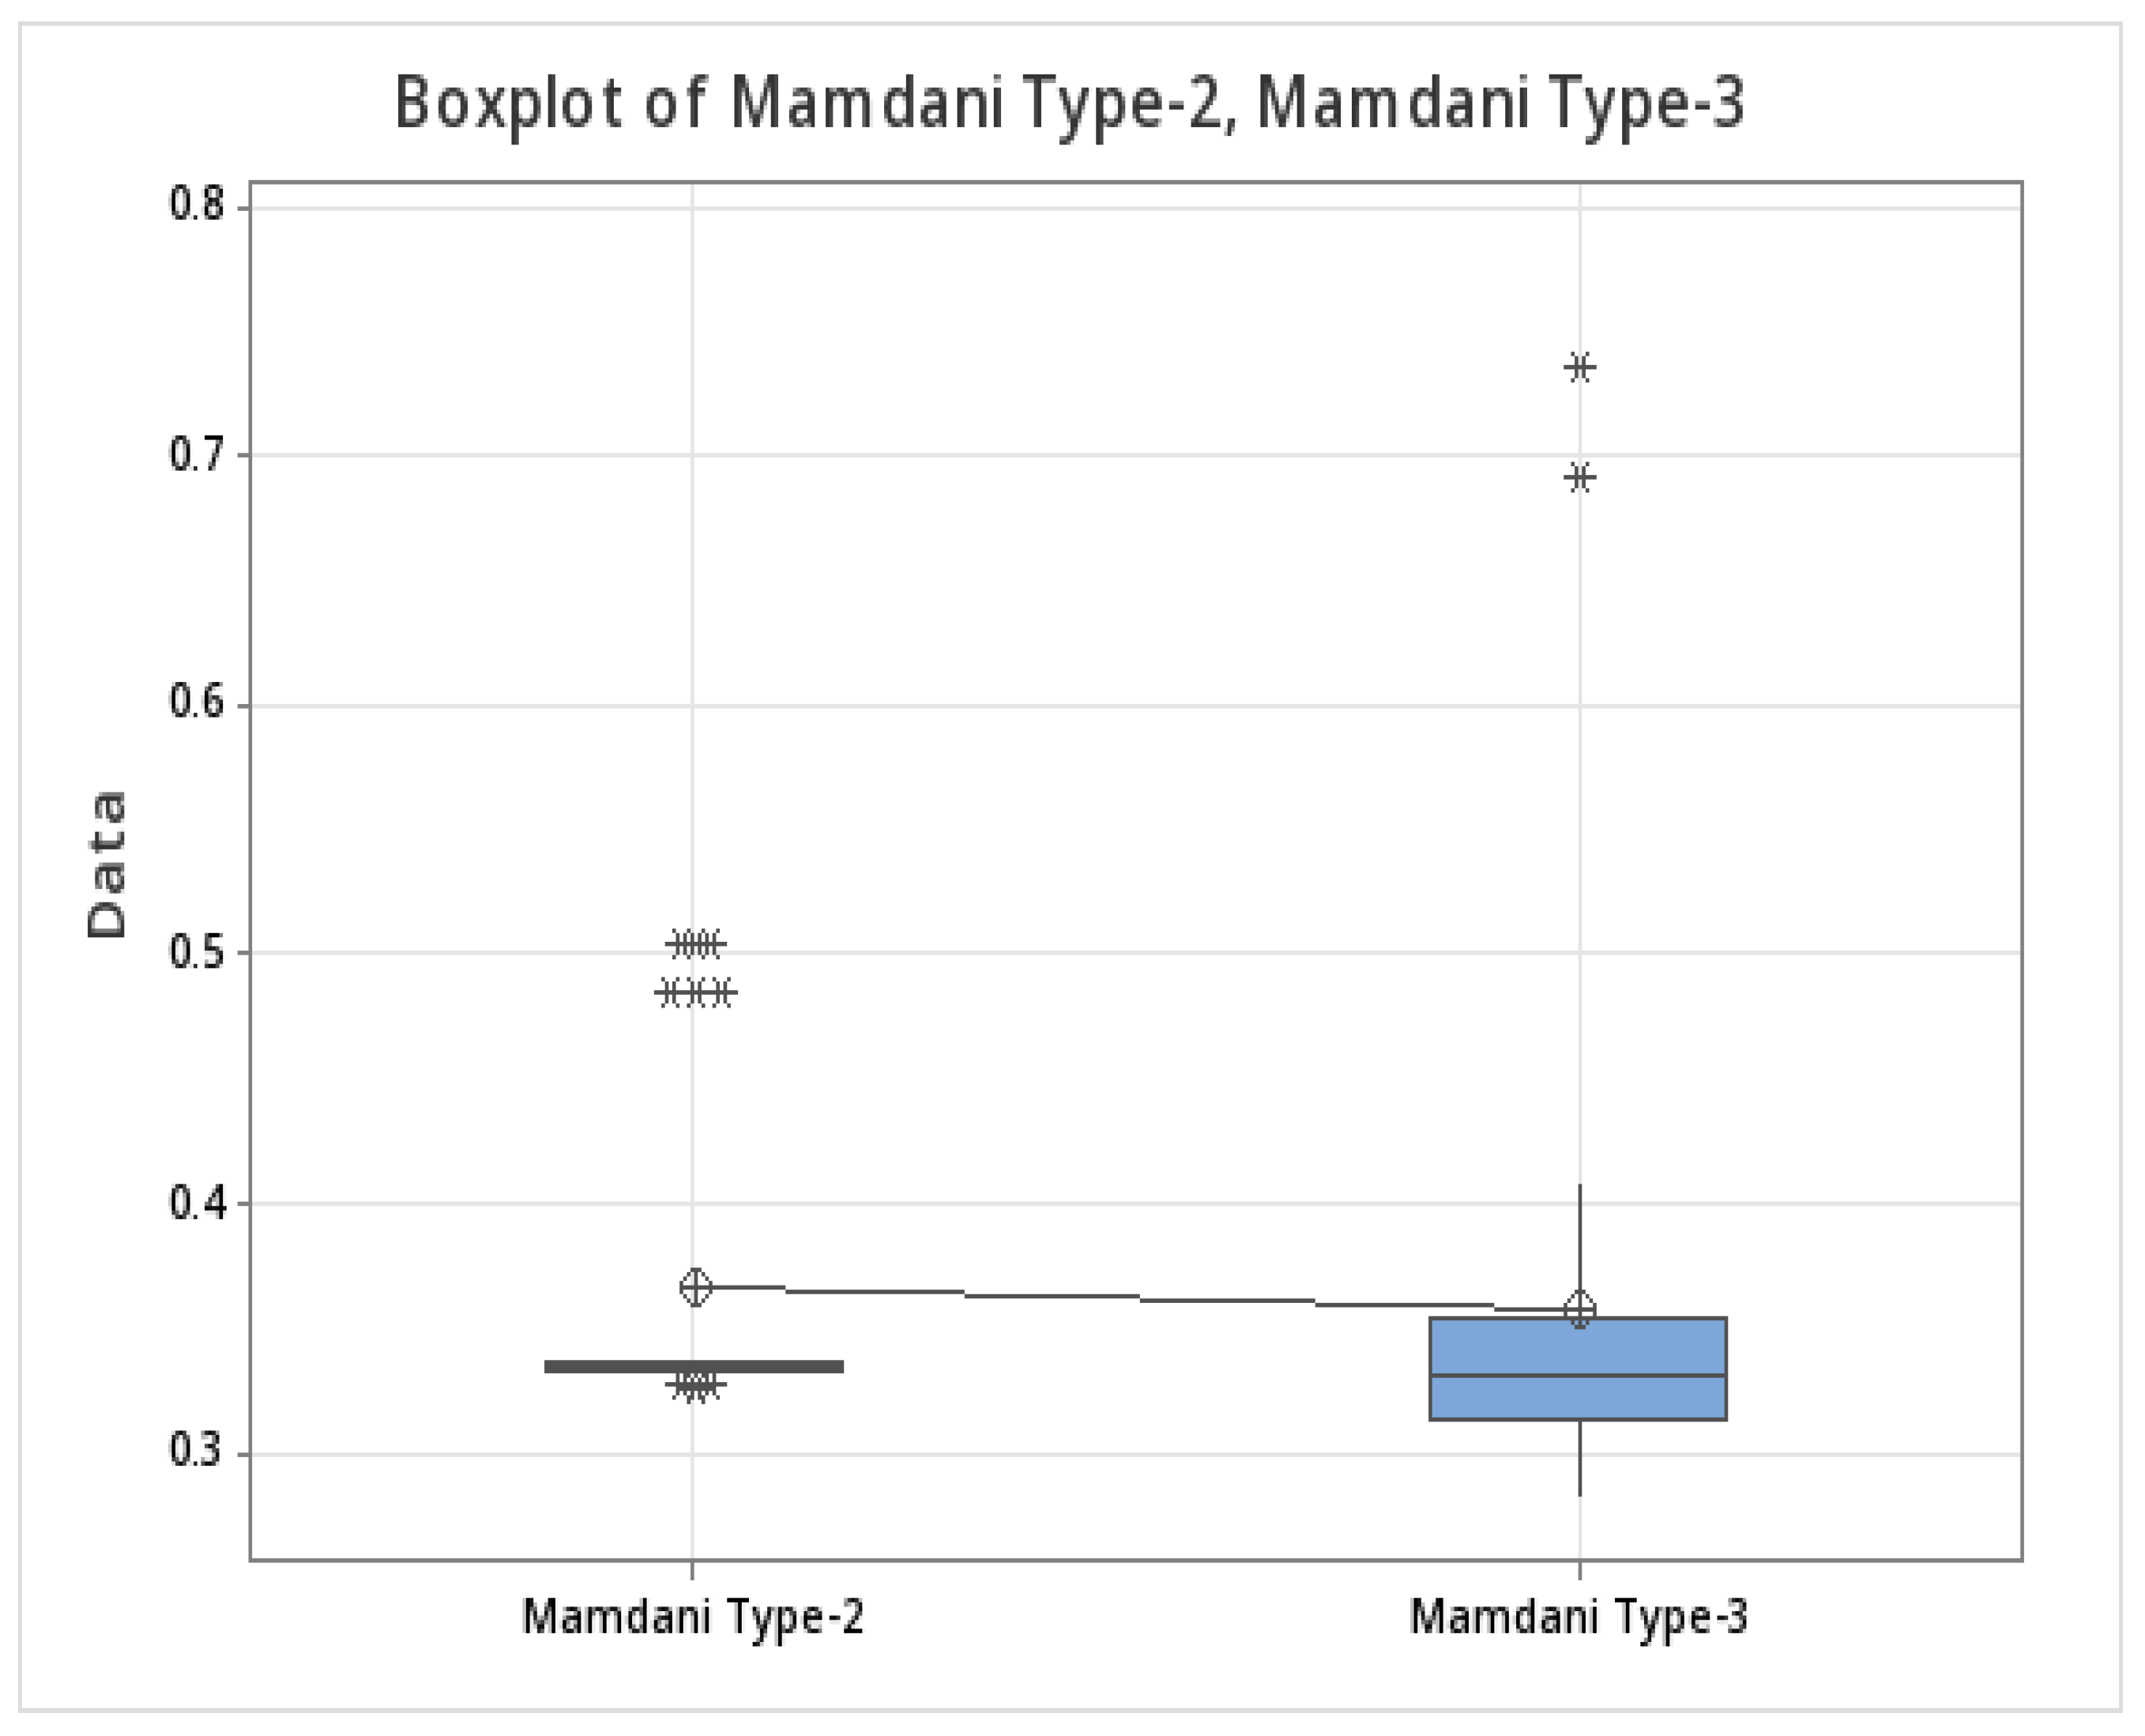
4.1.1. Type-2 and Type-3 Mamdani Fuzzy Systems for the First Time Period
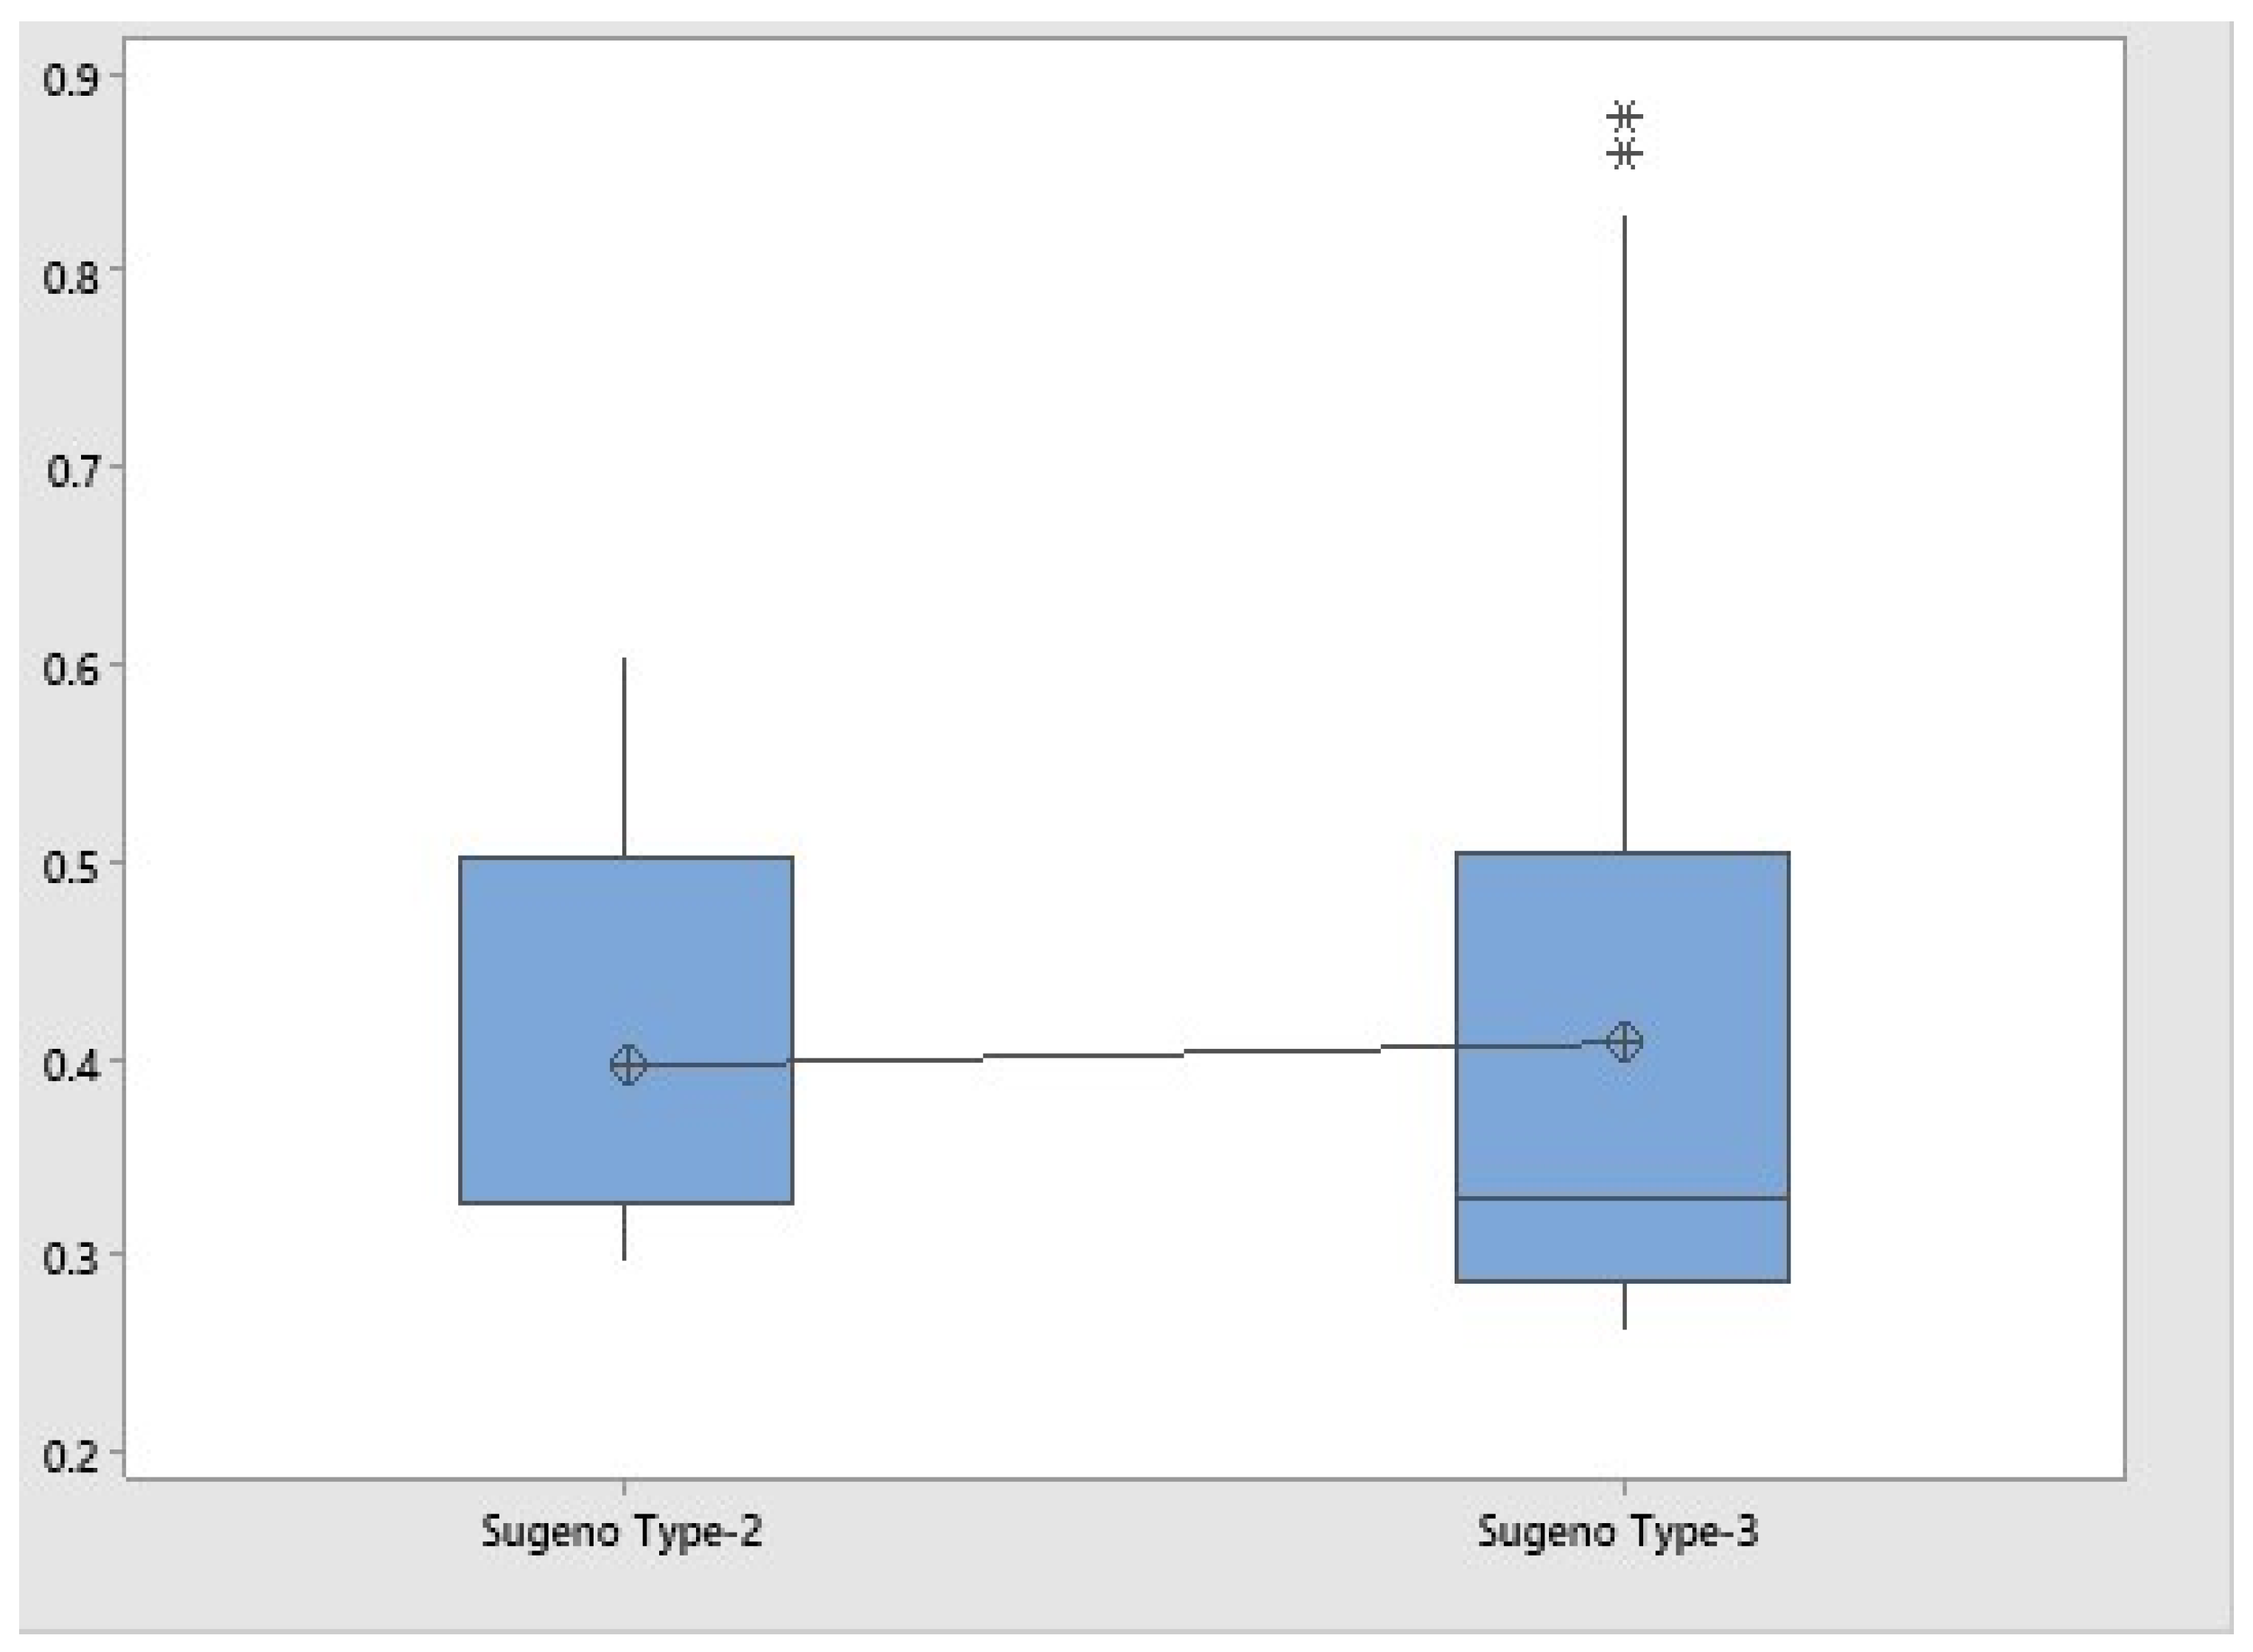
4.1.2. Type-2 and Type-3 Sugeno Fuzzy Systems for the First Time Period
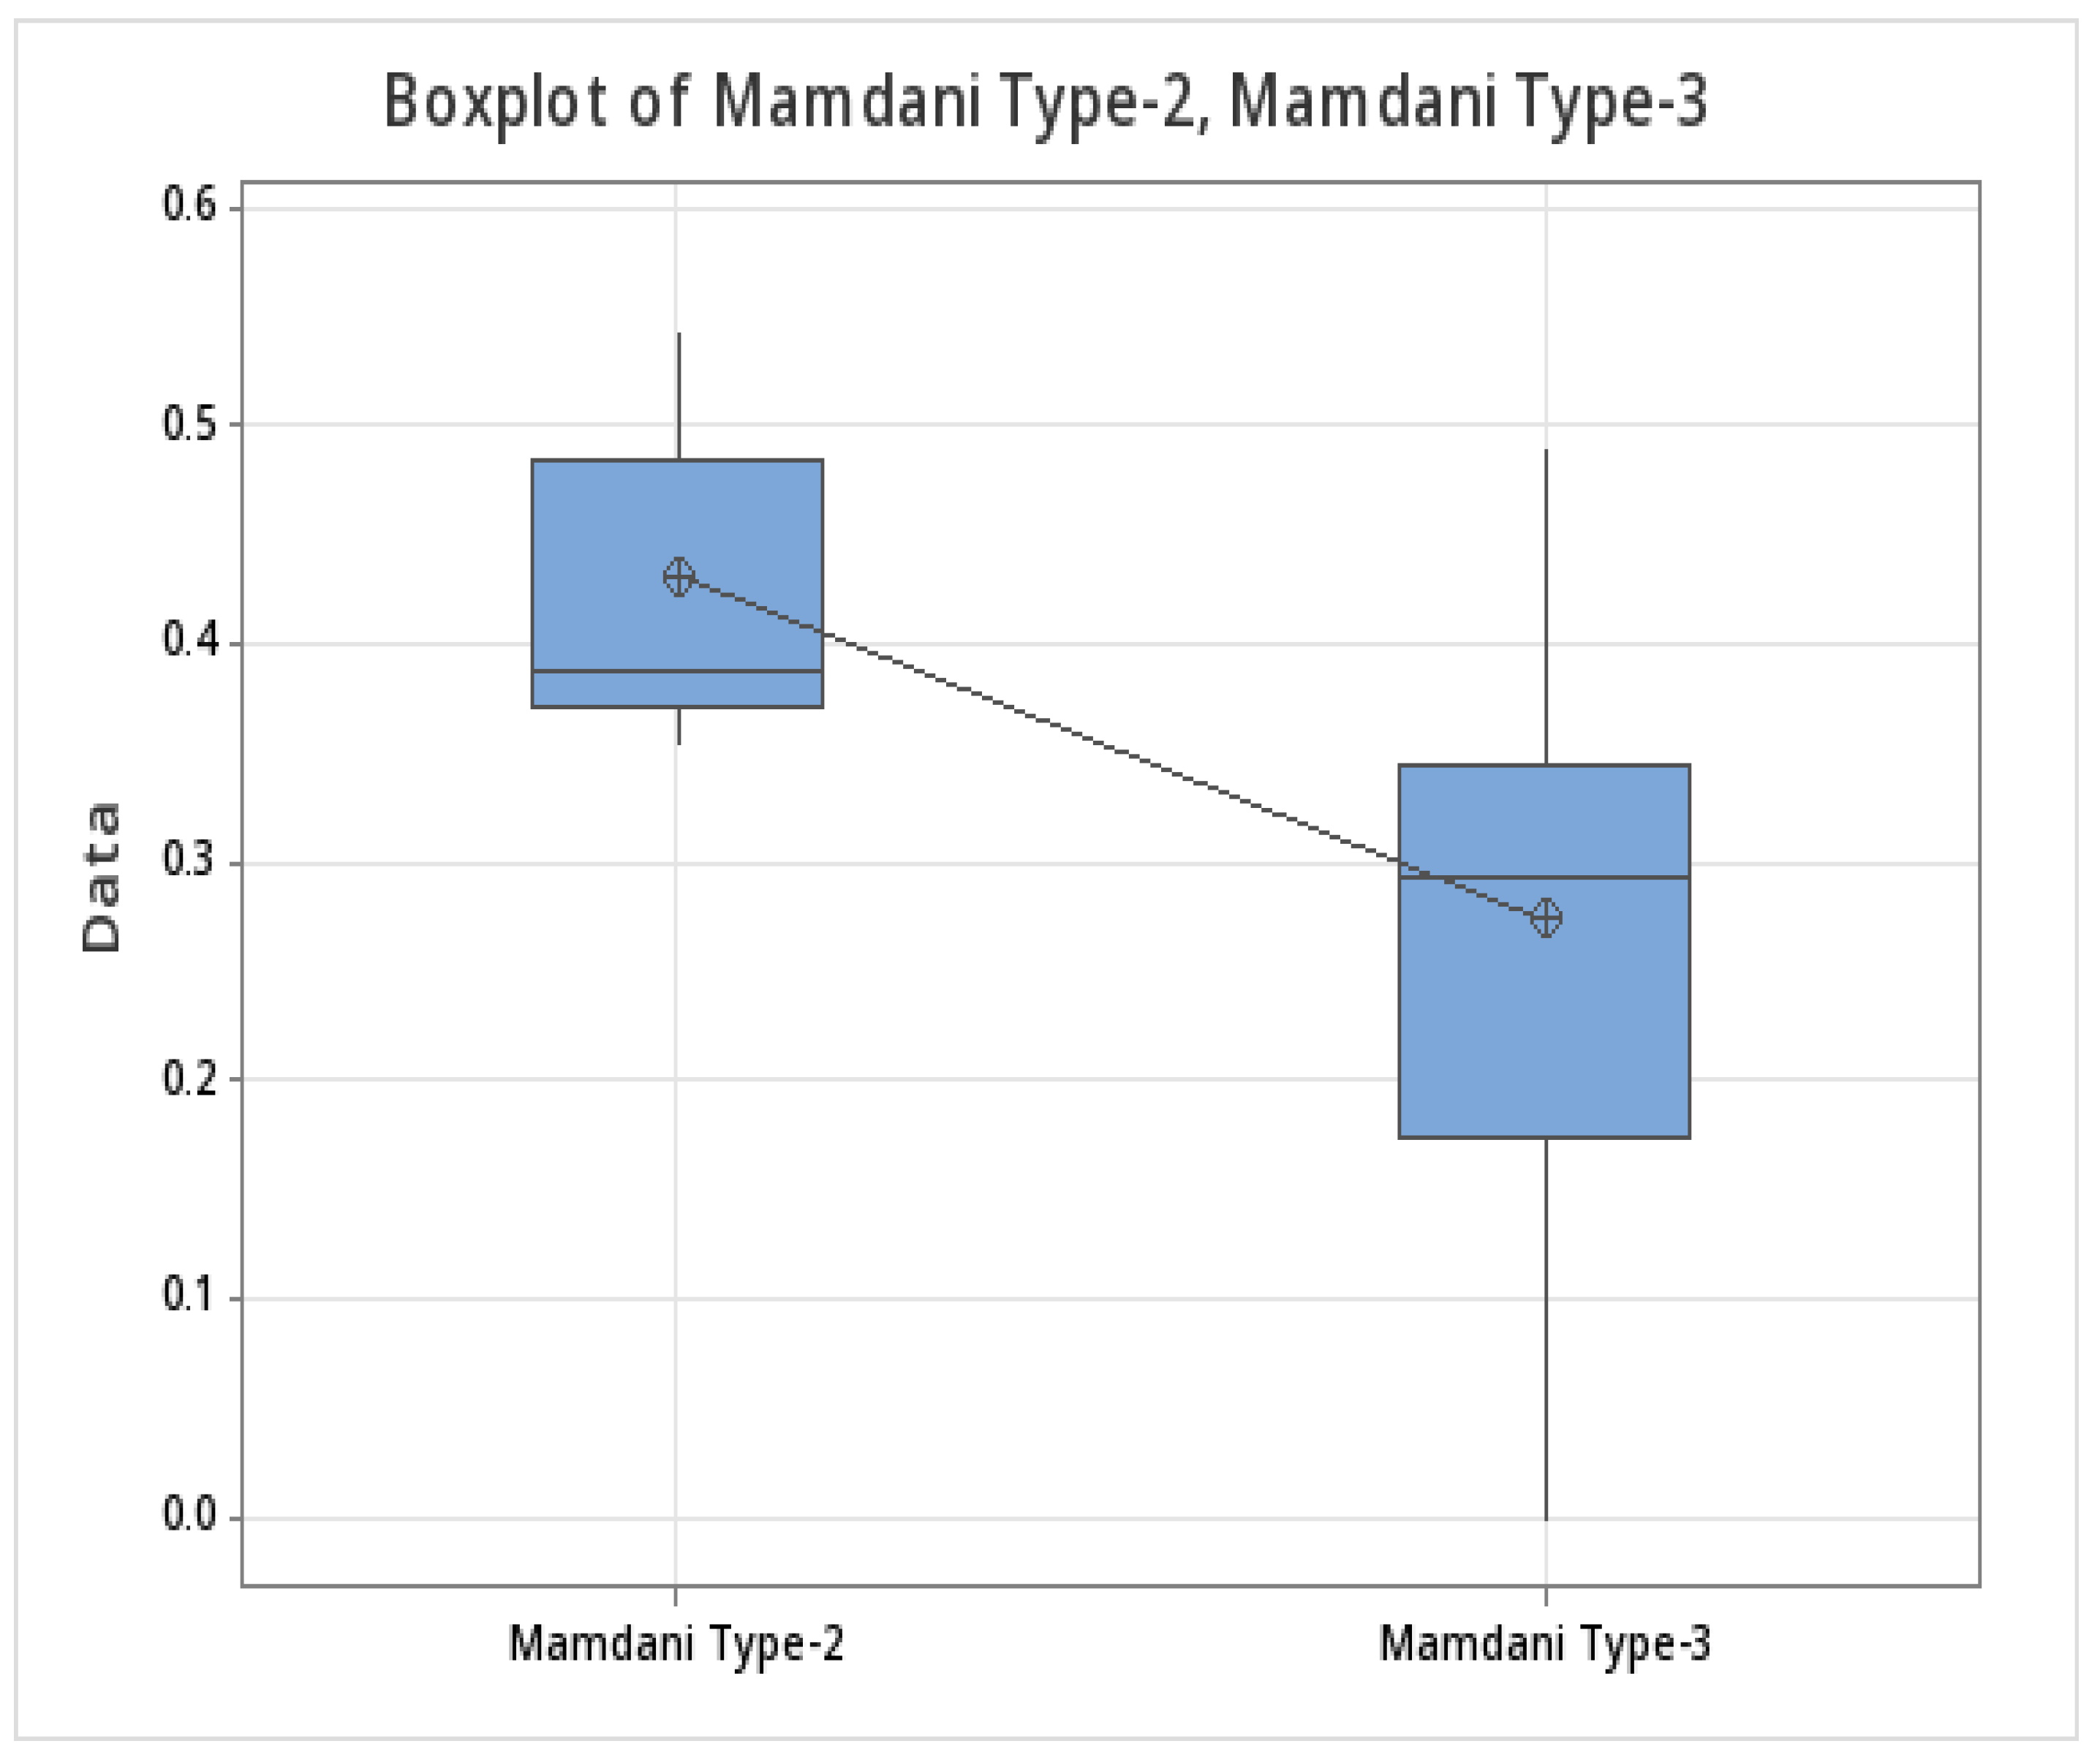
4.1.3. Type-2 and Type-3 Mamdani Fuzzy Systems for the Second Time Period
4.1.4. Type-2 and Type-3 Sugeno Fuzzy Systems for the Second Time Period
4.2. Discussion of Results
5. Conclusions
Author Contributions
Funding
Data Availability Statement
Acknowledgments
Conflicts of Interest
References
- Brockwell, P.D.; Davis, R.A. Introduction to Time Series and Forecasting; Springer: New York, NY, USA, 2002; pp. 1–219. [Google Scholar]
- Castillo, O.; Melin, P. Hybrid intelligent systems for time series prediction using neural networks, fuzzy logic, and fractal theory Neural Networks. IEEE Trans. Neural Netw. 2002, 13, 1395–1408. [Google Scholar] [CrossRef] [PubMed]
- Cowperthwaite, P.; Metcalfe, A. Introductory Time Series with R; Time Series; Springer: Dordrecht, The Netherlands; Heidelberg, Germany; London, UK; New York, NY, USA, 2009; pp. 2–5. [Google Scholar]
- Huarng, K. Effective lengths of intervals to improve forecasting in fuzzy time series. Fuzzy Sets Syst. 2001, 123, 3387–3394. [Google Scholar] [CrossRef]
- Jang, J.S.R.; Sun, C.T.; Mizutani, E. Neuro-Fuzzy and Soft Computing; Prentice Hall: Hoboken, NJ, USA, 1996. [Google Scholar]
- Zadeh, L. Some reflections on soft computing, granular computing and their roles in the conception, design and utilization of information/intelligent systems. Soft Comput. 1998, 2, 23–25. [Google Scholar] [CrossRef]
- Chang, J.R.; Wei, L.; Cheng, C.H. OWA-based ANFIS model for TAIEX forecasting. Econ. Model. 2013, 30, 442–448. [Google Scholar] [CrossRef]
- Cheng, C.H.; Chen, T.L.; Theo, H.J.; Chiang, C.H. Fuzzy time-series based on adaptive expectation model for TAIEX forecasting. Expert Syst. Appl. 2008, 34, 1126–1132. [Google Scholar] [CrossRef]
- Cunningham, P.; Carney, J.; Jacob, S. Stability problems with artificial neural networks and the ensemble solution. Artif. Intell. Med. 2000, 20, 217–225. [Google Scholar] [CrossRef]
- Jia, D.; Wu, Z. Seismic fragility analysis of RC frame-shear wall structure under multidimensional performance limit state based on ensemble neural network. Eng. Struct. 2021, 246, 112975–112985. [Google Scholar] [CrossRef]
- Sharkey, A. Combining Artificial Neural Nets: Ensemble and Modular Multi-Net Systems; Springer: London, UK, 1999. [Google Scholar]
- Gurney, K. An Introduction to Neural Networks, 1st ed.; CRC Press: Florida, FL, USA, 1997; pp. 3–10. [Google Scholar]
- Hansen, L.K.; Salomon, P. Neural network ensembles. IEEE Trans. Pattern Anal. Mach. Intell. 1990, 12, 993–1001. [Google Scholar] [CrossRef]
- Maclin, R.; Shavlik, J.W. Combining the predictions of multiple classifiers: Using competitive learning to initialize neural networks. In IJCAI-95; Morgan Kaufmann: Montreal, QC, Canada; San Mateo, CA, USA, 1995; pp. 524–530. [Google Scholar]
- Pulido, M.; Melin, P. Optimization of Ensemble Neural Networks with Type-2 Fuzzy Integration of Responses for the Dow Jones Time Series Prediction. Intell. Autom. Soft Comput. 2014, 20, 403–418. [Google Scholar]
- Wilkinson, I.; Bhattacharjee, R.; Shafer, J.; Osborne, A. Confidence estimation in the prediction of epithermal neutron resonance self-shielding factors in irradiation samples using an ensemble neural network. Energy AI 2022, 7, 100131–100149. [Google Scholar] [CrossRef]
- Peng, B.; Tong, L.D.; Huo, W. Experimental research and artificial neural network prediction of free piston expander-linear generator. Energy Rep. 2022, 8, 1966–1978. [Google Scholar] [CrossRef]
- Prakarsha, K.; Sharma, G. Time series signal forecasting using artificial neural networks: An application on ECG signal. Biomed. Signal. Process. Control 2022, 76, 103705–103720. [Google Scholar]
- Mao, J. A case study on bagging, boosting and basic ensembles of neural networks for OCR. In IJCNN-98; IEEE Computer Society Press: Anchorage, AK, USA; Los Alamitos, CA, USA, 1998; Volume 3, pp. 1828–1833. [Google Scholar]
- Melin, P.; Castillo, O. A review on type-2 fuzzy logic applications in clustering, classification and pattern recognition. Appl. Soft Comput. 2014, 21, 568–577. [Google Scholar] [CrossRef]
- Melin, P.; Monica, J.C.; Sánchez, D.; Castillo, O. Multiple Ensemble Neural Network Models with Fuzzy Response Aggregation for Predicting COVID-19 Time Series: The Case of Mexico. Healthcare 2020, 8, 181–190. [Google Scholar] [CrossRef]
- Pulido, M.; Castillo, O.; Melin, P. Genetic Optimization of Ensemble Neural Networks for Complex Time Series Prediction of the Mexican Exchange. Int. J. Innov. Comput. Inf. Control. 2013, 9, 4151–4166. [Google Scholar]
- Pulido, M.; Melin, P.; Castillo, O. Particle Swarm Optimization of Ensemble Neural Networks with Fuzzy Aggregation for Time Series Prediction of the Mexican Stock Exchange. Inf. Sci. 2014, 280, 188–204. [Google Scholar] [CrossRef]
- Karnik, N.; Mendel, J.M. Applications of type-2 fuzzy logic systems to forecasting of time-series. Inf. Sci. 1999, 120, 89–111. [Google Scholar] [CrossRef]
- Karnik, N.; Mendel, J.M. Introduction to type-2 fuzzy logic systems. IEEE Trans. Signal Process. 1998, 2, 915–920. [Google Scholar]
- Karnik, N.; Mendel, J.M. Operations on Type-2 Fuzzy Sets. Fuzzy Sets Syst. 2001, 122, 327–348. [Google Scholar] [CrossRef]
- Castillo, O.; Melin, P. Type-2 Fuzzy Logic: Theory and Applications; Springer: New York, NY, USA, 2008; pp. 29–40. [Google Scholar]
- Al-Jamimi, H.; Saleh, T. Transparent predictive modelling of catalytic hydrodesulfurization using an interval type-2 fuzzy logic. J. Clean. Prod. 2019, 231, 1079–1088. [Google Scholar] [CrossRef]
- Castillo, O.; Castro, J.R.; Melin, P. Interval Type-3 Fuzzy Systems: Theory and Design, 1st ed.; Springer: Cham, Switzerland, 2022; pp. 45–67. [Google Scholar]
- Cao, Y.; Raise, A.; Mohammadzadeh, A.; Rathinasamy, S.; Band, S.; Mousavi, A. Deep learned recurrent type-3 fuzzy system: Application for renewable energy modeling/prediction. Energy Rep. 2021, 7, 8115–8127. [Google Scholar] [CrossRef]
- Castorena, G.A.H.; Méndez, G.M.; López-Juárez, I.; García, M.A.A.; Martinez-Peon, D.C.; Montes-Dorantes, P.N. Parameter Prediction with Novel Enhanced Wagner Hagras Interval Type-3 Takagi–Sugeno–Kang Fuzzy System with Type-1 Non-Singleton Inputs. Mathematics 2024, 12, 1976–1986. [Google Scholar] [CrossRef]
- Qasem, S.; Ahmadian, A.; Mohammadzadeh, A.; Rathinasamy, S.; Pahlevanzadeh, B. A type-3 logic fuzzy system: Optimized by a correntropy based Kalman filter with adaptive fuzzy kernel size. Inf. Sci. 2021, 572, 424–443. [Google Scholar] [CrossRef]
- Mohammadzadeh, A.; Sabzalian, M.; Zhang, W. An Interval Type-3 Fuzzy System and a New Online Fractional-Order Learning Algorithm: Theory and Practice. IEEE Trans. Fuzzy Syst. 2020, 28, 1940–1950. [Google Scholar] [CrossRef]
- Mexico Bank Database. Available online: http://www.banxico.org.mx (accessed on 30 August 2011).
- Zadeh, L. Fuzzy sets. Inf. Control. 1965, 8, 338–353. [Google Scholar] [CrossRef]
- Zadeh, L. The concept of a linguistic variable and its application to approximate reasoning. Inf. Sci. 1975, 8, 199–249. [Google Scholar] [CrossRef]
- Rickard, J.; Aisbett, J.; Gibbon, G. Fuzzy subsethood for fuzzy sets of type-2 and generalized type-n. IEEE Trans. Fuzzy Syst. 2009, 17, 50–60. [Google Scholar] [CrossRef]
- Gheisarnejad, M.; Mohammadzadeh, A.; Farsizadeh, H.; Khooban, M.H. Stabilization of 5G telecom converter-based deep type-3 fuzzy machine learning control for telecom applications. IEEE Trans. Circuits Syst. II Express Briefs 2021, 69, 544–548. [Google Scholar] [CrossRef]
- Gheisarnejad, M.; Mohammadzadeh, A.; Khooban, M. Model Predictive Control-Based Type-3 Fuzzy Estimator for Voltage Stabilization of DC Power Converters. IEEE Trans. Ind. Electron. 2021, 69, 13849–13858. [Google Scholar] [CrossRef]
- Huang, H.; Xu, H.; Chen, F.; Zhang, C.; Mohammazadeh, A. An Applied Type-3 Fuzzy Logic System: Practical Matlab Simulink and M-Files for Robotic, Control, and Modeling Applications. Symmetry 2023, 15, 475–484. [Google Scholar] [CrossRef]
- Liu, Z.; Mohammadzadeh, A.; Turabieh, H.; Mafarja, M.; Band, S.; Mosavi, A. A New Online Learned Interval Type-3 Fuzzy Control System for Solar Energy Management Systems. IEEE Access 2021, 9, 10498–10508. [Google Scholar] [CrossRef]
- Singh, D.J.; Verma, N.K.; Ghosh, A.K.; Malagaudanavar, A. An approach towards the design of interval type-3 T-S fuzzy system. IEEE Trans. Fuzzy Syst. 2022, 30, 3880–3893. [Google Scholar] [CrossRef]
- Vafaie, R.H.; Mohammadzadeh, A.; Piran, M.J. A new type-3 fuzzy predictive controller for MEMS gyroscopes. Nonlinear Dynam. 2021, 106, 381–403. [Google Scholar] [CrossRef]


| Variable | MFs | σ | m |
|---|---|---|---|
| Input 1 | Low | 0.1768 | 3.03 |
| Input 1 | High | 0.1744 | 3.47 |
| Input 2 | Low | 0.1768 | 3.03 |
| Input 2 | High | 0.1744 | 3.47 |
| Input 3 | Low | 0.1768 | 3.03 |
| Input 3 | High | 0.1744 | 3.47 |
| Input 4 | High | 0.1744 | 3.03 |
| Input 5 | Low | 0.1768 | 3.47 |
| Input 5 | High | 0.1744 | 3.03 |
| Output | Low | 0.1768 | 3.47 |
| Output | High | 0.1744 | 3.03 |
| No. | Number of Modules | Number of Layers | Number of Neurons | Duration | Prediction Error |
|---|---|---|---|---|---|
| 1 | 2 | 2 | 4, 16 6, 18 | 02:10:20 | 0.012822 |
| 2 | 5 | 2 | 10, 25 17, 15 3, 21 28, 5 27, 22 | 01:52:29 | 0.011105 |
| 3 | 2 | 2 | 11, 24 5, 10 | 02:28:23 | 0.0097645 |
| 4 | 2 | 3 | 14, 12, 13 6, 16, 25 | 03:19:40 | 0.012315 |
| 5 | 3 | 3 | 21, 13, 18 17, 15, 18 16, 21, 25 | 02:47:33 | 0.011532 |
| 6 | 2 | 2 | 17, 15 7, 25 | 02:13:08 | 0.012379 |
| 7 | 2 | 2 | 21, 16 21, 28 | 03:32:07 | 0.0089454 |
| 8 | 3 | 2 | 7, 22, 21 8, 5, 26 5, 14, 25 | 02:10:05 | 0.012167 |
| 9 | 2 | 2 | 8, 10 21, 7 | 02:25:09 | 0.011937 |
| 10 | 2 | 3 | 19, 23, 22 17, 13, 17 | 02:17:25 | 0.010537 |
| No. | Prediction Error with the Type-1 Fuzzy System |
|---|---|
| 1 | 0.1709 |
| 2 | 0.1768 |
| 3 | 0.4786 |
| 4 | 0.4441 |
| 5 | 0.1458 |
| 6 | 0.1799 |
| 7 | 0.3935 |
| 8 | 0.1582 |
| 9 | 0.4705 |
| 10 | 0.3970 |
| No. | Scale 0.9, Lag 0.1 | Scale 0.9, Lag 0.9 | Scale 0.7, Lag 0.3 | Scale 0.3, Lag 0.7 | Scale 0.3, Lag 0.4 | Scale 0.4, Lag 0.3 | Scale 0.6, Lag 0.4 | Scale 0.4, Lag 0.6 | Scale 0.3, Lag 0.3 | Scale 0.4, Lag 0.4 | Scale 0.5, Lag 0.5 |
|---|---|---|---|---|---|---|---|---|---|---|---|
| 1 | 0.3354 | 0.3358 | 0.3359 | 0.3350 | 0.3350 | 0.3353 | 0.3352 | 0.3351 | 0.3352 | 0.3353 | 0.3352 |
| 00:00:00 | 00:00:00 | 00:00:00 | 00:00:00 | 00:00:00 | 00:00:01 | 00:00:00 | 00:00:00 | 00:00:00 | 00:00:00 | 00:00:00 | |
| 2 | 0.3388 | 0.3352 | 0.3391 | 0.3361 | 0.3338 | 0.3337 | 0.3390 | 0.3372 | 0.3385 | 03385 | 0.3383 |
| 00:00:01 | 00:00:01 | 00:00:01 | 00:00:01 | 00:00:00 | 00:00:00 | 00:00:00 | 00:00:00 | 00:00:00 | 00:00:00 | 00:00:00 | |
| 3 | 0.3376 | 0.3378 | 0.3372 | 0.33442 | 0.3538 | 0.3471 | 0.3384 | 0.3542 | 0.3520 | 0.3453 | 0.34111 |
| 00:00:01 | 00:00:01 | 00:00:01 | 00:00:01 | 00:00:01 | 00:00:01 | 00:00:01 | 00:00:01 | 00:00:01 | 00:00:01 | 00:00:01 | |
| 4 | 0.3323 | 0.3352 | 0.3333 | 0.3344 | 0.3327 | 0.3321 | 0.3332 | 0.3336 | 0.3328 | 0.3322 | 0.3325 |
| 00:00:01 | 00:00:00 | 00:00:00 | 00:00:00 | 00:00:04 | 00:00:01 | 00:00:01 | 00:00:01 | 00:00:01 | 00:00:01 | 00:00:01 | |
| 5 | 0.3384 | 0.3361 | 0.3387 | 0.3389 | 0.3380 | 0.3386 | 0.3391 | 0.3392 | 0.3378 | 0.3388 | 0.3392 |
| 00:00:00 | 00:00:00 | 00:00:00 | 00:00:00 | 00:00:00 | 00:00:00 | 00:00:00 | 00:00:00 | 00:00:00 | 00:00:00 | 00:00:00 | |
| 6 | 0.5031 | 0.5921 | 0.5901 | 0.5903 | 0.5734 | 0.5546 | 0.5674 | 0.5879 | 0.5583 | 0.5711 | 0.5813 |
| 00:00:00 | 00:00:00 | 00:00:00 | 00:00:00 | 00:00:00 | 00:00:00 | 00:00:00 | 00:00:00 | 00:00:00 | 00:00:00 | 00:00:00 | |
| 7 | 0.4835 | 0.5921 | 0.5400 | 0.5920 | 0.5731 | 0.5495 | 0.5661 | 0.5906 | 0.5539 | 0.5704 | 0.5836 |
| 00:00:00 | 00:00:00 | 00:00:03 | 00:00:01 | 00:00:01 | 00:00:01 | 00:00:01 | 00:00:01 | 00:00:01 | 00:00:01 | 00:00:01 | |
| 8 | 0.3266 | 0.3349 | 0.3320 | 0.3300 | 0.3273 | 0.3267 | 0.3262 | 0.3282 | 0.3270 | 0.3288 | 0.3269 |
| 00:00:00 | 00:00:01 | 00:0:01 | 00:000 | 00:00:00 | 00:00:00 | 00:00:01 | 00:00:01 | 00:00:00 | 00:00:00 | 00:00:00 | |
| 9 | 0.3348 | 0.3352 | 0.3347 | 0.3348 | 0.3347 | 0.3357 | 0.3346 | 0.3342 | 0.3341 | 0.3345 | 0.3343 |
| 00:00:0. | 00:00:00 | 00:00:00 | 00:00:00 | 00:00:00 | 00:00:00 | 00:00:00 | 00:00:00 | 00:00:00 | 00:00:00 | 00:00:00 | |
| 10 | 0.3369 | 0.3385 | 0.3392 | 0.3394 | 0.3386 | 0.3389 | 0.3394 | 0.3368 | 0.3376 | 0.3384 | 0.3396 |
| 00:00:00 | 00:00:00 | 00:00:00 | 00:00:00 | 00:00:00 | 00:00:00 | 00:00:00 | 00:00:00 | 00:00:00 | 00:00:00 | 00:00:00 |
| No | Scale 0.9, Lag 0.1 | Scale 0.9, Lag 0.9 | Scale 0.7, Lag 0.3 | Scale 0.3, Lag 0.7 | Scale 0.3, Lag 0.4 | Scale 0.4, Lag 0.3 | Scale 0.6, Lag 0.4 | Scale 0.4, Lag 0.6 | Scale 0.3, Lag 0.3 | Scale 0.4, Lag 0.4 | Scale 0.5, Lag 0.5 |
|---|---|---|---|---|---|---|---|---|---|---|---|
| 1 | 0.5829 | 0.8406 | 0.6399 | 0.8208 | 0.7622 | 0.6931 | 0.6997 | 0.7978 | 0.7227 | 0.7374 | 0.7575 |
| 00:00:00 | 00:00:00 | 00:00:00 | 00:00:00 | 00:00:00 | 00:00:00 | 00:00:00 | 00:00:00 | 00:00:00 | 00:00:00 | 00:00:00 | |
| 2 | 0.2976 | 0.3265 | 0.3250 | 0.3256 | 0.3275 | 0.3280 | 0.3278 | 0.3276 | 0.3277 | 0.3288 | 0.3282 |
| 00:00:01 | 00:00:00 | 00:00:00 | 00:00:00 | 00:00:00 | 00:00:00 | 00:00:00 | 00:00:00 | 00:00:00 | 00:00:00 | 00:00:00 | |
| 3 | 0.5517 | 0.3278 | 0.4550 | 0.3418 | 0.4035 | 0.4390 | 0.4439 | 0.3916 | 0.4201 | 0.4211 | 0.4178 |
| 00:00:00 | 00:00:00 | 00:00:00 | 00:00:00 | 00:00:00 | 00:00:00 | 00:00:00 | 00:00:00 | 00:00:00 | 00:00:00 | 00:00:00 | |
| 4 | 0.5778 | 0.3276 | 0.4693 | 0.3280 | 0.3546 | 0.4121 | 0.3987 | 0.3317 | 0.3863 | 0.3694 | 0.3502 |
| 00:00:00 | 00:00:00 | 00:00:00 | 00:00:00 | 00:00:00 | 00:00:00 | 00:00:00 | 00:00:00 | 00:00:00 | 00:00:00 | 00:00:00 | |
| 5 | 0.5245 | 0.3280 | 0.4562 | 0.3517 | 0.3818 | 0.4139 | 0.4220 | 0.3748 | 0.3934 | 0.3984 | 0.3975 |
| 00:00:00 | 00:00:00 | 00:00:00 | 00:00:00 | 00:00:00 | 00:00:00 | 00:00:00 | 00:00:00 | 00:00:00 | 00:00:00 | 00:00:00 | |
| 6 | 0.5929 | 0.8421 | 0.6139 | 0.8259 | 0.7240 | 0.6595 | 0.6458 | 0.7813 | 0.6907 | 0.6895 | 0.7078 |
| 00:00:00 | 00:00:00 | 00:00:00 | 00:00:00 | 00:00:00 | 00:00:00 | 00:00:00 | 00:00:00 | 00:00:00 | 00:00:00 | 00:00:00 | |
| 7 | 0.5030 | 0.8400 | 0.5588 | 0.7723 | 0.6817 | 0.6120 | 0.6075 | 0.7160 | 0.6466 | 0.6484 | 0.6617 |
| 00:00:00 | 00:00:00 | 00:00:00 | 00:00:00 | 00:00:00 | 00:00:00 | 00:00:00 | 00:00:00 | 00:00:00 | 00:00:00 | 00:00:00 | |
| 8 | 0.5814 | 0.3276 | 0.4807 | 0.3347 | 0.3784 | 0.4327 | 0.4326 | 0.3568 | 0.4058 | 0.4058 | 0.3900 |
| 00:00:00 | 00:00:00 | 00:00:00 | 00:00:00 | 00:00:00 | 00:00:00 | 00:00:00 | 00:00:00 | 00:00:00 | 00:00:00 | 00:00:00 | |
| 9 | 0.5858 | 0.3276 | 0.5410 | 0.3321 | 0.4566 | 0.5137 | 0.5055 | 0.3756 | 0.4944 | 0.4799 | 0.4518 |
| 00:00:00 | 00:00:00 | 00:00:00 | 00:00:00 | 00:00:00 | 00:00:00 | 00:00:00 | 00:00:00 | 00:00:00 | 00:00:00 | 00:00:00 | |
| 10 | 0.5220 | 0.3305 | 0.3639 | 0.3649 | 0.4035 | 0.4390 | 0.4439 | 0.3578 | 0.4201 | 0.4211 | 0.4178 |
| 00:00:00 | 00:00:00 | 00:00:00 | 00:00:00 | 00:00:00 | 00:00:00 | 00:00:00 | 00:00:00 | 00:00:00 | 00:00:00 | 00:00:00 |
| No. | Scale 0.9, Lag 0.1 | Scale 0.9, Lag 0.9 | Scale 0.7, Lag 0.3 | Scale 0.3, Lag 0.7 | Scale 0.3, Lag 0.4 | Scale 0.4, Lag 0.3 | Scale 0.6, Lag0.4 | Scale 0.4, Lag 0.6 | Scale 0.3, Lag 0.3 | Scale 0.4, Lag 0.4 | Scale 0.5, Lag 0.5 |
|---|---|---|---|---|---|---|---|---|---|---|---|
| 1 | 0.3489 | 0.3524 | 0.3508 | 0.3521 | 0.3517 | 0.3511 | 0.3514 | 0.3508 | 0.3513 | 0.3513 | 0.3509 |
| 00:02:15 | 00:01:23 | 00:01:50 | 00:01:34 | 00:01:43 | 00:01:48 | 00:01:39 | 00:01:45 | 00:01:48 | 00:01:55 | 00:01:59 | |
| 2 | 0.31333 | 0.3136 | 0.3133 | 00:3134 | 0.3134 | 0.3134 | 0.3133 | 0.3134 | 0.3134 | 0.3134 | 0.3134 |
| 00:09:45 | 00:05:24 | 00:07:58 | 00:06:14 | 00:07:31 | 00:07:58 | 00:07:46 | 00:06:53 | 00:08:06 | 00:08:56 | 00:08:05 | |
| 3 | 0.4234 | 0.4073 | 0.4248 | 0.4206 | 0.4233 | 0.4240 | 0.4247 | 0.4228 | 0.4234 | 0.4239 | 0.4241 |
| 00:57:04 | 00:47:51 | 00:01:52 | 00:01:38 | 00:01:52 | 00:01:56 | 00:01:50 | 00:01:41 | 00:01:45 | 00:01:49 | 00:01:36 | |
| 4 | 0.3684 | 0.3544 | 0.3689 | 0.3643 | 0.3683 | 0.3690 | 0.3680 | 0.3659 | 0.3690 | 0.3682 | 0.3670 |
| 00:01:34 | 00:00:49 | 00:01:12 | 00:00:57 | 00:01:10 | 00:01:15 | 00:01:03 | 00:01:10 | 00:01:22 | 00:01:36 | 00:00:40 | |
| 5 | 0.2951 | 0.2836 | 0.2915 | 0.2861 | 0.2900 | 0.2916 | 0.2900 | 0.2874 | 0.2915 | 0.2900 | 0.2887 |
| 00:01:38 | 00:01:49 | 00:02:12 | 00:01:58 | 00:01:25 | 00:01:18 | 00:01:55 | 00:01:12 | 00:01:26 | 00:01:31 | 00:00:43 | |
| 6 | 0.7373 | 0.7269 | 0.7276 | 0.7245 | 0.7255 | 0.7267 | 0.7246 | 0.7259 | 0.7264 | 0.7256 | 0.7250 |
| 00:00:36 | 00:00:36 | 00:36:36 | 00:00:55 | 00:00:55 | 00:00:54 | 00:00:54 | 00:00:53 | 00:00:54 | 00:00:51 | 00:00:53 | |
| 7 | 0.7092 | 0.6945 | 0.6965 | 0.6900 | 0.6940 | 0.6963 | 0.6936 | 0.6904 | 0.6963 | 0.6938 | 0.6917 |
| 00:00:56 | 00:00:42 | 00:00:50 | 00:00:44 | 00:00:49 | 00:00:51 | 00:00:49 | 00:00:47 | 00:00:48 | 00:00:44 | 00:00:52 | |
| 8 | 0.3084 | 0.3075 | 0.3096 | 0.3093 | 0.3092 | 0.3094 | 0.3096 | 0.3093 | 0.3093 | 0.3094 | 0.3095 |
| 00:46:28 | 00:400:08 | 00:45:19 | 00:41: | 00:44:34 | 00:43:44 | 00:00:49 | 00:42:38 | 00:44:48 | 00:49:44 | 00:42:43 | |
| 9 | 0.3595 | 0.3539 | 0.3588 | 0.3570 | 0.3588 | 0.3591 | 0.3582 | 0.3573 | 0.3593 | 0.3586 | 0.3577 |
| 00:01:41 | 00:00:59 | 00:01:25 | 00:01:07 | 00:01:22 | 00:01:27 | 00:01:22 | 00:01:11 | 00:01:36 | 00:01:38 | 00:01:25 | |
| 10 | 0.3335 | 0.3426 | 0.3349 | 0.3386 | 0.3374 | 0.3361 | 0.3352 | 0.3317 | 0.3368 | 0.3365 | 0.3358 |
| 00:01:30 | 00:01:08 | 00:01:22 | 00:01:13 | 00:01:21 | 00:01:25 | 00:01:20 | 00:01:15 | 00:01:22 | 00:01:26 | 00:01:33 |
| No. | Scale 0.9, Lag 0.1 | Scale 0.9, Lag 0.9 | Scale 0.7, Lag 0.3 | Scale 0.3, Lag 0.7 | Scale 0.3, Lag 0.4 | Scale 0.4, Lag 0.3 | Scale 0.6, Lag 0.4 | Scale 0.4, Lag 0.6 | Scale 0.3, Lag 0.3 | Scale 0.4, Lag 0.4 | Scale 0.5, Lag 0.5 |
|---|---|---|---|---|---|---|---|---|---|---|---|
| 1 | 0.8817 | 0.8598 | 0.8802 | 0.8270 | 0.8764 | 0.8786 | 0.8790 | 0.8752 | 0.8776 | 0.8776 | 0.8774 |
| 00:00:03 | 00:00:09 | 00:00:02 | 00:00:03 | 00:00:03 | 00:00:03 | 00:00:03 | 00:00:03 | 00:00:03 | 00:00:03 | 00:00:03 | |
| 2 | 0.2750 | 0.3267 | 0.2778 | 0.3137 | 0.3006 | 0.2895 | 0.2844 | 0.3033 | 0.2963 | 0.2939 | 0.2931 |
| 00:00:05 | 00:00:06 | 00:00:05 | 00:00:06 | 00:00:05 | 00:00:05 | 00:00:05 | 00:00:06 | 00:00:06 | 00:00:05 | 00:00:05 | |
| 3 | 0.3604 | 0.3512 | 0.3607 | 0.3581 | 0.3595 | 0.3602 | 0.3605 | 0.3594 | 0.3597 | 0.3600 | 0.3602 |
| 00:00:03 | 00:00:04 | 00:00:03 | 00:00:03 | 00:00:03 | 00:00:03 | 00:00:22 | 00:00:03 | 00:00:05 | 00:00:04 | 00:00:04 | |
| 4 | 0.3455 | 0.3578 | 0.3550 | 0.3639 | 0.3605 | 0.3579 | 0.3620 | 0.3666 | 0.3583 | 0.3600 | 0.3602 |
| 00:00:07 | 00:00:04 | 00:00:03 | 00:00:03 | 00:00:03 | 00:00:04 | 00:00:04 | 00:00:04 | 00:00:04 | 00:00:04 | 00:00:04 | |
| 5 | 0.2966 | 0.2870 | 0.2939 | 0.2885 | 0.2908 | 0.2922 | 0.2927 | 0.2900 | 0.2915 | 0.2915 | 0.2914 |
| 00:00:04 | 00:00:00 | 00:00:00 | 00:00:04 | 00:00:04 | 00:00:04 | 00:00:05 | 00:00:04 | 00:00:04 | 00:00:04 | 00:00:04 | |
| 6 | 0.8772 | 0.8708 | 0.8806 | 0.8805 | 0.8806 | 0.88004 | 0.8814 | 0.8816 | 0.8814 | 0.8815 | 0.8814 |
| 00:00:05 | 00:00:04 | 00:00:04 | 00:00:04 | 00:00:04 | 00:00:04 | 00:00:04 | 00:00:05 | 00:00:05 | 00:00:05 | 00:00:05 | |
| 7 | 0.8631 | 0.8622 | 0.8631 | 0.8805 | 0.8806 | 0.8804 | 0.8675 | 0.8684 | 0.8727 | 0.8729 | 0.8730 |
| 00:00:05 | 00:00:05 | 00:00:04 | 00:00:04 | 00:00:05 | 00:00:04 | 00:00:04 | 00:00:04 | 00:00:05 | 00:00:05 | 00:00:05 | |
| 8 | 0.2925 | 0.2713 | 0.2775 | 0.2644 | 0.2685 | 0.2732 | 0.2727 | 0.2650 | 0.2970 | 0.2963 | 0.2952 |
| 00:00:06 | 00:00:06 | 00:00:06 | 00:00:06 | 00:00:06 | 00:00:06 | 00:00:09 | 00:00:08 | 00:00:04 | 00:00:04 | 00:00:04 | |
| 9 | 0.3292 | 0.3372 | 0.3374 | 0.3428 | 0.3421 | 0.3402 | 0.3409 | 0.3437 | 0.3630 | 0.3641 | 0.3653 |
| 00:00:05 | 00:00:04 | 00:00:04 | 00:00:04 | 00:00:05 | 00:00:04 | 00:00:04 | 00:00:04 | 00:00:04 | 00:00:04 | 00:00:04 | |
| 10 | 0.3232 | 0.3396 | 0.3330 | 0.3426 | 0.3403 | 0.3372 | 0.3376 | 0.34524 | 0.3624 | 0.3634 | 0.3645 |
| 00:00:04 | 00:00:04 | 00:00:04 | 00:00:04 | 00:00:04 | 00:00:04 | 00:00:04 | 00:00:06 | 00:00:06 | 00:00:06 | 00:00:06 |
| No. | Number of Modules | Number of Layers | Number of Neurons | Duration | Prediction Error |
|---|---|---|---|---|---|
| 1 | 2 | 1 | 25 4 | 01:42:04 | 0.0091663 |
| 2 | 2 | 2 | 24, 14 15, 16 | 03:34:29 | 0.010287 |
| 3 | 2 | 2 | 25, 3 7, 9 | 02:19:37 | 0.010775 |
| 4 | 2 | 2 | 26, 22 29, 9 | 02:50:23 | 0.010387 |
| 5 | 5 | 1 | 22 16 10 23 21 | 01:56:09 | 0.0092708 |
| 6 | 2 | 2 | 17, 13 15, 14 | 02:10:15 | 0.0095233 |
| 7 | 3 | 3 | 13, 22, 23 16, 24, 11 12, 15, 27 | 02:31:09 | 0.010413 |
| 8 | 2 | 1 | 18 25 | 01:40:06 | 0.0081367 |
| 9 | 2 | 2 | 12, 11 6, 18 | 01:39:23 | 0.0079875 |
| 10 | 3 | 1 | 19 8 28 | 02:49:11 | 0.01007 |
| No. | Prediction Error with the Type-1 Fuzzy System |
|---|---|
| 1 | 0.8726 |
| 2 | 0.8552 |
| 3 | 0.8565 |
| 4 | 0.4554 |
| 5 | 0.6590 |
| 6 | 0.3870 |
| 7 | 0.5470 |
| 8 | 0.8494 |
| 9 | 0.3826 |
| 10 | 0.5400 |
| No. | Scale 0.9, Lag 0.1 | Scale 0.9, Lag 0.9 | Scale 0.7, Lag 0.3 | Scale 0.3, Lag 0.7 | Scale 0.3, Lag 0.4 | Scale 0.4, Lag 0.3 | Scale 0.6, Lag 0.4 | Scale 0.4, Lag 0.6 | Scale 0.3, Lag 0.3 | Scale 0.4, Lag 0.4 | Scale 0.5, Lag 0.5 |
|---|---|---|---|---|---|---|---|---|---|---|---|
| 1 | 0.4921 | 0.4921 | 0.4921 | 0.4921 | 0.3885 | 0.4921 | 0.4921 | 0.4921 | 0.4921 | 0.4921 | 0.4921 |
| 00:00:00 | 00:00:00 | 00:00:00 | 00:00:00 | 00:00:00 | 00:00:00 | 00:00:00 | 00:00:00 | 00:00:00 | 00:00:00 | 00:00:00 | |
| 2 | 0.4893 | 0.4905 | 0.4831 | 0.4921 | 0.4674 | 0.4921 | 0.4661 | 0.4771 | 0.4921 | 0.4921 | 0.471 |
| 00:00:00 | 00:00:00 | 00:00:00 | 00:00:00 | 00:00:00 | 00:00:00 | 00:00:00 | 00:00:00 | 00:00:00 | 00:00:00 | 00:00:00 | |
| 3 | 0.4655 | 0.4665 | 0.4829 | 0.4880 | 0.4852 | 0.4835 | 0.4848 | 0.4869 | 0.4837 | 0.4850 | 0.4858 |
| 00:00:00 | 00:00:00 | 00:00:00 | 00:00:00 | 00:00:00 | 00:00:00 | 00:00:00 | 00:00:00 | 00:00:00 | 00:00:00 | 00:00:00 | |
| 4 | 0.3752 | 0.3808 | 0.3792 | 0.3744 | 0.3778 | 0.3763 | 0.3783 | 0.3748 | 0.3770 | 0.3771 | 0.3763 |
| 00:00:00 | 00:00:00 | 00:00:00 | 00:00:00 | 00:00:00 | 00:00:00 | 00:00:00 | 00:00:00 | 00:00:00 | 00:00:00 | 00:00:00 | |
| 5 | 0.5921 | 0.5447 | 0.5358 | 0.5914 | 0.5672 | 0.5435 | 0.5603 | 0.5891 | 0.5472 | 0.5644 | 0.5796 |
| 00:00:01 | 00:00:00 | 00:00:00 | 00:00:00 | 00:00:00 | 00:00:00 | 00:00:00 | 00:00:00 | 00:00:00 | 00:00:00 | 00:00:00 | |
| 6 | 0.3870 | 0.3639 | 0.3832 | 0.3832 | 0.3787 | 0.3759 | 0.3784 | 0.3815 | 0.3762 | 0.3817 | 0.3801 |
| 00:00:00 | 00:00:00 | 00:00:00 | 00:00:00 | 00:00:00 | 00:00:00 | 00:00:00 | 00:00:00 | 00:00:00 | 00:00:00 | 00:00:00 | |
| 7 | 0.4835 | 0.5921 | 0.5400 | 0.5920 | 0.5713 | 0.5495 | 0.5988 | 0.5566 | 0.5539 | 0.5704 | 0.5836 |
| 00:00:00 | 00:00:00 | 00:00:00 | 00:00:00 | 00:00:00 | 00:00:00 | 00:00:00 | 00:00:00 | 00:00:00 | 00:00:00 | 00:00:00 | |
| 8 | 0.4915 | 0.4912 | 0.4909 | 0.4908 | 0.4909 | 0.4904 | 0.3542 | 0.3566 | 0.3548 | 0.3542 | 0.4909 |
| 00:00:00 | 00:00:00 | 00:00:00 | 00:00:00 | 00:00:00 | 00:00:00 | 00:00:00 | 00:00:00 | 00:00:00 | 00:00:00 | 00:00:00 | |
| 9 | 0.3791 | 0.3793 | 0.3789 | 0.3715 | 0.3781 | 0.3727 | 0.3774 | 0.3806 | 0.3733 | 0.3778 | 0.3806 |
| 00:00:00 | 00:00:00 | 00:00:00 | 00:00:00 | 00:00:00 | 00:00:00 | 00:00:00 | 00:00:00 | 00:00:00 | 00:00:00 | 00:00:00 | |
| 10 | 0.5421 | 0.5736 | 0.5480 | 0.5733 | 0.5414 | 0.5739 | 0.5426 | 0.5426 | 0.5435 | 0.5410 | 0.5392 |
| 00:00:00 | 00:00:00 | 00:00:00 | 00:00:00 | 00:00:00 | 00:00:00 | 00:00:00 | 00:00:00 | 00:00:00 | 00:00:00 | 00:00:00 |
| No. | Scale 0.9, Lag 0.1 | Scale 0.9, Lag 0.9 | Scale 0.7, Lag 0.3 | Scale 0.3, Lag 0.7 | Scale 0.3, Lag 0.4 | Scale 0.4, Lag 0.3 | Scale 0.6, Lag 0.4 | Scale 0.4, Lag 0.6 | Scale 0.3, Lag 0.3 | Scale 0.4, Lag 0.4 | Scale 0.5, Lag 0.5 |
|---|---|---|---|---|---|---|---|---|---|---|---|
| 1 | 0.5829 | 0.8406 | 0.6399 | 0.8208 | 0.7622 | 0.6931 | 0.6997 | 0.7879 | 0.7227 | 0.7473 | 0.7475 |
| 00:00:00 | 00:00:00 | 00:00:00 | 00:00:00 | 00:00:00 | 00:00:00 | 00:00:00 | 00:00:00 | 00:00:00 | 00:00:00 | 00:00:00 | |
| 2 | 0.5016 | 0.8421 | 0.5890 | 0.8134 | 0.7098 | 0.6334 | 0.6517 | 0.7646 | 0.6621 | 0.6840 | 0.7101 |
| 00:00:00 | 00:00:00 | 00:00:00 | 00:00:00 | 00:00:00 | 00:00:00 | 00:00:00 | 00:00:00 | 00:00:00 | 00:00:00 | 00:00:00 | |
| 3 | 0.5686 | 0.8402 | 0.6302 | 0.8266 | 0.7707 | 0.6931 | 0.6987 | 0.8052 | 0.7278 | 0.7430 | 0.7649 |
| 00:00:00 | 00:00:00 | 00:00:00 | 00:00:00 | 00:00:00 | 00:00:00 | 00:00:00 | 00:00:00 | 00:00:00 | 00:00:00 | 00:00:00 | |
| 4 | 0.5882 | 0.3282 | 0.5126 | 0.3549 | 0.4284 | 0.4814 | 0.4749 | 0.3916 | 0.4598 | 0.4492 | 0.4332 |
| 00:00:00 | 00:00:00 | 00:00:00 | 00:00:00 | 00:00:00 | 00:00:00 | 00:00:00 | 00:00:00 | 00:00:00 | 00:00:00 | 00:00:00 | |
| 5 | 0.5709 | 0.8391 | 0.6350 | 0.8186 | 0.7586 | 0.6828 | 0.7026 | 0.7952 | 0.7119 | 0.7351 | 0.7576 |
| 00:00:00 | 00:00:00 | 00:00:00 | 00:00:00 | 00:00:00 | 00:00:00 | 00:00:00 | 00:00:00 | 00:00:00 | 00:00:00 | 00:00:00 | |
| 6 | 0.5765 | 0.3277 | 0.4946 | 0.3486 | 0.4004 | 0.4492 | 0.4531 | 0.3768 | 0.4234 | 0.4225 | 0.4133 |
| 00:00:00 | 00:00:00 | 00:00:00 | 00:00:00 | 00:00:00 | 00:00:00 | 00:00:00 | 00:00:00 | 00:00:00 | 00:00:00 | 00:00:00 | |
| 7 | 0.5467 | 0.8491 | 0.6710 | 0.8043 | 0.7605 | 0.7143 | 0.7068 | 0.7753 | 0.7395 | 0.7379 | 0.7316 |
| 00:00:00 | 00:00:00 | 00:00:00 | 00:00:00 | 00:00:00 | 00:00:00 | 00:00:00 | 00:00:00 | 00:00:00 | 00:00:00 | 00:00:00 | |
| 8 | 1.018 | 0.8421 | 0.8481 | 0.8421 | 0.8422 | 0.8443 | 0.8424 | 0.8421 | 0.8434 | 0.8423 | 0.8434 |
| 00:00:00 | 00:00:00 | 00:00:00 | 00:00:00 | 00:00:00 | 00:00:00 | 00:00:00 | 00:00:00 | 00:00:00 | 00:00:00 | 00:00:00 | |
| 9 | 0.5858 | 0.3276 | 0.5410 | 0.3321 | 0.4566 | 0.5137 | 0.5055 | 0.3756 | 0.4944 | 0.4799 | 0.4518 |
| 00:00:00 | 00:00:00 | 00:00:00 | 00:00:00 | 00:00:00 | 00:00:00 | 00:00:00 | 00:00:00 | 00:00:00 | 00:00:00 | 00:00:00 | |
| 10 | 0.6199 | 0.6236 | 0.6155 | 0.8420 | 0.7115 | 0.6683 | 0.6803 | 0.7831 | 0.6994 | 0.71.5 | 0.7330 |
| 00:00:00 | 00:00:00 | 00:00:00 | 00:00:00 | 00:00:00 | 00:00:00 | 00:00:00 | 00:00:00 | 00:00:00 | 00:00:00 | 00:00:00 |
| No. | Scale 0.9, Lag 0.1 | Scale 0.9, Lag 0.9 | Scale 0.7, Lag 0.3 | Scale 0.3, Lag 0.7 | Scale 0.3, Lag 0.4 | Scale 0.4, Lag 0.3 | Scale 0.6, Lag 0.4 | Scale 0.4, Lag 0.6 | Scale 0.3, Lag 0.3 | Scale 0.4, Lag 0.4. | Scale 0.5, Lag 0.5 |
|---|---|---|---|---|---|---|---|---|---|---|---|
| 1 | 0.4219 | 0.4400 | 0.4210 | 0.4265 | 0.4237 | 0.4225 | 0.4212 | 0.4236 | 0.4233 | 0.4227 | 0.4220 |
| 00:06:14 | 00:04:28 | 00:05:50 | 00:05:03 | 00:5:40 | 00:05:57 | 00:05:35 | 00:05:17 | 00:05:56 | 00:05:44 | 00:05:32 | |
| 2 | 0.1755 | 0.2109 | 0.1820 | 0.1952 | 0.1869 | 0.1834 | 0.1846 | 0.1908 | 0.1841 | 0.1860 | 0.1875 |
| 00:06:07 | 00:03:40 | 00:05:11 | 00:04:12 | 00:05:04 | 00:05:17 | 00:05:02 | 00:04:33 | 00:05:23 | 00:05:01 | 00:04:41 | |
| 3 | 0.1718 | 01898 | 0.1708 | 0.1771 | 0.1725 | 0.1715 | 0.1714 | 0.1743 | 0.1719 | 0.1721 | 0.1726 |
| 00:08:07 | 00:04:53 | 00:06:53 | 00:05:34 | 00:06:38 | 00:07:01 | 00:06:35 | 00:05:53 | 00:07:01 | 00:06:37 | 00:06:15 | |
| 4 | 0.4273 | 0.4461 | 0.4253 | 0.4305 | 0.4292 | 0.4279 | 0.4250 | 0.427 | 0.4292 | 0.4275 | 0.4256 |
| 00:05:38 | 00:03:57 | 00:05:05 | 00:04:22 | 00:04:59 | 00:05:10 | 00:04:55 | 00:04:33 | 00:05:11 | 00:04:55 | 00:04:44 | |
| 5 | 0.2942 | 0.3082 | 0.2977 | 0.3041 | 0.2993 | 0.2977 | 0.2993 | 0.3025 | 0.2076 | 0.2994 | 0.3010 |
| 00:05:40 | 00:03:24 | 00:04:44 | 00:03:46 | 00:04:27 | 16:35:04 | 00:04:33 | 00:05:27 | 00:04:41 | 00:04:25 | 00:04:16 | |
| 6 | 0.1602 | 0.1730 | 0.1594 | 0.1645 | 0.1609 | 0.1600 | 0.1601 | 0.1626 | 0.1603 | 0.1606 | 0.1611 |
| 00:03:42 | 00:02:22 | 00:03:19 | 00:02:42 | 00:03:08 | 00:03:25 | 00:03:05 | 00:02:47 | 00:03:25 | 00:03:09 | 00:06:44 | |
| 7 | 0.1649 | 0.1930 | 0.1678 | 0.1783 | 0.1717 | 0.1689 | 0.1699 | 0.1747 | 0.1695 | 0.1709 | 0.1719 |
| 00:06:37 | 00:02:50 | 00:04:36 | 00:03:30 | 00:04:29 | 00:04:48 | 00:04:17 | 00:03:39 | 00:04:41 | 00:04:25 | 00:03:59 | |
| 8 | 0.3513 | 0.3432 | 0.3537 | 0.3536 | 0.3513 | 0.3515 | 0.3550 | 0.3554 | 0.3504 | 0.3528 | 0.3521 |
| 00:01:23 | 00:01:21 | 00:01:21 | 00:01:21 | 00:01:22 | 00:01:22 | 00:01:22 | 00:01:22 | 00:01:22 | 00:01:22 | 00:01:22 | |
| 9 | 0.3513 | 0.3432 | 0.3537 | 0.3536 | 0.3513 | 0.3515 | 0.3550 | 0.3554 | 0.3504 | 0.3528 | 0.3521 |
| 00:01:23 | 00:01:21 | 00:01:21 | 00:01:21 | 00:01:22 | 00:01:22 | 00:01:22 | 00:01:22 | 00:01:22 | 00:01:22 | 00:01:22 | |
| 10 | 0.1755 | 0.2061 | 0.1782 | 0.1897 | 0.1824 | 0.1798 | 0.1800 | 0.1854 | 0.1801 | 00:18:14 | 0.1823 |
| 00:04:53 | 00:02:48 | 00:09:30 | 00:06:32 | 00:03:56 | 00:04:19 | 00:04:03 | 00:03:33 | 00:04:10 | 00:03:55 | 00:03:45 |
| No. | Scale 0.9, Lag 0.1 | Scale 0.9, Lag 0.9 | Scale 0.7, Lag 0.3 | Scale 0.3, Lag 0.7 | Scale 0.3, Lag 0.4 | Scale 0.4, Lag 0.3 | Scale 0.6, Lag 0.4 | Scale 0.4, Lag 0.6 | Scale 0.3, Lag 0.3 | Scale 0.4, Lag 0.4 | Scale 0.5, Lag 0.5 |
|---|---|---|---|---|---|---|---|---|---|---|---|
| 1 | 0.8817 | 0.8598 | 0.8818 | 0.8720 | 0.8764 | 0.8786 | 0.8790 | 0.8752 | 0.8776 | 0.8776 | 0.8774 |
| 00:00:03 | 00:00:03 | 00:00:03 | 00:00:03 | 00:00:03 | 00:00:03 | 00:00:03 | 00:00:03 | 00:00:03 | 00:00:03 | 00:00:03 | |
| 2 | 0.8766 | 0.8545 | 0.8745 | 0.8644 | 0.8692 | 0.8720 | 0.8725 | 0.8676 | 0.8707 | 0.8706 | 0.8702 |
| 00:00:03 | 00:00:03 | 00:00:03 | 00:00:03 | 00:00:03 | 00:00:03 | 00:00:03 | 00:00:03 | 00:00:03 | 00:00:03 | 00:00:03 | |
| 3 | 0.8811 | 0.8606 | 0.8794 | 0.8717 | 0.8759 | 0.8780 | 0.8782 | 0.8746 | 0.8771 | 0.8769 | 0.8767 |
| 00:00:02 | 00:00:03 | 00:00:03 | 00:00:03 | 00:00:03 | 00:00:03 | 00:00:03 | 00:00:03 | 00:00:03 | 00:00:03 | 00:00:03 | |
| 4 | 0.3518 | 0.3505 | 0.3595 | 0.3617 | 0.3626 | 0.3615 | 0.3626 | 0.3638 | 0.3618 | 0.3629 | 0.3641 |
| 00:00:03 | 00:00:03 | 00:00:03 | 00:00:03 | 00:00:03 | 00:00:03 | 00:00:03 | 00:00:03 | 00:00:18 | 00:00:03 | 00:00:03 | |
| 5 | 0.6581 | 0.8419 | 0.7462 | 0.8268 | 0.8156 | 0.7926 | 0.8218 | 0.8189 | 0.8063 | 0.8059 | 0.8068 |
| 00:00:08 | 00:00:15 | 00:00:08 | 00:00:09 | 00:00:09 | 00:00:09 | 00:00:09 | 00:00:09 | 00:00:09 | 00:00:09 | 00:00:09 | |
| 6 | 0.3484 | 0.3599 | 0.3587 | 0.3670 | 0.3640 | 0.3614 | 0.3630 | 0.3672 | 0.3600 | 0.3639 | 0.3660 |
| 00:00:03 | 00:00:03 | 00:00:03 | 00:00:03 | 00:00:06 | 00:00:03 | 00:00:03 | 00:00:03 | 00:00:03 | 00:00:03 | 00:00:03 | |
| 7 | 0.5350 | 0.6907 | 0.5466 | 0.6031 | 0.5734 | 0.5557 | 0.5580 | 0.5838 | 0.5642 | 0.5657 | 0.5681 |
| 00:00:05 | 00:00:05 | 00:00:04 | 00:00:05 | 00:00:05 | 00:00:05 | 00:00:05 | 00:00:05 | 00:00:05 | 00:00:03 | 00:00:03 | |
| 8 | 0.9292 | 0.8716 | 0.9201 | 0.8933 | 0.9048 | 0.9124 | 0.9139 | 0.9006 | 0.9087 | 0.9085 | 0.9073 |
| 00:00:03 | 00:00:03 | 00:00:02 | 00:00:02 | 00:00:03 | 00:00:03 | 00:00:03 | 00:00:06 | 00:00:03 | 00:00:03 | 00:00:03 | |
| 9 | 0.3592 | 0.3498 | 0.3612 | 0.3625 | 0.3634 | 0.3629 | 0.3639 | 0.3648 | 0.3630 | 0.3641 | 0.3653 |
| 00:00:03 | 00:00:03 | 00:00:03 | 00:00:03 | 00:00:03 | 00:00:03 | 00:00:03 | 00:00:03 | 00:00:03 | 00:00:03 | 00:00:03 | |
| 10 | 0.5404 | 0.6897 | 0.5730 | 0.5786 | 0.5512 | 0.5422 | 0.5389 | 0.5577 | 0.5467 | 0.5450 | 0.5425 |
| 00:00:05 | 00:00:05 | 00:00:04 | 00:00:05 | 00:00:05 | 00:00:05 | 00:00:05 | 00:00:05 | 00:00:05 | 00:00:03 | 00:00:05 |
| Type of Fuzzy System | N | Mean | Standard Deviation |
|---|---|---|---|
| Mamdani type-2 | 29 | 0.3667 | 0.00660 |
| Mamdani type-3 | 29 | 0.3510 | 0.10200 |
| Type of Fuzzy System | N | Mean | Standard Deviation |
|---|---|---|---|
| Sugeno type-2 | 29 | 0.3960 | 0.1150 |
| Sugeno type-3 | 29 | 0.4080 | 0.1850 |
| Type of Fuzzy System | N | Mean | Standard Deviation |
|---|---|---|---|
| Mamdani Type 2 | 29 | 0.4307 | 0.0680 |
| Mamdani Type 3 | 29 | 0.2740 | 0.1120 |
| Type of Fuzzy System | N | Mean | Standard Deviation |
|---|---|---|---|
| Sugeno Type 2 | 29 | 0.5170 | 0.1580 |
| Sugeno Type 3 | 29 | 0.4860 | 0.1940 |
| No. | Mamdani Type 1 | Mamdani Type 2 | Sugeno Type 2 | Mamdani Type 3 | Sugeno Type 3 |
|---|---|---|---|---|---|
| 1 | 0.8709 | 0.3354 | 0.5829 | 0.3489 | 0.8270 |
| 2 | 0.3768 | 0.3337 | 0.2976 | 0.3133 | 0.2750 |
| 3 | 0.4786 | 0.3442 | 0.3278 | 0.4073 | 0.3512 |
| 4 | 0.4441 | 0.3321 | 0.3276 | 0.3544 | 0.3455 |
| 5 | 0.3458 | 0.3361 | 0.3280 | 0.2836 | 0.2870 |
| 6 | 0.8799 | 0.5031 | 0.59290 | 0.7245 | 0.8708 |
| 7 | 0.8935 | 0.4835 | 0.5030 | 0.6900 | 0.8631 |
| 8 | 0.3582 | 0.3262 | 0.3276 | 0.3075 | 0.2644 |
| 9 | 0.4705 | 0.3341 | 0.3276 | 0.3579 | 0.3292 |
| 10 | 0.3970 | 0.3369 | 0.3305 | 0.3317 | 0.3232 |
| No. | Mamdani Type-1 | Mamdani Type-2 | Sugeno Type-2 | Mamdani Type-3 | Sugeno Type-3 |
|---|---|---|---|---|---|
| 1 | 0.8726 | 0.3885 | 0.5829 | 0.4210 | 0.8817 |
| 2 | 0.8552 | 0.4674 | 0.5016 | 0.1755 | 0.8545 |
| 3 | 0.8565 | 0.4655 | 0.5686 | 0.1708 | 0.8606 |
| 4 | 0.4554 | 0.3744 | 0.3282 | 0.4250 | 0.3505 |
| 5 | 0.6590 | 0.5358 | 0.5709 | 0.2076 | 0.6581 |
| 6 | 0.3870 | 0.3639 | 0.3768 | 0.1594 | 0.3484 |
| 7 | 0.5470 | 0.4835 | 0.5467 | 0.1649 | 0.5350 |
| 8 | 0.8494 | 0.3542 | 0.8421 | 0.3432 | 0.8716 |
| 9 | 0.3826 | 0.3715 | 0.3276 | 0.3432 | 0.3498 |
| 10 | 0.5400 | 0.5410 | 0.6155 | 0.1755 | 0.5404 |
Disclaimer/Publisher’s Note: The statements, opinions and data contained in all publications are solely those of the individual author(s) and contributor(s) and not of MDPI and/or the editor(s). MDPI and/or the editor(s) disclaim responsibility for any injury to people or property resulting from any ideas, methods, instructions or products referred to in the content. |
© 2024 by the authors. Licensee MDPI, Basel, Switzerland. This article is an open access article distributed under the terms and conditions of the Creative Commons Attribution (CC BY) license (https://creativecommons.org/licenses/by/4.0/).
Share and Cite
Pulido, M.; Melin, P.; Castillo, O.; Castro, J.R. Comparison of Interval Type-3 Mamdani and Sugeno Models for Fuzzy Aggregation Applied to Ensemble Neural Networks for Mexican Stock Exchange Time Series Prediction. Math. Comput. Appl. 2024, 29, 67. https://doi.org/10.3390/mca29040067
Pulido M, Melin P, Castillo O, Castro JR. Comparison of Interval Type-3 Mamdani and Sugeno Models for Fuzzy Aggregation Applied to Ensemble Neural Networks for Mexican Stock Exchange Time Series Prediction. Mathematical and Computational Applications. 2024; 29(4):67. https://doi.org/10.3390/mca29040067
Chicago/Turabian StylePulido, Martha, Patricia Melin, Oscar Castillo, and Juan R. Castro. 2024. "Comparison of Interval Type-3 Mamdani and Sugeno Models for Fuzzy Aggregation Applied to Ensemble Neural Networks for Mexican Stock Exchange Time Series Prediction" Mathematical and Computational Applications 29, no. 4: 67. https://doi.org/10.3390/mca29040067
APA StylePulido, M., Melin, P., Castillo, O., & Castro, J. R. (2024). Comparison of Interval Type-3 Mamdani and Sugeno Models for Fuzzy Aggregation Applied to Ensemble Neural Networks for Mexican Stock Exchange Time Series Prediction. Mathematical and Computational Applications, 29(4), 67. https://doi.org/10.3390/mca29040067