
Eco-Friendly Direct GC–MS Method for Estimation of Niacin and Related Impurities Involving Pyridine in Food Supplements


Abstract
1. Introduction
2. Experimental Analysis
2.1. Instruments
2.2. Materials and Reagents
2.2.1. Standards
2.2.2. Pharmaceutical Formulation
2.2.3. Chemicals and Solvents
2.3. Standard Solutions
2.3.1. Stock and Working Standard Solutions
2.3.2. Solutions of Pharmaceutical Formulation
2.4. Chromatographic Conditions
2.5. Calibration Curve Construction
2.6. Application to Pharmaceutical Formulation
3. Validation of the Newly Developed Method
3.1. Linearity
3.2. Accuracy
3.3. Precision
Repeatability
3.4. Intermediate Precision
3.5. Specificity
Limits of Detection and Quantitation (LOD and LOQ)
3.6. System Suitability
4. Results and Discussion
4.1. Method Development and Optimization
4.2. Results of Figures of Merit
4.3. Results of Assay of Dosage Form
4.4. Eco-Scale Assessment of Proposed Method
5. Conclusions
Supplementary Materials
Author Contributions
Funding
Institutional Review Board Statement
Informed Consent Statement
Data Availability Statement
Acknowledgments
Conflicts of Interest
Abbreviations
| GC–MS | Gas chromatography–mass spectrometry |
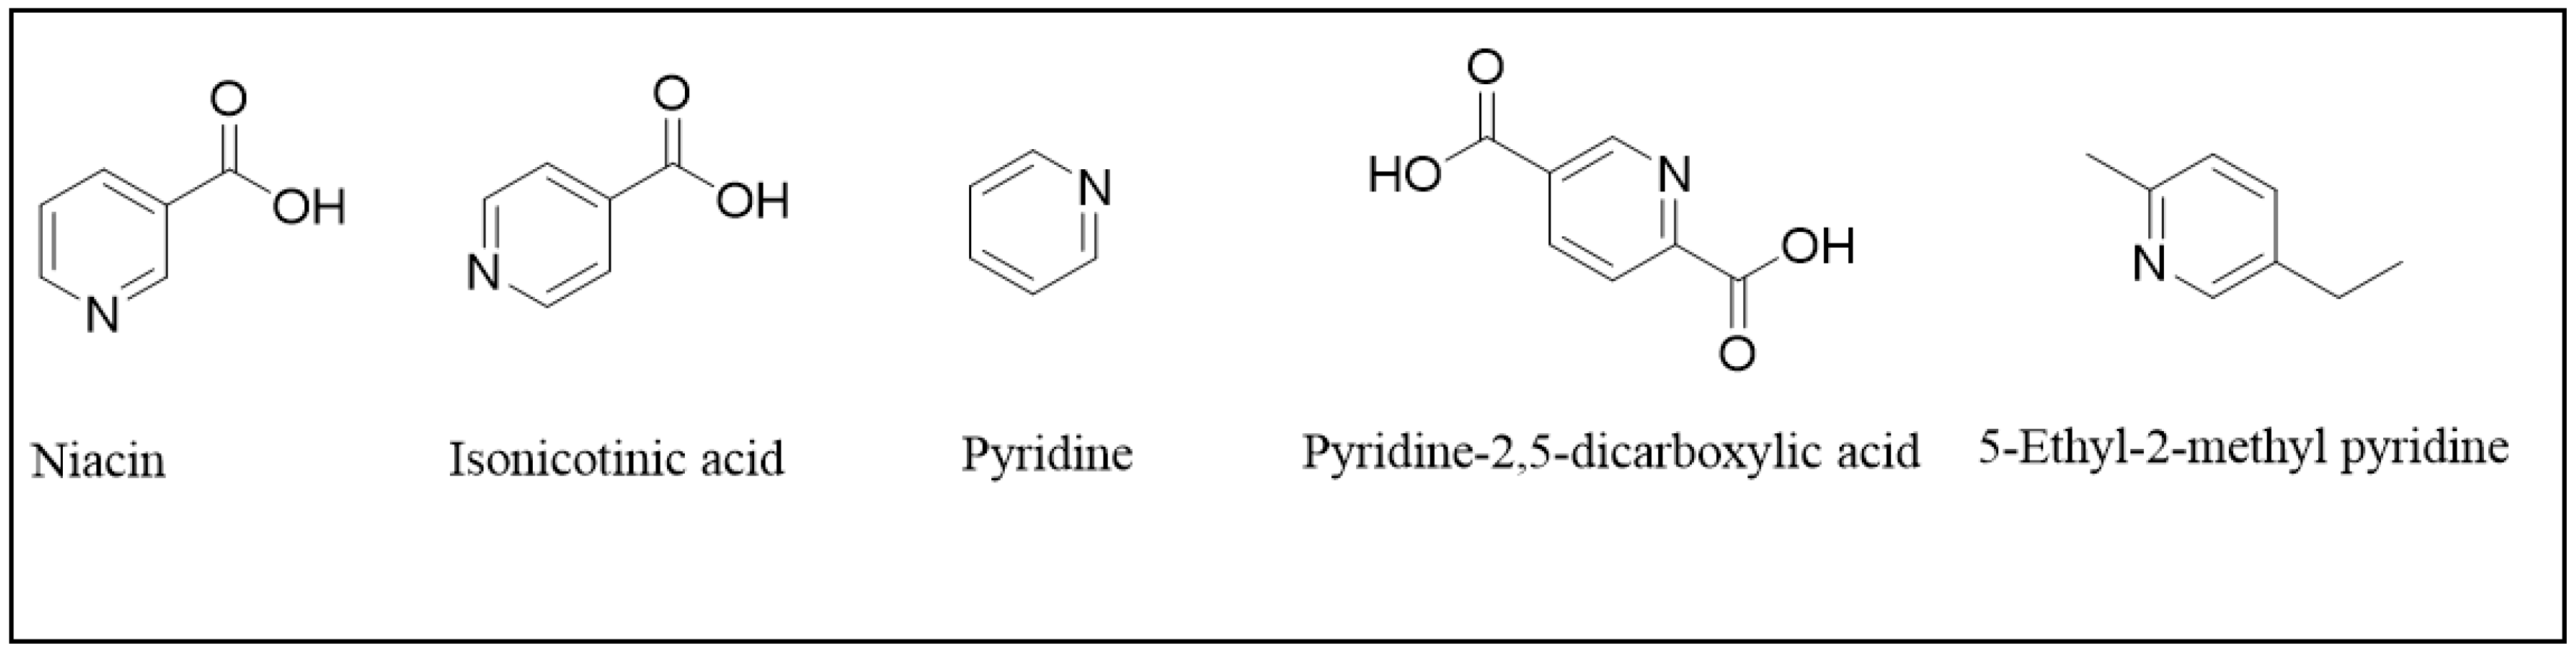
| ISO | isonicotinic acid |
| MP | 5-ethyl-2-methylpyridine |
| NIA | niacin |
| PCD | pyridine-2, 5-dicarboxylic acid |
| SIM | selected ion monitoring |
| USP | United States pharmacopeia |
References
- Her Majesty’s. The British Pharmacopoeia; The Stationary Office: London, UK, 2013. [Google Scholar]
- Hegyi, J.; Schwartz, R.A.; Hegyi, V. Pellagra: Dermatitis, dementia, and diarrhea. Int. J. Dermatol. 2004, 43, 1–5. [Google Scholar] [CrossRef] [PubMed]
- Williams, A.C.; Ramsden, D.B. Pellagra: A clue as to why energy failure causes diseases? Med. Hypotheses. 2007, 69, 618–628. [Google Scholar] [CrossRef] [PubMed]
- Kirkland, J.B. Niacin status, NAD distribution and ADP-ribose metabolism. Curr. Pharm. Des. 2009, 15, 3–11. [Google Scholar] [CrossRef]
- Jacobson, E.L.; Jacobson, M.K. [19] Tissue NAD as a biochemical measure of niacin status in humans. Methods Enzymol. 1997, 280, 221–230. [Google Scholar] [PubMed]
- Brown, B.G.; Bardsley, J.; Poulin, D.; Hillger, L.A.; Dowdy, A.; Maher, V.M.; Zhao, X.Q.; Albers, J.J.; Knopp, R.H. Moderate dose, three-drug therapy with niacin, lovastatin, and colestipol to reduce low-density lipoprotein cholesterol <100 mg/dl in patients with hyperlipidemia and coronary artery disease. Am. J. Cardiol. 1997, 80, 111–115. [Google Scholar] [CrossRef]
- Khera, A.V.; Patel, P.J.; Reilly, M.P.; Rader, D.J. The addition of niacin to statin therapy improves high-density lipoprotein cholesterol levels but not metrics of functionality. J. Am. Coll. Cardiol. 2013, 62, 1909–1910. [Google Scholar] [CrossRef]
- Swaminathan, M.A. Colorimetric Method for the Estimation of Nicotinic Acid in Foodstuffs. Nature 1938, 41, 830. [Google Scholar] [CrossRef]
- Bandier, E.; Hald, J.A. Colorimetric reaction for the quantitative estimation of nicotinic acid. Biochem. J. 1939, 33, 264. [Google Scholar] [CrossRef]
- Frei, R.W.; Kunz, A.; Pataki, G.; Plims, T.; Zürcher, H. The determination of nicotinic acid and nicotinamide by thin-layer chromatography and in situ fluorimetry. Anal. Chim. Acta. 1970, 49, 527–534. [Google Scholar] [CrossRef]
- Carlson, L.A. Determination of free nicotinic acid in blood plasma. Clinic. Chim. Acta. 1966, 13, 349–351. [Google Scholar] [CrossRef]
- Díaz, A.N.; Paniagua, A.G.; Sánchez, F.G. Thin-layer chromatography and fibre-optic fluorimetric quantitation of thiamine, riboflavin and niacin. J. Chromatogr. A 1993, 655, 39–43. [Google Scholar] [CrossRef]
- Tiwari, P.K.; Sathe, P. Development and validation of HPTLC method for niacin and simvastatin in binary combination. Adv. Biosci. Biotechnol. 2010, 1, 131–135. [Google Scholar] [CrossRef]
- Brunink, H.; Wessels, E.J. The determination of nicotinic acid by fluorimetric densitometry. Analyst 1972, 97, 258–259. [Google Scholar] [CrossRef] [PubMed]
- Kazemipour, M.; Ansari, M.; Ramezani, H.; Moradalizadeh, M. Simultaneous determination of lovastatin and niacin in tablet by first and third derivative spectrophotometry and H-point standard addition methods. Res. Pharm. Sci. 2012, 7, 95–102. [Google Scholar] [CrossRef] [PubMed]
- Nwanisobi, G.C.; Ukoha, P.O. Spectrophotometric determination of niacin using 2, 3-dichloro-5,6-dicyano-1, 4-benzoquinone. Asian J. Chem. 2016, 28, 237. [Google Scholar] [CrossRef]
- Capella-Peiró, E.; Monferrer-Pons, L.; García-Alvarez-Coque, C.; Esteve-Romero, J. Flow-injection spectrophotometric determination of nicotinic acid in micellar medium of N-cetylpyridinium chloride. Anal. Chim. Acta 2001, 427, 93–100. [Google Scholar] [CrossRef]
- Esteve-Romero, J.S.; Monferrer-Pons, L.; Ramis-Ramos, G.; Garcia-Alvarez-Coque, M.C. Enhanced spectrophotometric determination of nicotinic acid in a sodium dodecyl sulphate micellar medium. Talanta 1995, 42, 737–745. [Google Scholar] [CrossRef]
- Perrone, D.; Donangelo, C.M.; Farah, A. Determination of niacin in cereal samples by HPLC. Food Chem. 2008, 110, 1030–1035. [Google Scholar] [CrossRef]
- Pfuhl, P.; Kärcher, U.; Häring, N.; Baumeister, A.; Tawab, M.A.; Schubert-Zsilavecz, M. Simultaneous determination of niacin, niacinamide and nicotinuric acid in human plasma. J. Pharm. Biomed. Anal. 2005, 36, 1045–1052. [Google Scholar] [CrossRef] [PubMed]
- Klejdus, B.; Petrlová, J.; Potěšil, D.; Adam, V.; Mikelová, R.; Vacek, J.; Kizek, R.; Kubáň, V. Simultaneous determination of water-and fat-soluble vitamins in pharmaceutical preparations by high-performance liquid chromatography coupled with diode array detection. Anal. Chim. Acta 2004, 520, 57–67. [Google Scholar] [CrossRef]
- Windahl, K.L.; Trenerry, V.C.; Ward, C.M. The determination of niacin in selected foods by capillary electrophoresis and high performance liquid chromatography: Acid extraction. Food Chem. 1999, 65, 263–270. [Google Scholar] [CrossRef]
- Gonçalves, E.M.; Joseph, A.; Conceição, A.C.L.; da Piedade, M.E.M. Potentiometric titration study of the temperature and ionic strength dependence of the acidity constants of nicotinic acid (niacin). J. Chem. Eng. Data 2011, 56, 2964–2970. [Google Scholar] [CrossRef]
- Rahman, M.T.; Hossain, M.E.; Ehsan, M.Q. Spectrophotometric and cyclic voltammetric study of interaction of Fe (III) with vitamin B3 and vitamin B6. J. Bangladesh Acad. Sci. 2014, 38, 143–153. [Google Scholar] [CrossRef]
- Moreschi, E.C.; Matos, J.R.; Almeida-Muradian, L.B.J. Thermal analysis of vitamin PP Niacin and niacinamide. Therm. Anal. Calorim. 2009, 98, 161–164. [Google Scholar] [CrossRef]
- Sheppard, A.J.; Prosser, A.R. [101] Gas chromatography of niacin. In Methods in Enzymology; Academic Press: Cambridge, MA, USA, 1971; Volume 18, pp. 17–20. [Google Scholar] [CrossRef]
- Day, B.J.; Carlson, G.P.; Denicola, D.P. Potentiation of carbon tetrachloride-induced hepatotoxicity and pneumotoxicity by pyridine. J. Biochem. Toxic. 1993, 8, 11–18. [Google Scholar] [CrossRef]
- Arinç, E.; Adali, O.; Gençler-Özkan, A.M. Stimulation of aniline, p-nitrophenol and N-nitrosodimethylamine metabolism in kidney by pyridine pretreatment of rabbits. Arch. Toxicol. 2000, 74, 527–532. [Google Scholar] [CrossRef]
- Ghira, G.B.; Raţiu, I.A.; Bocoş-Binţinţan, V. Fast characterization of pyridine using ion mobility spectrometry and photoionization detection. Environ. Eng. Manag. J. 2013, 12, 251–256. [Google Scholar]
- Naguib, I.A.; Draz, M.E.; Abdallah, F.F. Impurity profiling high-performance-thin-layer chromatography method involving the assay of essential human micronutrient niacin with eco-scale assessment. Biomed. Chromatogr. 2020, 34. [Google Scholar] [CrossRef]
- Naguib, I.A.; Abdallah, F.F. Two Multivariate Calibration Models for Assay of Niacin in complex mixtures with its official impurities: A Pharmaceutical Application. J. AOAC Int. 2020, 103, 1660–1666. [Google Scholar] [CrossRef]
- Ratiu, I.A.; Bocos-Bintintan, V.; Monedeiro, F.; Milanowski, M.; Ligor, T.; Buszewski, B. An optimistic vision of future: Diagnosis of bacterial infections by sensing their associated volatile organic compounds. Crit. Rev. Anal. Chem. 2020, 50, 501–512. [Google Scholar] [CrossRef]
- Chauhan, A.; Goyal, M.K.; Chauhan, P. GC-MS technique and its analytical applications in science and technology. Anal. Bioanal. Tech. 2014, 5, 222. [Google Scholar] [CrossRef]
- United States Pharmacopeia Convention Inc. The United States Pharmacopeia, National Formulary 35, 30th ed.; United States Pharmacopeia Convention Inc.: Rockville, MD, USA, 2012. [Google Scholar]
- Van Aken, K.; Strekowski, L.; Patiny, L. EcoScale, a semi-quantitative tool to select an organic preparation based on economical and ecological parameters. Beilstein J. Org. Chem. 2006, 2, 3. [Google Scholar] [CrossRef] [PubMed]
- Mohamed, H.; Lamie, N. Analytical Eco-Scale for Assessing the Greenness of a Developed RP-HPLC Method Used for Simultaneous Analysis of Combined Antihypertensive Medications. J. AOAC Int. 2016, 99, 1260–1265. [Google Scholar] [CrossRef]
- Gamal, M.; Ali, H.M.; Abdelfatah, R.M.; Magdy, M.A. A green approach for simultaneous analysis of two natural hepatoprotective drugs in pure forms, capsules and human plasma using HPLC-UV method. Microchem. J. 2019, 151, 104258. [Google Scholar] [CrossRef]
- Gamal, M.; Elhalim, L.M.A. Novel Eco-friendly HPLC Methods Using Refractive Index Detector for Analysis of Three Veterinary Antibiotics in Pharmaceutical Formulations and Rat Plasma. J. Chromatogr. Sci. 2020, 58, 940–950. [Google Scholar] [CrossRef]


| Components of the Analyzed Mixture | Regression Equation * | Retention Time |
|---|---|---|
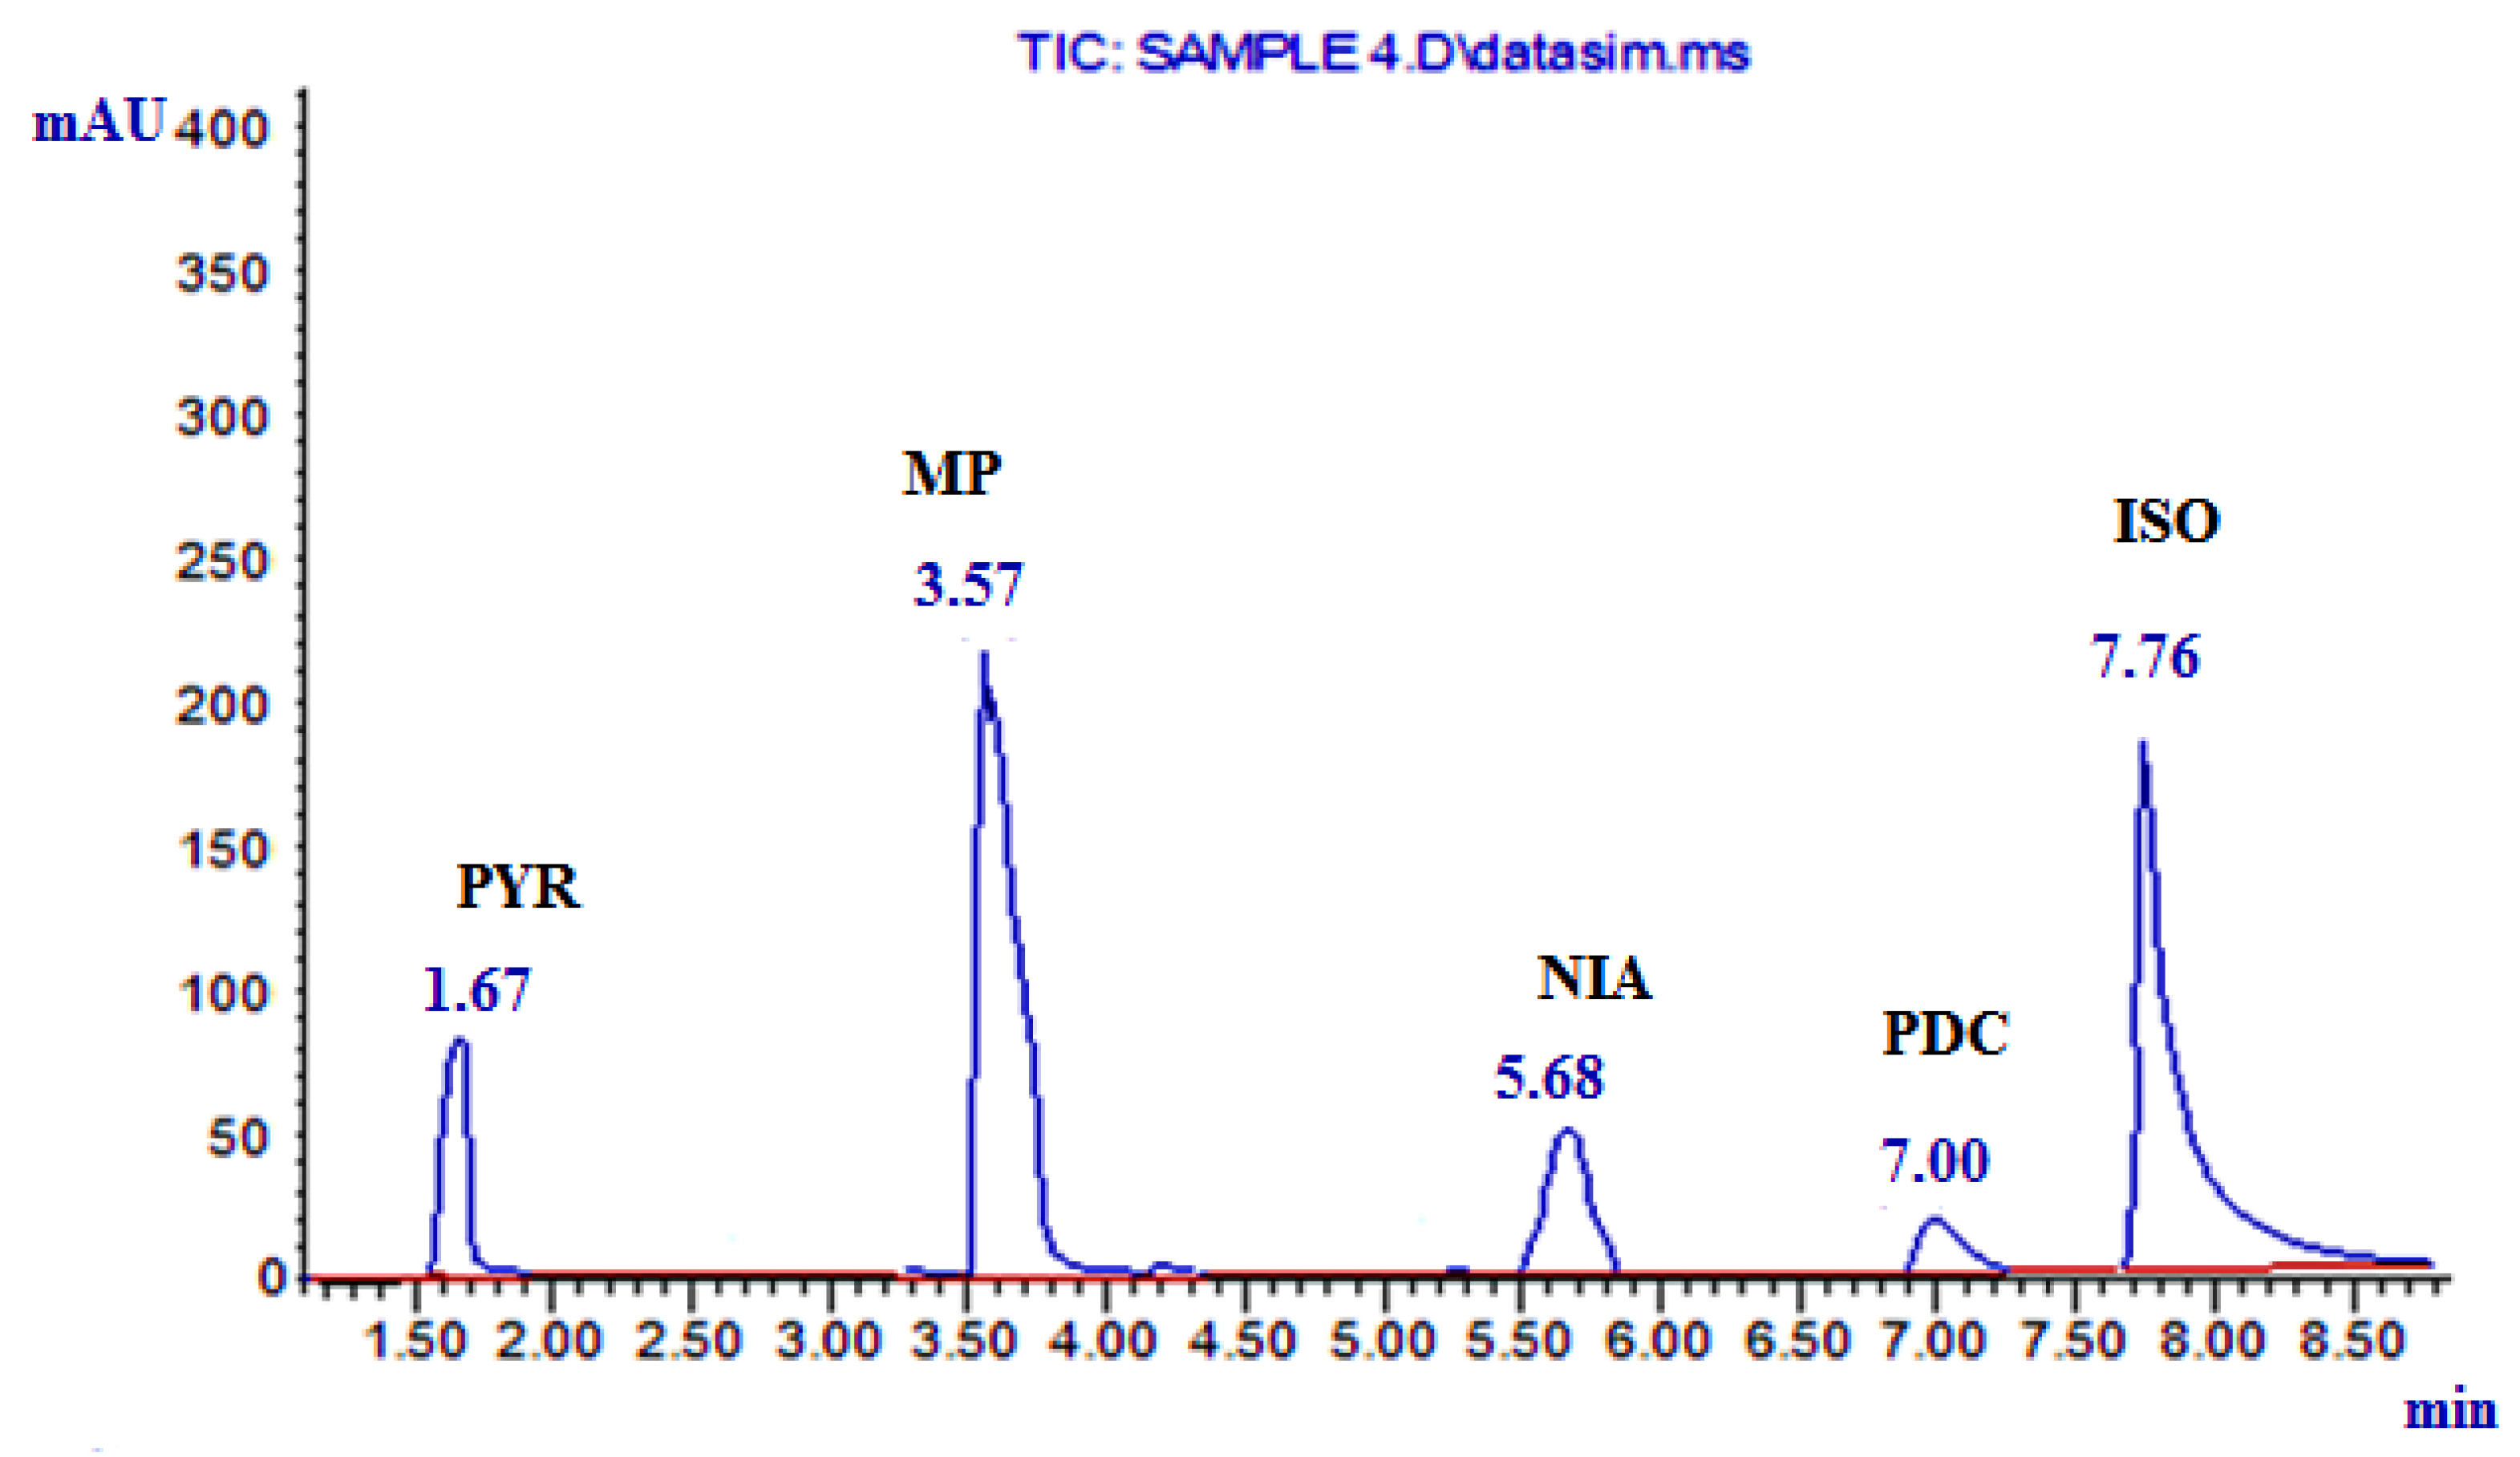
| NIA | A1 = 0. 9636 C1 + 0.5158 | 5.68 |
| PYR | A2 = 36.61 C2 + 8.2884 | 1.67 |
| MP | A3 = 10.15 C3 − 0.5745 | 3.57 |
| PDC | A4 = 0.4934 C4 − 0.0726 | 7.00 |
| ISO | A5 = 1.1665 C5 + 0.0874 | 7.76 |
| GC–MS Method | Parameter | ||||
|---|---|---|---|---|---|
| ISO | PDC | MP | PYR | NIA | |
| 0.5–20 | 0.5–20 | 0.1–5 | 0.005–5 | 0.5–20 | Range (µg mL−1) |
| 1.1665 | 0.4934 | 10.1500 | 36.6100 | 0.9636 | Slope |
| 0.0874 | −0.0726 | −0.5745 | 8.2884 | 0.5158 | Intercept |
| 0.9999 | 0.9998 | 0.9999 | 0.9999 | 0.9997 | Regression coefficient |
| 101.03 ± 1.729 | 100.95 ± 2.100 | 100.17 ± 1.064 | 99.69 ± 1.607 | 100.49 ± 0.754 | Accuracy (Mean ± SD) |
| 2.074 | 1.305 | 1.719 | 1.613 | 1.513 | Precision
|
| 2.464 | 2.434 | 2.200 | 2.515 | 2.122 | |
| 0.139 | 0.136 | 0.030 | 0.001 | 0.121 | LOD (µg mL−1) |
| 0.460 | 0.450 | 0.098 | 0.003 | 0.400 | LOQ (µg mL−1) |
| Recovery % b | Pure Found (µg mL−1) | Pure Added (µg mL−1) | Found% a Mean ± SD) | Claimed Taken (µg mL−1) | Niacin® Tablets, Batch No. 152405-05 |
|---|---|---|---|---|---|
| 98.67 | 2.96 | 3.0 | 100.11 ± 1.755 | 5.0 | NIA |
| 99.60 | 4.98 | 5.0 | |||
| 99.33 | 9.93 | 10.0 | |||
| 99.20 ± 0.391 | Mean ± SD | ||||
| Reference Values [35] | GC/MS | Parameter | |||||||
|---|---|---|---|---|---|---|---|---|---|
| ISO | PDC | NIA | PDC | NIA | MP | PYR | MP | ||
| ~1 | 1.5 | 1.3 | 1 | 1.3 | 1 | 1.4 | 1.3 | 1.4 | Tailing factor (T) |
| 1–10 | 6.76 | 6 | 4.68 | 6 | 4.68 | 2.57 | 0.67 | 2.57 | Capacity factor (K’) |
| Acceptable | |||||||||
| Rs > 1.5 | 3.185 | 6.26 | 2.64 | 1.67 | Resolution (RS) | ||||
| >1 | 3.84 | 1.82 | 1.28 | 1.13 | Selectivity(α) | ||||
| Increase with efficiency of the separation | 214,285.71 | 35,714.29 | 11,718.75 | 35,714.29 | 11,718.75 | 7092.2 | 3348.2 | 7092.2 | Column efficiency (N) |
| The smaller the value the higher the column efficiency | 0.014 | 0.084 | 0.256 | 0.084 | 0.256 | 0.423 | 0.896 | 0.423 | HETP = height equivalent to theoretical plate, (cm/plate) |
| Parameter | Reported HPTLC Method [31] ** | GC/MS | Reported HPLC Method [21] *** | GC/MS |
|---|---|---|---|---|
| Mean | 99.82 | 100.11 | 99.74 | 100.11 |
| SD | 1.673 | 1.922 | 0.965 | 1.922 |
| Variance | 2.797 | 3.697 | 0.931 | 3.697 |
| n | 6 | 6 | 6 | 6 |
| Student’s t-test * (2.228) | 0.283 | 0.430 | ||
| F-test * (5.050) | 1.322 | 3.970 | ||
| Reagent/Instruments | Penalty Points | ||
|---|---|---|---|
| Reported HPLC Method [20] | Reported HPTLC Method [30] | Proposed GC–MS Method | |
| Helium | - | - | 1 |
| Ethylacetate | 4 | - | |
| Ethanol | 2 | - | |
| Methanol | 12 | - | - |
| Triflouroacetic acid | 8 | - | - |
| Ammonia solution | - | 2 | - |
| Technique (Energy used) | 0 | 0 | 2 |
| Occupational hazard | 0 | 0 | 0 |
| Waste | 5 | 3 | 5 |
| Total penalty points | Σ25 | Σ11 | Σ8 |
| Analytical Eco-scale Total score | 75 | 89 | 92 |
Publisher’s Note: MDPI stays neutral with regard to jurisdictional claims in published maps and institutional affiliations. |
© 2021 by the authors. Licensee MDPI, Basel, Switzerland. This article is an open access article distributed under the terms and conditions of the Creative Commons Attribution (CC BY) license (https://creativecommons.org/licenses/by/4.0/).
Share and Cite
Almalki, A.H.; Naguib, I.A.; Abdallah, F.F. Eco-Friendly Direct GC–MS Method for Estimation of Niacin and Related Impurities Involving Pyridine in Food Supplements. Separations 2021, 8, 46. https://doi.org/10.3390/separations8040046
Almalki AH, Naguib IA, Abdallah FF. Eco-Friendly Direct GC–MS Method for Estimation of Niacin and Related Impurities Involving Pyridine in Food Supplements. Separations. 2021; 8(4):46. https://doi.org/10.3390/separations8040046
Chicago/Turabian StyleAlmalki, Atiah H., Ibrahim A. Naguib, and Fatma F. Abdallah. 2021. "Eco-Friendly Direct GC–MS Method for Estimation of Niacin and Related Impurities Involving Pyridine in Food Supplements" Separations 8, no. 4: 46. https://doi.org/10.3390/separations8040046
APA StyleAlmalki, A. H., Naguib, I. A., & Abdallah, F. F. (2021). Eco-Friendly Direct GC–MS Method for Estimation of Niacin and Related Impurities Involving Pyridine in Food Supplements. Separations, 8(4), 46. https://doi.org/10.3390/separations8040046