Abstract
In this study, we developed a rapid method for determining lead(II) by integrating solid-phase extraction with digital image colorimetry to reduce the time and labor required for the analysis of lead(II) in water samples. The solid-phase extraction column was packed with cellulose as a bio-based adsorbent, which facilitated adsorption and enrichment of lead(II) during sample loading. The elution step, which is time-consuming and solvent-intensive, was eliminated from the procedure. An aqueous solution of sodium rhodizonate was added to react with lead(II), forming a red–brown complex. The color intensity was quantified using a smartphone-based digital image colorimetry. The method showed good linearity in the range of 0.01–0.8 mg L−1 with R2 > 0.99. In tap, river, and spring water, the recovery was 93.5% to 97.5% with a relative standard deviation of 1.7–4.8%. Five complementary greenness assessment tools confirmed the environmental friendliness of the method. This rapid pretreatment and detection technique can be applied to analyzing lead(II) in aqueous samples.
1. Introduction
Lead has historically been utilized in various products, including cosmetic powders, ceramic glazes, gasoline, plumbing materials, radiation shielding, toys for children, and paint. Numerous water sources are currently contaminated with lead [1]. Lead, a toxic metal, has adverse effects on multiple organ systems when it accumulates in the human body [2]. The nervous system is particularly vulnerable to the toxic effects of lead, often leading to irreversible nerve damage [3]. According to GB 5749-2022 [4], the maximum permissible level of lead in drinking water is 0.01 mg L−1 [5]. It is crucial to develop a rapid analysis method for lead to safeguard the quality of water.
Sample pretreatment is a key component of an analytical method and mainly includes liquid–liquid extraction [6] and solid-phase extraction (SPE) [7]. Liquid–liquid extraction is characterized by higher consumption of toxic organic solvents, extended extraction duration, and a more intricate process when compared with solid-phase extraction (SPE) [8,9].
SPE operates on the principle of chromatographic separation, in which the target substance is retained in the column rather than the sample matrix. Subsequently, suitable solvents are chosen based on the polarity of the substance to elute the target analyte, facilitating the desired separation and purification [10]. The SPE method is commonly utilized in conventional pretreatment technology due to its advantages of reduced organic solvent usage and high reusability [11,12]. However, current SPE methods still have limitations, and the operation of SPE should comply with the green sample preparation principle [13]. Conventional SPE procedures involve complex and time-consuming elution processes [14], and the choice of eluent solvent type and volume can greatly impact the accuracy of subsequent quantitative analyses [15].
Direct colorimetric reaction of lead within the column enables quantitative analysis and has the potential to yield substantial savings in time and solvent costs. The utilization of cellulose derived from wood as the adsorbent in SPE offers the advantages of renewability and environmental compatibility [16]. The color of cellulose changes to white after bleaching, and the white cellulose as adsorbent facilitates observation of the subsequent color reaction in the SPE column and avoids the elution of the adsorbent in the SPE column. By improving the SPE technology, the experimental operation can be simplified, thereby enhancing pretreatment and detection efficiency.
The conventional detection methods of lead are mainly atomic absorption spectrometry, atomic emission spectrometry, inductively coupled plasma mass spectrometry, and inductively coupled plasma emission spectrometry [17]. However, these methods require trained personnel and expensive equipment and are time-consuming, making them unsuitable for rapid detection purposes [18]. Digital image colorimetry (DIC) is characterized by its ease of operation, meets the requirements for rapid detection, and has made significant progress in environmental applications [19,20]. In recent years, it has been used for the detection of lead ions [21,22]. This approach utilizes image acquisition devices, such as smartphones, to capture images and subsequently employs image processing software to perform quantitative analysis of color data [21,23]. Sodium rhodizonate has a chelating ability and can form colored complexes with divalent lead ions [24,25]. Lead(II) reacts with sodium rhodizonate aqueous solution to produce a red–brown complex [18]; thus the content of lead(II) may be measured using DIC.
The investigation involved the detection of lead(II) in various water samples using SPE and DIC. A novel SPE adsorbent composed of white cellulose, known for its favorable physicochemical properties and biodegradability, was utilized due to its high adsorption capacity for lead(II). The subsequent colorimetric reaction was conducted directly without the need for elution, thereby streamlining the traditional SPE procedure. The introduction of a sodium rhodizonate aqueous solution into the SPE column facilitated the formation of a red–brown complex upon reaction with lead(II). The signal intensity change of the green channel in RGB (red, green, and blue) color mode was obtained using a smartphone based on DIC, enabling quantitative analysis of lead(II). Various water samples, including tap, river, and spring water, were used to assess the reliability of this method.
2. Materials and Methods
2.1. Reagents and Materials
Lead analytical standard (500 mg L−1), nitric acid (70%), sodium hydroxide (98%), and sodium rhodizonate (98%) were purchased from Aladdin Reagent Co., Ltd. (Shanghai, China). White cellulose, produced from wood through slicing, cooking, washing, sulfite bleaching, and drying, was supplied by Funa New Material Technology Co., Ltd. (Shanghai, China). SPE empty column were purchased from Solarbio Science & Technology Co., Ltd. (Beijing, China). Samples of tap, river, and spring water were collected locally in Taiyuan, China.
2.2. SPE Process
The 1 mL SPE column had a length of 56.5 mm and an inner diameter of 5.5 mm. A circular filter paper (6 mm diameter, Whatman, Maidstone, England) was positioned at the bottom of the 1 mL SPE column, followed by the addition of 5 mg of white cellulose as the adsorbent. Subsequently, 10 mL of sample was passed through the SPE column under a negative pressure of 0.05 MPa (Figure 1).

Figure 1.
Schematic diagram of the SPE-DIC process.
2.3. DIC Process
Following the addition of 50 μL of a 2 g L−1 sodium rhodizonate aqueous solution to the SPE column, the cellulose adsorbent underwent a color change from white to red–brown within a reaction time of 0.5 min. Subsequently, the cellulose-filled SPE column was transferred to a custom-built camera box (35 cm × 35 cm × 35 cm). The illumination was provided entirely by an LED light, and images were captured using an Honor V20 smartphone (Huawei, Shenzhen, China) equipped with a Sony IMX586 48-megapixel rear main sensor. The color region in the photograph was analyzed using the Color Name AR application (version 3.3), a mobile app designed for real-time color recognition and quantification, installed on the smartphone. This application enabled precise measurement of the green-channel intensity in RGB mode, providing a convenient and accurate way to assess color properties directly from digital images.
The lead(II) content was then calculated from a standard curve, with the mass concentration of lead(II) as the x-axis and the green intensity change (ΔG = G0 − G1) as the y-axis. Here, G0 represents the green intensity of the blank sample, while G1 denotes that of the spiked sample.
3. Results and Discussion
3.1. Optimization of the SPE Process
3.1.1. Optimization of the Adsorbent Type
The cellulose used exhibits a tubular and loose structure (Figure 2) with a high degree of porosity, with a relatively uniform distribution of fiber diameters and large pores. Cellulose contains abundant hydroxyl groups that can adsorb metal ions. Cellulose has a large specific surface area, and the porous structure of cellulose is conducive to the physical adsorption of lead ions [26,27]. It can be reused after water treatment and maintains a stable porous structure in water, which promotes adsorption of contaminants from wastewater [28]. Cellulose is rich in functional groups, particularly hydroxyl groups (−OH) [26,29], which can adsorb lead quickly, and when the sodium rhodizonate reagent reacts with lead ions, a pink product is formed [30]. The reaction is as follows:
Pb2+ + Na2C6O8 → PbC6O8 + 2Na+
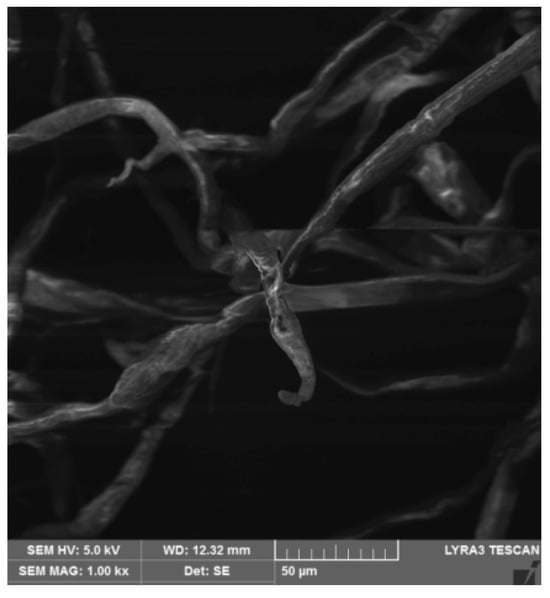
Figure 2.
The morphology of cellulose under a scanning electron microscope.
We considered using dopamine to modify cellulose, but the dopamine-modified cellulose appeared grayish-brown. Thus, the unmodified adsorbent was chosen for this experiment.
3.1.2. Optimization of the Adsorbent Amount
In order to determine the optimal amount of the adsorbent, the impact of various amounts (0.5, 1, 2, 5, 10, 20, 50 mg) of cellulose on ΔG was studied using the experimental procedure described above. When determining for the optimal adsorbent amount, all other experimental conditions were kept constant. Different lowercase letters in figures indicate significant differences among different groups (p < 0.05). The results shown in Figure 3 indicate that the maximum ΔG was observed when 5 mg of cellulose was used. Within the adsorbent amount range of 0.5–5 mg, ΔG progressively increased. As the adsorbent amount increased in this range, the adsorption capacity for lead also increased, resulting in a corresponding rise in ΔG. In contrast, within the range of 5–50 mg, ΔG gradually decreased. This is because, although the total amount of lead adsorbed increased with more adsorbent, the amount of lead adsorbed per unit mass of cellulose decreased, leading to a lower ΔG. In other words, as the adsorbent dose increased beyond 5 mg, the system approached saturation, and further increases in the adsorbent caused the observed color to become lighter. Consequently, the change in ΔG first increases and then begins to decrease. Consequently, the optimal condition and most effective outcome were observed with 5 mg of cellulose. Therefore, 5 mg was chosen as the optimal amount of adsorbent for this experiment.
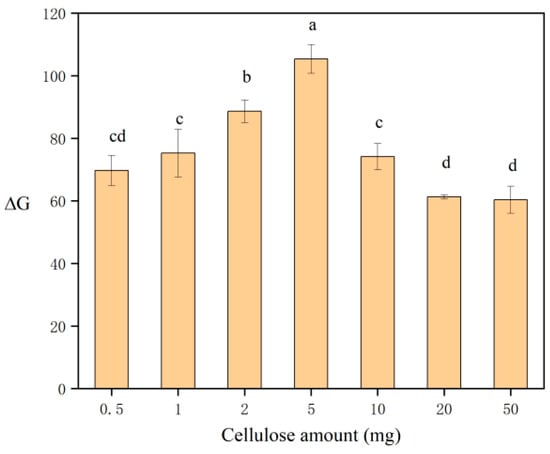
Figure 3.
Effect of the cellulose amount on ΔG. Different letters denote significant differences (p < 0.05).
3.1.3. Optimization of the Loading Condition
After optimizing the capacity and pressure of the SPE columns, 1 mL and 2 mL SPE columns were chosen under the conditions of negative pressure (0.05 MPa) and atmospheric pressure (0.10 MPa), respectively. The results shown in Figure 4 show that the maximum ΔG and the highest adsorption efficiency were obtained when the 1 mL SPE column was used under negative pressure. The discrepancy arises from the fact that, when comparing 1 mL and 2 mL SPE columns containing an equivalent amount of cellulose, the different stationary phase heights affected the contact between the cellulose and samples. Consequently, the 1 mL SPE column allowed for a greater extent of contact with samples, resulting in a larger ΔG. Furthermore, negative pressure conditions resulted in reduced water retention within the cellulose in the SPE column. Therefore, it was observed that the concentration of the colored product in the cellulose increased upon the addition of sodium rhodizonate, and the change in ΔG was greater under negative pressure than under atmospheric pressure. As a result, it was concluded that the optimal loading condition involved the use of a 1 mL SPE column under negative pressure.
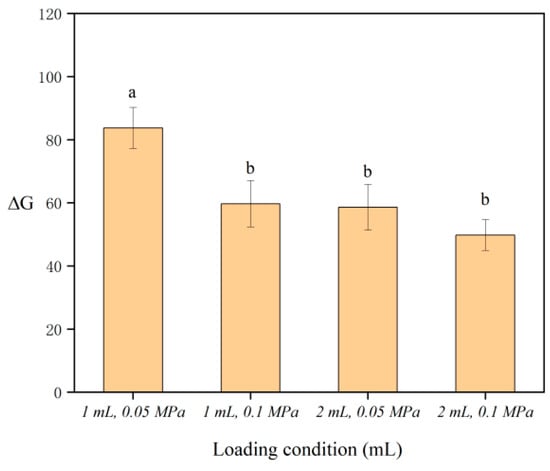
Figure 4.
Effect of the loading condition on ΔG. Different letters denote significant differences (p < 0.05).
3.1.4. Optimization of the pH of Samples
When the pH of the sample was optimized, NaOH and HNO3 were selected to adjust the pH of the sample to 1, 3, 5, 7, 9, 11, and 13. As shown in Figure 5, the ΔG increased first and then decreased. The adsorption capacity of cellulose decreased under acidic and alkaline environments. At lower pH levels, the carboxyl group in the adsorbent existed as -COOH rather than -COO-, which reduced the possibility of lead(II) being adsorbed on adsorbents [31,32]. The presence of additional hydrogen ions in the system competed with lead(II) for adsorption sites, making it difficult for lead(II) to access available binding sites [33]. At high pH, metal hydroxides were formed [34], which reduced the adsorption effect. Given that the majority of the water samples in the study did not exhibit an extreme pH, the pH of the samples was not adjusted before the SPE process.
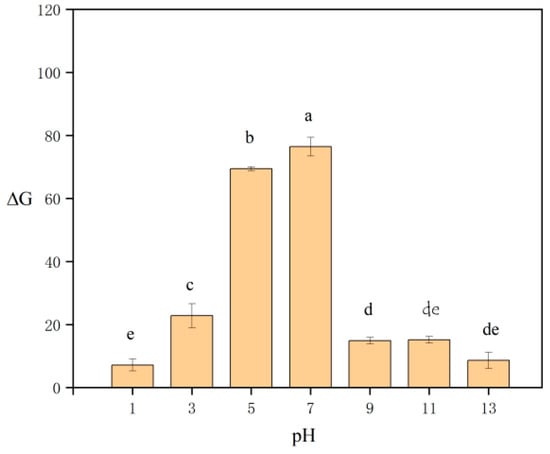
Figure 5.
Effect of the pH of samples on ΔG. Different letters denote significant differences (p < 0.05).
3.2. Optimization of the DIC Process
3.2.1. Optimization of the Chromogenic Agent Concentration
In this experiment, various concentrations of sodium rhodizonate (0.1, 0.5, 1, 2, 4, 8, 16, and 32 g L−1) were selected to investigate the impact of chromogenic agent concentration on ΔG. In the study, sodium rhodizonate and lead ions form a colored complex, and the color darkens as the reagent concentration increases. However, when a certain concentration is reached, the color of the reagent itself masks the color of the reactant, therefore ΔG first increases and then decreases. As depicted in Figure 6, ΔG increased initially and then decreased, with the maximum value observed at a concentration of 2 g L−1. At concentrations below 1 g L−1, the color change was limited due to insufficient chromogenic agent, while concentrations of 4–32 g L−1 resulted in a high green background intensity in the blank sample and then a small color change. Therefore, the concentration of 2 g L−1 was determined to be the optimal level of the chromogenic agent for this experimental study.
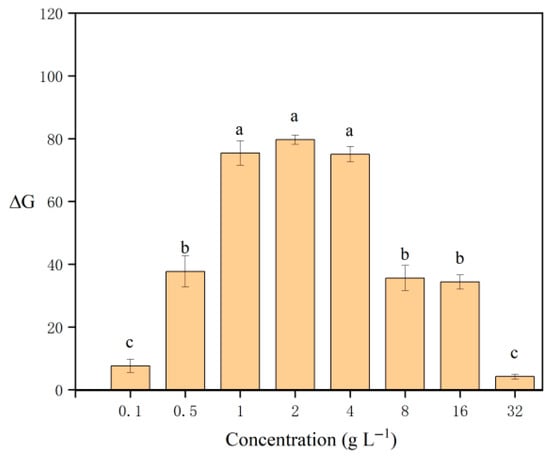
Figure 6.
Effect of concentrations of sodium rhodizonate on ΔG. Different letters denote significant differences (p < 0.05).
3.2.2. Optimization of the Reaction Time
When optimizing the reaction time, the red–brown complex in SPE was photographed at 0.5, 1, 2, 3, 5, and 10 min. The results are shown in Figure 7, which shows that the reaction was complete within 0.5 min and ΔG remained stable for 10 min. The results showed that the color of the reaction product of sodium rhodizonate and lead is stable over this period. Therefore, the chromogenic reaction can be imaged after just 0.5 min, and extending the reaction time further does not affect the accuracy of DIC.
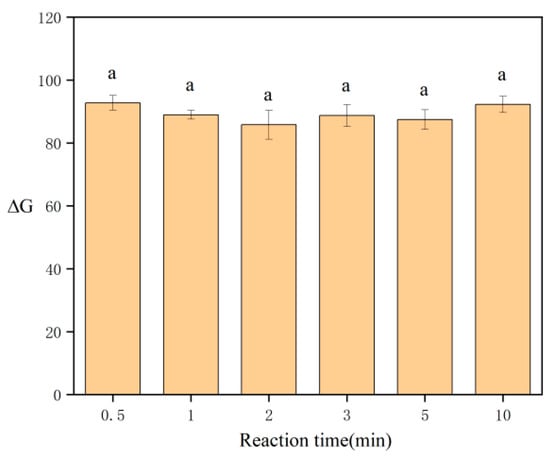
Figure 7.
Effect of the reaction time on ΔG. Same letters denote no significant differences (p < 0.05).
3.3. Method Evaluation
The standard curve was plotted with the mass concentration of lead in the sample as the abscissa and the green intensity as the ordinate. The results show that the linear range of SPE-DIC was 0.01–0.8 mg L−1, the standard curve was y = −115.91x + 186.41 (Figure 8), and the coefficient of determination (R2) was 0.9902. The limits of quantification (LOQ) and detection (LOD), calculated as 10 and 3 times the ratio of the blank standard deviation to the slope, were 0.01 and 0.003 mg L−1, respectively. The intra- and inter-day relative standard deviations (RSDs) based on five replicates were 4.2% and 5.1%, respectively.
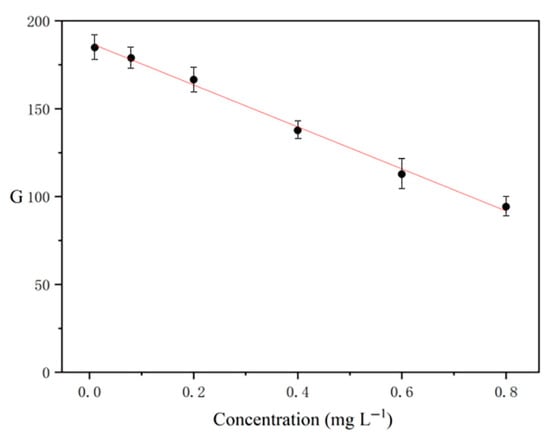
Figure 8.
The linear relationship between the mass concentration of lead and the green intensity.
3.4. Actual Sample Analysis
To prove the accuracy of the established method, a certified reference material GBW(E)084527 was analyzed by SPE-DIC. The mass concentration was 0.0153 ± 0.0007 mg L−1, while the tested mass concentration was 0.0144 ± 0.0005 mg L−1. No significant difference was observed between the certified and measured mass concentrations. The collected samples of tap, river, and spring water were also tested, and the mass concentrations are all below the method LOD. Therefore, samples spiked with lead at 0.01 mg L−1 and 0.8 mg L−1 were prepared to evaluate recovery and relative standard deviation (RSD). The results are shown in Table 1. The recoveries ranged from 93.5% to 97.5%, and RSDs ranged from 1.7% to 4.8% with narrow 95% confidence intervals (CI), indicating that the method is suitable for the analysis of lead in complex water samples.

Table 1.
Determination of lead in water samples by SPE-DIC.
3.5. Comparative Study with Other Studies
To compare with traditional methods, the different extraction and detection methods were summarized in Table 2, including material, adsorbent weight or volume, total processing time, linear range, LOD, and suitability for on-site application. The cellulose material used in this method is more environmentally friendly, naturally degradable, and requires only 5 mg of adsorbent. Additionally, the entire extraction and detection process was completed within 10 min. Notably, SPE-DIC offers a wide linear range and low LOD, demonstrating its improved detection capabilities. However, its sensitivity is lower than that of graphite furnace atomic absorption spectrometry, a technique requiring more sophisticated instrumentation [35]. Overall, this method is highly efficient and better suited for field detection compared to conventional techniques.

Table 2.
Comparison of different methods applied for the detection of lead.
3.6. Greenness Evaluation
Five complementary green assessment tools were employed to systematically evaluate the environmental impact of the SPE-DIC method.
The Analytical Eco-Scale was first applied to assess the greenness of the proposed method. This tool starts from a baseline score of 100, from which penalty points (PPs) are subtracted for deviations from ideal green analytical practices, with larger deviations resulting in greater deductions. Owing to its low reagent consumption and minimal instrumental requirements, the SPE-DIC method achieved a final score of 86 (Table S1), confirming its environmentally friendly characteristics.
A color-coded pentagram based on the Green Analytical Procedure Index (GAPI) was then used to further evaluate the method’s environmental impact. In this system, green, yellow, and red fields represent low, medium, and high environmental burdens, respectively. For the SPE-DIC method, the assessment across sample preparation, reagents and solvents, and instrumentation yielded seven green fields, four yellow fields, and four red fields (Figure 9). A detailed breakdown of the indicators and scores is provided in Table S2.
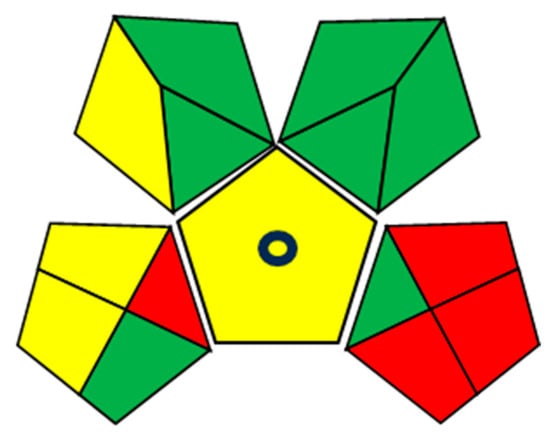
Figure 9.
GAPI greenness assessment of the SPE-DIC method.
The Analytical GREEnness (AGREE) metric provides a quantitative measure of overall greenness by integrating the twelve principles of green analytical chemistry into a single numerical score ranging from 0 to 1, with higher values indicating lower environmental impact. Based on factors such as reagent consumption and hazards, waste generation, energy requirements, operational complexity, and the degree of miniaturization, the SPE-DIC method attained an AGREE score of 0.74 (Figure 10). Detailed indicator descriptions, assigned weights, and individual scores are provided in Table S3.
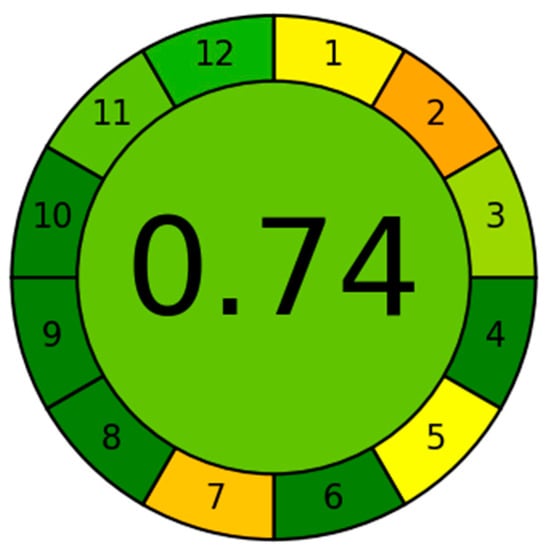
Figure 10.
AGREE greenness evaluation of the SPE-DIC method.
The Analytical GREEnness metric for sample preparation (AGREEprep) serves as an extension of AGREE, focusing specifically on evaluating and comparing the sustainability of sample preparation techniques. By consolidating multiple criteria into an intuitive radar diagram, AGREEprep offers an objective overview of environmental performance. The SPE-DIC technique obtained an AGREEprep score of 0.67 (Figure 11), reflecting its compliance with Green Sample Preparation (GSP) principles. Detailed scoring information is available in Table S4.
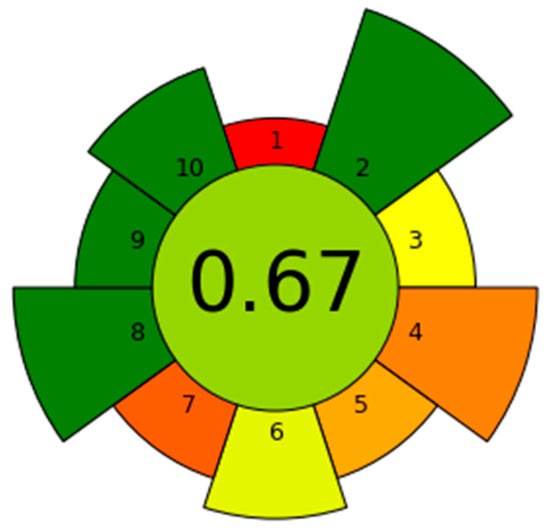
Figure 11.
AGREEprep greenness evaluation of the SPE-DIC method.
Finally, the Sample Preparation Metric of Sustainability (SPMS) was applied. This comprehensive tool, grounded in the 12 principles of green chemistry and tailored to sample pretreatment, evaluates environmental performance across ten criteria, including sample characteristics, extractant properties, and procedural detail. The cumulative assessment yields a total score out of 10, providing a clear measure of sustainability. The SPE-DIC method achieved an overall SPMS score of 8.63 out of 10 (Figure 12), with detailed scores for each parameter presented in Table S5, highlighting its superior environmental profile and ecological advantages.
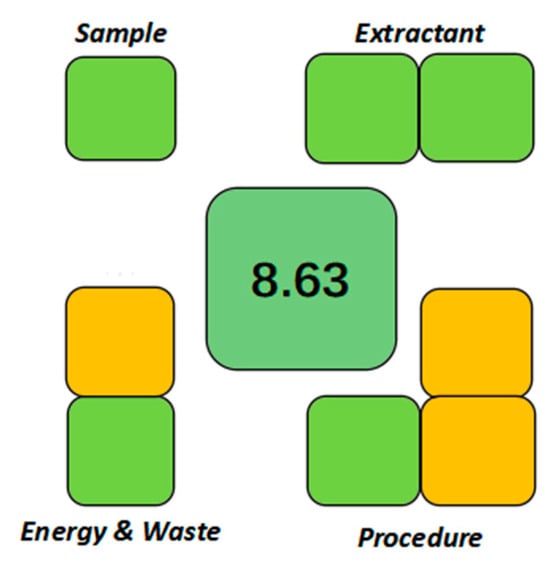
Figure 12.
SPMS greenness evaluation of the SPE-DIC method.
4. Conclusions
A method based on SPE and DIC was developed for the detection of lead(II) and applied to water samples. White cellulose was used as an adsorbent in SPE columns, eliminating the elution step, reducing the amount of solvent, shortening the time of SPE, and simplifying the operation of conventional SPE technology. Lead was quantitatively analyzed using a rapid chromogenic reaction and simple DIC technology. The results showed that lead(II) had good linearity in the range of 0.01–0.8 mg L−1 with R2 > 0.99. In tap, river, and spring water, the recovery was 93.5% to 97.5% with a relative standard deviation of 1.7–4.8%. Moreover, the effects of ionic strength and the presence of coexisting metal ions were considered and found to have negligible influence on the detection results, demonstrating good stability and selectivity. The method provided satisfactory recoveries and RSDs for lead in tap, river, and spring water. This rapid pretreatment detection technique can be applied to the analysis of lead in aqueous samples. Compared with conventional methods for lead detection, this method is simpler to implement and has practical significance for rapid detection of lead in various water samples.
Supplementary Materials
The following supporting information can be downloaded at: https://www.mdpi.com/article/10.3390/separations12110319/s1, Table S1: Detailed assessment of the SPE-DIC method using the AES; Table S2: Detailed assessment of the SPE-DIC method using the GAPI; Table S3: Detailed assessment of the SPE-DIC method using the AGREE; Table S4: Detailed assessment of the SPE-DIC method using the AGREEprep; Table S5: Detailed assessment of the SPE-DIC method using the SPMS.
Author Contributions
Conceptualization, X.J.; Investigation, W.W. and Z.M.; Writing—original draft, W.W. and Z.M.; Writing—review & editing, X.B.; Supervision, X.B. All authors have read and agreed to the published version of the manuscript.
Funding
This research received no external funding.
Data Availability Statement
The original contributions presented in this study are included in the article/Supplementary Material. Further inquiries can be directed to the corresponding author.
Conflicts of Interest
The authors declare no conflicts of interest.
References
- Soubra, G.; Massoud, M.A.; Alameddine, I.; Al Hindi, M.; Sukhn, C. Assessing the Environmental Risk and Pollution Status of Soil and Water Resources in the Vicinity of Municipal Solid Waste Dumpsites. Environ. Monit. Assess. 2021, 193, 857. [Google Scholar] [CrossRef] [PubMed]
- Zhao, F.-J.; Tang, Z.; Song, J.-J.; Huang, X.-Y.; Wang, P. Toxic Metals and Metalloids: Uptake, Transport, Detoxification, Phytoremediation, and Crop Improvement for Safer Food. Mol. Plant 2022, 15, 27–44. [Google Scholar] [CrossRef] [PubMed]
- Ramírez Ortega, D.; González Esquivel, D.F.; Blanco Ayala, T.; Pineda, B.; Gómez Manzo, S.; Marcial Quino, J.; Carrillo Mora, P.; Pérez De La Cruz, V. Cognitive Impairment Induced by Lead Exposure during Lifespan: Mechanisms of Lead Neurotoxicity. Toxics 2021, 9, 23. [Google Scholar] [CrossRef] [PubMed]
- GB 5749-2022; Standards for Drinking Water Quality. State Administration for Market Regulation: Beijing, China, 2022.
- Zhang, K.; Chang, S.; Zhang, Q.; Bai, Y.; Wang, E.; Zhang, M.; Fu, Q.; Wei, L.; Yu, Y. Heavy Metals in Influent and Effluent from 146 Drinking Water Treatment Plants across China: Occurrence, Explanatory Factors, Probabilistic Health Risk, and Removal Efficiency. J. Hazard. Mater. 2023, 450, 131003. [Google Scholar] [CrossRef]
- Guo, X.; Zheng, X.; Guo, X.; Wu, J.; Jing, X. Determination of Chiral Prothioconazole and Its Chiral Metabolite in Water, Juice, Tea, and Vinegar Using Emulsive Liquid–Liquid Microextraction Combined with Ultra-High Performance Liquid Chromatography. Food Chem. 2024, 440, 138314. [Google Scholar] [CrossRef]
- Płotka-Wasylka, J.; Jatkowska, N.; Paszkiewicz, M.; Caban, M.; Fares, M.Y.; Dogan, A.; Garrigues, S.; Manousi, N.; Kalogiouri, N.; Nowak, P.M.; et al. Miniaturized Solid Phase Extraction Techniques for Different Kind of Pollutants Analysis: State of the Art and Future Perspectives—PART 1. TrAC Trends Anal. Chem. 2023, 162, 117034. [Google Scholar] [CrossRef]
- Waseem, M.; Majeed, Y.; Nadeem, T.; Naqvi, L.H.; Khalid, M.A.; Sajjad, M.M.; Sultan, M.; Khan, M.U.; Khayrullin, M.; Shariati, M.A.; et al. Conventional and Advanced Extraction Methods of Some Bioactive Compounds with Health Benefits of Food and Plant Waste: A Comprehensive Review. Food Front. 2023, 4, 1681–1701. [Google Scholar] [CrossRef]
- Hammad, S.F.; Abdallah, I.A.; Bedair, A.; Mansour, F.R. Homogeneous Liquid–Liquid Extraction as an Alternative Sample Preparation Technique for Biomedical Analysis. J. Sep. Sci. 2022, 45, 185–209. [Google Scholar] [CrossRef]
- Zhu, C.-Q.; Chen, J.-B.; Zhao, C.-N.; Liu, X.-J.; Chen, Y.-Y.; Liang, J.-J.; Cao, J.-P.; Wang, Y.; Sun, C.-D. Advances in Extraction and Purification of Citrus Flavonoids. Food Front. 2023, 4, 750–781. [Google Scholar] [CrossRef]
- Ma, X.; Wang, L.; He, Q.; Sun, Q.; Yin, D.; Zhang, Y. A Review on Recent Developments and Applications of Green Sorbents-Based Solid Phase Extraction Techniques. Adv. Sample Prep. 2023, 6, 100065. [Google Scholar] [CrossRef]
- Yılmaz, S.; Hazer, B.; Tuzen, M. Extraction and Preconcentration of Lead (II) in Various Water and Food Samples by Orbital Shaker-Assisted Magnetic Solid Phase Extraction Method Using a New Magnetic Poly Linoleic Acid-Polystyrene-PDMS Block Copolymer. Food Chem. 2024, 457, 140114. [Google Scholar] [CrossRef] [PubMed]
- López-Lorente, Á.I.; Pena-Pereira, F.; Pedersen-Bjergaard, S.; Zuin, V.G.; Ozkan, S.A.; Psillakis, E. The Ten Principles of Green Sample Preparation. TrAC Trends Anal. Chem. 2022, 148, 116530. [Google Scholar] [CrossRef]
- Shen, Y.; Hu, Y.; Huang, K.; Yin, S.; Chen, B.; Yao, S. Solid-Phase Extraction of Carotenoids. J. Chromatogr. A 2009, 1216, 5763–5768. [Google Scholar] [CrossRef] [PubMed]
- Vismeh, R.; Humpula, J.F.; Chundawat, S.P.S.; Balan, V.; Dale, B.E.; Jones, A.D. Profiling of Soluble Neutral Oligosaccharides from Treated Biomass Using Solid Phase Extraction and LC–TOF MS. Carbohydr. Polym. 2013, 94, 791–799. [Google Scholar] [CrossRef]
- Millán-Santiago, J.; García-Valverde, M.T.; Lucena, R.; Cárdenas, S. Polyamide-Coated Wooden Tips Coupled to Direct Infusion Mass Spectrometry, a High Throughput Alternative for the Determination of Methadone, Cocaine and Methamphetamine in Oral Fluid. Microchem. J. 2021, 162, 105843. [Google Scholar] [CrossRef]
- Solayman, M.d.; Islam, M.d.A.; Paul, S.; Ali, Y.; Khalil, M.d.I.; Alam, N.; Gan, S.H. Physicochemical Properties, Minerals, Trace Elements, and Heavy Metals in Honey of Different Origins: A Comprehensive Review. Compr. Rev. Food Sci. Food Saf. 2016, 15, 219–233. [Google Scholar] [CrossRef]
- Savitha, R.; Mallelwar, P.; Mohanraj, M.; Renganathan, T.; Pushpavanam, S. Adsorptive Preconcentration Integrated with Colorimetry for Ultra-Sensitive Detection of Lead and Copper. Anal. Bioanal. Chem. 2022, 414, 4089–4102. [Google Scholar] [CrossRef]
- Jing, X.; Wang, H.; Huang, X.; Chen, Z.; Zhu, J.; Wang, X. Digital Image Colorimetry Detection of Carbaryl in Food Samples Based on Liquid Phase Microextraction Coupled with a Microfluidic Thread-Based Analytical Device. Food Chem. 2021, 337, 127971. [Google Scholar] [CrossRef]
- Fan, Y.; Li, J.; Guo, Y.; Xie, L.; Zhang, G. Digital Image Colorimetry on Smartphone for Chemical Analysis: A Review. Measurement 2021, 171, 108829. [Google Scholar] [CrossRef]
- Issarangkura Na Ayutthaya, P.; Yeerum, C.; Kesonkan, K.; Kiwfo, K.; Grudpan, K.; Teshima, N.; Murakami, H.; Vongboot, M. Lead Assays with Smartphone Detection Using a Monolithic Rod with 4-(2-Pyridylazo) Resorcinol. Molecules 2021, 26, 5720. [Google Scholar] [CrossRef]
- Wang, H.; Yang, L.; Chu, S.; Liu, B.; Zhang, Q.; Zou, L.; Yu, S.; Jiang, C. Semiquantitative Visual Detection of Lead Ions with a Smartphone via a Colorimetric Paper-Based Analytical Device. Anal. Chem. 2019, 91, 9292–9299. [Google Scholar] [CrossRef] [PubMed]
- Carolina Souza Andrada Anconi, A.; de Jesus Fonseca, J.L.; Antônio Nunes, C. A Digital Image-Based Colorimetric Method for Measuring Free Acidity in Edible Vegetable Oils. Food Chem. 2024, 443, 138555. [Google Scholar] [CrossRef] [PubMed]
- Landes, F.C.; Paltseva, A.; Sobolewski, J.M.; Cheng, Z.; Ellis, T.K.; Mailloux, B.J.; van Geen, A. A Field Procedure to Screen Soil for Hazardous Lead. Anal. Chem. 2019, 91, 8192–8198. [Google Scholar] [CrossRef] [PubMed]
- Gentile, G.; Tambuzzi, S.; Andreola, S.; Boracchi, M.; Gibelli, L.; Migliorini, A.S.; Zoja, R. Is It Possible to Detect Lead Derived from Gunshot Residues on Decalcified Human Bone by Means of a Histochemical Staining with Sodium Rhodizonate? Forensic Sci. Int. 2020, 316, 110474. [Google Scholar] [CrossRef]
- Joshi, N.C.; Joshi, A.; Mitra, D.; Gururani, P.; Kumar, N.; Joshi, H.K. Removal of Heavy Metals Using Cellulose-Based Materials: A Mini-Review. Environ. Nanotechnol. Monit. Manag. 2024, 21, 100942. [Google Scholar] [CrossRef]
- Yu, X.; Tong, S.; Ge, M.; Wu, L.; Zuo, J.; Cao, C.; Song, W. Adsorption of Heavy Metal Ions from Aqueous Solution by Carboxylated Cellulose Nanocrystals. J. Environ. Sci. 2013, 25, 933–943. [Google Scholar] [CrossRef]
- Maatar, W.; Boufi, S. Poly(Methacylic Acid-Co-Maleic Acid) Grafted Nanofibrillated Cellulose as a Reusable Novel Heavy Metal Ions Adsorbent. Carbohydr. Polym. 2015, 126, 199–207. [Google Scholar] [CrossRef]
- Zhang, X.; Xu, J.; Zhang, Z.; Li, P.; He, C.; Zhong, M. Pb(II) Adsorption Properties of a Three-Dimensional Porous Bacterial Cellulose/Graphene Oxide Composite Hydrogel Subjected to Ultrasonic Treatment. Materials 2024, 17, 3053. [Google Scholar] [CrossRef]
- Satarpai, T.; Shiowatana, J.; Siripinyanond, A. Paper-Based Analytical Device for Sampling, on-Site Preconcentration and Detection of Ppb Lead in Water. Talanta 2016, 154, 504–510. [Google Scholar] [CrossRef]
- Liu, Y.; Wang, W.; Wang, A. Adsorption of Lead Ions from Aqueous Solution by Using Carboxymethyl Cellulose-g-Poly (Acrylic Acid)/Attapulgite Hydrogel Composites. Desalination 2010, 259, 258–264. [Google Scholar] [CrossRef]
- Zhang, H.; Omer, A.M.; Hu, Z.; Yang, L.-Y.; Ji, C.; Ouyang, X. Fabrication of Magnetic Bentonite/Carboxymethyl Chitosan/Sodium Alginate Hydrogel Beads for Cu (II) Adsorption. Int. J. Biol. Macromol. 2019, 135, 490–500. [Google Scholar] [CrossRef]
- Fakhre, N.A.; Ibrahim, B.M. The Use of New Chemically Modified Cellulose for Heavy Metal Ion Adsorption. J. Hazard. Mater. 2018, 343, 324–331. [Google Scholar] [CrossRef]
- Lian, Z.; Li, Y.; Xian, H.; Ouyang, X.; Lu, Y.; Peng, X.; Hu, D. EDTA-Functionalized Magnetic Chitosan Oligosaccharide and Carboxymethyl Cellulose Nanocomposite: Synthesis, Characterization, and Pb(II) Adsorption Performance. Int. J. Biol. Macromol. 2020, 165, 591–600. [Google Scholar] [CrossRef] [PubMed]
- Abdolmohammad-Zadeh, H.; Mousavi, S. Starch-Modified Nickel Ferrite Nanoparticles as a Magnetic Nano-Bio Adsorbent for the Extraction and Determination of Lead in Water and Moringa oleifera Samples. J. Food Compos. Anal. 2024, 136, 106820. [Google Scholar] [CrossRef]
- Luo, J.; Lei, Y.; Ge, Q.; Liu, M.; Jiang, N.; Huang, Y.-H.; Cong, H.; Zhao, J.-L. Carbon Quantum Dots from Hemicucur[6]Bit and the Application for the Detection of Pb2+. Spectrochim. Acta Part A Mol. Biomol. Spectrosc. 2024, 317, 124459. [Google Scholar] [CrossRef] [PubMed]
- Oularbi, L.; Turmine, M.; El Rhazi, M. Electrochemical Determination of Traces Lead Ions Using a New Nanocomposite of Polypyrrole/Carbon Nanofibers. J. Solid State Electrochem. 2017, 21, 3289–3300. [Google Scholar] [CrossRef]
- Santini, S.; Campanella, B.; Giannarelli, S.; Palleschi, V.; Poggialini, F.; Legnaioli, S. Optimization of Carbon-Based Thin Film Microextraction Supports for Simultaneous Detection of Heavy Metals Using LIBS. Spectrochim. Acta Part B At. Spectrosc. 2024, 216, 106948. [Google Scholar] [CrossRef]
- Long, X.; Li, R.; Xiang, J.; Wu, S.; Wang, J. Ultrabright Carbon Dots as a Fluorescent Nano Sensor for Pb2+ Detection. RSC Adv. 2022, 12, 24390–24396. [Google Scholar] [CrossRef]
- Siswanta, D.; Yaqin, A.A.A.; Suherman, S.; Mudasir, M.; Hosseini-Bandegharaei, A. Pb(II) Solid-Phase Extraction in Wastewater Samples Prior to Flame Atomic Absorption Spectrometry Analysis Using Chitosan and Alginate Modified Carbon. Int. J. Environ. Anal. Chem. 2024, 1–13. [Google Scholar] [CrossRef]
Disclaimer/Publisher’s Note: The statements, opinions and data contained in all publications are solely those of the individual author(s) and contributor(s) and not of MDPI and/or the editor(s). MDPI and/or the editor(s) disclaim responsibility for any injury to people or property resulting from any ideas, methods, instructions or products referred to in the content. |
© 2025 by the authors. Licensee MDPI, Basel, Switzerland. This article is an open access article distributed under the terms and conditions of the Creative Commons Attribution (CC BY) license (https://creativecommons.org/licenses/by/4.0/).