Article

HILIC Separation Methods on Poly-Hydroxyl Stationary Phases for Determination of Common Saccharides with Evaporative Light-Scattering Detector and Rapid Determination of Isomaltulose in Protein-Rich Food Supplements

1
Department of Chemical Drugs, Faculty of Pharmacy, Masaryk University Brno, Palackého 1946/1, CZ-61200 Brno, Czech Republic
2
Department of Food Quality and Safety, Faculty of Life Sciences: Food, Nutrition and Health, University of Bayreuth, Fritz-Hornschuch-Straße 13, 95326 Kulmbach, Germany
*
Author to whom correspondence should be addressed.
Separations 2024, 11(2), 45; https://doi.org/10.3390/separations11020045
Submission received: 30 December 2023 / Revised: 15 January 2024 / Accepted: 24 January 2024 / Published: 30 January 2024

Abstract

:
This article highlights the fundamental aspects of hydrophilic interaction liquid chromatography (HILIC) on poly-hydroxyl stationary phases to analyze non-derivatized mono- and disaccharides, including commonly consumed carbohydrates like glucose, fructose, sucrose, and lactose. The evaporative light-scattering detector (ELSD) is utilized as an alternative to an MS detector, and the separation system’s selectivity allows the separation of anomers of monosaccharides. The study also includes a rapid method for determining isomaltulose (Palatinose), which was validated and applied to food supplement samples available in the Czech market, even those with high protein content. Additionally, isomaltulose was separated from sucrose in just 13 min.

1. Introduction

Monosaccharides, disaccharides, oligosaccharides, and polysaccharides are essential sources of dietary energy. In the food industry, certain monosaccharides like glucose, galactose, and fructose, and disaccharides like lactose, sucrose, and maltose, are known for their sweet taste [1]. Additionally, nutritive sweeteners like sorbitol, mannitol, isomalt, maltitol, lactitol, xylitol, and erythritol, which are sugar alcohols, are used.
The amount of total sugars consumed can vary based on age group, with infants consuming up to 38% of their overall energy intake and adults consuming around 13% [2]. However, consuming excessive or frequent amounts of fructose, glucose, and sucrose can contribute to various health issues. Multiple studies have indicated a close relationship between the consumption of both glucose and fructose and the emergence of type 2 diabetes over the past few decades [3,4]. Additionally, high sugar intake can lead to weight gain, obesity [5], negative effects on oral health such as dental caries [6], cardiovascular diseases [7], some cancers [8], and an increased risk of Alzheimer’s disease [9]. Sugar alcohols can also have negative effects on individuals with irritable bowel syndrome (IBS) [10]. To address these risks, health organizations have published recommendations for reducing added dietary sugar intake, with the World Health Organization (WHO) recommending that free sugars make up less than 10% of total caloric consumption [11,12].
With the increasing prevalence of public health issues such as obesity and diabetes, it is essential to increase consumer awareness about sugar consumption and monitor the intake of processed foods. Various regulatory authorities, such as the European Union (EU), Food and Drug Administration (FDA), and Food Safety and Standards Authority of India (FSSAI), have made it mandatory to declare the sugar content on product labels. According to the definition in EU Regulation, saccharides are every saccharide metabolized by a human, including polyols; sugars are mono- and disaccharides, excluding polyols. FDA’s new policy states that an analysis is necessary when the sugar content in foods exceeds 1% [13].
Therefore, it is necessary to assess the carbohydrate composition of the relevant foods and drinks and thereby reduce the consumption of foods with unknown carbohydrate composition and sugar alcohols. Carbohydrate analysis is prescribed by EU law so that customers can assess the nutritional value of foodstuff. As follows from the paragraphs above, although carbohydrates and sugar alcohols (polyols) are Generally Recognized as Safe (GRAS), their amount should be continuously monitored by manufacturers and legislation agencies to ensure customer safety and information regarding the potential health concerns of certain ingredients.

1.1. Isomaltulose in Food Supplements

Food supplements are concentrated sources of nutrients or other substances with a nutritional or physiological effect that are marketed in dose form (e.g., pills, tablets, capsules, liquids in measured doses). A wide range of nutrients and other ingredients might be present in food supplements, including carbohydrates, vitamins, minerals, amino acids, essential fatty acids, fiber, and various herbal extracts. There are reviews on food supplements, e.g., [14], and also on herbal food supplements for body weight reduction [15].
Food and dietary supplements may contain a variety of sugar alcohols, monosaccharides, disaccharides, and oligosaccharides. Some of the commercially available food supplements contain rapidly metabolized carbohydrates like glucose and fructose for “quick energy”, while maltodextrins may serve as a sustained energy source. In 2008, the FDA (Food and Drug Administration) included isomaltulose in substances eligible for health claims, and subsequently, the European Food Safety Authority (EFSA) also affirmed its positive health impact. Nowadays, isomaltulose can be found in the market as a sugar substitute in tooth-friendly chewing gum, instant teas designed to prevent tooth decay, and lifestyle nutrition products. Isomaltulose has also become popular as a part of “healthy” or “complete food” [16]. The use of isomaltulose (Palatinose) has also led to clinical trials exploring its potential benefits in dietary supplements not only for enhancing physical performance [17], but also in pre-diabetes and diabetes treatment [18,19,20].

1.2. Methods for Sugar Determination

Today, determining mono- and disaccharides stands out as one of the most requested tests in food analysis laboratories. The comprehensive analysis of glucose, fructose, sucrose, lactose, and maltose is essential for determining the overall sugar content in diverse food products. The evolving landscape of complex food matrices and product innovations underscores the necessity of scrutinizing sugar content in a wide array of foods, including cereals, dairy products, sweets, beverages, and sauces [1].
Sugar analysis proves valuable for monitoring claims in low-calorie foods, assessing energy content, checking fruit juice quality including adulteration, determining lactose levels in milk, and measuring lactose in low-lactose or lactose-free foods [21,22], monosaccharides from starch-based glucose or sucrose hydrolysis [23], or horticultural sugars [24].
The main path to analyze carbohydrates is either gas chromatography after derivatization or HPLC (mainly reversed-phase HPLC on C18-columns), ion exchange chromatography on cation exchange columns in, typically, K+, Ca2+, or Pb2+ cycle, or by high-performance anion exchange chromatography with pulsed amperometric detection (HPAE-PAD), hydrophobic interaction chromatography, and size exclusion chromatography or capillary electrophoresis.

1.3. HILIC-ELSD

Hydrophilic interaction liquid chromatography (HILIC) is popular for separation of polar analytes on polar columns in aqueous–organic mobile phases rich in organic solvents (typically acetonitrile) [25,26,27,28], although the term HILIC was not coined until 1990 by Alpert [29]. Overview of methods for natural carbohydrates can be found in [28]. A recent review on HILIC application in bioanalytical chemistry is available in [30] or specifically for glycopeptide analysis in [31].
Since 1975 [32], the amine-bonded silica stationary phase has been widely used for the separation of saccharides and polyols, and is still recommended, although disadvantages of amine-bonded silica columns are (i) a short life-time due to the formation of glycosamides between the stationary phase amines and reducing sugars (column deactivation) and (ii) also bleeding of the aminopropyl ligand. Recently, thanks to advances in HPLC stationary phase technology, several amino phases are available on the market that overcome these drawbacks: either replacing silica gel with a polymer support or by using a carbamoyl- or an amide- groups (BEH, ethylene bridged hybrid) as stationary phases [33]. Stationary phases for HILIC have been reviewed by Guarducci et al. [34]. In the last decade, HILIC on poly-hydroxyl stationary phases was used for analysis, separation, and determination of saccharides [35,36,37,38,39].
Carbohydrates do not contain suitable chromophores for common UV detection, so that, apart from derivation, other types of detection principles must be applied. Polarimetry or universal refractive index detector (RID) are still in use; recently, Tiwari et al. validated a method on an amino column (mobile phase acetonitrile–water) with RID [27]. Evaporative light-scattering detector (ELSD) is today very popular for the detection of poly- or oligo-saccharides after hydrolysis of various products [40,41,42]. A review on carbohydrate analysis with ELSD can be found in [43]. Extreme selectivity of poly-hydroxyl stationary phases with ELSD was utilized for separation and identification of glucose, fructose, and rhamnose after hydrolysis of glycosides [36].

1.4. Protein-Rich Sample Preparation

Analyzing protein-rich aqueous samples, such as milk, plasma, and food supplements, directly with certain techniques is challenging due to the presence of various interferences and incompatibility with instrumental conditions. Consequently, effective sample preparation steps are essential for protein-rich aqueous samples before conducting LC or GC analysis [44]. Various methods, including liquid–liquid extraction (LLE), solid-phase extraction (SPE), solid-phase microextraction (SPME), and magnetic solid-phase extraction (MSPE), have been developed for this purpose [45]. Among these methods, LLE stands out as one of the oldest and most widely employed techniques for preparing protein-rich aqueous samples. It offers advantages in terms of simplicity and cost-effectiveness, making it a popular choice in scientific research and routine applications [46]. Efforts have been devoted to enhancing the traditional LLE technique, aiming for a faster, simpler, and more efficient methodology [47].
The presence of a high amount of proteins requires a denaturation step which is very often performed in biology (denaturation of peptides) [48] or proteomics [49]. However, denaturation protocols may differ depending on sample type, experimental goals, and the analytical method used. Many factors are considered when designing sample preparation strategies, including source, type, physical properties, abundance, and complexity of the proteins. Compared to, e.g., cell samples, special food supplements with added pure proteins represent a relatively simple matrix, so thermal denaturation and routine deproteinization with acetonitrile may be sufficient.
The goal of this paper is to demonstrate the principles of optimization and development of a rapid analysis of sugars and sugar alcohols in HILIC mode with an evaporative light-scattering detector, a less economically demanding alternative to an MS detector. Two separation systems with ELSD were used for this. To investigate the retention behavior of monosaccharides, disaccharides, trisaccharides, and tetrasaccharides, System 1 (Halo Penta-HILIC column) was used, and for the determination of isomaltulose (Palatinose), System 2 (Merck Lichrosphere100 DIOL column) was optimized; the method was validated and applied to 14 food supplement samples.

2. Materials and Methods

2.1. Apparatus and Columns

Two HPLC-ELSD systems were employed:
System 1 was an HPLC Dionex Ultimate 3000 (ThermoFisher Scientific, Wilmington, Germany), connected to a 380-LC evaporative light-scattering detector (Varian, Palo Alto, CA, USA). The column was Halo Penta-HILIC (AMT, Wilmington, DE, USA), 150 mm × 4.1 mm with particles 2.7 μm. ELSD parameters were set as follows. Nitrogen flowrate was 1 slm, laser source intensity was 100%, temperatures of both nebulizer and evaporator were 40 °C, the gain was 5, and smooth factor was 10.
System 2 was an HPLC series 1200 apparatus (Agilent Technologies, Santa Clara, CA, USA) connected to ELSD. The column was LiChrospher100 DIOL 5 μm, 125 mm × 4 mm (Merck, Darmstadt, Germany). Parameters of ELSD were always as follows. The chamber temperature was 40 °C, pressure in nebulizer was 2.9 bar (air), and the gain factor was 10.

2.2. Chemicals and Samples

D-mannose, D-glucose, D-arabinose, D-fructose, D-galactose, sucrose, raffinose, stachyose, myo-inositol, ammonium formate, acetonitrile supragradient HPLC grade, formic acid, and trichloroacetic acid (TCA) were purchased from Sigma Aldrich; anthracene, D-ribose, L-rhamnose, D-xylose, ribitol (adonitol), galactitol (dulcitol), mannitol, L-sorbose, lactose, trehalose, maltose, cellobiose, were from Lachema, Czech Republic. A list of samples is in Table 1. More information about the sample’s composition is available in the Supplementary Materials (Table S1).

2.3. Determination of Void Volume by HILIC-ELSD

To calculate retention factors, void volume was determined by injection of anthracene (concentration of 1 mg/mL in acetonitrile) into the mobile phase (buffer content 10–15% at flow rates 0.5–2 mL/min). No signal was observed on ELSD at higher buffer content (higher water amount in the mobile phase). The void volume determined from the measurements was 1.46 mL for System 1 (Halo Penta-HILIC, AMT) and 1.08 mL for System 2 (Lichrosphere100 DIOL, Merck), respectively.

3. Results and Discussion

3.1. Retention Behavior of Polyols in HILIC (System 1)

A standard HILIC configuration consists of a column that employs a hydrophilic polar stationary phase, such as aminopropyl, diol, amide, or zwitterionic. The mobile phase is a mixture of acetonitrile–water or acetonitrile–aqueous buffer with a significant amount of organic solvent (60–95%). When using ELSD, it is necessary to choose from “MS-compatible” volatile buffers, like ammonium formate, acetate, bicarbonate, or carbonate. The content of the aqueous part in the mobile phase together with the column temperature plays a crucial role in retention.
Previous research [39] shows that poly-hydroxyl columns are well-suited for separating and determining polyols (such as sugar alcohols and saccharides). When used in the HILIC mode, the poly-hydroxyl stationary phase provides exceptional selectivity and can even resolve anomers [35]. However, if multiple anomeric signals are undesirable, a basic aminopropyl stationary phase may be used instead. Furthermore, in qualitative analyses, using a poly-hydroxyl column can aid in identifying a specific monosaccharide.

3.1.1. Isocratic Elution

Typically, in HILIC mode, which is sometimes called a mixed mode, since adsorption and partitioning effects also take place in the separation mechanism, one can observe the following retention behavior. Decreasing temperature or lower content of water (aqueous buffer) in the mobile phase causes an increase in retention, and consequently an increase in resolution (even resolution of anomers), but also a decrease in peak areas. On the contrary, a higher temperature or elution strength due to a higher content of water (aqueous buffer) causes lower retention, decrease (loss) of resolution, but also an increase in peak areas. The effect of temperature at 10 and 25 °C on retention is illustrated in Figure 1.
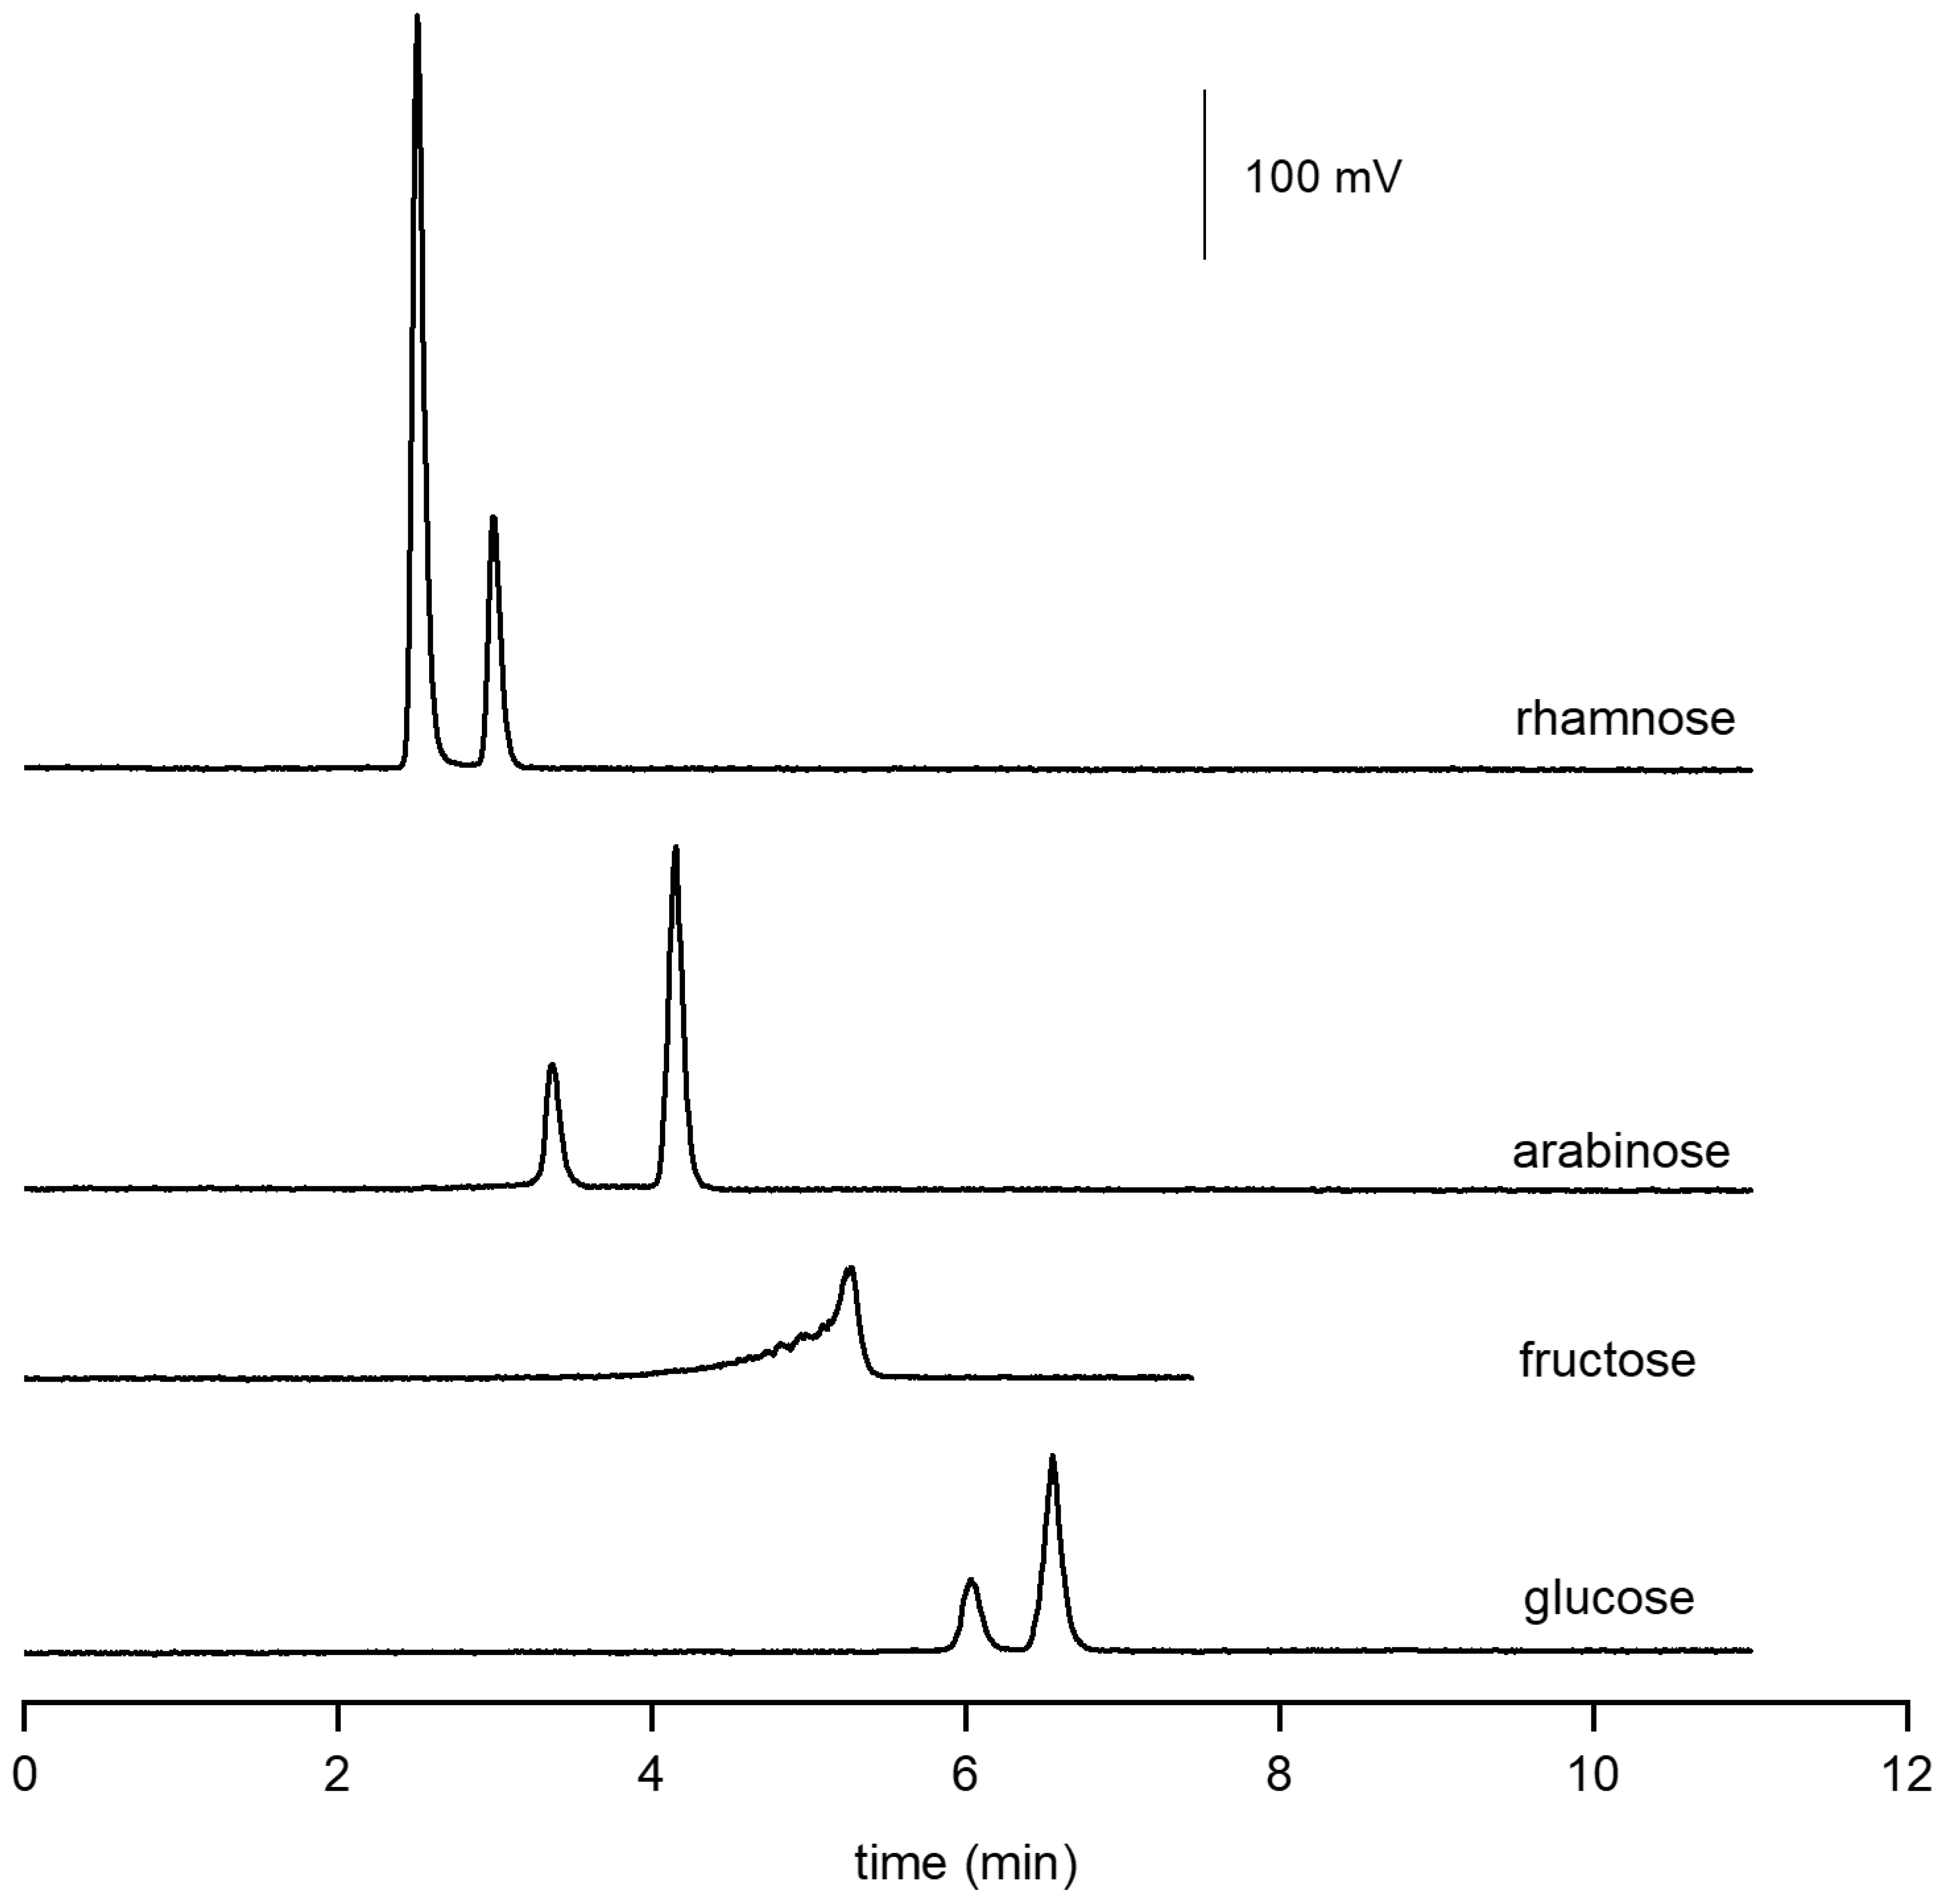
The graph shows a tendency to increase retention with an increasing number of hydroxyls. Sugar alcohols show higher retention than the corresponding saccharides (ribose–ribitol, xylose–xylitol, sorbose–sorbitol, mannose–mannitol, galactose-galactitol); extreme retention can be observed for myo-inositol (cyclohexane-hexol). The highest resolution, even baseline resolution of monosaccharide anomers, can be achieved at 10 °C, though, at this temperature, fructose exhibits a fronting peak due to the presence of isomers (see Figure 2). At higher temperatures, the fructose peak becomes symmetrical, while at the same time, the retention of all other polyols decreases. It should be noted that typically, HILIC operates between 20 and 40 °C. However, from a practical point of view, cooling the column compartment to a temperature lower than the ambient temperature requires a time-consuming equilibration step, and keeping the temperature below 10 °C may not be possible with regard to an instrumentation. In addition, in HILIC mode, lower temperatures imply lower sensitivity of the method because the peak areas decrease. On the other hand, at temperatures close to 40 °C, peak areas (sensitivity of the method) increase, while the resolution between closely retained polyols may be lost. Therefore, the optimal conditions chosen for the method are a compromise between these two conflicting factors.

3.1.2. Gradient Elution

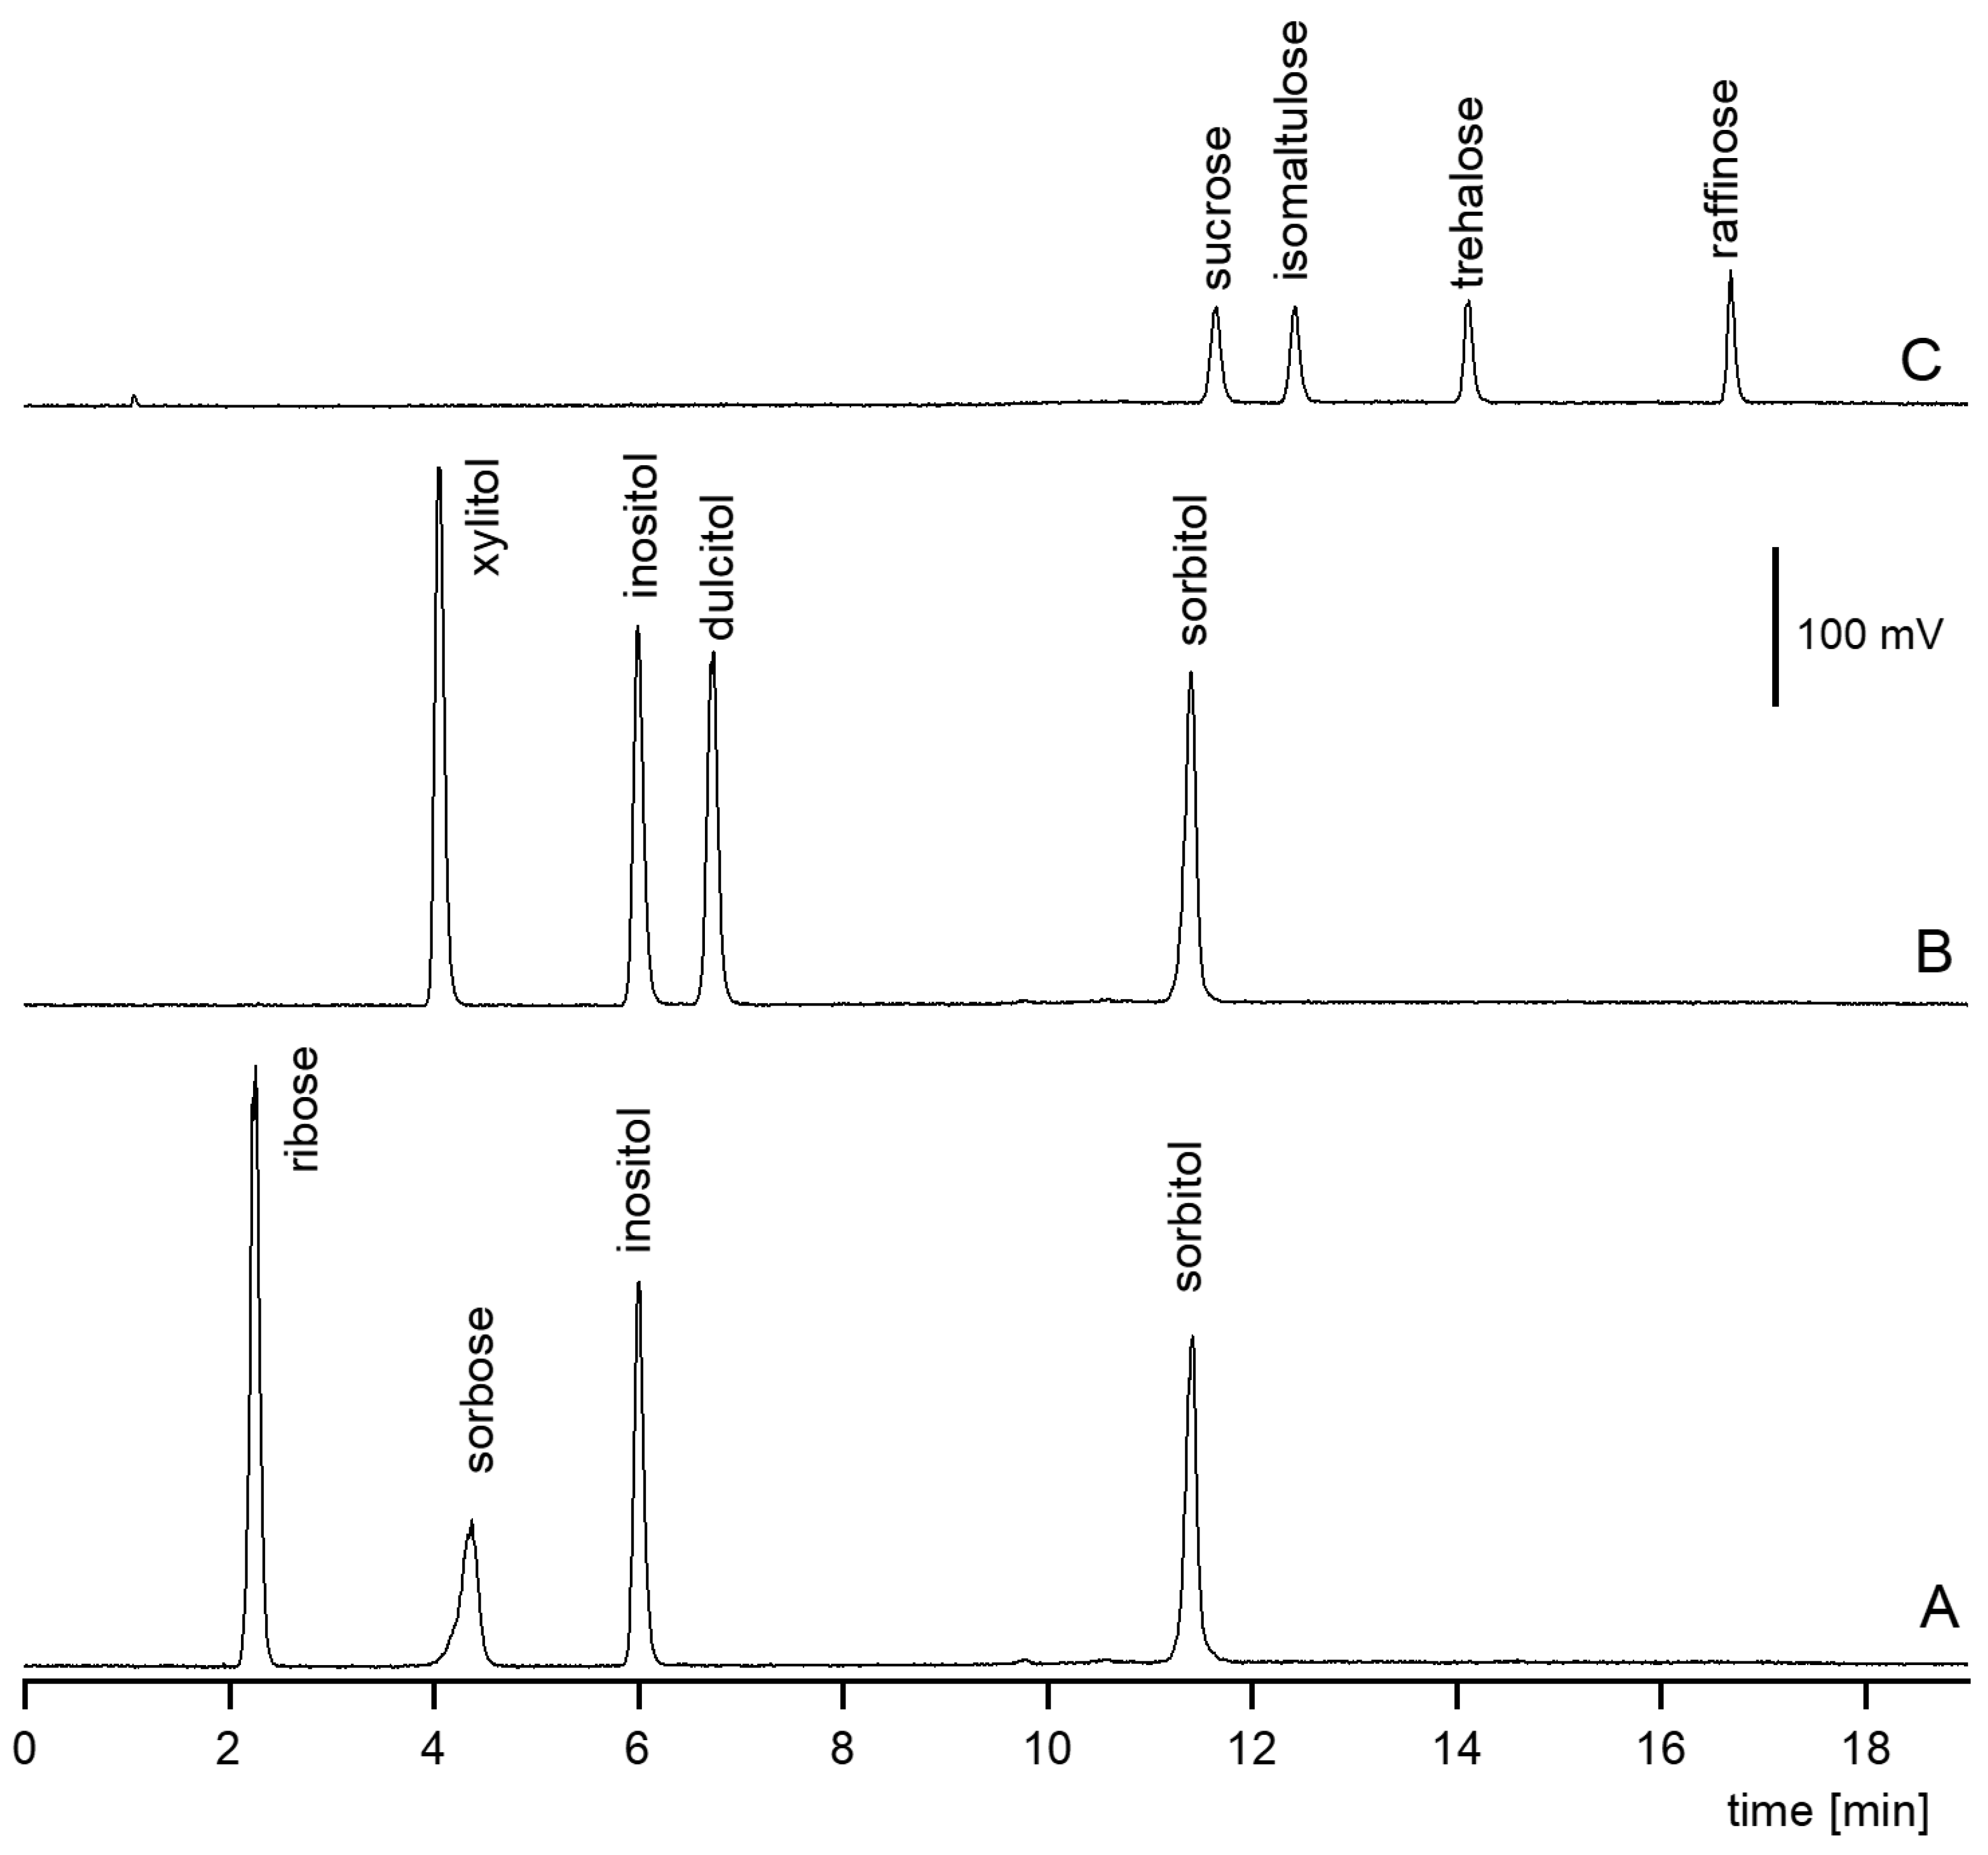
If the resolution of anomers is not desired, along with a higher temperature (20–40 °C), gradient elution is a tool to speed up the analysis of highly retained polyols, e.g., disaccharides and oligosaccharides. Figure 3 shows rapid separations (12–18 min) of mixtures of various polyols with gradient elution.
Clearly, depending on the composition of a mixture of saccharides in the sample, the gradient can be adjusted to avoid, for example, a ten-minute gap in a mixture of disaccharides (see Figure 3, chromatogram C). For tetrasaccharides or oligosaccharides, suitable content of aqueous phase (buffer) could be as high as 35%.
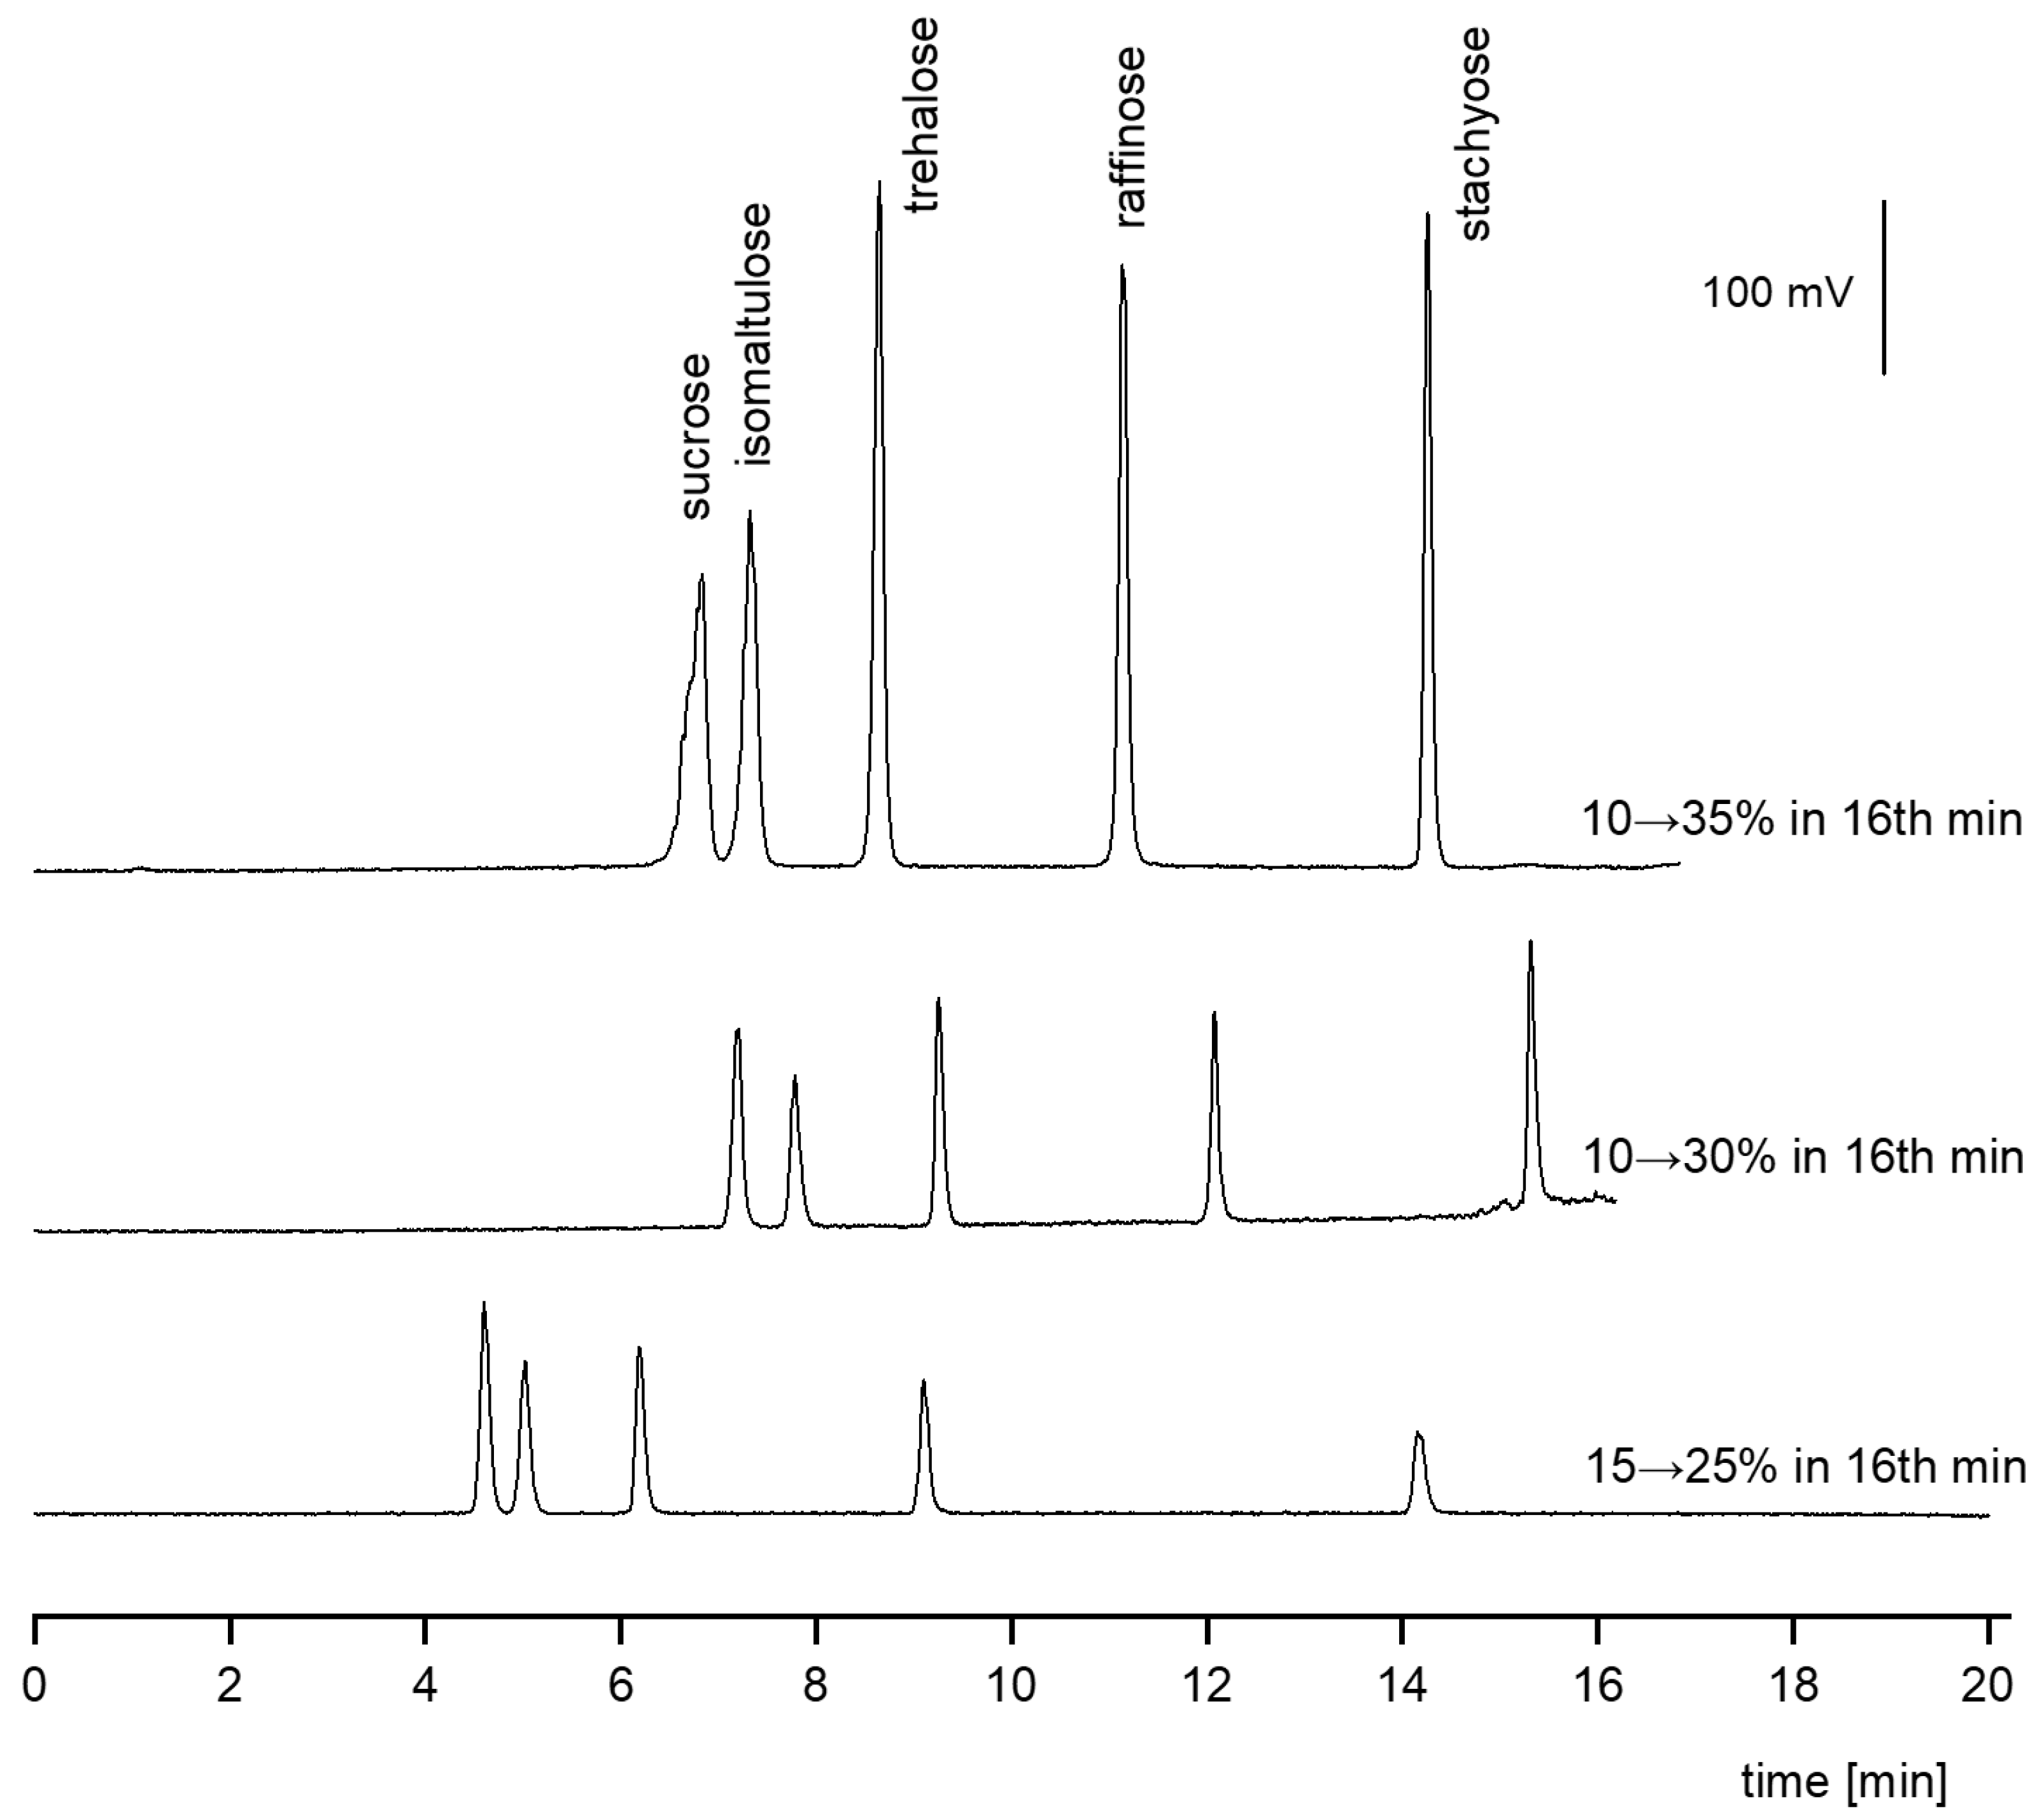
Figure 4 shows the effect of three various gradients on a rapid separation of a mixture of three disaccharides, a trisaccharide, and a tetrasaccharide (sucrose, isomaltulose, trehalose, raffinose, and stachyose). The chromatograms in Figure 4 show the potential for separation (and determination) of analytes in mixtures of different saccharides after tuning the elution gradient (experimental conditions) on poly-hydroxyl stationary phases.

3.2. Method for Isomaltulose Determination (System 2)

The method for the determination of isomaltulose was developed based on our previous results [39,50]. Some experimental parameters were adopted. As the mobile phase (isocratic elution), 20 mM ammonium formate buffer pH 3.8, and acetonitrile were used, injection volume was 5 μL, gas pressure in ELSD was 2.9 bar (air), temperature of the detector was 40 °C, and gain was 10.
To maximize the resolution between isomaltulose and sucrose, the experimental factors most affecting retention, namely temperature, flowrate, and buffer content in the mobile phase, were optimized. The optimum values found (where resolution between isomaltulose and sucrose was greater than 1.5) were as follows: temperature 11 °C, flow rate 1.0 mL/min, and buffer content 16% (84% of acetonitrile). Under these conditions, isomaltulose was baseline separated from sucrose within 13 min. Since the method was intended for samples with matrix containing oligosaccharides, after elution of isomaltulose, a cleaning step with 50% of buffer for 5 min was added (matrix removal), and finally, the column was conditioned back to 16% of the buffer.
The summary of the optimal experimental conditions for the determination of isomaltulose (System 2) is as follows. Column was Lichrosphere100 DIOL (Merck, Darmstadt, Germany) 125 mm × 4 mm, 5 μm, column compartment temperature was 11 °C, mobile phase was 20 mM ammonium formate buffer of pH 3.8, flowrate was 1.0 mL/min, chamber temperature of ELSD was 40 °C, pressure of air in nebulizer was 2.9 bar, the gain factor was 10, and the elution program was 0–10 min buffer 16%, 10–11 min buffer 16–50%, 11–16 min buffer 50%, and 16–17 min buffer 50–16%. Under these conditions, validation of the method was performed, with results in Table 2.

3.2.1. Sample Preparation with a Protein-Rich Matrix and Recovery Measurement

Saccharides are highly soluble in water, which is the solvent of first choice for sample preparation. If the sample is a diluted drink, gel, or a mixture of pure carbohydrates, the sample is usually ready after homogenization and filtration through a 0.45 µm filter.
However, many food supplements for athletes or bodybuilders (running gels, body-building instant drinks) may contain carbohydrates, flavors, vitamins, and proteins. In this case, the natural first step of sample preparation is proper homogenization into water to maximize extraction of saccharides and then to denaturate matrix proteins, e.g., by heating and/or by trichloroacetic acid (TCA). Our complete sample preparation protocol was as follows:
  • A total of 0.1–0.5 g of the sample (according to isomaltulose content) was weighed, and the granulated or powdered sample was homogenized in a mortar to a fine powder.
  • The powder was reconstituted by filling with water to 6.0 mL, shaken briefly, and ultrasonicated for 10 min.
  • The sample was heated in a test tube to 90 °C in a dry bath for 15 min and then centrifuged at 5000 rpm for 5 min.
  • A total of 0.2 mL of supernatant was taken, and 0.2 mL of 20% TCA was added into a 2 mL Eppendorf test tube, shaken for 5 min, and filled up to 1.5 mL with water.
  • The sample was shaken, then centrifugated for 10 min at 13,500 rpm; the supernatant was filtered through a 0.45 µm microfilter into an HPLC vial and injected.
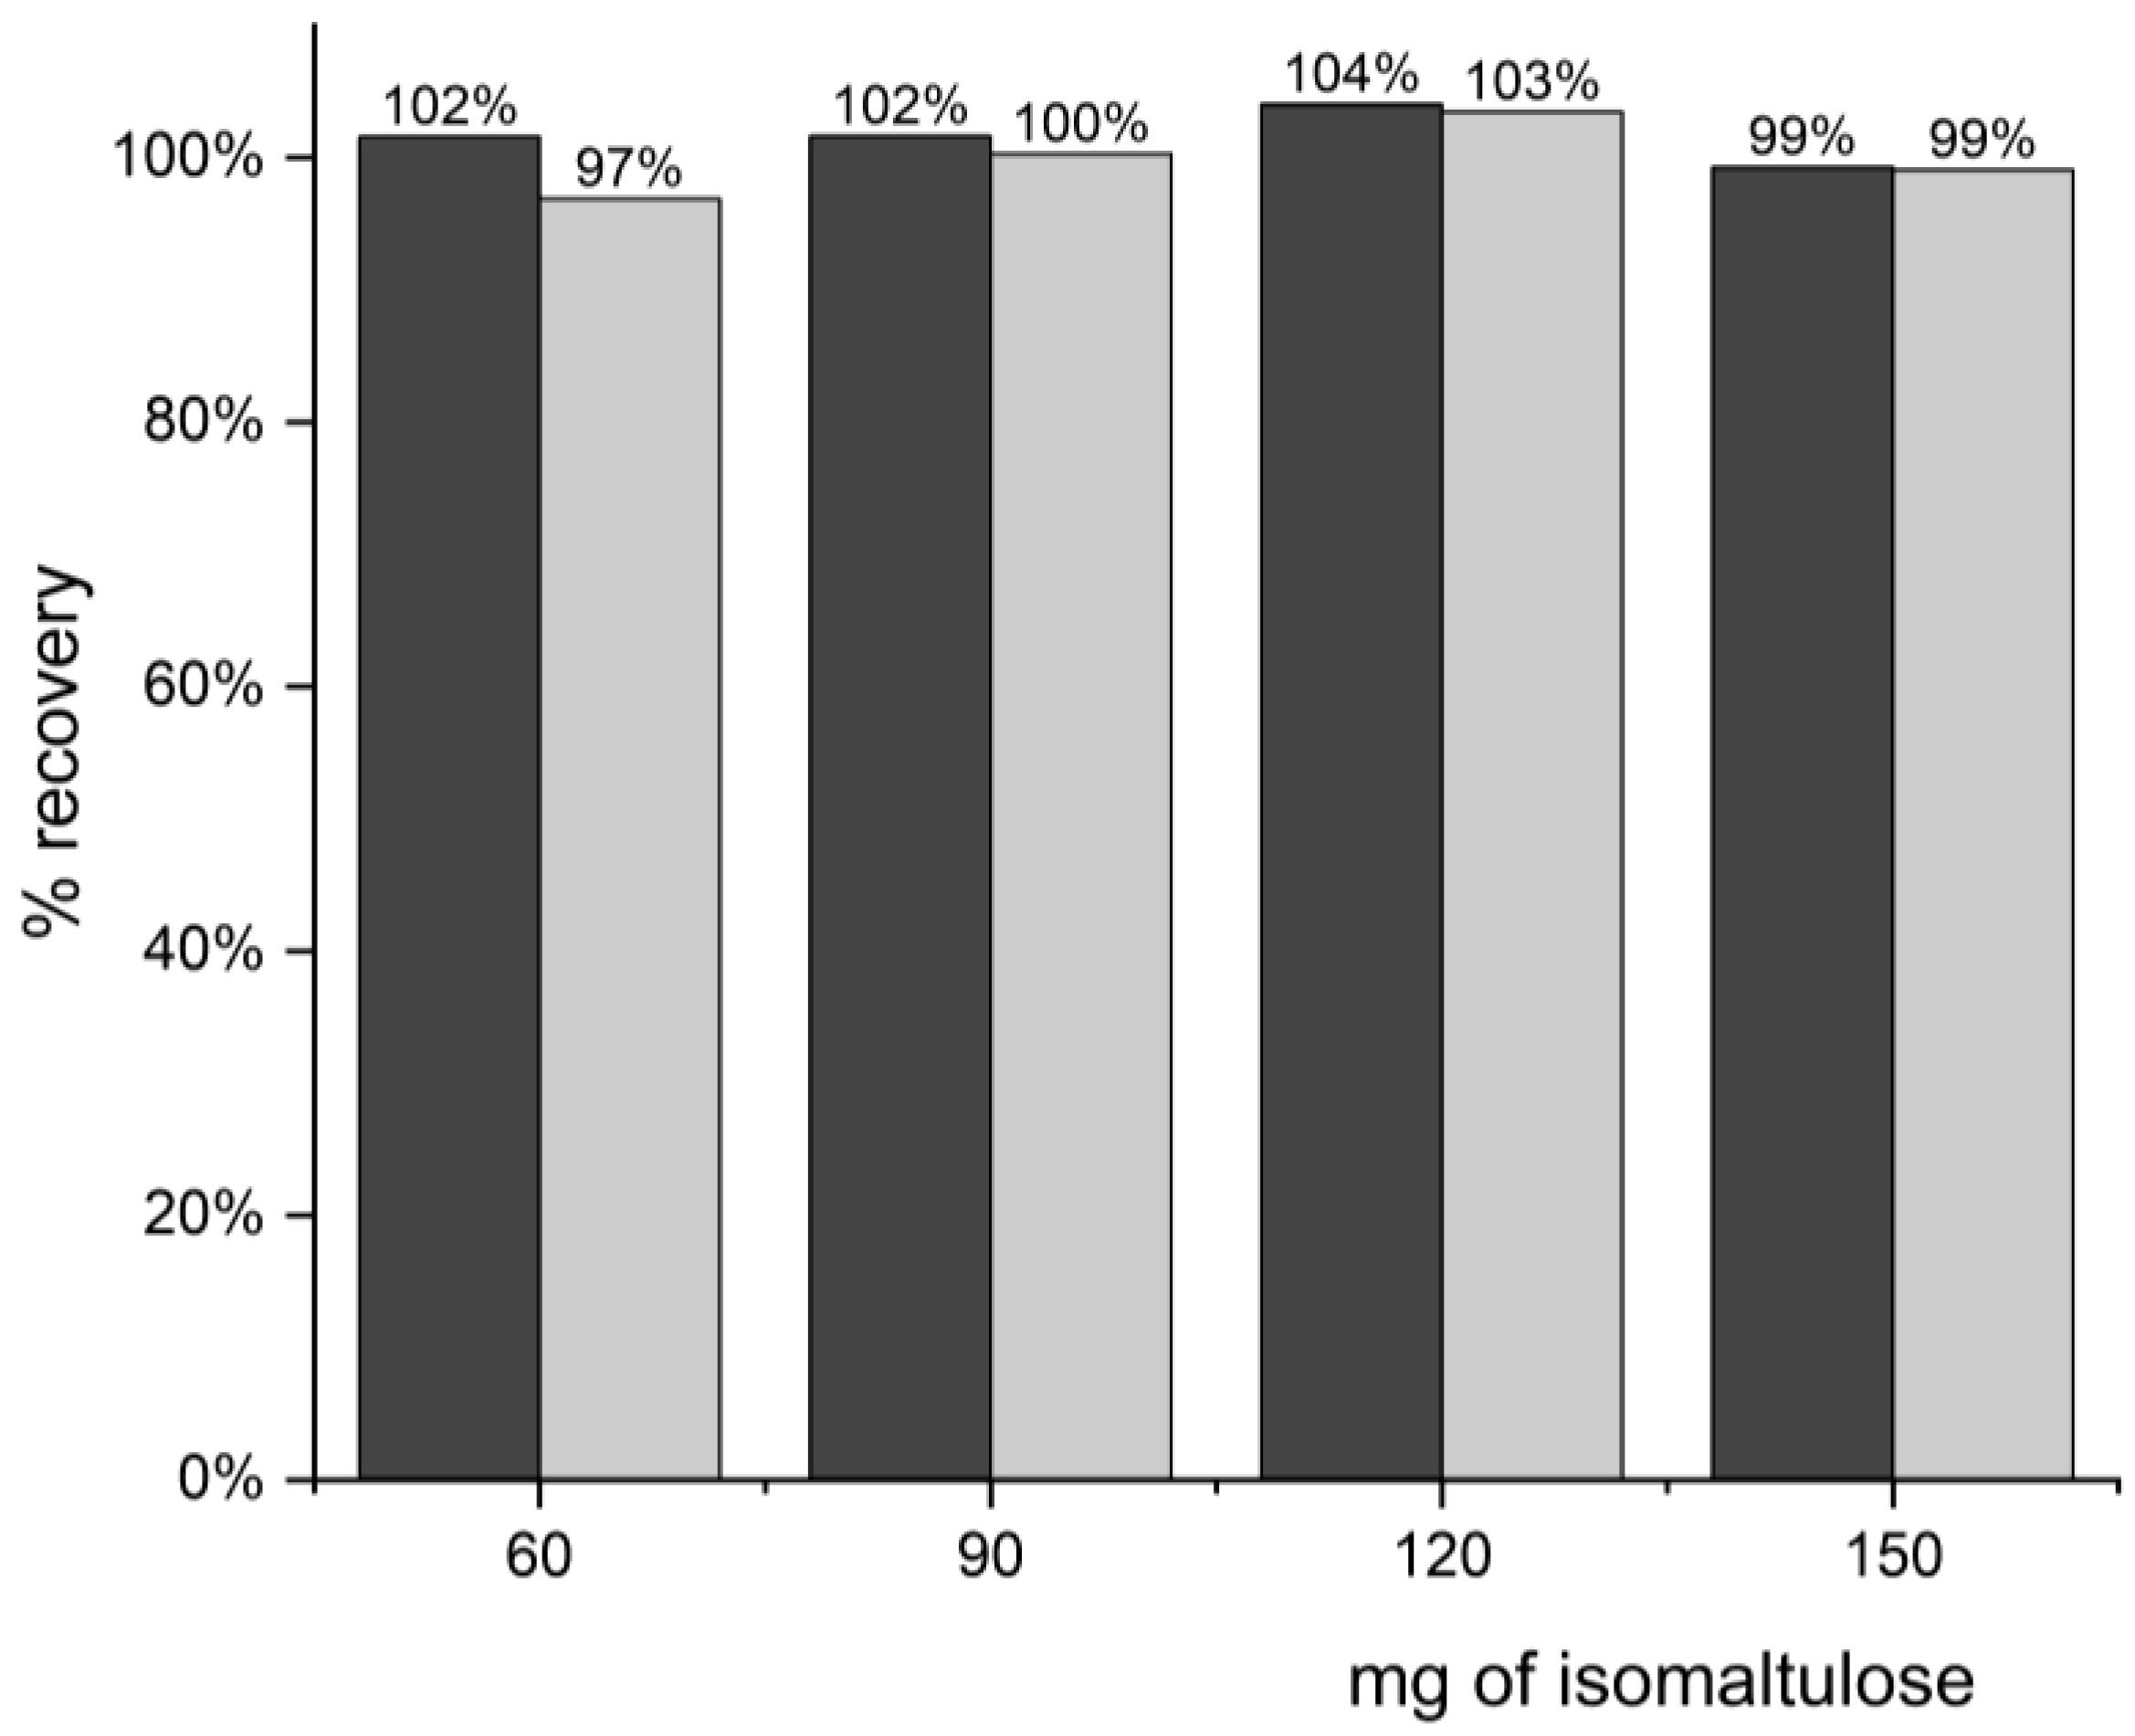
The recovery was determined by the addition a known amount of isomaltulose (four concentration levels corresponding to the calibration range) to a food supplement rich in whey protein, the main ingredient added to protein supplements. Then, the recovery was calculated the usual way, as Recovery = Observed amount/Spiked amount × 100%.
The results of recovery measurements (see Figure 5) suggest that the sample preparation protocol is suitable for extraction of isomaltulose from protein-rich samples since no significant parts of the analyte are lost during the sample preparation, so the procedure can be applied to real samples.

3.2.2. Application of HILIC on Poly-Hydroxyl Stationary Phase to Determination of Isomaltulose in Food Supplements

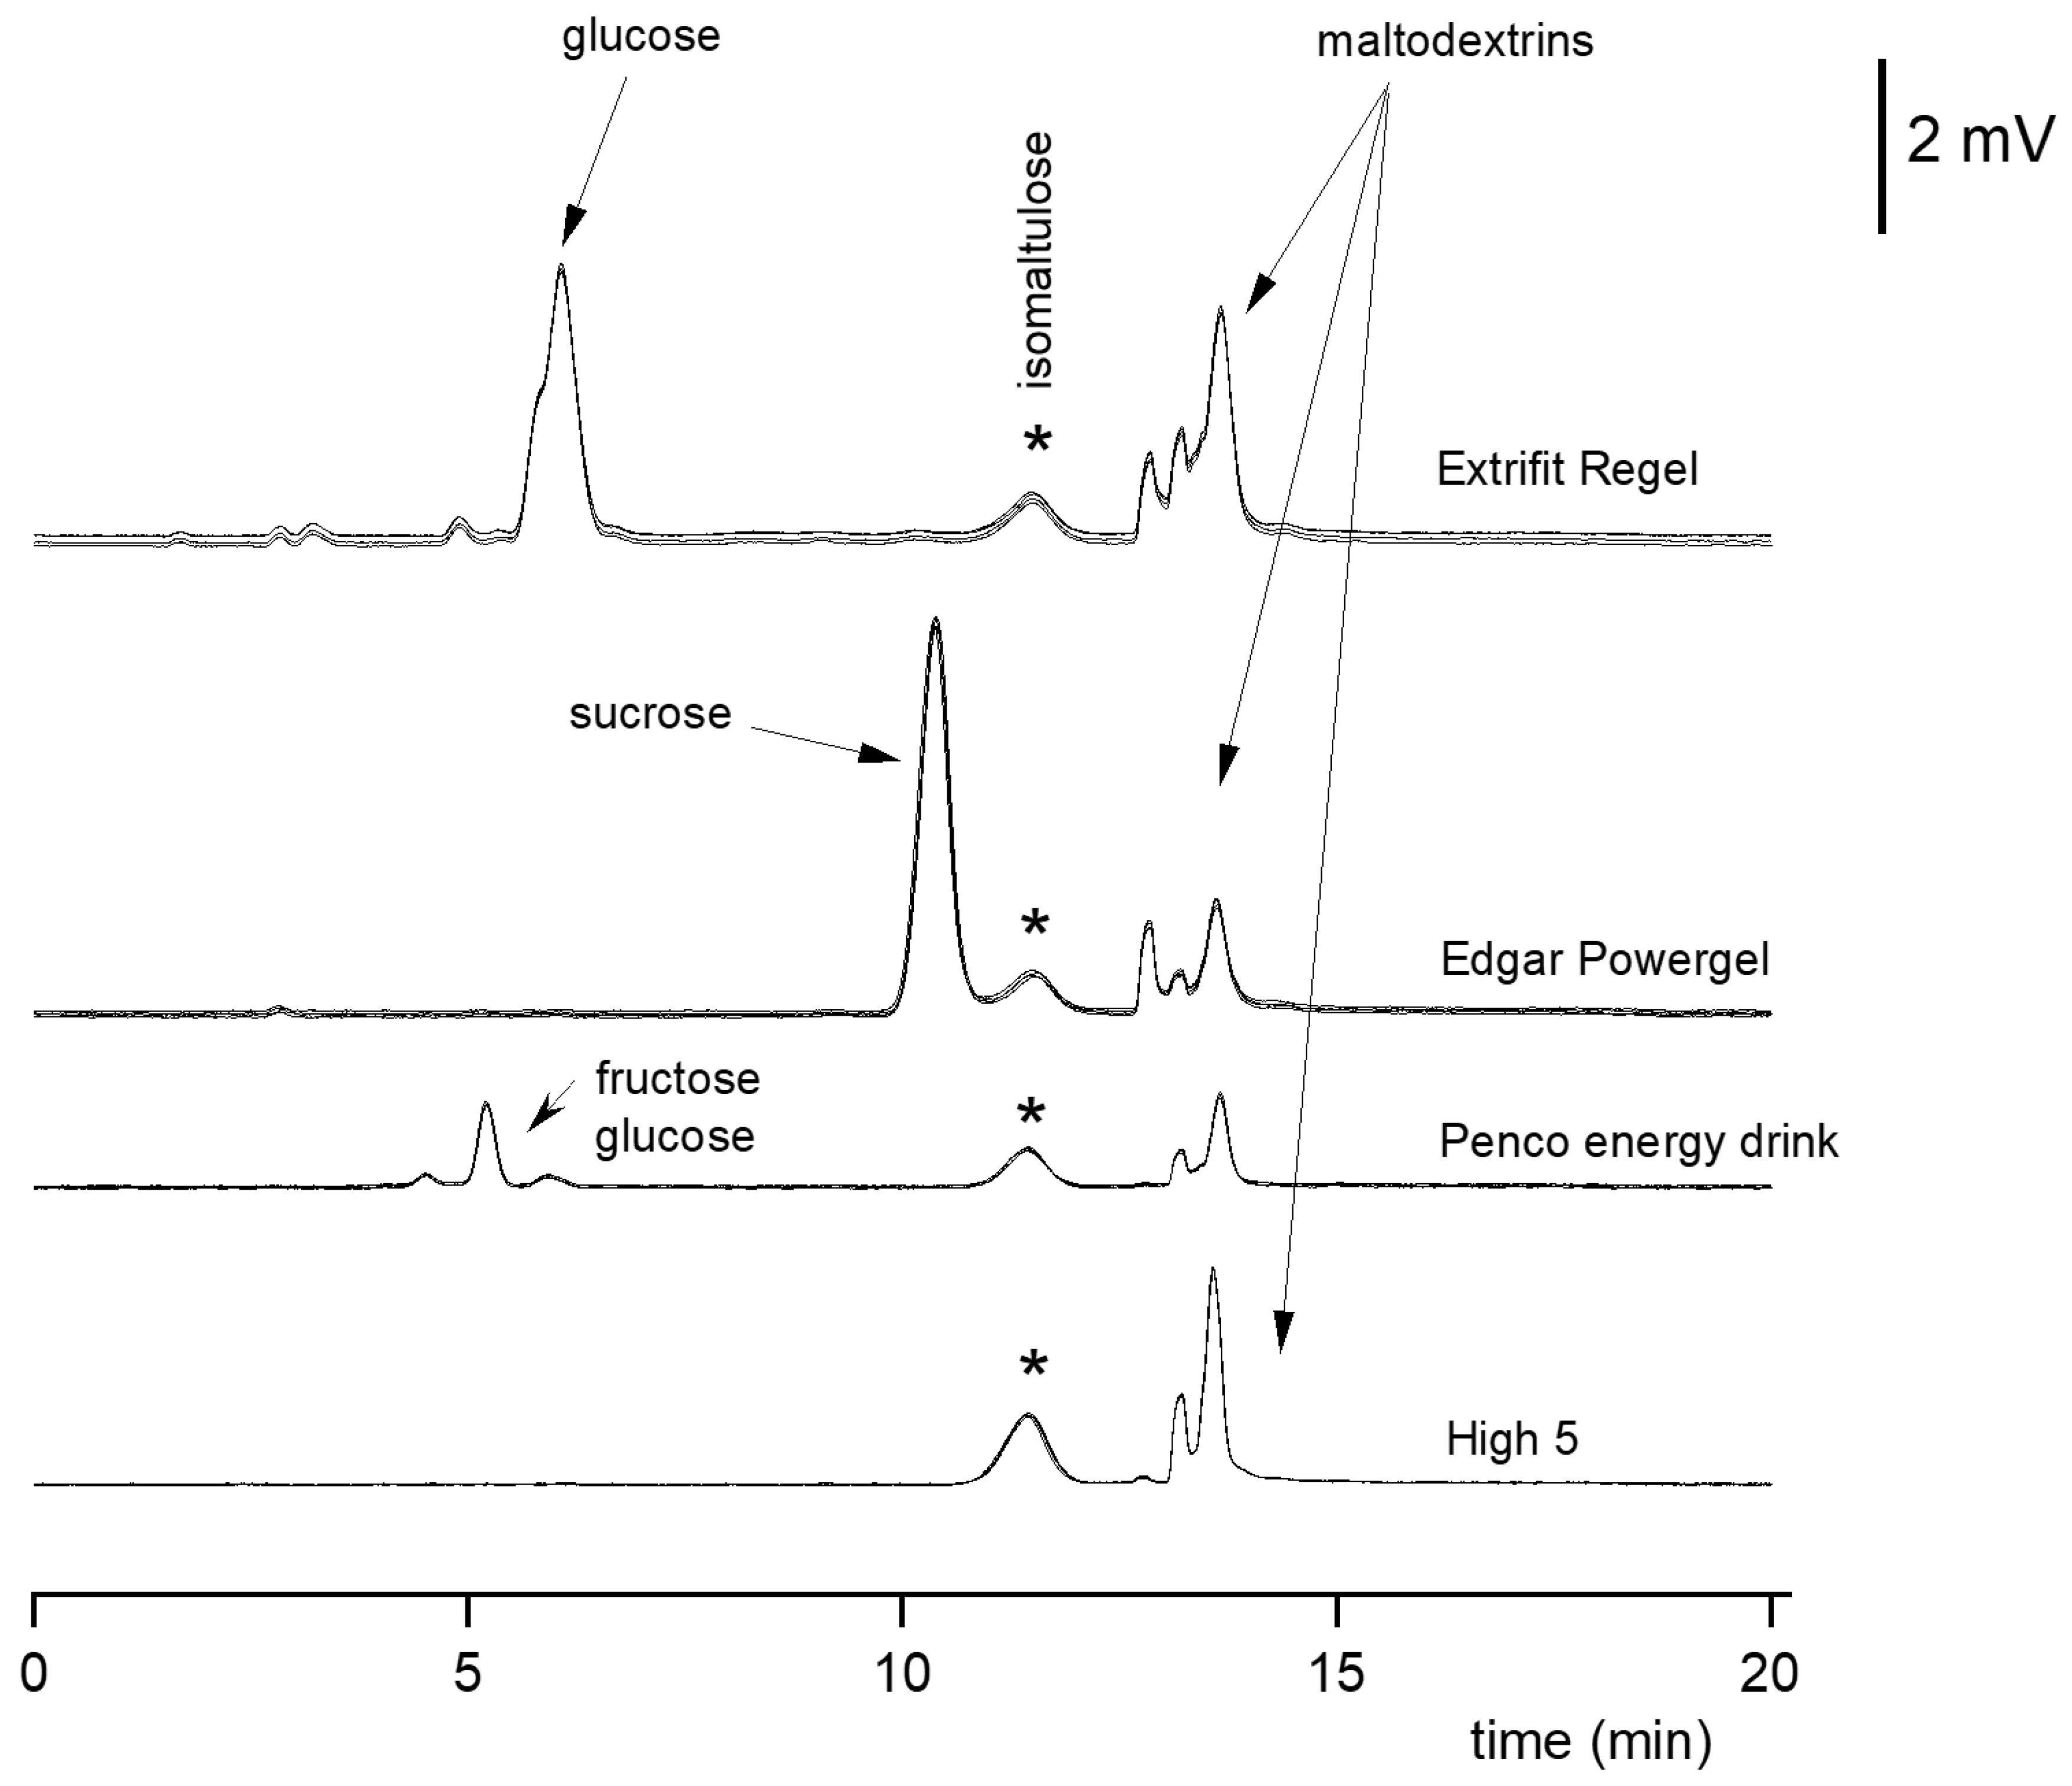
Real samples may contain mixtures of various carbohydrates. In the gel sample “Amix Nutrition slow gel”, only one peak of isomaltulose (11.4 min) was present. In the liquid sample “Nutrend Turbo effect”, two main signals of glucose and isomaltulose were found. In the sample “Nutriworks Osmo worx”, apart from an isomaltulose peak, a dominant peak of maltodextrins was shown. In gel samples “Enervit Pre Sport”, there were major signals of glucose, isomaltulose, and maltodextrins. “Edgar power drink” and “Edgar Vegan Powerdrink” samples exhibited isomaltulose with glucose, sucrose, and maltodextrins (chromatograms not shown).
In Figure 6, one can see (from bottom to top) peaks of isomaltulose (11.4 min) and maltodextrins (13.5 min) in sample “High5 Energy drink”. In the sample “Penco Ultra endurance drink”, apart from isomaltulose and maltodextrins, there are peaks of fructose and glucose (4.5–6 min). In the sample “Edgar Powergel”, glucose is replaced with sucrose (10.5 min) in contrast to the “Penco Ultra endurance drink”. The most complex matrix containing various proteins (according to declaration) exhibits “Extrifit Regel”, but they are clearly separated; there are dominant peaks of glucose, isomaltulose, and maltodextrins.
Samples with a protein-rich matrix (“Extrifit Beefmass”, “Nutrend After Training protein”, “Nutrend Compress B.I.G.”) were prepared with the deproteination protocol. Chromatograms always started with an intensive peak of TCA around 2 min (not shown). The amounts of isomaltulose in samples “Nutrend After Training Protein” and “Nutrend Compress B.I.G.” were in good agreement with the declared values (see Table 3).
Table 3 summarizes the values of isomaltulose determined in all the samples. It is important to comment on the declared values of food supplements. First, the manufacturer must declare the total “carbohydrates”, which also include polysaccharides (starch, maltodextrins) and the amount of digestible carbohydrates (“sugars” or “saccharides”), such as mono- and disaccharides, excluding sugar alcohols; in our case, it can be a mixture of glucose, sucrose, and isomaltulose. Therefore, the declaration of a specific saccharide from these two categories (isomaltulose in sugars) is optional. Second, all carbohydrates are substances without risk of overdose/underdosage, so there are no strict penalties for a higher or lower amount of them in food supplements. The first comment explains the labels N/A in Table 3.

4. Conclusions

The exceptional selectivity of poly-hydroxyl stationary phases towards monosaccharides, disaccharides, and sugar alcohols allows their separation in mixtures, including isomers such as glucose–galactose and isomaltulose–sucrose. Furthermore, the anomers of these compounds can be separated under HILIC mode. The evaporative light-scattering detector (ELSD) is an economical alternative to an MS detector for the detection of carbohydrates. Therefore, by using columns with poly-hydroxyl stationary phases (such as DIOL and Penta-HILIC columns), hyphenated to ELSD, the separation and determination of monosaccharides, disaccharides, and sugar alcohols in HILIC mode can be effectively performed. With knowledge of the retention behavior, especially the impact of the column temperature and the mobile phase elution strength, one can optimize the experimental conditions for a specific combination of carbohydrates in real samples.
Due to the high solubility of saccharides, experiments with standards can easily be performed with their aqueous solutions. For samples with a simple matrix, the sample preparation is usually trivial (dissolution in water, sonication, and filtration); for complex matrix samples, a deproteinization step should be included.
In the presented method, a two-step deproteinization protocol was used with a yield of 97–104% (thermal deproteinization, followed by TCA). The results of the determination are in good agreement with the declared values. For samples where the isomaltulose content is not declared, the calculated values fit the declaration of sugars (digestible carbohydrates; see discussion).

Supplementary Materials

The following supporting information can be downloaded at: https://www.mdpi.com/article/10.3390/separations11020045/s1, Table S1: More information on the samples–links to producers’ web pages, Figure S1: Linearization of the calibration curve (System 2).

Author Contributions

Conceptualization, J.P.; validation, J.P.; formal analysis, G.F.O. and T.C.; investigation, G.F.O., T.C. and J.P.; resources, T.C.; writing—original draft preparation, G.F.O. and T.C.; writing—review and editing, J.P.; visualization, J.P.; supervision, J.P.; project administration, J.P.; funding acquisition, T.C. and J.P. All authors have read and agreed to the published version of the manuscript.

Funding

This research work was supported by an SVV grant MUNI/A/1236/2021 of Masaryk University Brno, Czech Republic. https://www.muni.cz/vyzkum/projekty/66102 (accessed on 20 December 2023).

Data Availability Statement

Data are contained within the Supplementary Materials.

Conflicts of Interest

The authors declare no conflicts of interest.

References

  1. Eliasson, A.C. Carbohydrates in Food; CRC Press, Taylor & Francis Group: Boca Raton, FL, USA, 2006. [Google Scholar]
  2. Newens, K.J.; Walton, J. A review of sugar consumption from nationally representative dietary surveys across the world. J. Hum. Nutr. Diet. 2016, 29, 225–240. [Google Scholar] [CrossRef]
  3. Jacobsen, S.S.; Vistisen, D.; Vilsbøll, T.; Bruun, J.M.; Ewers, B. The quality of dietary carbohydrate and fat is associated with better metabolic control in persons with type 1 and type 2 diabetes. Nutr. J. 2020, 19, 125. [Google Scholar] [CrossRef]
  4. DiNicolantonio, J.J.; O’Keefe, J.H.; Lucan, S.C. Added Fructose: A Principal Driver of Type 2 Diabetes Mellitus and Its Consequences. Mayo Clin. Proc. 2015, 90, 372–381. [Google Scholar] [CrossRef]
  5. Smajis, S.; Gajdošík, M.; Pfleger, L.; Traussnigg, S.; Kienbacher, C.; Halilbasic, E.; Ranzenberger-Haider, T.; Stangl, A.; Beiglböck, H.; Wolf, P.; et al. Metabolic effects of a prolonged, very-high-dose dietary fructose challenge in healthy subjects. Am. J. Clin. Nutr. 2020, 111, 369–377. [Google Scholar] [CrossRef] [PubMed]
  6. Moynihan, P.J.; Kelly, S.A.M. Effect on Caries of Restricting Sugars Intake:Systematic Review to Inform WHO Guidelines. J. Dent. Res. 2014, 93, 8–18. [Google Scholar] [CrossRef] [PubMed]
  7. Keller, A.; Heitmann, B.L.; Olsen, N. Sugar-sweetened beverages, vascular risk factors and events: A systematic literature review. Public Health Nutr. 2015, 18, 1145–1154. [Google Scholar] [CrossRef] [PubMed]
  8. Long, T.; Liu, K.; Long, J.; Li, J.; Cheng, L. Dietary glycemic index, glycemic load and cancer risk: A meta-analysis of prospective cohort studies. Eur. J. Nutr. 2022, 61, 2115–2127. [Google Scholar] [CrossRef] [PubMed]
  9. Liu, L.; Volpe, S.L.; Ross, J.A.; Grimm, J.A.; Van Bockstaele, E.J.; Eisen, H.J. Dietary sugar intake and risk of Alzheimer’s disease in older women. Nutr. Neurosci. 2022, 25, 2302–2313. [Google Scholar] [CrossRef]
  10. Schumann, D.; Klose, P.; Lauche, R.; Dobos, G.; Langhorst, J.; Cramer, H. Low fermentable, oligo-, di-, mono-saccharides and polyol diet in the treatment of irritable bowel syndrome: A systematic review and meta-analysis. Nutrition 2018, 45, 24–31. [Google Scholar] [CrossRef]
  11. WHO. Guideline: Sugars Intake for Adults and Children; World Health Organization: Geneva, Switzerland, 2015. [Google Scholar]
  12. Mooradian, A.D.; Smith, M.; Tokuda, M. The role of artificial and natural sweeteners in reducing the consumption of table sugar: A narrative review. Clin. Nutr. ESPEN 2017, 18, 1–8. [Google Scholar] [CrossRef]
  13. Erickson, J.; Slavin, J. Total, Added, and Free Sugars: Are Restrictive Guidelines Science-Based or Achievable? Nutrients 2015, 7, 2866–2878. [Google Scholar] [CrossRef]
  14. Cencic, A.; Chingwaru, W. The Role of Functional Foods, Nutraceuticals, and Food Supplements in Intestinal Health. Nutrients 2010, 2, 611–625. [Google Scholar] [CrossRef] [PubMed]
  15. Pittler, M.H.; Schmidt, K.; Ernst, E. Adverse events of herbal food supplements for body weight reduction: Systematic review. Obes. Rev. 2005, 6, 93–111. [Google Scholar] [CrossRef] [PubMed]
  16. MANA. Available online: https://drink-mana.com/pages/why-mana (accessed on 9 April 2022).
  17. Shyam, S.; Ramadas, A.; Chang, S.K. Isomaltulose: Recent evidence for health benefits. J. Funct. Food. 2018, 48, 173–178. [Google Scholar] [CrossRef]
  18. Kokubo, E.; Morita, S.; Nagashima, H.; Oshio, K.; Iwamoto, H.; Miyaji, K. Blood Glucose Response of a Low-Carbohydrate Oral Nutritional Supplement with Isomaltulose and Soluble Dietary Fiber in Individuals with Prediabetes: A Randomized, Single-Blind Crossover Trial. Nutrients 2022, 14, 2386. [Google Scholar] [CrossRef] [PubMed]
  19. Davila, L.A.; Bermudez, V.; Aparicio, D.; Cespedes, V.; Escobar, M.C.; Duran-Aguero, S.; Cisternas, S.; Costa, J.D.; Rojas-Gomez, D.; Reyna, N.; et al. Effect of Oral Nutritional Supplements with Sucromalt and Isomaltulose versus Standard Formula on Glycaemic Index, Entero-Insular Axis Peptides and Subjective Appetite in Patients with Type 2 Diabetes: A Randomised Cross-Over Study. Nutrients 2019, 11, 1477. [Google Scholar] [CrossRef]
  20. Hwang, D.; Park, H.R.; Lee, S.J.; Kim, H.W.; Kim, J.H.; Shin, K.S. Oral administration of palatinose vs sucrose improves hyperglycemia in normal C57BL/6J mice. Nutr. Res. 2018, 59, 44–52. [Google Scholar] [CrossRef] [PubMed]
  21. Chávez-Servín, J.L.; Castellote, A.I.; López-Sabater, M.C. Analysis of mono- and disaccharides in milk-based formulae by high-performance liquid chromatography with refractive index detection. J. Chromatogr. A 2004, 1043, 211–215. [Google Scholar] [CrossRef]
  22. Peris-Tortajada, M. HPLC Detemination of Carbohydrates in Foods. In Food Analysis by HPLC; Nollet, L.M.L., Toldra, F., Eds.; CRC Press: Boca Raton, FL, USA, 2012. [Google Scholar]
  23. Wach, W.; Fornefett, I.; Buttersack, C.; Buchholz, K. Chromatographic separation of saccharide mixtures on zeolites. Food Bioprod. Process. 2019, 114, 286–297. [Google Scholar] [CrossRef]
  24. Magwaza, L.S.; Opara, U.L. Analytical methods for determination of sugars and sweetness of horticultural products—A review. Sci. Hortic. 2015, 184, 179–192. [Google Scholar] [CrossRef]
  25. Karkacier, M.; Erbas, M.; Uslu, M.K.; Aksu, M. Comparison of Different Extraction and Detection Methods for Sugars Using Amino-Bonded Phase HPLC. J. Chromatogr. Sci. 2003, 41, 331–333. [Google Scholar] [CrossRef] [PubMed]
  26. Soyseven, M.; Sezgin, B.; Arli, G. A novel, rapid and robust HPLC-ELSD method for simultaneous determination of fructose, glucose and sucrose in various food samples: Method development and validation. J. Food Compos. Anal. 2022, 107, 104400. [Google Scholar] [CrossRef]
  27. Tiwari, M.; Mhatre, S.; Vyas, T.; Bapna, A.; Raghavan, G. A Validated HPLC-RID Method for Quantification and Optimization of Total Sugars: Fructose, Glucose, Sucrose, and Lactose in Eggless Mayonnaise. Separations 2023, 10, 199. [Google Scholar] [CrossRef]
  28. Kurzyna-Szklarek, M.; Cybulska, J.; Zdunek, A. Analysis of the chemical composition of natural carbohydrates—An overview of methods. Food Chem. 2022, 394, 133466. [Google Scholar] [CrossRef]
  29. Alpert, A.J. Hydrophilic-interaction chromatography for the separation of peptides, nucleic acids and other polar compounds. J. Chromatogr. A 1990, 499, 177–196. [Google Scholar] [CrossRef] [PubMed]
  30. Sheng, Q.Y.; Liu, M.Y.; Lan, M.B.; Qing, G.Y. Hydrophilic interaction liquid chromatography promotes the development of bio-separation and bio-analytical chemistry. Trac-Trends Anal. Chem. 2023, 165, 117148. [Google Scholar] [CrossRef]
  31. Liu, Z.L.; Xu, M.M.; Zhang, W.Q.; Miao, X.Y.; Wang, P.G.; Li, S.W.; Yang, S. Recent development in hydrophilic interaction liquid chromatography stationary materials for glycopeptide analysis. Anal. Methods 2022, 14, 4437–4448. [Google Scholar] [CrossRef]
  32. Inoue, Y.; Yamamoto, A. Stationary phases for the separation of reducing sugars by normal-phase partition chromatography. Chromatography 2014, 35, 63–72. [Google Scholar] [CrossRef]
  33. Pitsch, J.; Weghuber, J. Hydrophilic Interaction Chromatography Coupled with Charged Aerosol Detection for Simultaneous Quantitation of Carbohydrates, Polyols and Ions in Food and Beverages. Molecules 2019, 24, 4333. [Google Scholar] [CrossRef]
  34. Guarducci, M.A.; Fochetti, A.; Ciogli, A.; Mazzoccanti, G. A Compendium of the Principal Stationary Phases Used in Hydrophilic Interaction Chromatography: Where Have We Arrived? Separations 2023, 10, 22. [Google Scholar] [CrossRef]
  35. Pazourek, J. Monitoring of mutarotation of monosaccharides by hydrophilic interaction chromatography. J. Sep. Sci. 2010, 33, 974–981. [Google Scholar] [CrossRef]
  36. Špačková, V.; Pazourek, J. Identification of carbohydrate isomers in flavonoid glycosides after hydrolysis by hydrophilic interaction chromatography. Chem. Pap. 2013, 67, 357–364. [Google Scholar] [CrossRef]
  37. Pazourek, J. Fast separation and determination of free myo-inositol by hydrophilic liquid chromatography. Carbohydr. Res. 2014, 391, 55–60. [Google Scholar] [CrossRef] [PubMed]
  38. Pazourek, J. Determination of glucosamine and monitoring of its mutarotation by hydrophilic interaction liquid chromatography with evaporative light scattering detector. Biomed. Chromatogr. 2018, 32, e4368. [Google Scholar] [CrossRef]
  39. Crha, T.; Pazourek, J. Rapid HPLC Method for Determination of Isomaltulose in the Presence of Glucose, Sucrose, and Maltodextrins in Dietary Supplements. Foods 2020, 9, 1164. [Google Scholar] [CrossRef] [PubMed]
  40. Zhao, H.Q.; Wang, L.; Yu, Y.; Yang, J.; Zhang, X.B.; Zhao, Z.G.; Ma, F.L.; Hu, M.H.; Wang, X. Comparison of Lycium barbarum fruits polysaccharide from different regions of China by acidic hydrolysate fingerprinting-based HILIC-ELSD-ESI-TOF-MS combined with chemometrics analysis. Phytochem. Anal. 2023, 34, 186–197. [Google Scholar] [CrossRef]
  41. Doyle, M.; Barnes, A.; Larson, N.R.; Liu, H.Y.; Yi, L.D. Development of UPLC-UV-ELSD Method for Fatty Acid Profiling in Polysorbate 80 and Confirmation of the Presence of Conjugated Fatty Acids by Mass Spectrometry, UV Absorbance and Proton Nuclear Magnetic Resonance Spectroscopy. J. Pharm. Sci. 2023, 112, 2393–2403. [Google Scholar] [CrossRef] [PubMed]
  42. Yu, H.Y.; Park, S.E.; Chun, H.S.; Rho, J.R.; Ahn, S. Phospholipid composition analysis of krill oil through HPLC with ELSD: Development, validation, and comparison with 31P NMR spectroscopy. J. Food Compos. Anal. 2022, 107, 104408. [Google Scholar] [CrossRef]
  43. Dvořáčková, E.; Šnóblová, M.; Hrdlička, P. Carbohydrate analysis: From sample preparation to HPLC on different stationary phases coupled with evaporative light-scattering detection. J. Sep. Sci. 2014, 37, 323–337. [Google Scholar] [CrossRef]
  44. Chen, D.; Zhang, J.-X.; Cui, W.-Q.; Zhang, J.-W.; Wu, D.-Q.; Yu, X.-R.; Luo, Y.-B.; Jiang, X.-Y.; Zhu, F.-P.; Hussain, D.; et al. A simultaneous extraction/derivatization strategy coupled with liquid chromatography–tandem mass spectrometry for the determination of free catecholamines in biological fluids. J. Chromatogr. A 2021, 1654, 462474. [Google Scholar] [CrossRef]
  45. Xia, L.; Yang, J.; Su, R.; Zhou, W.; Zhang, Y.; Zhong, Y.; Huang, S.; Chen, Y.; Li, G. Recent Progress in Fast Sample Preparation Techniques. Anal. Chem. 2020, 92, 34–48. [Google Scholar] [CrossRef]
  46. Khatibi, S.A.; Hamidi, S.; Siahi-Shadbad, M.R. Application of Liquid-Liquid Extraction for the Determination of Antibiotics in the Foodstuff: Recent Trends and Developments. Crit. Rev. Anal. Chem. 2022, 52, 327–342. [Google Scholar] [CrossRef]
  47. Yamini, Y.; Rezazadeh, M.; Seidi, S. Liquid-phase microextraction—The different principles and configurations. TrAC Trends Anal. Chem. 2019, 112, 264–272. [Google Scholar] [CrossRef]
  48. Park, Z.-Y.; Russell, D.H. Thermal Denaturation:  A Useful Technique in Peptide Mass Mapping. Anal. Chem. 2000, 72, 2667–2670. [Google Scholar] [CrossRef]
  49. Yang, Z.; Shen, X.; Chen, D.; Sun, L. Toward a Universal Sample Preparation Method for Denaturing Top-Down Proteomics of Complex Proteomes. J. Proteome Res. 2020, 19, 3315–3325. [Google Scholar] [CrossRef] [PubMed]
  50. Pazourek, J. Rapid HPLC method for monitoring of lactulose production with a high yield. Carbohydr. Res. 2019, 484, 107773. [Google Scholar] [CrossRef] [PubMed]
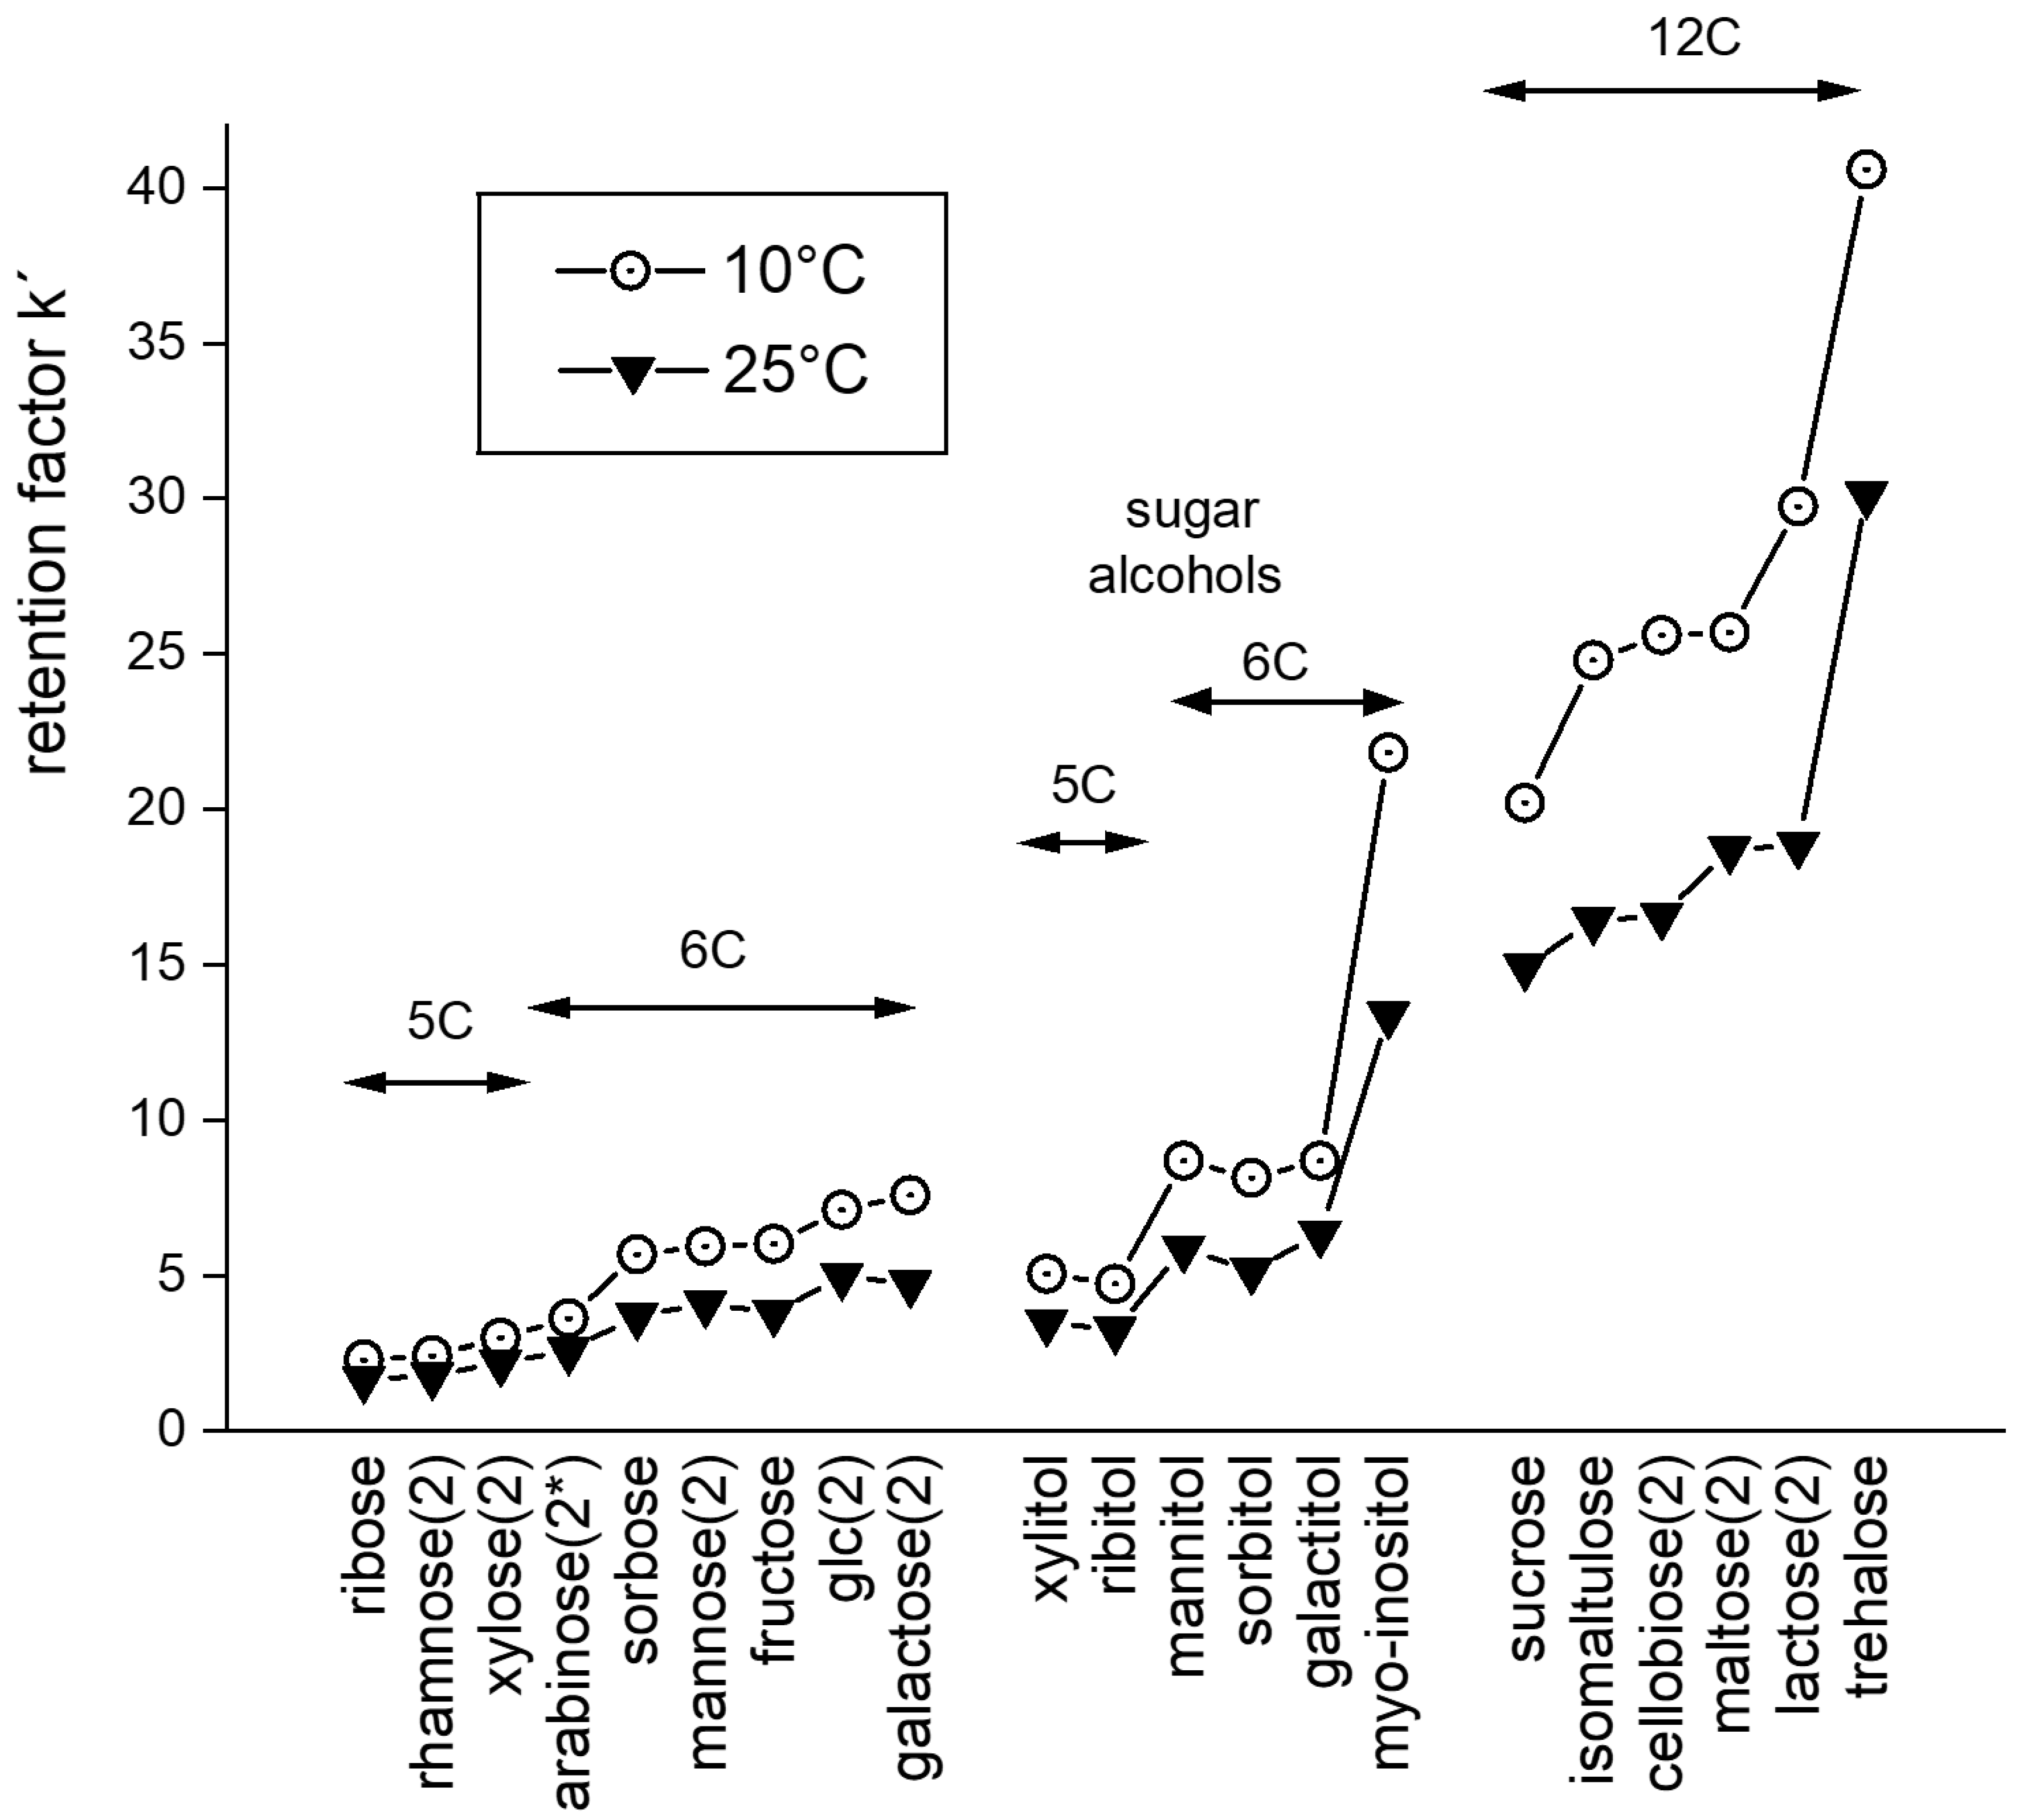
Figure 1. Overview of retention factors of polyols studied at two different column temperatures. Experimental conditions were as follows. System 1, 25 mM ammonium formate buffer pH = 3.8, isocratic elution (10% buffer and 90% acetonitrile), concentration of standards was 1 mg/mL, injection volume 1–2 μL, flowrate 2 mL/min. In legends, 5C, 6C, and 12C denote five, six, or twelve carbons, respectively, in the molecule. (2) means two or more (2*) main peaks are observed (anomers). Open circles indicate retention factors at 10 °C, and closed triangles indicate retention factors at 25 °C. The points are connected with a line for clarity only.
Separations 11 00045 g001
Figure 2. Comparison of retention of selected monosaccharides with multiple signals of anomers. Experimental conditions: System 1, column temperature was 10 °C, the mobile phase was a mixture of 25 mM ammonium formate buffer pH = 3.8, 10% (v/v) and acetonitrile, 90% (v/v), elution was isocratic, flowrate was 2 mL/min, concentration of the standards was 1 mg/mL, injection volume was 2 μL.
Separations 11 00045 g002
Figure 3. Fast separations of polyols by a gradient elution. Labels at peaks denote the corresponding standard. Chromatogram A: 5C monosaccharide ribose and 6C sorbose (ketose) in a mixture with C6 sugar alcohols of inositol and sorbitol; chromatogram B: a mixture of sugar alcohols (xylitol, inositol, ribitol, and sorbitol); chromatogram C: a mixture of disaccharides (sucrose, isomaltulose, trehalose) and a trisaccharide raffinose. Experimental conditions: System 1, temperature 25 °C, concentration of each standard in the mixture was 1 mg/mL, injection volume was 5–10 μL. Elution gradient (the mobile phase was a mixture of 25 mM ammonium formate buffer pH = 3.8 and acetonitrile): 0 min (buffer 5%), 0–16 min linear gradient from 5% up to 25% of buffer, 16–20 min linear gradient from 25% down to 5% buffer.
Separations 11 00045 g003
Figure 4. Modulation of retention by elution gradient in System 1, temperature 25 °C. The mixture always contains sucrose, isomaltulose, trehalose (disaccharides), raffinose (trisaccharide), and stachyose (tetrasaccharide). The legend indicates the gradient used; the initial buffer content was 10 or 15%, the final buffer content (25, 30, or 35%) were always reached at the 16th minute.
Separations 11 00045 g004
Figure 5. Recovery under optimized conditions and using the deproteination protocol for sample preparation (see the text). The recovery was measured in two series of experiments (black and gray bars, respectively) for matrix spiked at four levels with isomaltulose (60–150 mg). System 2 (Agilent 1200, Lichrospher100 DIOL 125 mm × 4 mm, 5 μm), column compartment temperature was 11 °C, the mobile phase was 20 mM ammonium formate buffer pH 3.8 and acetonitrile, flowrate was 1.0 mL/min, the chamber temperature of ELSD was 40 °C, the pressure of air in nebulizer was 2.9 bar, the gain factor was 10; elution program: 0–10 min buffer 16%, 10–11 min buffer 16–50%, 11–16 min buffer 50%, 16–17 min buffer 50–16%.
Separations 11 00045 g005
Figure 6. Examples of application of the validated method to real samples (System 2: Agilent 1200, Lichrospher100 DIOL 125 mm × 4 mm, 5 μm, the column compartment temperature was 11 °C, the mobile phase was 20 mM ammonium formate buffer pH 3.8 and acetonitrile, flowrate was 1.0 mL/min, the chamber temperature of ELSD was 40 °C, the pressure of air in nebulizer was 2.9 bar, the gain factor was 10; elution program: 0–10 min buffer 16%, 10–11 min buffer 16–50%, 11–16 min buffer 50%, 16–17 min buffer 50–16%). Each sample was run 4 times and all the chromatograms overlapped to demonstrate short-time repeatability. The asterisk denotes a peak of isomaltulose.
Separations 11 00045 g006
Table 1. List of analyzed samples.
NameFormProducer
Nutrend Turbo Effect ShotliquidNutrend DS,
77900 Olomouc, CZ
Enervit Pre Sport,
jelly orange
gelEnervit, 20149 Milano, Italy
Enervit Pre Sport,
jelly cranberry
gelEnervit, 20149 Milano, Italy
Amix Nutrition
Slow Gel
gelAmix Nutrition Czech,
29501 Mnichovo Hradiště, CZ
Edgar Powergel, orangegelEdgar power,
70300 Ostrava, CZ
Extrifit RegelgelDAFIT, 14800 Prague, CZ
High5 Energy Drink Slow ReleasepowderHigh5 Ltd.,
LE671UD Bardon, UK
Penco Ultra Endurance DrinkpowderPenco, 19600 Prague, CZ
NutriWorks Osmo Worx, neutralpowderNutrimarkt Oy,
00390 Helsinki, FIN
Edgar Powerdrink,
apricot
powderEdgar power,
70300 Ostrava, CZ
Edgar Vegan
Powerdrink, kiwi
powderEdgar power,
70300 Ostrava, CZ
Extrifit BeefMasspowderDAFIT, 14800 Prague, CZ
Nutrend After
Training Protein
powderNutrend DS,
77900 Olomouc, CZ
Nutrend Compress B.I.G.powderNutrend DS,
77900 Olomouc, CZ
Table 2. Validation parameters of method optimized for isomaltulose determination.
Validation Parameter
Retention time11.4 min
Long-term repeatability
(retention time)
0.3%
Long-term repeatability
(peak area)
1.9%
Retention factor k′10.6
Number of theoretical plates2300–2600
Resolution
(isomaltulose–sucrose)
>1.5
Asymmetry factor AS0.98–1.10
Calibration curve linearity
(after linearization) *
R2 > 0.99
Calibration range0.4–2.0 mg/mL
LOD0.06 mg/mL
Recovery97–104%
* The method of linearization can be found elsewhere [35,39]. The calibration curve can be found in the Supplementary Materials (Figure S1).The validation parameters fit the limits recommended by FDA [26]: repeatability of retention time < 1.0%, retention factor > 2.0, efficiency > 2000, asymmetry factor 0.95–1.20. The resolution of isomaltulose in a particular sample depended on the amount of sucrose and maltodextrins but was always >1.5. It can be noted that the efficiency (number of theoretical plates) is relatively low compared to partition chromatography, which is, however, typical for HILIC. The limit of detection (LOD) is also not favorable for, e.g., trace analysis, but it can always be compensated by adjusting the sample weight; with this method, the expected concentration of isomaltulose is around 1 mg/mL.
Table 3. Results of isomaltulose determination in samples of food supplements.
Sample (Flavor)Declared %Determined %
Nutrend Turbo Effect Shot5.04.7
Enervit Pre Sport,
jelly orange
16.218.4
Enervit Pre Sport,
jelly cranberry
16.118.2
Amix Nutrition
Slow Gel
29.033.2
Edgar Powergel, orange10.012.5
Extrifit Regel4.56.0
High5 Energy Drink Slow Release,
black currant
14.017.3
Penco Ultra Endurance Drink20.023.0
NutriWorks Osmo Worx, neutralN/A *1.7
Edgar Powerdrink,
apricot
N/A *46.0
Edgar Vegan Powerdrink, kiwiN/A *45.0
Nutrend After Training Protein5.05.6
Nutrend Compress B.I.G. (protein)11.510.8
Extrifit BeefMass (protein)N/A *4.6
* N/A the content was not declared (see discussion).
Disclaimer/Publisher’s Note: The statements, opinions and data contained in all publications are solely those of the individual author(s) and contributor(s) and not of MDPI and/or the editor(s). MDPI and/or the editor(s) disclaim responsibility for any injury to people or property resulting from any ideas, methods, instructions or products referred to in the content.