Abstract
In this paper, we report the effect of adding Zr + V or Zr + V + Mn to TiFe alloy on microstructure and hydrogen storage properties. The addition of only V was not enough to produce a minimum amount of secondary phase and, therefore, the first hydrogenation at room temperature under a hydrogen pressure of 20 bars was impossible. When 2 wt.% Zr + 2 wt.% V or 2 wt.% Zr + 2 wt.% V + 2 wt.% Mn is added to TiFe, the alloy shows a finely distributed Ti2Fe-like secondary phase. These alloys presented a fast first hydrogenation and a high capacity. The rate-limiting step was found to be 3D growth, diffusion controlled with decreasing interface velocity. This is consistent with the hypothesis that the fast reaction is likely to be the presence of Ti2Fe-like secondary phases that act as a gateway for hydrogen.
1. Introduction
Hydrogen storage in metal hydrides is a promising way to store hydrogen [1]. In particular, TiFe alloy is a good candidate for stationary applications due to its reasonable gravimetric hydrogen capacity (~1.9 wt.%), low cost, and acceptable working temperature and pressure [2,3]. Hydrogenation of TiFe hydride is the succession of first formation of α-solid solution TiFeH0.1 followed by the TiFeH1 monohydride (β) and dihydride TiFeH2 (γ). The effect of gaseous impurities such as O2, H2O, CO2 and CO on the hydrogenation kinetics of TiFe alloy was studied by Sandrock et al., which resulted in a decrease in the reaction rate and reduced hydrogen capacity [4]. These kinds of gaseous impurities hinder the dissociation of hydrogen molecules during the chemisorption step. Additionally, the formation of a surface oxide layer during the synthesis of TiFe or handling in the air makes the first hydrogenation difficult. Therefore, before the first hydrogenation, the alloy usually needs to be prepared by submitting it to high temperature and hydrogen pressure. This step is required to break the surface oxide [3]. To replace this step, mechanical treatments such as severe plastic deformation techniques [5,6] and ball milling [7,8,9,10,11,12] have been investigated. Mechanical treatment creates new surfaces and cracks for hydrogen diffusion, which facilitate the first hydrogenation. A partial substitution or addition of transition metals such as Zr [13,14,15], V [16], Mn [17,18], Cu [19], and Co [20] to the TiFe alloy is also an alternative method for enhancing the first hydrogenation kinetics and flattening the plateau region in the pressure composition isotherm (P-C-T). Recently, it has been shown that simultaneous addition of Zr and Mn could enhance the first hydrogenation kinetics [21]. This improvement was explained by the existence of a Ti2Fe-type secondary phase, which acts as a gateway for hydrogen to reach the main TiFe phase [22]. The actual composition of the Ti2Fe-type phase is found to be (Ti,Zr,Mn)2Fe by the chemical composition analysis, where Zr and Mn substitute for Ti [21]. However, in the phase equilibrium diagram of Ti-Fe, only TiFe and TiFe2 are seen [23]. A Ti2Fe metastable phase was identified by Dong et al. [24]. It was also seen in the Ti-Fe-B system [25] and Ti-Fe-Zr ternary alloys [26].
Earlier studies in the literature mentioned that partial substitution of iron by vanadium is beneficial for enhancing the first hydrogenation [16]. It is also known from previous reports that the addition of Zr is effective but a certain level (4 wt.%) of zirconium is essential [15,21]. In this paper, the addition of Zr along with V and Mn is reported. The goal of this investigation was to lower the concentration level of Zr. TiFe alloys with only V (at a concentration level of 2, 4 wt.%) were also studied in order to know the effect of individual elements on the first hydrogenation of TiFe alloy. It is known from previous investigations that the most effective combination in terms of kinetics and maximum hydrogen capacity is a TiFe alloy with simultaneous addition of 2 wt.% Mn and 4 wt.% Zr [21]. In this paper, we also report on the simultaneous addition of 2 wt.% Zr + 2 wt.% Mn + 2 wt.% V to TiFe alloy. This combination was chosen to investigate a possible synergetic effect when many elements are added at a low concentration level.
2. Materials and Methods
TiFe alloys with V (2 and 4 wt.%), a combination of 2 wt.% Zr + 2 wt.% V, and a combination of 2 wt.% Zr + 2 wt.% Mn + 2 wt.% V were synthesized by GKN Sinter Metals Engineering GmbH, Dahlienstraße 43, D-42477 Radevormwald, Germany using induction melting of melt size ~6.5 kg. Industrial-grade Fe (ASTM 1005) and Ti (ASTM B265 grade 1) with Ferrovanadium (80.09 wt.% V, 18.75 wt.% Fe, 0.85 wt.% Al, 0.04 wt.% P, 0.23 wt.% C, and 0.04 wt.% S) and electrolytic manganese (99.7 wt.%) were used as raw materials. The bulk composition of these alloys was measured by an X-ray fluorescence spectrometer (Bruker XRF S1titan) and a comparison of nominal values with the XRF measurements is shown in Table 1. Please note that in this table, the element’s abundances are in at.%. It could be seen that bulk composition is close to the nominal one. However, for the alloy with 2 wt.% Zr + 2 wt.% V and the alloy with 2 wt.% Zr + 2 wt.% Mn + 2 wt.% V, the alloys are titanium-rich and vanadium-depleted compared to the nominal values.
Table 1.
Measured bulk composition analysis by XRF (X-ray fluorescence) spectrometer of all alloys with nominal values. Uncertainty on all values is ±1 at.%.
The prepared ingots were crushed in air to obtain small chunks for characterization. These small chunks were thereafter hand crushed in an argon atmosphere using a hardened steel mortar and pestle. For hydrogen absorption measurements, 1 g of powder was filled in a sample holder under an argon atmosphere. First hydrogenation kinetics were obtained using a homemade Sievert-type apparatus. The hydrogenation tests were performed at room temperature under 20 bars of hydrogen pressure. The first hydrogenation was performed without any prior heat treatment of extended degassing. Back-scattered micrographs and the chemical composition of different phases were acquired using a Hitachi SU-3500 scanning electron microscope (SEM) equipped with an EDX (Energy Dispersive X-ray) spectrometer from Oxford Instruments. Three consecutive measurements were taken for the determination of uncertainty values. X-ray diffraction patterns were obtained using a Bruker D8 Focus diffractometer with Cu kα radiation. Rietveld refinement of each X-ray pattern was performed using Topas software [27].
3. Results and Discussions
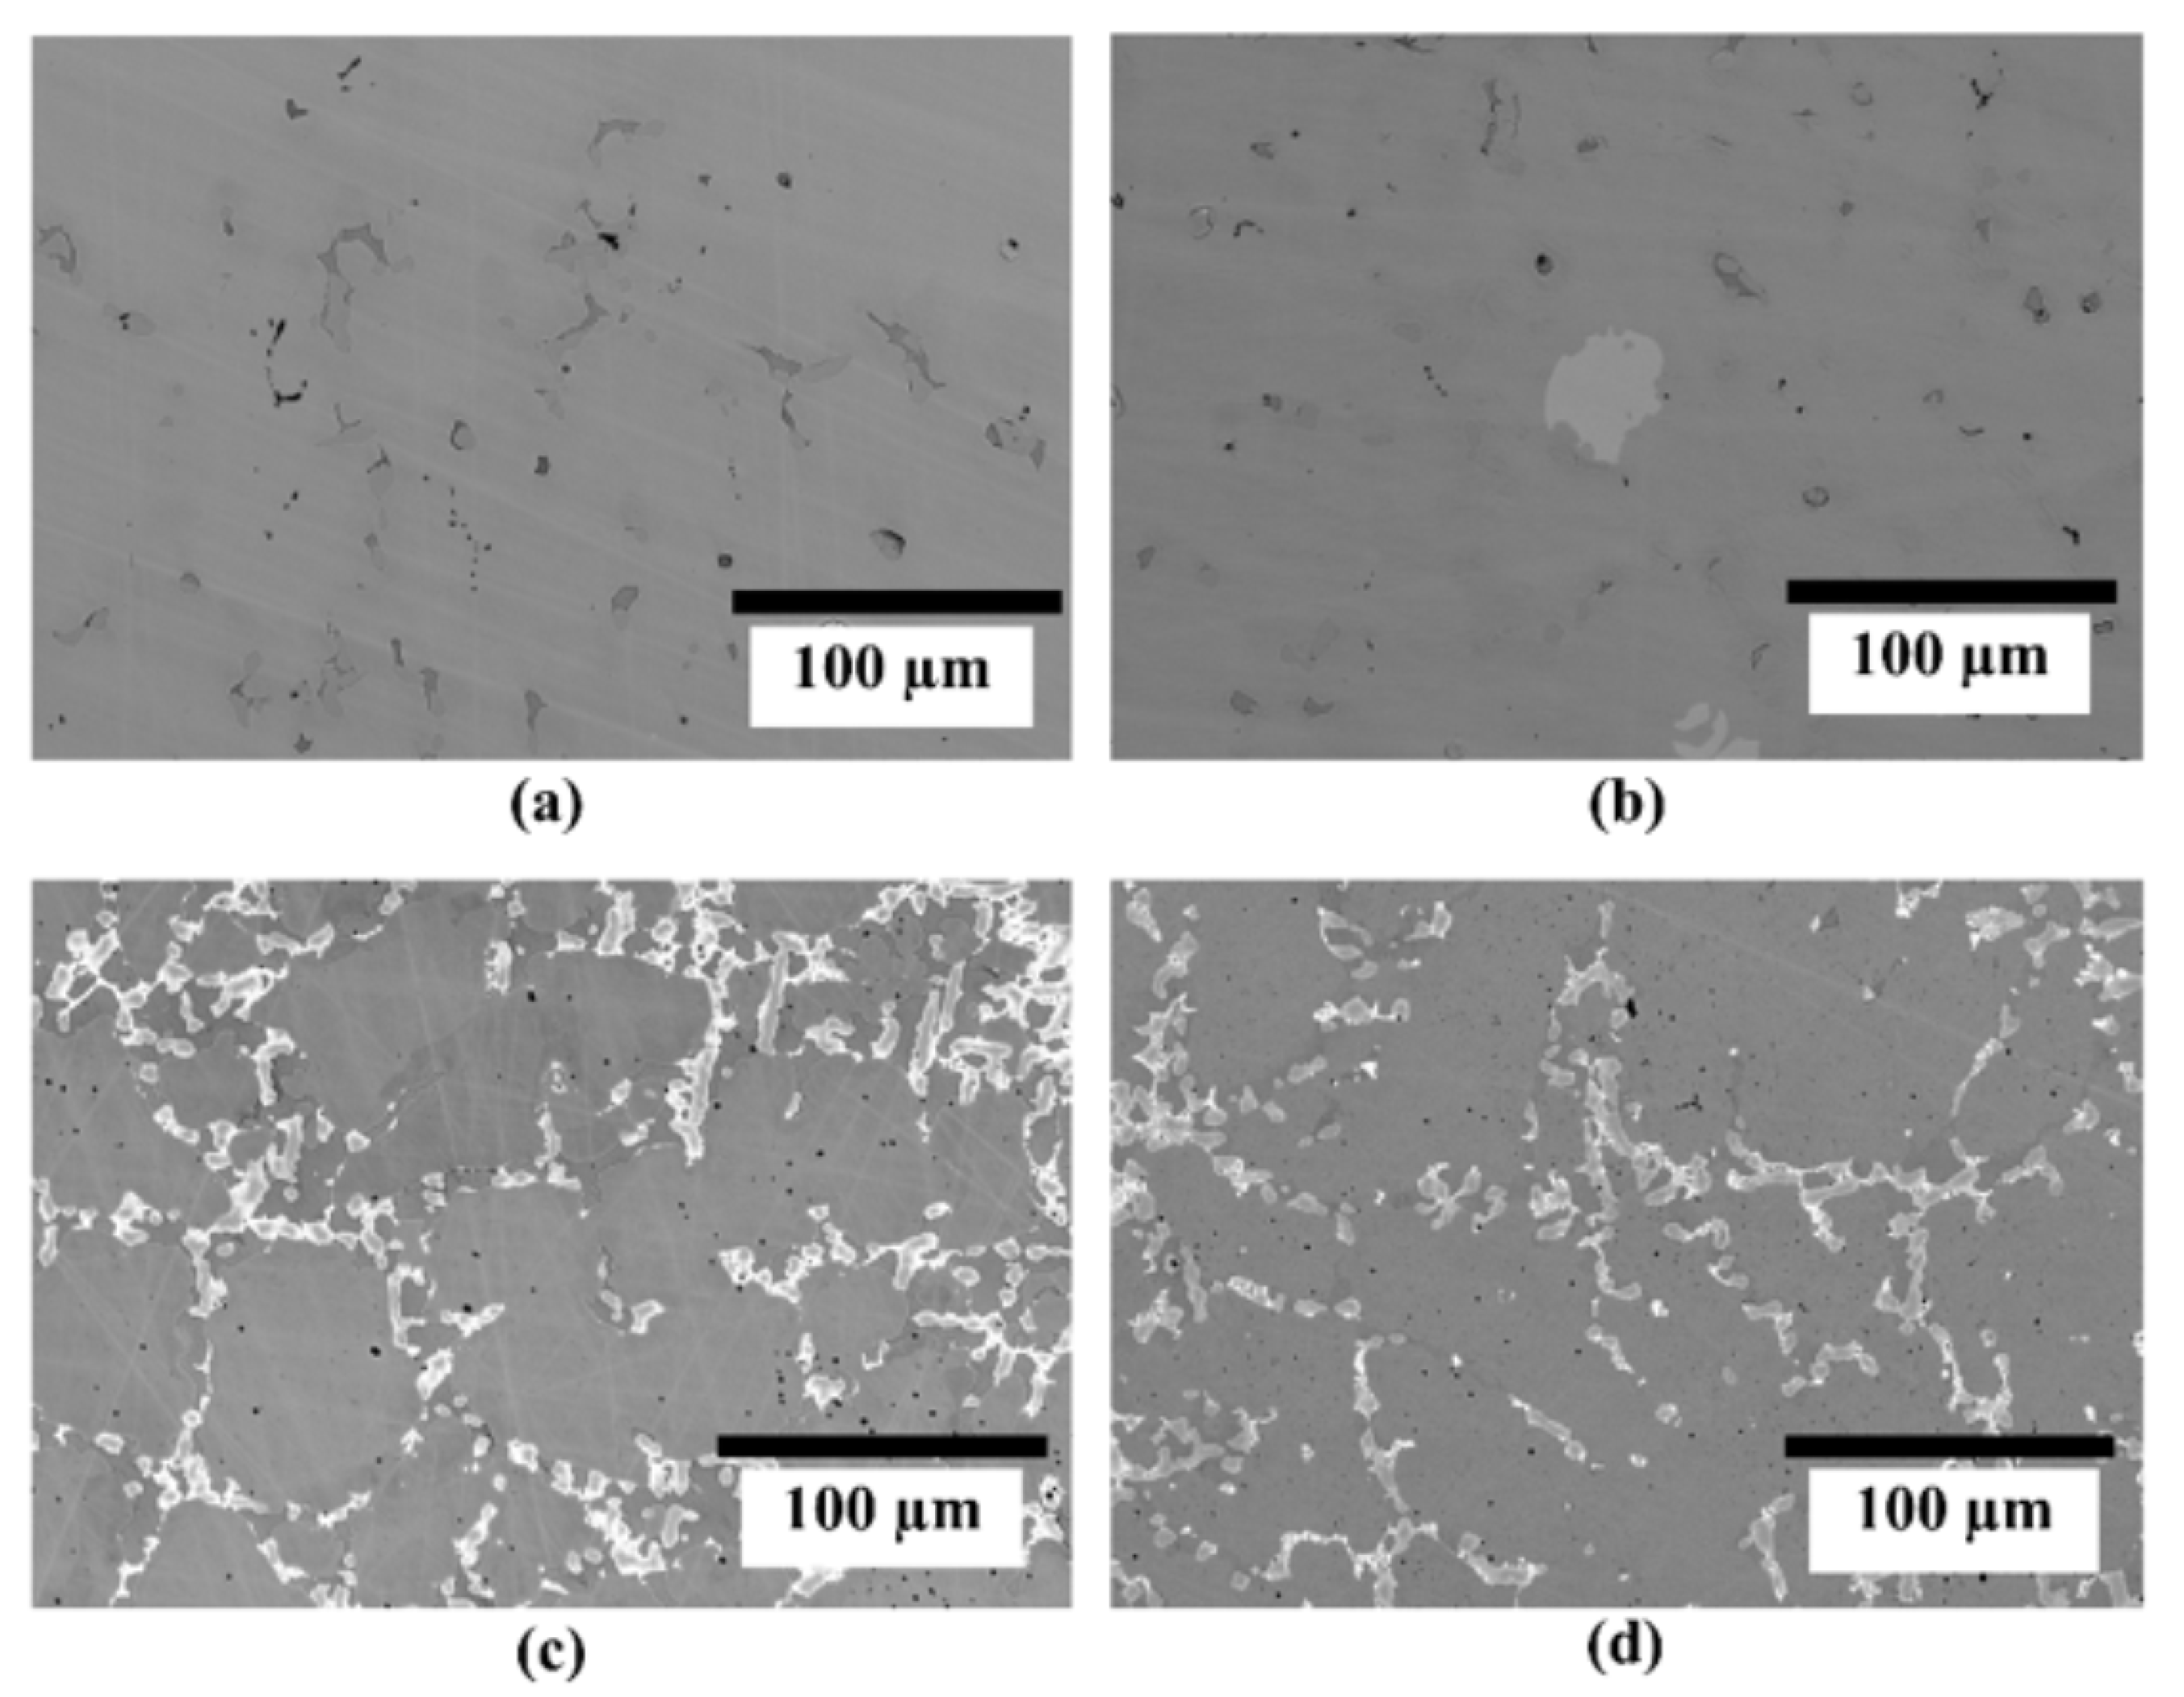
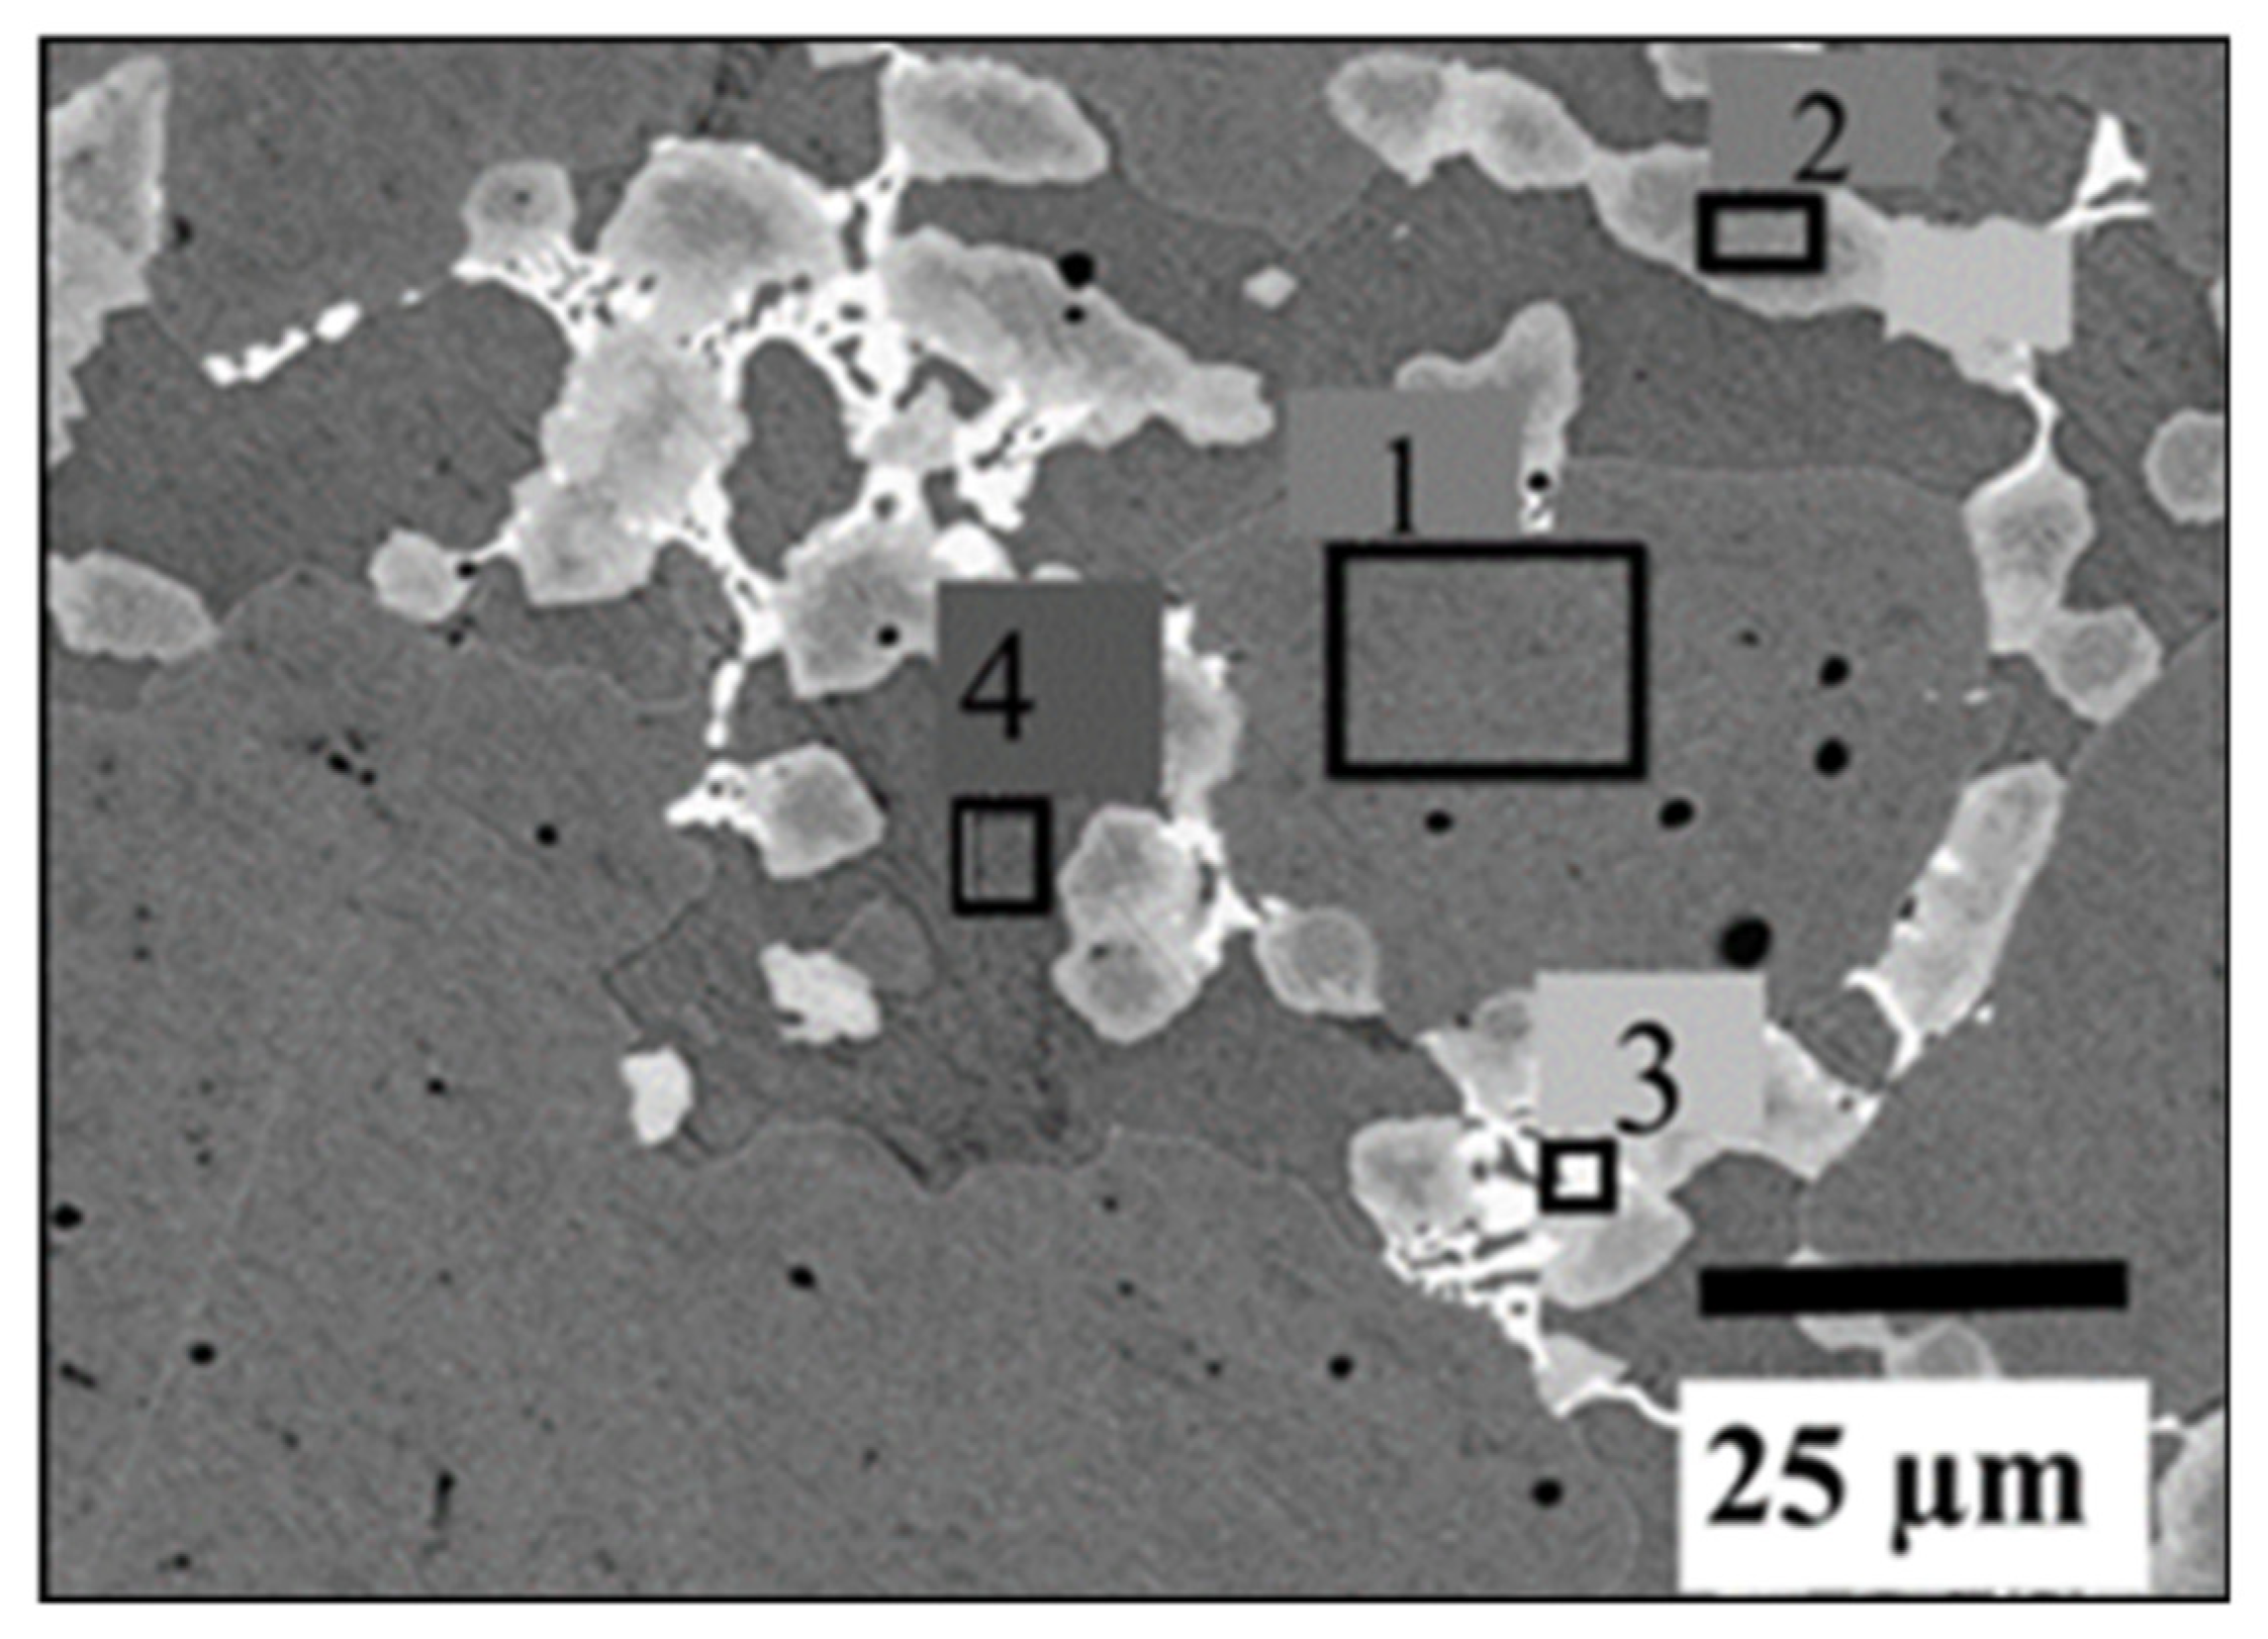
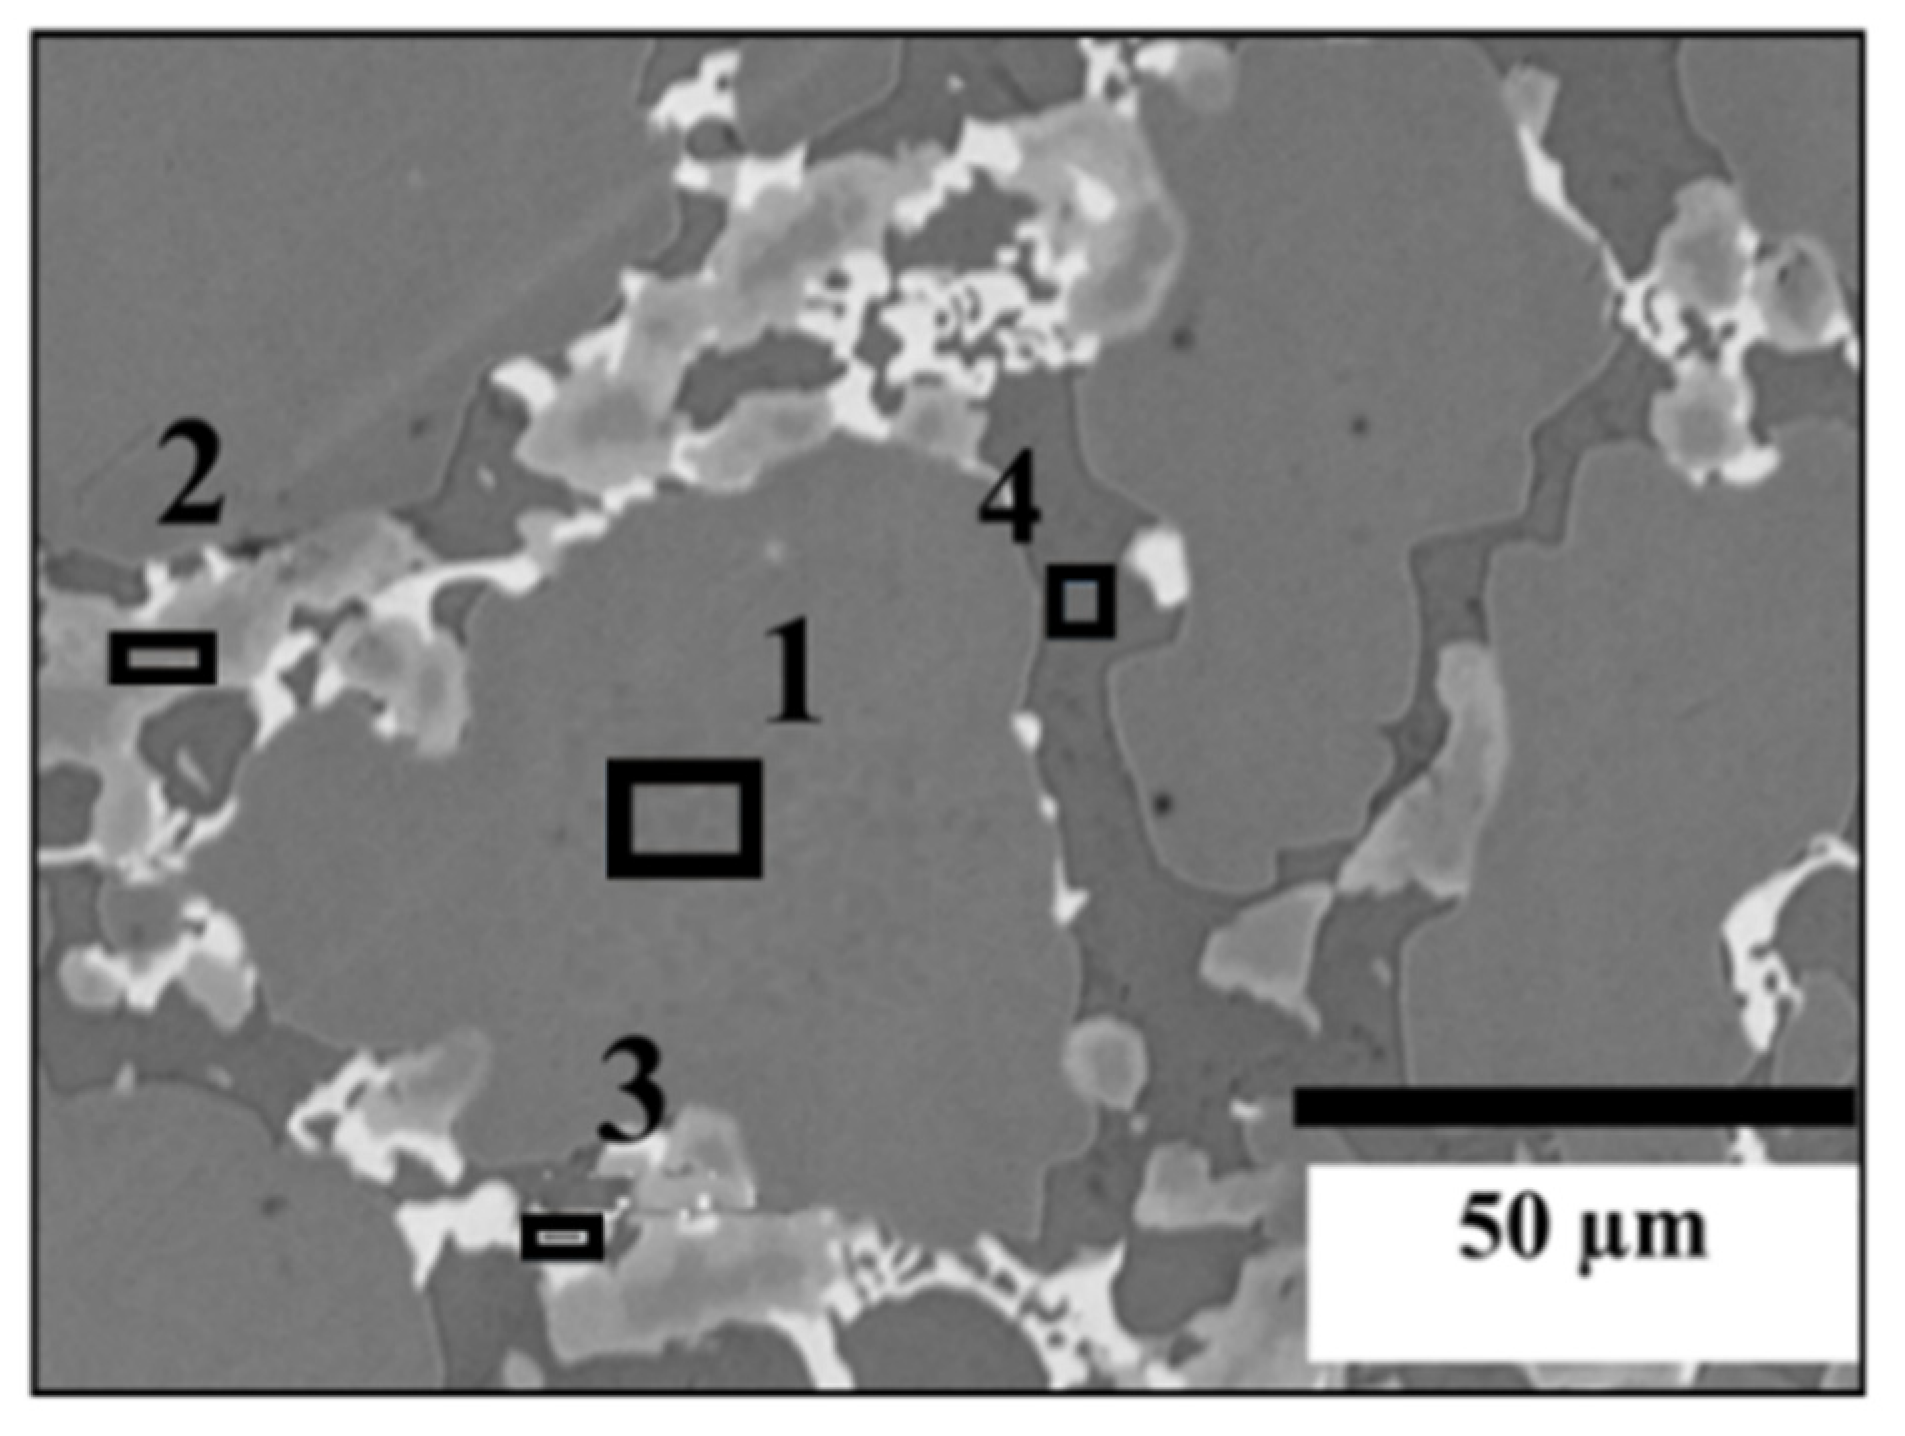
3.1. Morphology
Back-scattered electron micrographs of TiFe alloy with different additive combinations are shown in Figure 1. The micrograph of these alloys shows a grey phase (TiFe) and secondary phases (light grey, bright, dark grey). Samples with only vanadium as an additive produced a small amount of secondary phase. The addition of 2 wt.% Zr + 2 wt.% V produced a very fine distribution of the secondary phase. When 2 wt.% Zr + 2 wt.% V + 2 wt.% Mn was added to TiFe alloy, there was no significant change in the amount of secondary phase compared to the alloy with 2 wt.% Zr + 2 wt.% V.
Figure 1.
Back-scattered electron micrograph of TiFe alloy with (a) 2 wt.% V; (b) 4 wt.% V; (c) 2 wt.% Zr + 2 wt.% V; (d) 2 wt.% Zr + 2 wt.% V + 2 wt.% Mn as additives.
EDX analyses of TiFe alloys with V as an additive are shown in Figure 2. It should be pointed out that these images are not representative of the abundance of the individual phases. These areas were selected for the analysis of the chemical compositions of the phases and not for an estimation of phase abundance. The chemical composition of each phase is shown in Table 2. In both alloys, three phases are present: (1) grey phase, (2) dark grey phase, and (3) light grey phase. The grey phase is TiFe with some vanadium. In both alloys, the light grey phase has an almost Ti2Fe stoichiometry. In fact, it seems that vanadium substitutes for titanium, and the actual composition is (Ti,V)2Fe. The dark grey phase is Ti-rich. In the case of 4 wt.% V, there is one bright phase, which has a composition close to TiFe2.
Figure 2.
EDX analysis of TiFe with the addition of V only (a) 2 wt.% V; (b) 4 wt.% V.
Table 2.
Chemical composition of each phase present in alloys with V only (uncertainty on all values is ±1).
The micrograph of the alloy with the addition of 2 wt.% Zr + 2 wt.% V is shown in Figure 3. Here, four different regions could be identified: (1) grey phase, (2) light grey phase, (3) bright phase and (4) dark grey phase. The chemical composition of each phase is listed in Table 3. The grey phase has the composition of TiFe with ~2 at.% of V, but Zr is absent in this phase. As for the preceding system, the light grey phase seems to have a Ti2Fe-type composition, but here, vanadium and zirconium seem to substitute for titanium, giving a (Ti,V,Zr)2Fe composition. The bright phase is the phase with the highest proportion of zirconium. It should be noted that this phase is at the edge between the grey phase and light grey phase. Moreover, the composition is close to the light grey phase except for the higher proportion of Zr. The dark grey phase is Ti-rich. The average grain size of each phase was calculated by Image J software using the 100 µm scale back-scattered micrograph [28]. For 2 wt% V, the estimated average grain size of the TiFe phase is 71 ± 1 µm. For the secondary Ti2Fe-type and Ti-rich phases, the average grain sizes are, respectively, 11 ± 1 µm and 12 ± 1 µm. In the case of the 4 wt% V, the average grain sizes of TiFe, Ti2Fe-type, Ti and TiFe2 phases are, respectively, 72 ± 2 µm, 7 ± 1 µm, 8 ± 1 µm and 36 ± 1 µm.
Figure 3.
EDX analysis of TiFe with the simultaneous addition of 2 wt.% Zr + 2 wt.% V.
Table 3.
Chemical composition of each phase present in TiFe with the simultaneous addition of 2 wt.% Zr + 2 wt.% V (uncertainty on all values is ±1).
Figure 4 shows a micrograph of the TiFe alloy with the addition of 2 wt.% Zr + 2 wt.% V + 2 wt.% Mn. The chemical composition of each phase is given in Table 4. The grey phase is TiFe with about 2 at.% of Mn and V. It seems that both Mn and V substitute for iron. Zr is seen only in trace amountin this phase. As seen in the preceding system, the bright phase is at the edge of the light grey phase. The light grey phase could be written as (Ti,V,Zr,Mn)2Fe with a proportion of Zr higher than for the light grey phase when V and Zr are added to TiFe. The bright phase is, again, the phase that has the highest proportion of zirconium, and the chemical composition is close to the bright phase as seen for TiFe + 2 wt.% Zr + 2 wt.% V. Dark grey is Ti-rich, as was seen for the other additions. The average grain sizes of TiFe, Ti2Fe-type (light), Ti2Fe-type (bright) and Ti phases for alloy with 2 wt.% Zr + 2 wt.%V are, respectively, 88 ± 1 µm, 23 ± 1 µm, 11 ± 1 µm and 22 ± 1 µm. In the case of 2 wt.% Zr + 2 wt.% V + 2 wt.% Mn, the average grain sizes were: 77 ± 1 µm for TiFe, 14 ± 1 µm for Ti2Fe-type (light), 8 ± 1 µm for Ti2Fe-type (bright), and 18 ± 1 µm for Ti.
Figure 4.
EDX analysis of TiFe alloy with the simultaneous addition of 2 wt.% Zr + 2 wt.% V + 2 wt.% Mn.
Table 4.
Chemical composition of TiFe + 2 wt.% Zr + 2 wt.% V + 2 wt.% Mn (uncertainty on all values is ±1).
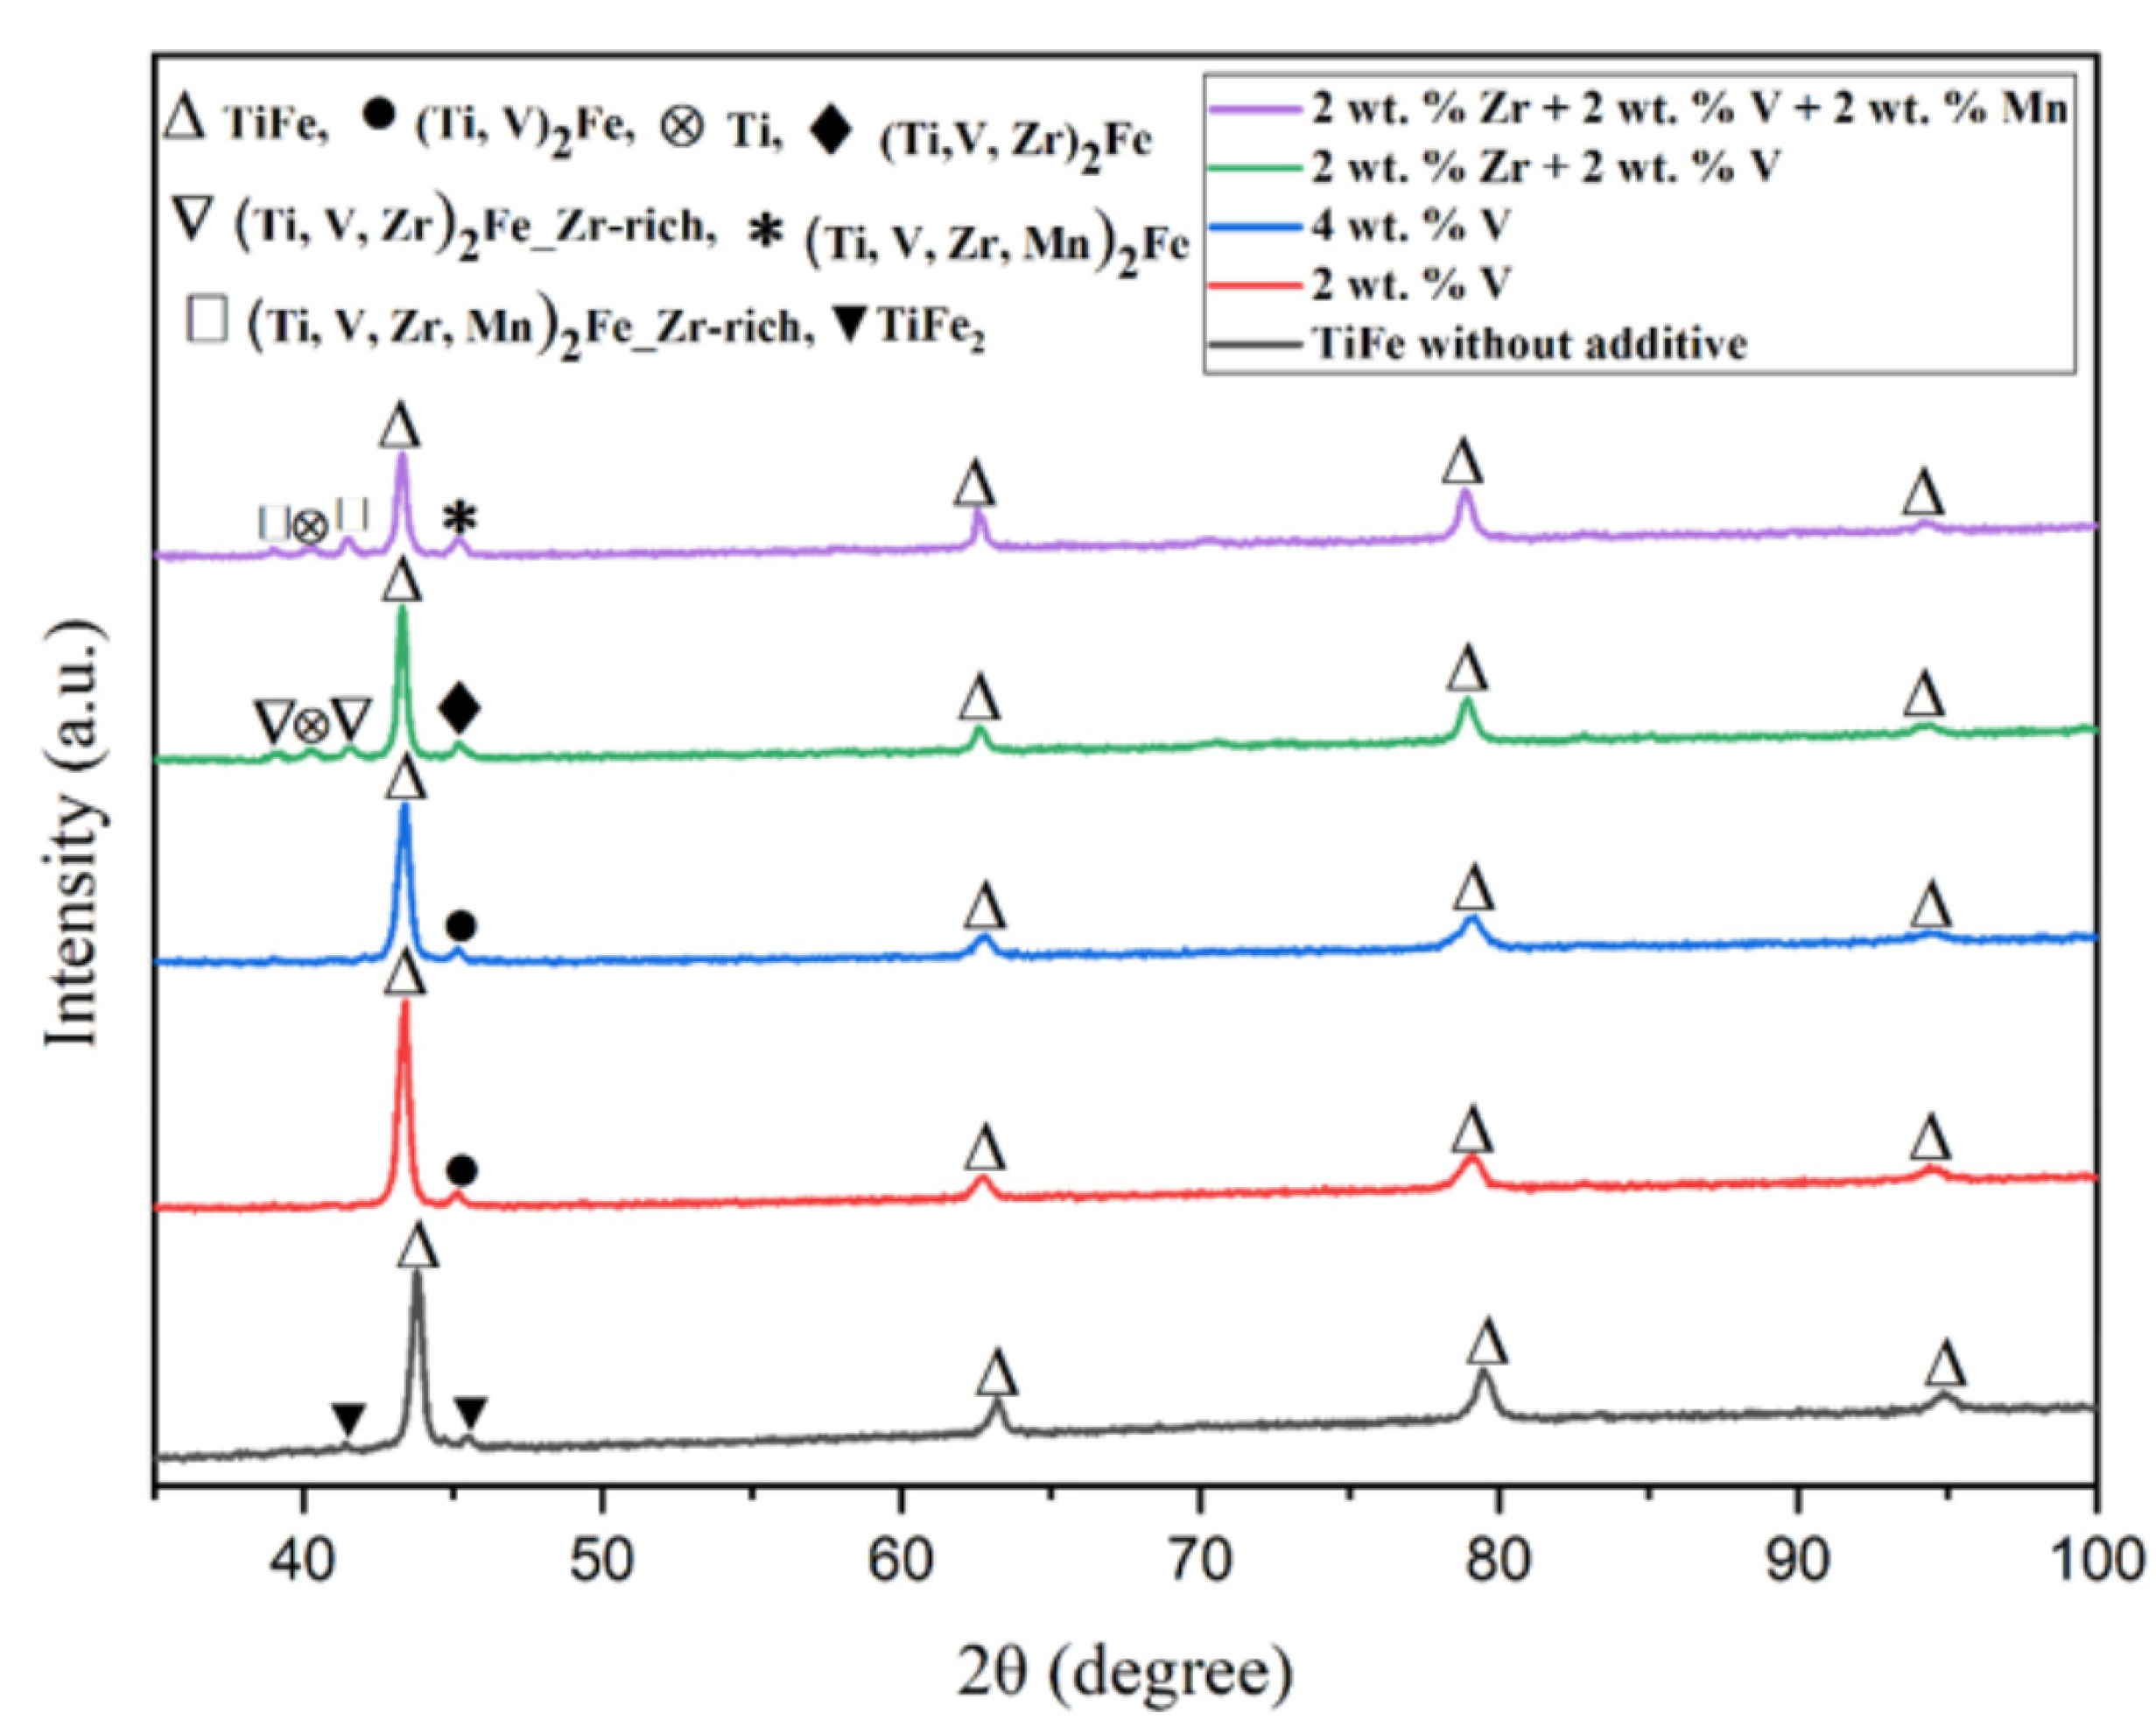
3.2. Crystal Structure
The X-ray diffraction (XRD) pattern of each alloy is shown in Figure 5. The X-ray pattern of TiFe without additive is shown as a reference where the presence of TiFe phase with TiFe2 phase could be seen [21]. For all patterns, the main phase is TiFe (space group Pm-3m), which corresponds to the matrix seen in the SEM micrographs. All patterns of alloys with additives also show a small peak at around 2θ = 45°. This peak could be assigned to the Ti2Fe-like phase (space group Fd-3m) that was identified from the EDX investigation. The Ti2Fe phase used in the Rietveld refinement was given the chemical composition of the light grey phase indicated in Table 2, with vanadium occupying the same site as titanium. The other phases seen in Figure 2 have too small of an abundance to be seen on the diffraction pattern.
Figure 5.
X-ray pattern of TiFe alloys with the addition of only V, Zr + V, and Zr + V + Mn. The without additive curve is reproduced with permission from Patel et al., Microstructure and first hydrogenation properties of TiFe alloy with Zr and Mn as additive; published by Elsevier, 2020.
Regarding the pattern of TiFe with 2 wt.% Zr + 2 wt.% V addition, beside the TiFe and Ti2Fe peaks, we see the appearance of new Bragg peaks around 40°. Again, using the EDX results shown in Table 3, we could assign some peaks to a Ti phase, which corresponds to the dark grey phase. The remaining peaks could be indexed to a second Ti2Fe phase but with larger lattice parameters than the light grey Ti2Fe phase seen in all patterns. The reason why there are two Ti2Fe-like phases with different lattice parameters could be the following. The light grey phase seen on all micrographs has a similar chemical composition with Fe on one site and the other elements substituting the titanium on the other sites. The micrographs and EDX analysis show that the bright phase in the TiFe + 2 wt.% Zr + 2 wt.% V alloy is at the edge of the light grey phase and has a much larger proportion of zirconium. The EDX results show that zirconium seems to substitute for titanium. As zirconium has a bigger atomic radius than titanium (1.6 Å for Zr and 1.47 Å for Ti), it could be expected that the lattice parameters will also be bigger. Therefore, the explanation of the two Ti2Fe-like phases is that during cooling, the Ti2Fe-like phase is split into two compositions: one with low zirconium content and the other, at the edge, with high zirconium content. They will be respectively identified as (Ti, V, Zr)2Fe and (Ti, V, Zr)2Fe-Zr-rich. The same phenomenon is seen for the TiFe + 2 wt.% Zr + 2 wt.% V + 2 wt.% Mn alloy. The crystallographic parameters extracted from Rietveld refinements are listed in Table 5. A reference list of crystallographic parameters of TiFe without additive is also shown in Table 5 for comparison.
Table 5.
Refined value of phase abundance, lattice parameters, crystallite size, cell volume and microstrains by Rietveld refinement of each alloy’s X-ray patterns. Error on the last significant digit is indicated in the parentheses.
From Figure 2, and Table 2 and Table 5, we see that the addition of 2 or 4 wt.% V has basically the same effect. The abundance of TiFe and secondary phase is practically constant as well as their chemical composition. The stoichiometry of the secondary phase measured by EDX agrees with the Ti2Fe-like crystal structure seen in the diffraction patterns. Figure 2b showed a TiFe2-like phase but the amount of that phase was too small to be seen in the diffraction pattern. Crystallite sizes and microstrains are similar for the two compositions.
When Zr and V are added simultaneously, the proportion of secondary phases drastically increases compared to when only V is added. It indicates that Zr favors the formation of the secondary phase. Table 3 shows that, in fact, Zr is almost absent from the TiFe phase, unlike V, which seems to substitute for Fe. Beside the main TiFe phase, the diffraction pattern showed peaks belonging to Ti, and two Ti2Fe-like crystal structures that differ by their lattice parameters. This agrees quite well with what was reported in Table 3. As discussed before, the light grey phase and the bright phase could be associated, respectively, with the (Ti,V,Zr)2Fe and (Ti,V,Zr)2Fe-Zr-rich phases. Simultaneous addition of V, Zr and Mn resulted in basically the same phase composition as when Zr and V are added together. The phases identified in Figure 3 are also present in the diffraction pattern.
From these results, it could be concluded that the addition of 2 wt.% Zr + 2 wt.% V and 2 wt.% Zr + 2 wt.% V + 2 wt.% Mn leads to the formation of a large proportion of the secondary phase at ~32% (by adding the phase abundance of Ti2Fe, Ti2Fe-Zr-rich, and Ti) compared to the alloys with only V, where it was only 10%. The lattice parameter of the major phase TiFe increases slightly with the number of additives. The Zr-rich Ti2Fe-like phase has a larger lattice parameter than the other Ti2Fe-like phase. The crystallite size and microstrain for all phases do not seem to depend on the nature and amount of additive.
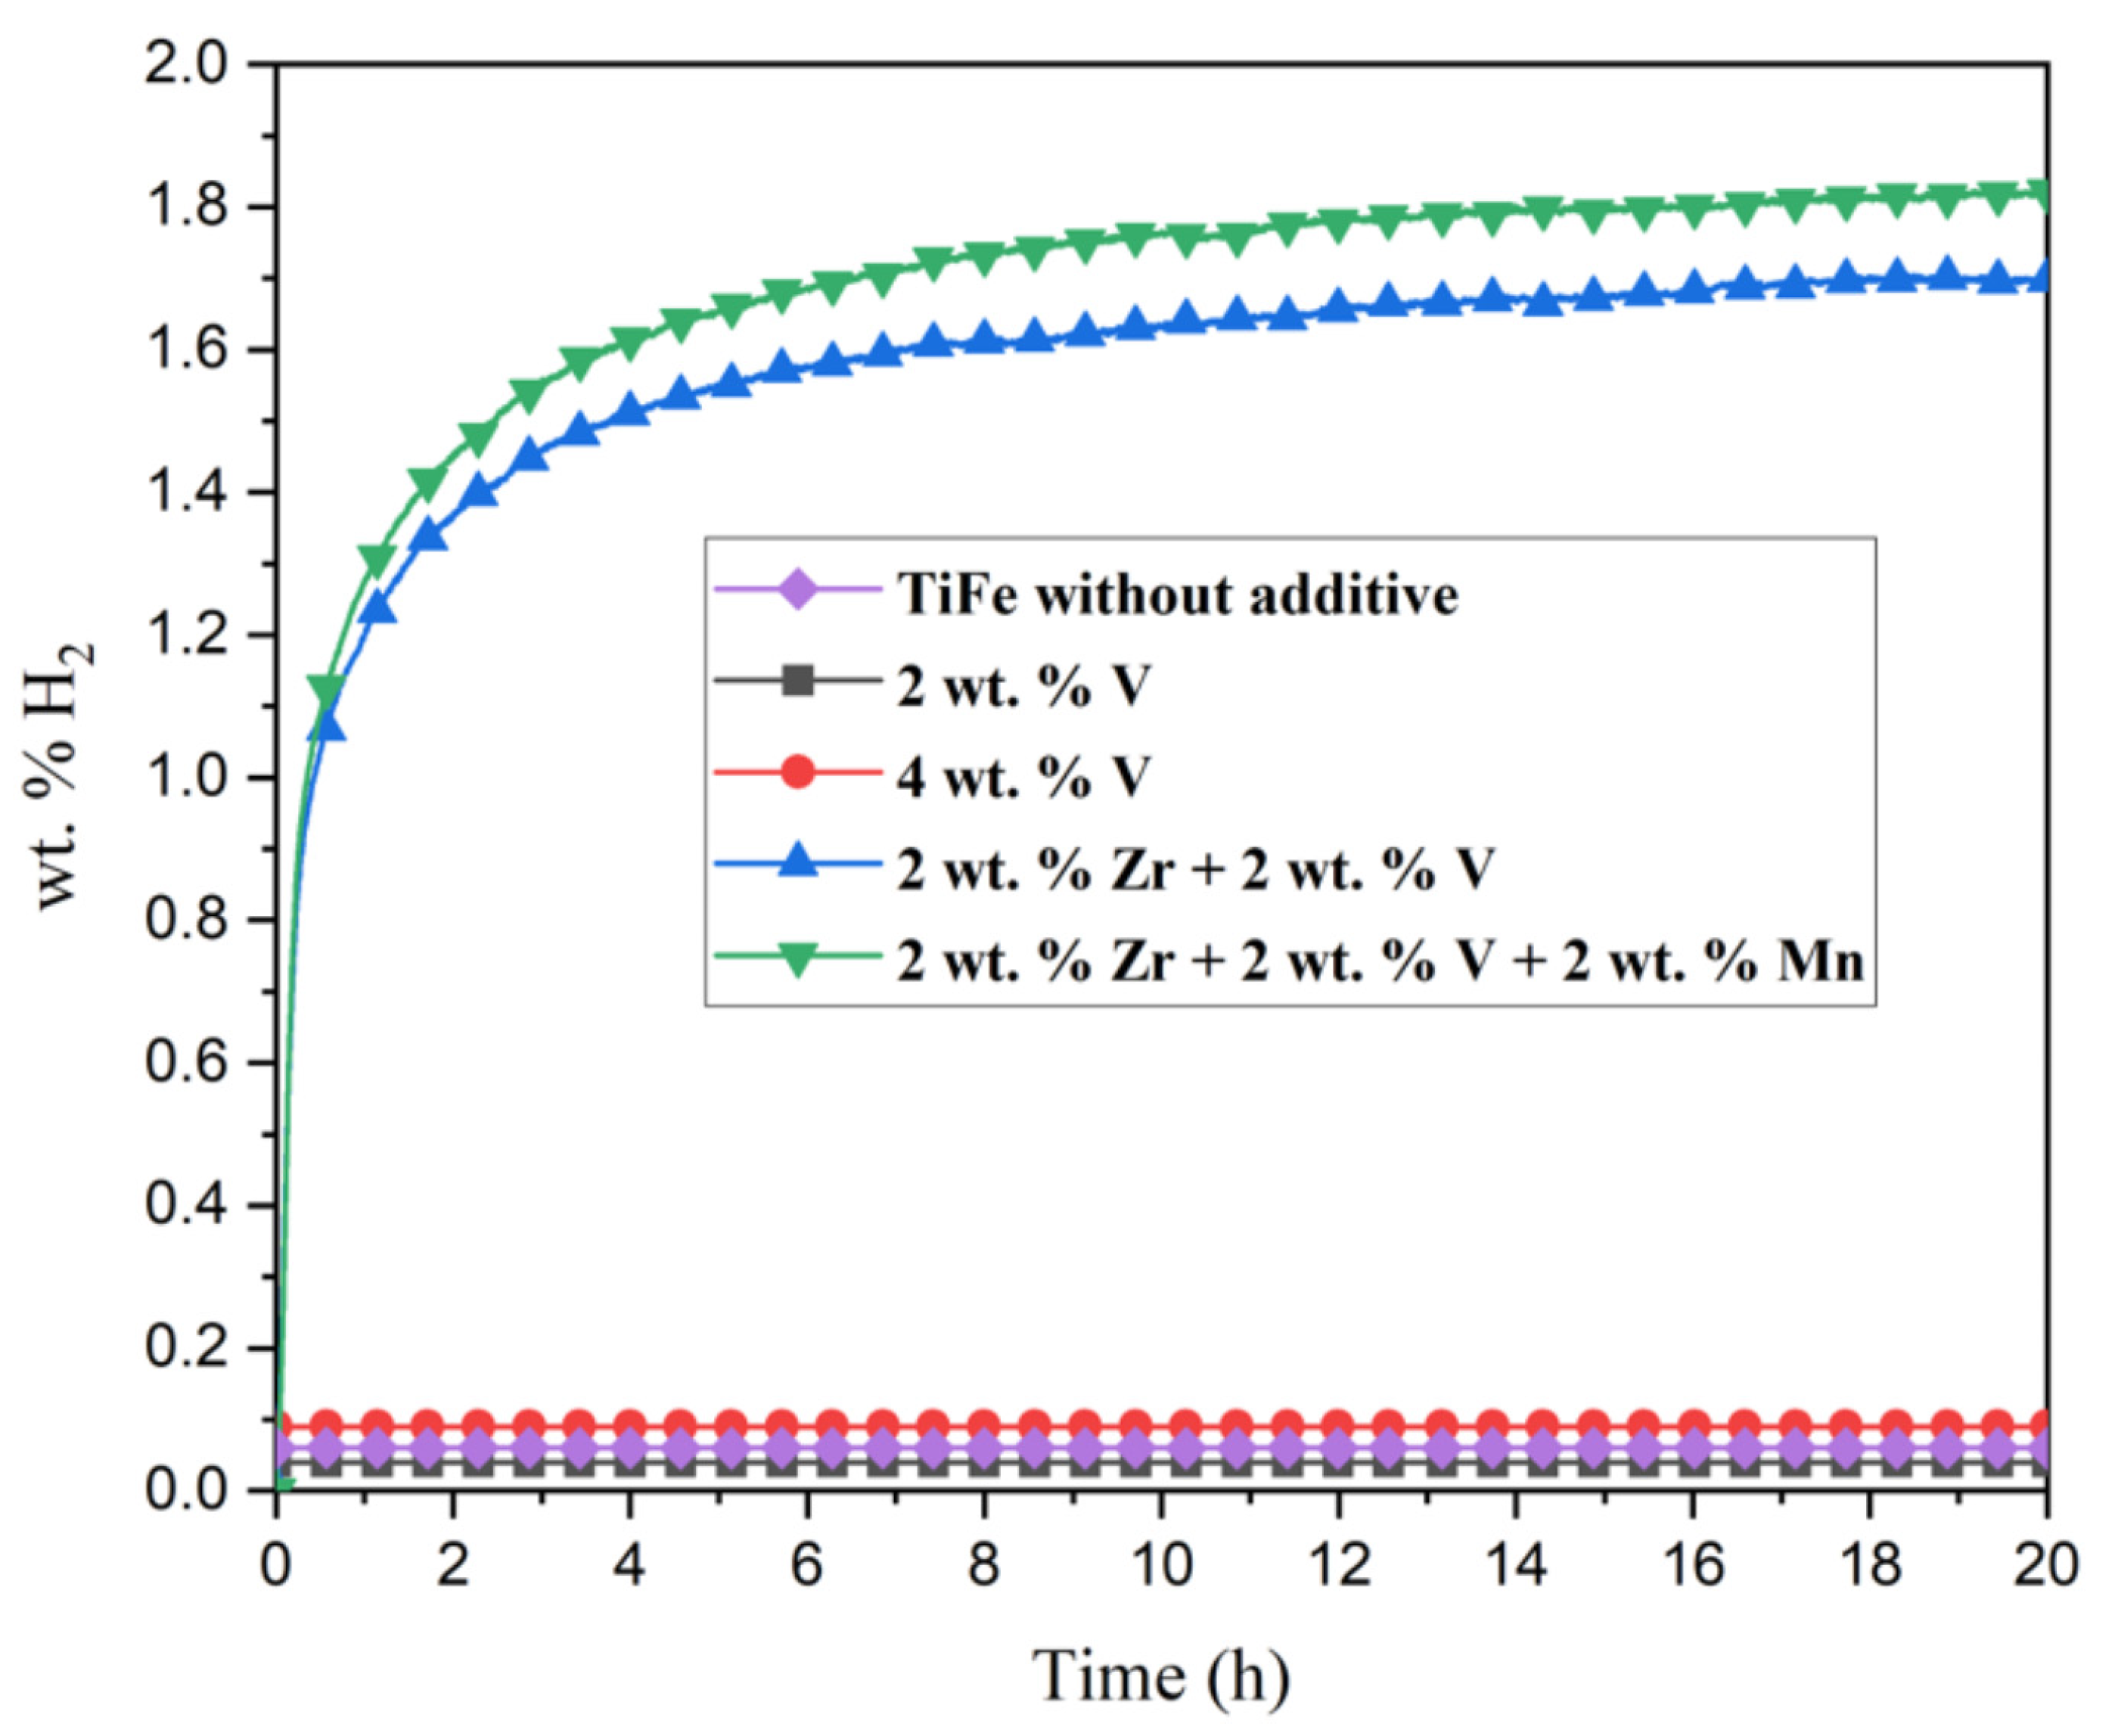
3.3. Activation Kinetics
First hydrogenation (activation) curves of all TiFe alloys with additives are shown in Figure 6. The TiFe without additive and alloys with V addition did not absorb hydrogen, even after 20 h of hydrogen exposition. The reason could be the small proportion of Ti2Fe-like phase ~10%, as quantified by X-ray diffraction pattern analysis.
Figure 6.
Activation kinetics of TiFe alloy with V, Zr + V and Zr + V + Mn under 20 bar H2 pressure at room temperature. The without additive curve is reproduced with permission from Patel et al., Microstructure and first hydrogenation properties of TiFe alloy with Zr and Mn as additive; published by Elsevier, 2020.
The combination of 2 wt.% Zr + 2 wt.% V leads to good kinetics and reaches its maximum hydrogen capacity (1.7 wt.%) in 6 h. Previously, it has been shown that alloy with 2 wt.% Zr does not activate, while TiFe with 4 wt.% Zr attained a capacity of 1.2 wt.% hydrogen after 20 h [21]. Therefore, it seems that having both Zr and V as additives is a better strategy to improve activation than just increasing the amount of Zr. TiFe alloy with the simultaneous addition of 2 wt.% Zr + 2 wt.% V + 2 wt.% Mn has a slightly higher hydrogen capacity (1.8 wt.%) than the alloy with 2 wt.% Zr + 2 wt.% V (1.7 wt.%). As both alloys have less than 70% TiFe phase, the measured capacity is not only due to absorption by the TiFe phase. Considering that all phases form a dihydride, the maximum theoretical hydrogen capacity of the TiFe, Ti, and Ti2Fe phases are, respectively, 1.9 wt.%, 4 wt.%, and 1.3 wt.%. Using the phase abundance given by Rietveld refinement, a total capacity of 1.9 wt.% is found for the alloy with 2 wt.% Zr + 2 wt.% V + 2 wt.% Mn addition. This agrees with the measured capacity. However, similar calculation for the alloy with 2 wt.% Zr + 2 wt.% V addition gives a capacity of 1.95 wt.%, which is much higher than the measured capacity. Therefore, the hydrogen absorption of individual phases is not well determined at this moment.
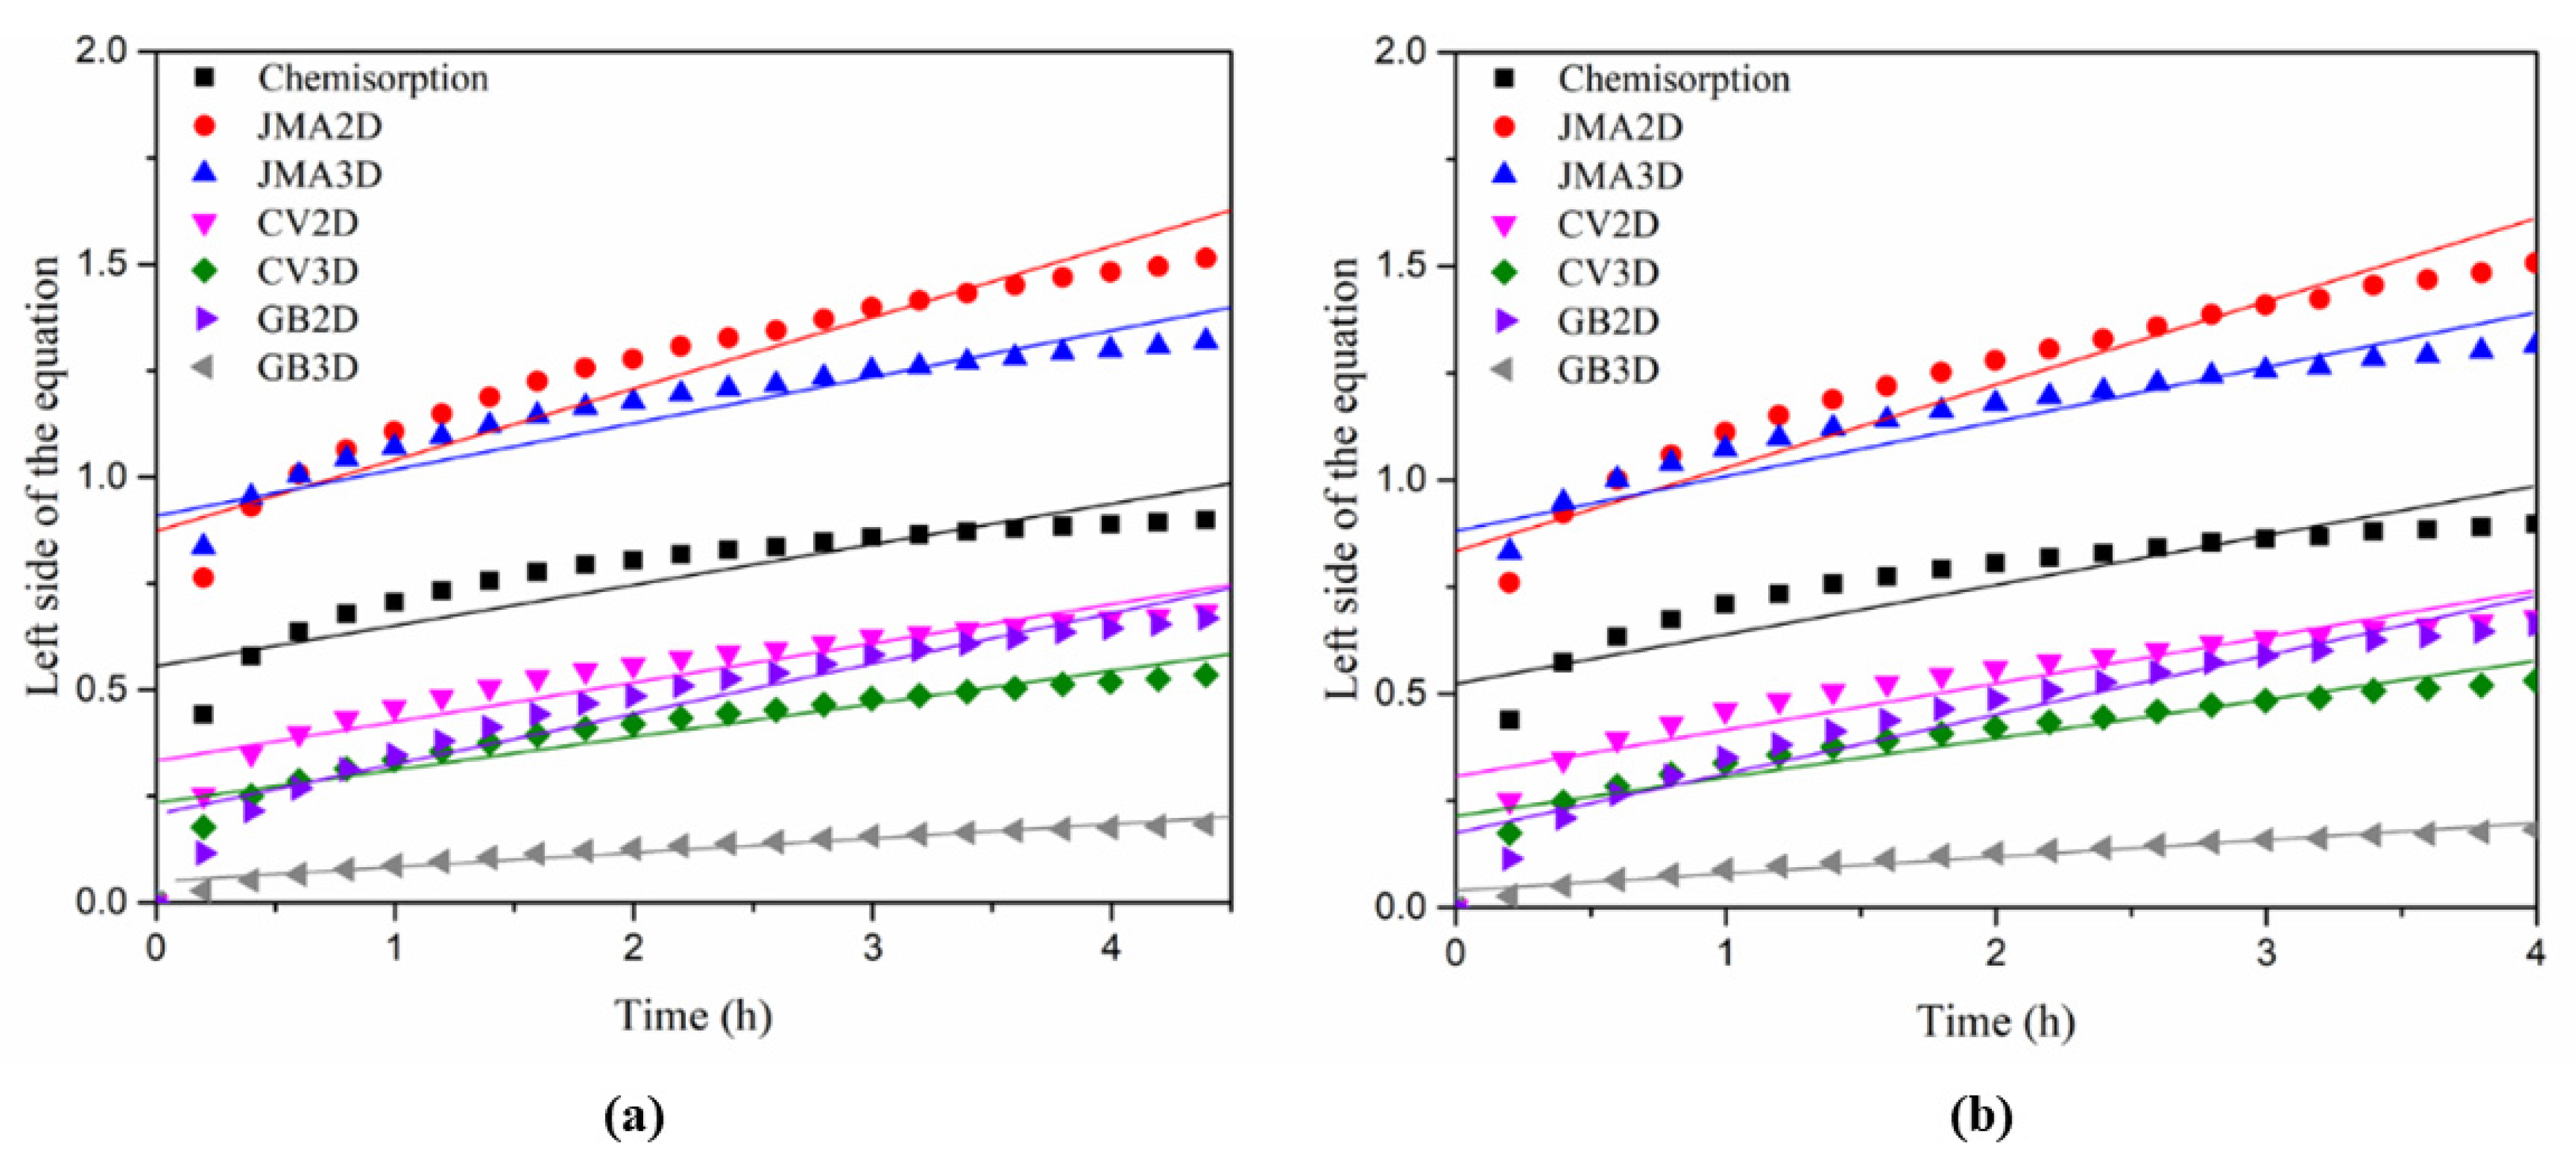
3.4. Rate-Limiting Step of First Hydrogenation
In order to understand the activation mechanism of the alloys with additive, the rate-limiting step was determined. Table 6 shows the most typical models and their mathematical expressions. In these equations, α represents the transformed ratio, i.e., the ratio of absorbed hydrogen quantity divided by the maximum hydrogen capacity. Other parameters are the rate constant (k) and the time (t). Plotting the left side of the model equations as a function of t should give a linear curve for the correct model of rate-limiting step.
Table 6.
Model equations for rate limiting step determination.
The linear fit of the different kinetic models for the TiFe alloy with 2 wt.% Zr + 2 wt.% V and 2 wt.% Zr + 2 wt.% V + 2 wt.% Mn addition is presented in Figure 7. Table 7 shows the adjusted R2 value for each model. The GB3D model was found to be the best model for both alloys. This conclusion is in agreement with previous studies that also found the GB3D model to be the best fit for the first hydrogenation of TiFe alloys [32,33].
Figure 7.
Linear fitting of each rate limiting step model for activated alloys (a) 2wt.% Zr + 2 wt.% V; (b) 2 wt.% Zr + 2 wt.% V + 2 wt.% Mn.
Table 7.
Adjusted R2 value for the linear regression of different kinetic model.
4. Conclusions
The microstructure and first hydrogenation properties of TiFe with the addition of V only, a combination of Zr + V and a combination of Zr + V + Mn were studied. It was found that TiFe with V addition could not be activated at room temperature. However, activation was possible with simultaneous additions of 2 wt.% Zr and 2 wt.% V. As the addition of 2 wt.% of Zr alone is ineffective, this means that there is some synergetic effect when Zr and V are simultaneously added to TiFe alloy. Simultaneous additions of 2 wt.% Zr, 2 wt.% V and 2 wt.% Mn to TiFe are also beneficial in terms of improving the kinetics and the capacity. The main reason for the fast activation of alloys with (Zr, V) and (Zr, V, Mn) addition is likely to be the presence of Ti2Fe-like secondary phases that act as a gateway for hydrogen. The thermodynamic parameters and the effect of cycling on the hydrogen storage properties will be the subject of a future investigation.
Author Contributions
Investigation: A.K.P., A.D. and B.T.; formal analysis: A.K.P. and J.H.; writing—original draft: A.K.P.; writing—review and editing: B.T., B.N., C.S., P.S. and J.H.; conceptualization and validation: J.H. All authors have read and agreed to the published version of the manuscript.
Funding
This research was funded in part by Department of Science and Technology, Government of India for financial support vide project number DST/TMD/MECSP/2K17/14. Partial funding was also given by NSERTC.
Institutional Review Board Statement
Not applicable.
Informed Consent Statement
Not applicable.
Data Availability Statement
Not applicable.
Acknowledgments
Abhishek K. Patel would like to acknowledge Queen Elizabeth Scholars (QES) for a fellowship. We would also like to thank Quebec Metallurgy Center (CMQ) for SEM analysis.
Conflicts of Interest
The authors declare no conflict of interest.
References
- Von Colbe, J.B.; Ares, J.-R.; Barale, J.; Baricco, M.; Buckley, C.; Capurso, G.; Gallandat, N.; Grant, D.M.; Guzik, M.N.; Jacob, I.; et al. Application of hydrides in hydrogen storage and compression: Achievements, outlook and perspectives. Int. J. Hydrogen Energy 2019, 44, 7780–7808. [Google Scholar] [CrossRef]
- Endo, N.; Suzuki, S.; Goshome, K.; Maeda, T. Operation of a bench-scale TiFe-based alloy tank under mild conditions for low-cost stationary hydrogen storage. Int. J. Hydrogen Energy 2017, 42, 5246–5251. [Google Scholar] [CrossRef]
- Reilly, J.J.; Wiswall, R.H. Formation and properties of iron titanium hydride. Inorg. Chem. 1974, 13, 218–222. [Google Scholar] [CrossRef]
- Sandrock, G.D.; Goodell, P.D. Surface poisoning of LaNi5, FeTi and (Fe,Mn)Ti by O2, Co and H2O. J. Less Common Met. 1980, 73, 161–168. [Google Scholar] [CrossRef]
- Edalati, K.; Matsuo, M.; Emami, H.; Itano, S.; Alhamidi, A.; Staykov, A.; Smith, D.J.; Orimo, S.-I.; Akiba, E.; Horita, Z. Impact of severe plastic deformation on microstructure and hydrogen storage of titanium-iron-manganese intermetallics. Scr. Mater. 2016, 124, 108–111. [Google Scholar] [CrossRef]
- Edalati, K.; Matsuda, J.; Yanagida, A.; Akiba, E.; Horita, Z. Activation of TiFe for hydrogen storage by plastic deformation using groove rolling and high-pressure torsion: Similarities and differences. Int. J. Hydrogen Energy 2014, 39, 15589–15594. [Google Scholar] [CrossRef]
- Falcão, R.B.; Dammann, E.D.C.C.; Rocha, C.J.; Durazzo, M.; Ichikawa, R.U.; Martinez, L.G.; Botta, W.J.; Leal Neto, R.M. An alternative route to produce easily activated nanocrystalline TiFe powder. Int. J. Hydrogen Energy 2018, 43, 16107–16116. [Google Scholar] [CrossRef]
- Hosni, B.; Fenineche, N.; ElKedim, O.; Khaldi, C.; Lamloumi, J. Structural and electrochemical properties of TiFe alloys synthesized by ball milling for hydrogen storage. J. Solid State Electrochem. 2018, 22, 17–29. [Google Scholar] [CrossRef]
- Aoyagi, H.; Aoki, K.; Masumoto, T. Effect of ball milling on hydrogen absorption properties of FeTi, Mg2Ni and LaNi5. J. Alloys Compd. 1995, 231, 804–809. [Google Scholar] [CrossRef]
- Emami, H.; Edalati, K.; Matsuda, J.; Akiba, E.; Horita, Z. Hydrogen storage performance of TiFe after processing by ball milling. Acta Mater. 2015, 88, 190–195. [Google Scholar] [CrossRef]
- Haraki, T.; Oishi, K.; Uchida, H.; Miyamoto, Y.; Abe, M.; Kokaji, T.; Uchida, S. Properties of hydrogen absorption by nano-structured FeTi alloys. Int. J. Mater. Res. 2008, 99, 507–512. [Google Scholar] [CrossRef]
- Bellosta von Colbe, J.M.; Puszkiel, J.; Capurso, G.; Franz, A.; Benz, H.U.; Zoz, H.; Klassen, T.; Dornheim, M. Scale-up of milling in a 100 L device for processing of TiFeMn alloy for hydrogen storage applications: Procedure and characterization. Int. J. Hydrogen Energy 2019, 44, 29282–29290. [Google Scholar] [CrossRef]
- Jain, P.; Gosselin, C.; Huot, J. Effect of Zr, Ni and Zr7Ni10 alloy on hydrogen storage characteristics of TiFe alloy. Int. J. Hydrogen Energy 2015, 40, 16921–16927. [Google Scholar] [CrossRef]
- Lv, P.; Huot, J. Hydrogen storage properties of Ti0.95FeZr0.05, TiFe0.95Zr0.05 and TiFeZr0.05 alloys. Int. J. Hydrogen Energy 2016, 41, 22128–22133. [Google Scholar] [CrossRef]
- Patel, A.K.; Sharma, P.; Huot, J. Effect of annealing on microstructure and hydrogenation properties of TiFe + X wt% Zr (X = 4, 8). Int. J. Hydrogen Energy 2018, 43, 6238–6243. [Google Scholar] [CrossRef]
- Guéguen, A.; Latroche, M. Influence of the addition of vanadium on the hydrogenation properties of the compounds TiFe0.9Vx and TiFe0.8Mn0.1Vx (x = 0, 0.05 and 0.1). J. Alloys Compd. 2011, 509, 5562–5566. [Google Scholar] [CrossRef]
- Chung, H.S.; Lee, J.Y. Effect of partial substitution of Mn and Ni for Fe in FeTi on hydriding kinetics. Int. J. Hydrogen Energy 1986, 11, 335–339. [Google Scholar] [CrossRef]
- Lee, S.M.; Perng, T.P. Effect of the second phase on the initiation of hydrogenation of TiFe1−xMx (M = Cr,Mn) alloys. Int. J. Hydrogen Energy 1994, 19, 259–263. [Google Scholar] [CrossRef]
- Ali, W.; Hao, Z.; Li, Z.; Chen, G.; Wu, Z.; Lu, X.; Li, C. Effects of Cu and Y substitution on hydrogen storage performance of TiFe0.86Mn0.1Y0.1−xCux. Int. J. Hydrogen Energy 2017, 42, 16620–16631. [Google Scholar] [CrossRef]
- Lee, S.M.; Perng, T.P. Correlation of substitutional solid solution with hydrogenation properties of TiFe1-xMx (M = Ni, Co, Al) alloys. J. Alloys Compd. 1999, 291, 254–261. [Google Scholar] [CrossRef]
- Patel, A.K.; Duguay, A.; Tougas, B.; Schade, C.; Sharma, P.; Huot, J. Microstructure and first hydrogenation properties of TiFe alloy with Zr and Mn as additives. Int. J. Hydrogen Energy 2020, 45, 787–797. [Google Scholar] [CrossRef]
- Patel, A.K.; Tougas, B.; Sharma, P.; Huot, J. Effect of cooling rate on the microstructure and hydrogen storage properties of TiFe with 4 wt% Zr as an additive. J. Mater. Res. Technol. 2019, 8, 5623–5630. [Google Scholar] [CrossRef]
- Contieri, R.J.; Lopes, E.S.N.; Taquire de La Cruz, M.; Costa, A.M.; Afonso, C.R.M.; Caram, R. Microstructure of directionally solidified Ti–Fe eutectic alloy with low interstitial and high mechanical strength. J. Cryst. Growth 2011, 333, 40–47. [Google Scholar] [CrossRef]
- Dong, C.; Hei, Z.K.; Wang, L.B.; Song, Q.H.; Wu, Y.K.; Kuo, K.H. A new icosahedral quasicrystal in rapidly solidified FeTi2. Scr. Metall. Mater. 1986, 20, 1155–1158. [Google Scholar] [CrossRef]
- Fedorov, T.F.; Kuzma, Y.B. The Titanium-Iron-Boron System. Inorg. Mater. 1967, 8, 1307–1308. [Google Scholar] [CrossRef]
- Faisal, M.; Suh, J.-Y.; Lee, Y.-S. Understanding first cycle hydrogenation properties of Ti–Fe–Zr ternary alloys. Int. J. Hydrogen Energy 2021, 46, 4241–4251. [Google Scholar] [CrossRef]
- Cheary, R.W.; Coelho, A.A.; Cline, J.P. Fundamental Parameters Line Profile Fitting in Laboratory Diffractometers. J. Res. Natl. Inst. Stand. Technol. 2004, 109, 1–25. [Google Scholar] [CrossRef]
- Schneider, C.A.; Rasband, W.S.; Eliceiri, K.W. NIH Image to ImageJ: 25 years of image analysis. Nat. Methods 2012, 9, 671–675. [Google Scholar] [CrossRef] [PubMed]
- Mintz, M.H.; Zeiri, Y. Hydriding kinetics of powders. J. Alloys Compd. 1995, 216, 159–175. [Google Scholar] [CrossRef]
- Avrami, M. Kinetics of phase change. I: General theory. J. Chem. Phys. 1939, 7, 1103–1112. [Google Scholar] [CrossRef]
- Pang, Y.; Li, Q. A review on kinetic models and corresponding analysis methods for hydrogen storage materials. Int. J. Hydrogen Energy 2016, 41, 18072–18087. [Google Scholar] [CrossRef]
- Lv, P.; Guzik, M.N.; Sartori, S.; Huot, J. Effect of ball milling and cryomilling on the microstructure and first hydrogenation properties of TiFe+4wt.% Zr alloy. J. Mater. Res. Technol. 2019, 8, 1828–1834. [Google Scholar] [CrossRef]
- Ulate-Kolitsky, E.; Tougas, B.; Neumann, B.; Schade, C.; Huot, J. First hydrogenation of mechanically processed TiFe-based alloy synthesized by gas atomization. Int. J. Hydrogen Energy 2021, 46, 7381–7389. [Google Scholar] [CrossRef]
Publisher’s Note: MDPI stays neutral with regard to jurisdictional claims in published maps and institutional affiliations. |
© 2021 by the authors. Licensee MDPI, Basel, Switzerland. This article is an open access article distributed under the terms and conditions of the Creative Commons Attribution (CC BY) license (https://creativecommons.org/licenses/by/4.0/).