You are currently on the new version of our website. Access the old version .
ProcessesProcesses
  • Article
  • Open Access

9 July 2021

Optimized ANFIS Model Using Aquila Optimizer for Oil Production Forecasting

,
,
,
,
,
and
1
School of Petroleum Engineering, China University of Petroleum (East China), Qingdao 266580, China
2
State Key Laboratory for Information Engineering in Surveying, Mapping and Remote Sensing, Wuhan University, Wuhan 430079, China
3
Department of Computer, Damietta University, Damietta 34511, Egypt
4
Department of Mathematics, Faculty of Science, Zagazig University, Zagazig 44519, Egypt

Abstract

Oil production forecasting is one of the essential processes for organizations and governments to make necessary economic plans. This paper proposes a novel hybrid intelligence time series model to forecast oil production from two different oil fields in China and Yemen. This model is a modified ANFIS (Adaptive Neuro-Fuzzy Inference System), which is developed by applying a new optimization algorithm called the Aquila Optimizer (AO). The AO is a recently proposed optimization algorithm that was inspired by the behavior of Aquila in nature. The developed model, called AO-ANFIS, was evaluated using real-world datasets provided by local partners. In addition, extensive comparisons to the traditional ANFIS model and several modified ANFIS models using different optimization algorithms. Numeric results and statistics have confirmed the superiority of the AO-ANFIS over traditional ANFIS and several modified models. Additionally, the results reveal that AO is significantly improved ANFIS prediction accuracy. Thus, AO-ANFIS can be considered as an efficient time series tool.

1. Introduction

Accurate forecasting of oil production is a significant and cumbersome task for monitoring and improving oil reservoirs. While hydrocarbons usage constitutes the largest share of the globe’s energy consumption in 2019, with over 58% world’s energy consumption [1,2]. Therefore, oil production forecasting plays a crucial role in the life cycle of oil reservoirs, including early resource evaluation and improving recovery. Simultaneously, various factors influence the hydrocarbon resources, including formation heterogeneities, the complexity of fluid flow within the subsurface formation, reservoir properties, and fluid properties that make the precise prediction of oil production more cumbersome [3,4]. Three approaches are frequently used to establish the prediction of oil production models in oil reservoirs. Numerical reservoir simulation (NRS) is considered the optimal traditional means for forecasting oil production. NRS method relies on a numerical model, which tends to achieve good performance and evaluate reservoir geological heterogeneity [5,6]. Furthermore, the NRS models have some limitations, including being time-consuming, cumbersome [7], and it requires constructing an accurate static model, history matching, and other dynamic model parameters. Furthermore, analytical techniques are employed to compute various forms of wellbore flow rate adjustments. Depending on the reservoir heterogeneity, well structures complexity, and boundary conditions, some hypotheses are essential for determining the analytical solution [8,9,10]. Moreover, the conventional decline curve analysis (DCA) technique [11,12] can forecast the production rate by evaluating the long-term hydrocarbon production data. The DCA approach employs the empirical equations to match the historical production data with a model, including harmonic, hyperbolic, and exponential models [13]. These models are perfect curves and cannot consider the actual formation factors. Thus, it is challenging to ensure accurate performance by employing DCA.
The use of a numerical simulation to predict oil production is a more reliable and robust technique. Its accuracy is based on the accuracy of static models and history matching quality. However, it is troublesome to construct an accurate static model [11,14,15]. Moreover, the parameterization techniques of the static model and the integrating method of objective components have a significant effect on history matching and reservoir prediction [14,15,16]. Although multi-objective optimization can be determined, a perfect history matching model leads to poor prediction [17]. Thus, the history matching approach is formidable and requires a long time, which renders a lot of work [18].
The applications of deep learning (DL) and machine learning (ML) in the petroleum industry have gained more concern [19], particularly in forecasting oil production [20,21], forecasting of pressure-volume-temperature (PVT) properties [22,23], optimizing well placement and oil production [24,25], the prediction of reservoir petrophysical properties, including porosity and permeability [26,27], and oil spill detection [28]. Deep learning has been incorporated into the petroleum industry with the remarkable development of deep learning algorithms, enabling overcoming troublesome concerns in oilfields [21].
Several DL and ML methods were introduced for forecasting oil production [1,20,21]. For example, Sagheer et al. [29] introduced Long Short-Term Memory (LSTM) to predict oil production time series. Fan et al. [1] proposed to incorporate autoregressive integrated moving average (ARIMA) and LSTM to forecast oil production. In [30], an optimized Random Vector Functional Link was introduced for time series forecasting. This model was implemented for oil production in Tahe oilfield. Liu et al. [20] employed LSTM with Ensemble Empirical Mode Decomposition (EEMD) to predict oil production.
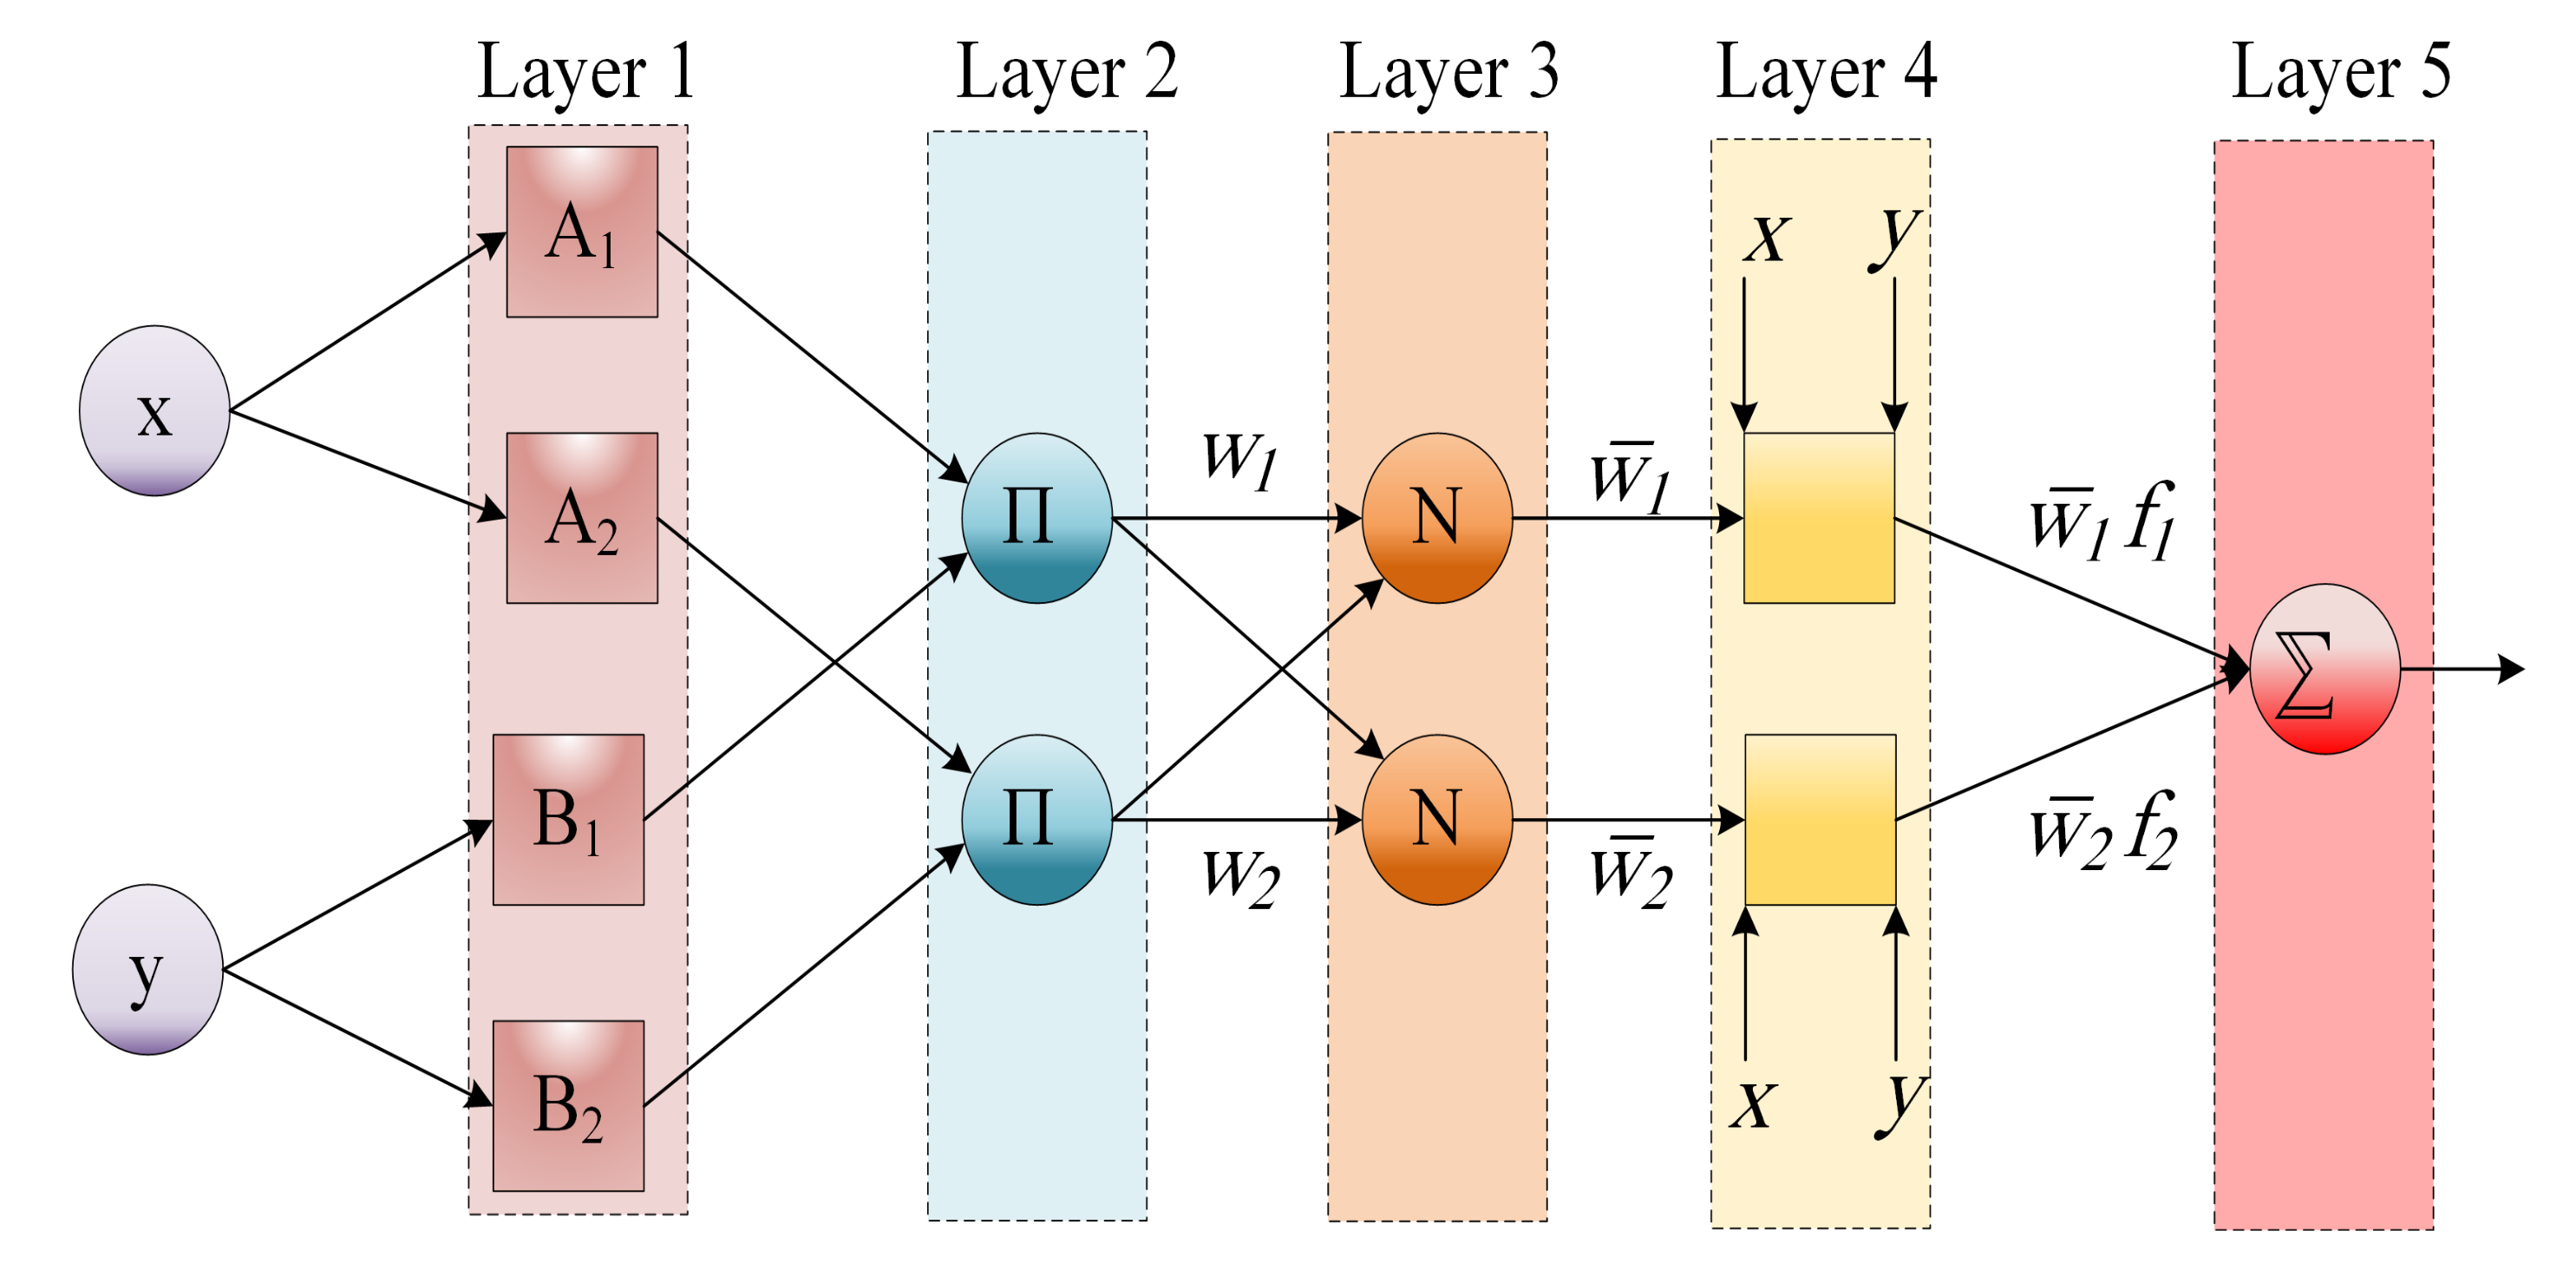
One of the most efficient time series prediction models is the Adaptive Neuro Fuzzy Inference System (ANFIS), which was employed for different forecasting problems [31,32,33]. In this paper, we improve a modified ANFIS model using a new metaheuristic optimization algorithm called the Aquila Optimizer (AO) [34]. It belongs to a class of nature-inspired optimization algorithms, which are motivated by the behavior of living organisms, such as grey wolves [35], harris hawks [36], or red foxes [37]. The AO is inspired by the behavior of Aquila in nature, and it showed superior performance in solving different optimization and complex problems. In this paper, AO is applied to optimize ANFIS parameters to avoid traditional ANFIS shortcomings. First, the AO works by generating a set of candidates (solutions). Each one represents ANFIS parameter configurations. Then, each solution is evaluated using the training set. Thereafter, the solution that has the smallest fitness value is the best solution.
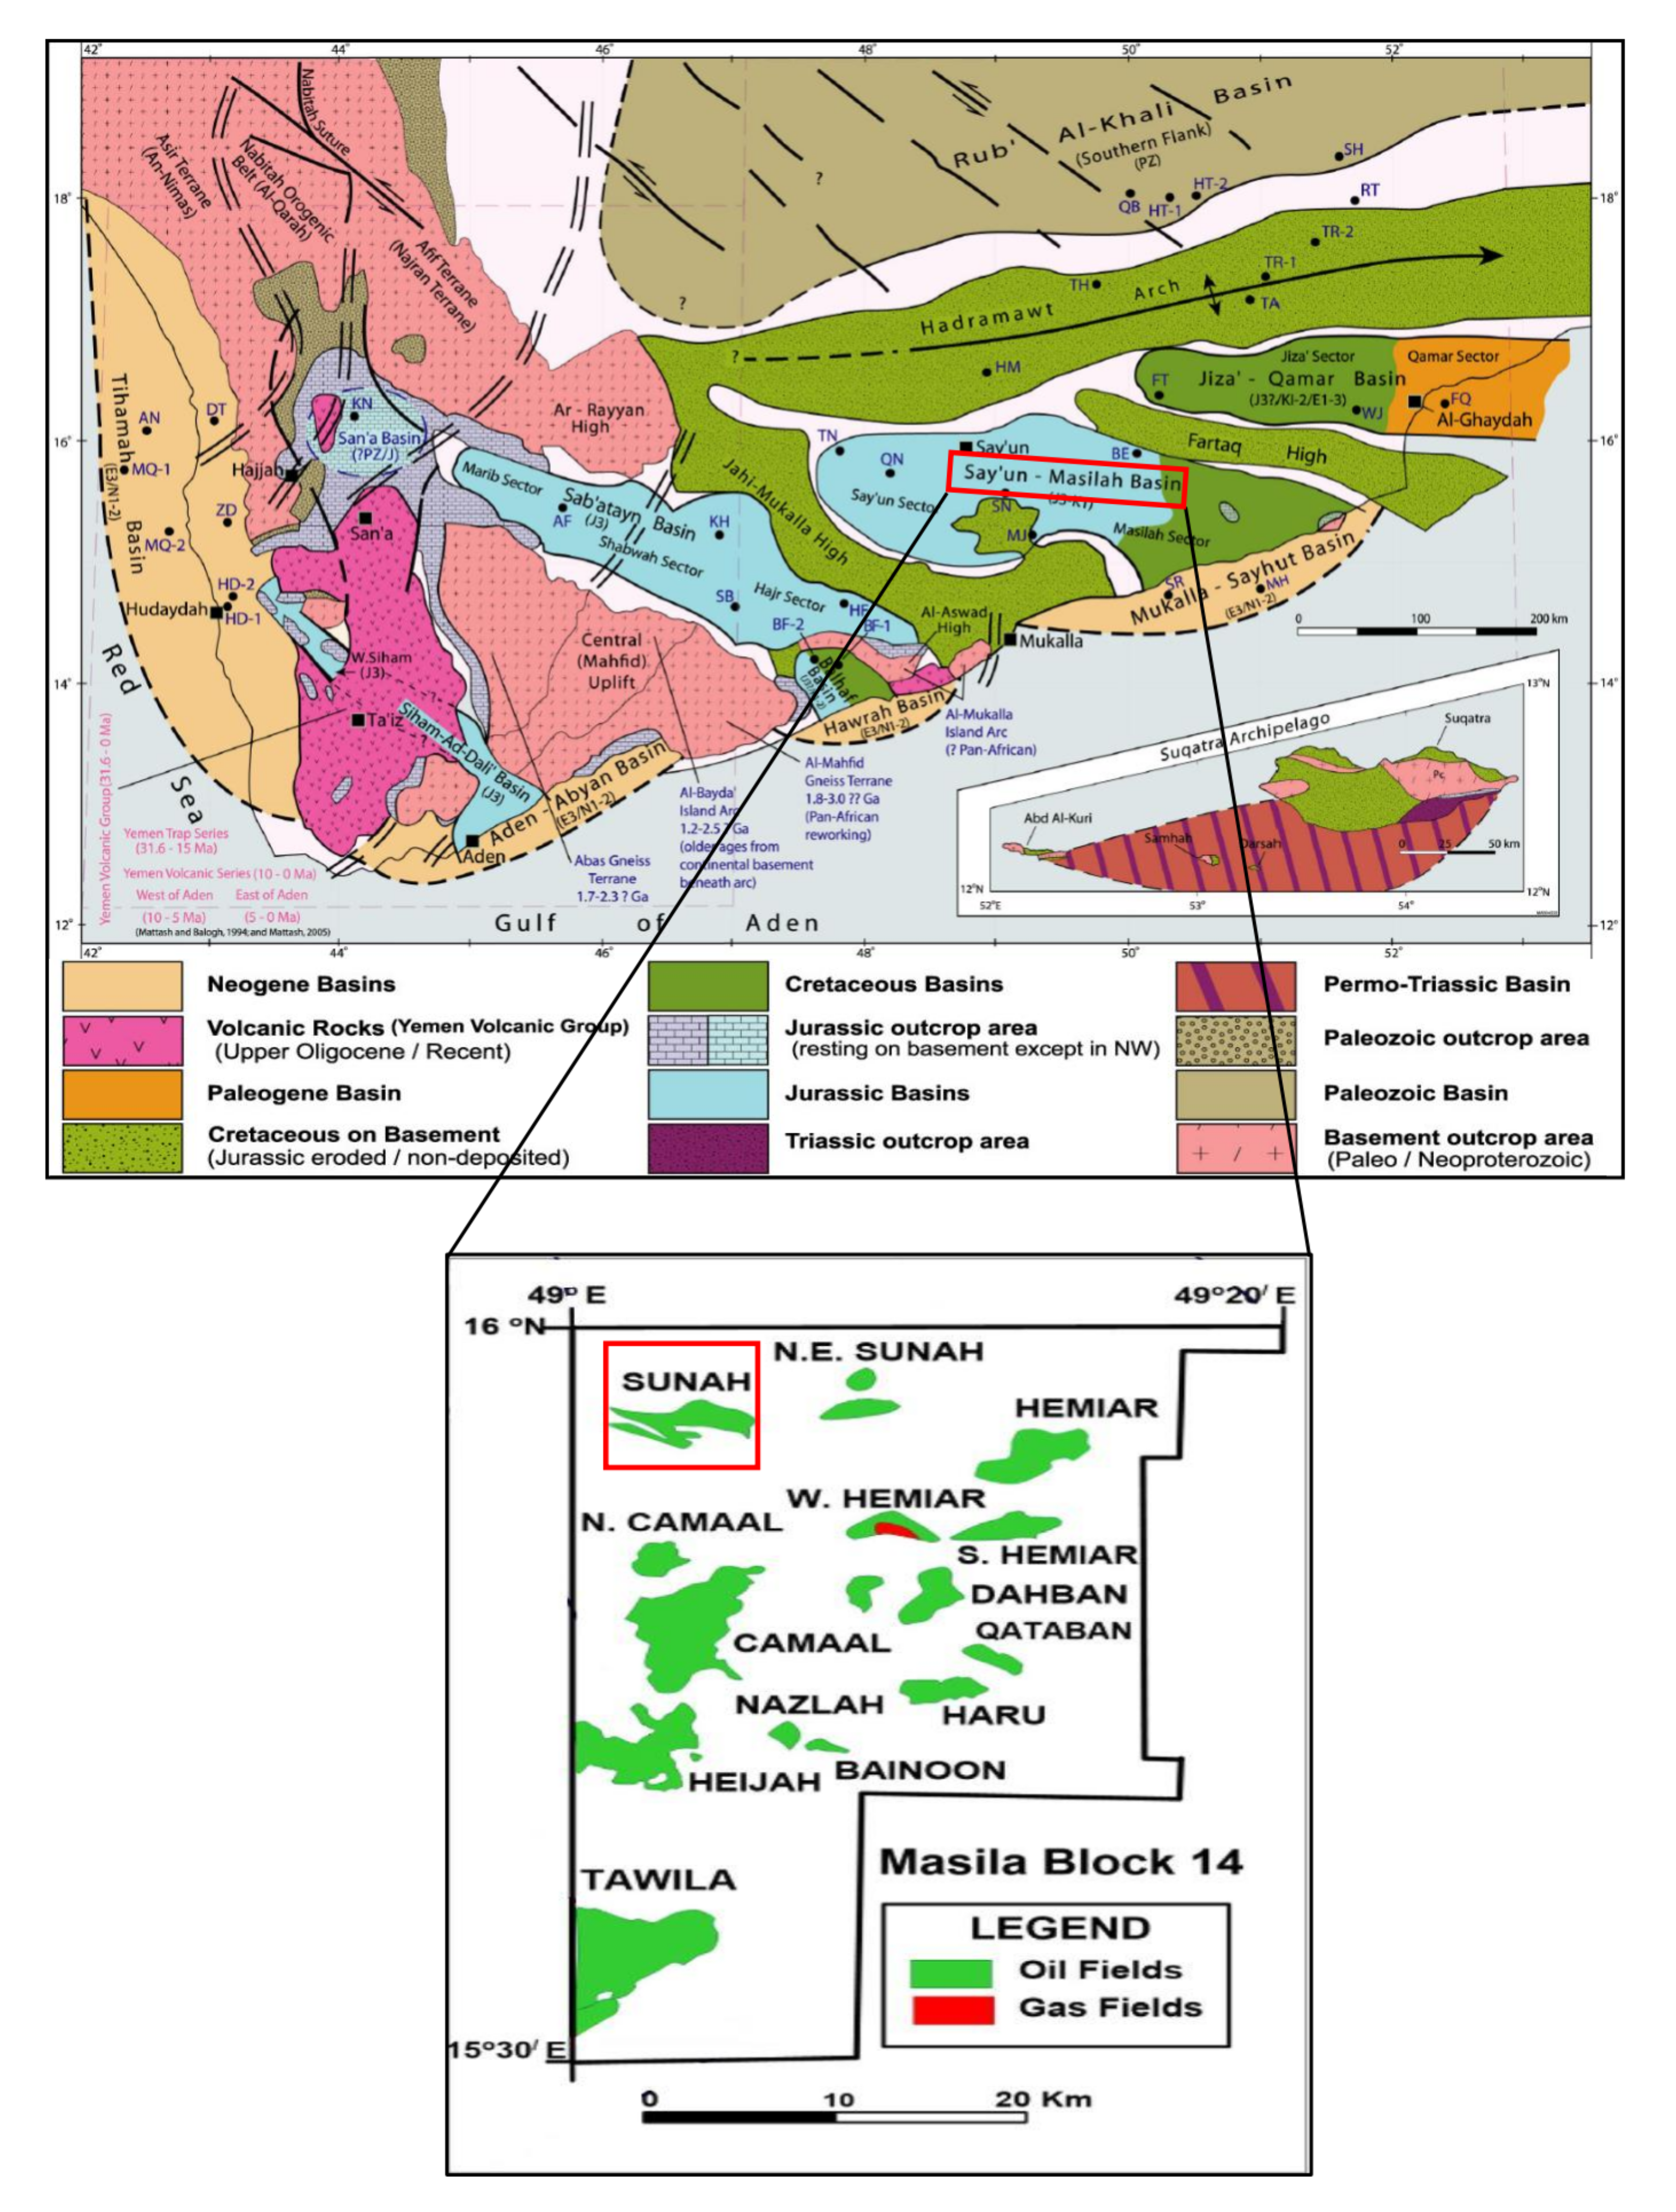
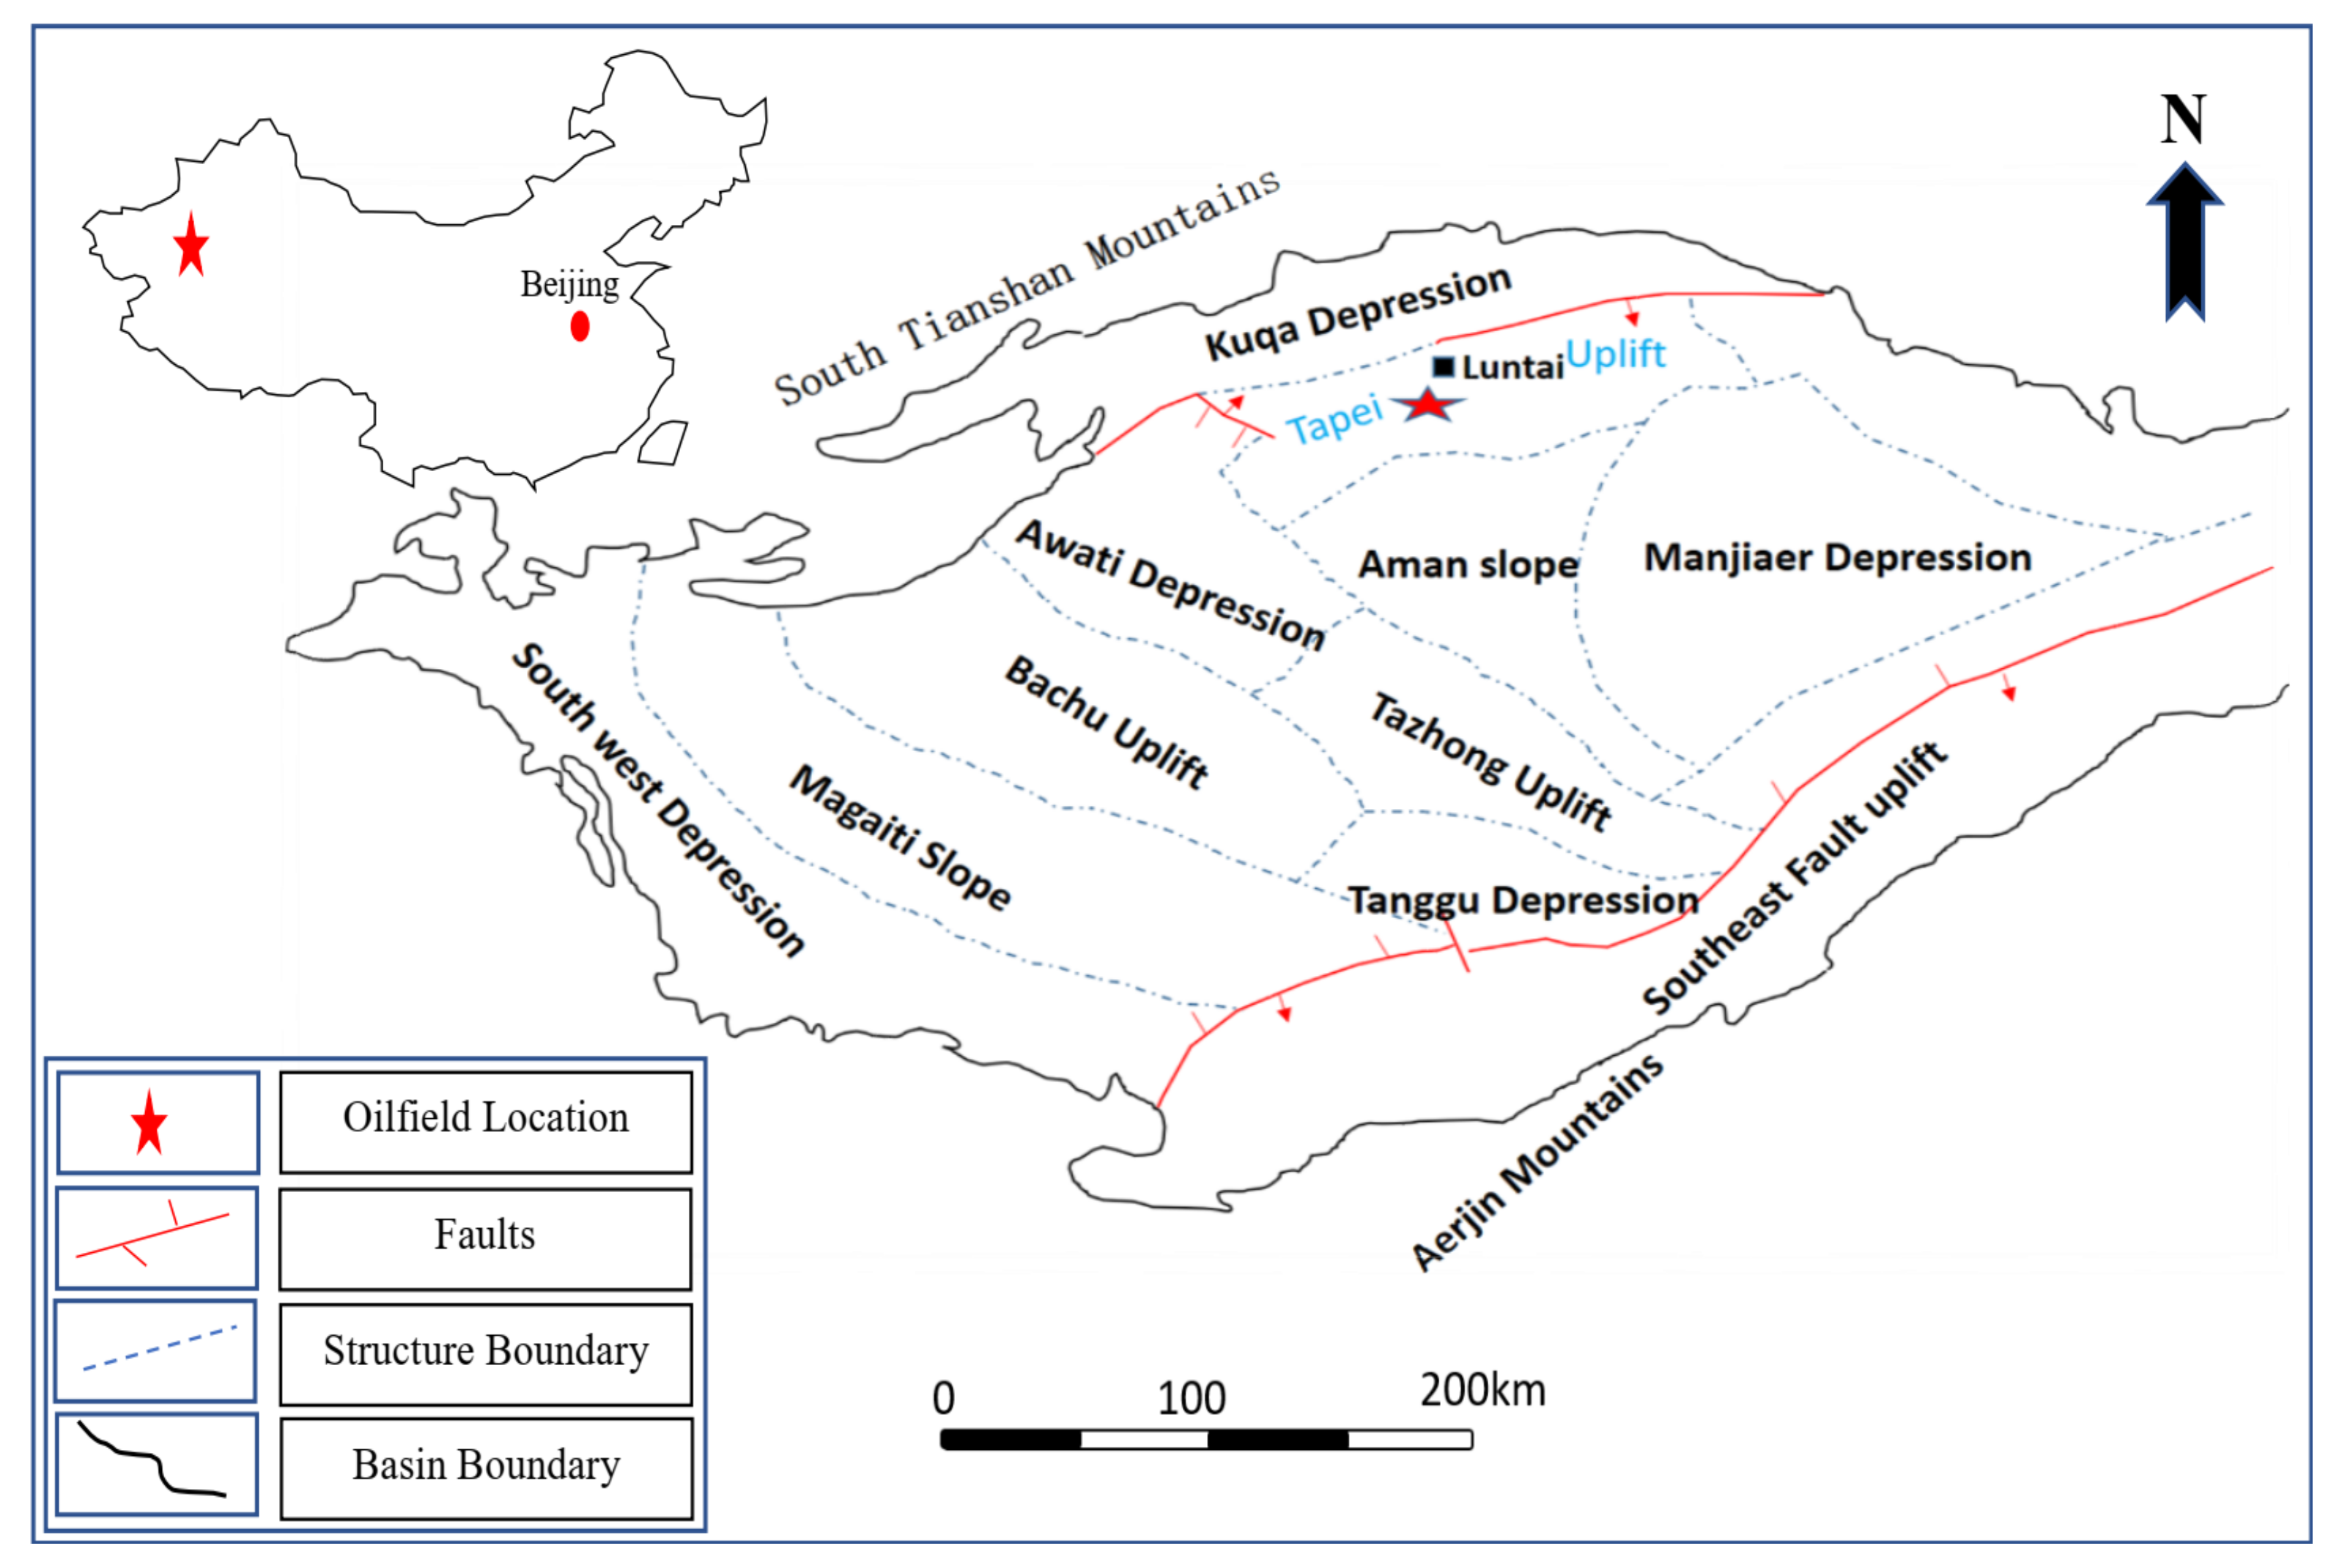
In this paper, AO-ANFIS is used on two real-world historical oil production datasets from Masila oilfields in Yemen and Tahe oilfields in China. The evaluation experiments are implemented using several performance measures, and extensive comparisons to several models are also carried out. The main contribution of the current study is:
  • A new modified ANFIS model, called AO-ANFIS, is proposed as a time series forecasting model for oil production.
  • The AO algorithm to optimize ANFIS parameters to overcome the shortcomings of ANFIS.
  • We implement extensive comparisons to several models to verify the performance of AO-ANFIS using two real-world datasets.
This paper is presented as: Section 2 summarizes several oil forecasting studies. The backgrounds of applied methods are described in Section 3. The AO-ANFIS time series forecasting model is described in Section 4. Experiments and conclusion are presented in Section 5 and Section 6, respectively.

3. Backgrounds

In this section, we give a brief description of the applied methods, as follows.

3.1. ANFIS

The ANFIS approach was established by [48] as a new artificial network (ANN). The ANFIS model’s structure is considered the incorporation of ANN and Fuzzy Inference Systems (FIS). Furthermore, “IF-THEN rules” are applied to generate a mapping for the inputs and outputs, identified as the “Takagi–Sugeno inference model”. This renders to substantiate that the ANFIS approach is more convenient and reliable to deal with real-global datasets as it has a robust learning capability. As stated by these characteristics, the ANFIS approach has been implemented in many applications.
In the common ANFIS workflow, as drawn in Figure 1, x and y represent the inputs of Layer 1, where O 1 i indicates the outputs of the i node. The ANFIS mathematical model is expressed as follows:
O 1 i = μ A i ( x ) , i = 1 , 2 , O 1 i = μ B i 2 ( y ) , i = 3 , 4
μ ( x ) = e ( x ρ i α i ) 2 ;
where μ indicates the generalized Gaussian membership function. The membership values of μ is represented by A i and B i , and α i and ρ i represent the premise parameter set.
Figure 1. The basic ANFIS structure.
Moreover, Equation (3) can be utilized for the second layer:
O 2 i = μ A i ( x ) × μ B i 2 ( y )
The output of the third Layer is calculated as:
O 3 i = w ¯ i = ω i ( i = 1 ) 2 ω i ,
in which w i represents the ith output from the layer 2.
Furthermore, the output of layer 4 is generated by Equation (5).
O 4 , i = w ¯ i f i = w ¯ i ( p i x + q i y + r i )
in which f indicates a function that uses the input and parameters of the network as inputs. r i , q i , and p i indicate consequent parameters of node i.
Finally, layer 5 generates the output that is computed as in Equation (6).
O 5 = i w ¯ i f i

3.2. Aquila Optimizer (AO)

In this section, the proposed Aquila Optimizer (AO) is presented as follows.
Following [34], AO starts by determining the initial value for a set of N individuals X using the following formula:
X i j = r 1 × ( U B j L B j ) + L B j , i = 1 , 2 , , N j = 1 , 2 , , D i m
In Equation (7), r 1 is a random value that belongs to [ 0 , 1 ] . L B j and U B j denote the lower bound and upper bound at dimension j, respectively. D i m is the dimension of the test problem.
Similar to other metaheuristic techniques, AO has two phases, namely exploration and exploitation, to update the current individuals. The exploration phase starts when t ( 2 3 ) * T , and it has two methods; the first one is formulated using Equation (8):
X 1 ( t + 1 ) = X b e s t ( t ) × 1 t T + ( X M ( t ) X b e s t ( t ) * r a n d ) ,
In Equation (8), T is the number of total iterations. X b (t) is the best individual obtained so far at current iteration t, while the factor 1 t T is applied to manage the search during the exploration phase. In addition, the X M (t) is the individual average among the dimensions, and it is computed as:
X M ( t ) = 1 N i = 1 N X ( t ) , j = 1 , 2 , , D i m
In the second exploration method, the AO depends on using Levy flight distribution to update the current individual as formulated in the following equation:
X 2 ( t + 1 ) = X b e s t ( t ) × L e v y ( D ) + X R ( t ) + ( y x ) * r a n d ,
where X R denotes a random chosen individual. L e v y ( D ) refers to the Levy flight distribution defined as:
L e v y ( D ) = s × u × σ | υ | 1 β , σ = Γ ( 1 + β ) × s i n e ( π β 2 ) Γ ( 1 + β 2 ) × β × 2 ( β 1 2 )
In Equation (11), s = 0.01 and β = 1.5 are constant values, u and υ refer to random numbers generated from [0,1]. In Equation (10), y and x are used to simulate the spiral shape as:
y = r × c o s ( θ ) , x = r × s i n ( θ )
r = r 1 + U × D 1 , θ = ω × D 1 + θ 1 , θ 1 = 3 × π 2
where r 1 [ 0 , 20 ] is random value. ω = 0.005 and U = 0.00565 denote small values.
Following [34], there are two methods are used to simulate the exploitation ability of individuals during the searching process. The first method depends on using the best solution ( X b e s t ), and the average of individual’s location ( X M ) and this formulated as:
X 3 ( t + 1 ) = ( X b e s t ( t ) X M ( t ) ) × α r a n d + ( ( U B L B ) × r a n d + L B ) × δ ,
In Equation (14), r a n d [ 0 , 1 ] denotes random number. α and δ denote the exploitation adjustment parameters.
The second exploitation method depends on X b e s t , L e v y , and quality function Q F .
X 4 ( t + 1 ) = Q F × X b e s t ( t ) ( G 1 × X ( t ) × r a n d ) G 2 × L e v y ( D ) + r a n d × G 1 ,
where the main aim of using Q F is to balance the search strategies, and it is defined as:
Q F ( t ) = t 2 × r a n d ( ) 1 ( 1 T ) 2
G 1 represents different motions applied to track the best solution, and it is defined as
G 1 = 2 × r a n d ( ) 1
In Equation (15), G 2 is decreased from 2 to 0, and it is formulated as
G 2 = 2 × ( 1 t T )
where r a n d represents a random value.
The full description of the AO algorithm is given in Algorithm 1.
Algorithm 1 Aquila Optimizer (AO)
1: Set the initial value for the parameters of the AO.
2: Generate initial population X.
3: while (end condition is not met) do
4: Compute the fitness values for each X i .
5: Find the best individual X b e s t (t)
6: for(i=1,2…,N)do
7:  if t≤ ( 2 3 )*T then
8:   { ▹ First exploration method}
9:   Update the X i using Equation (8).
10:   if Fit( X 1 (t + 1)) < Fit(X(t)) then
11:    X(t) = ( X 1 (t + 1))
12:    if Fit( X 1 (t + 1)) < Fit( X b e s t (t)) then
13:      X b e s t (t) = X 1 (t + 1)
14:    end if
15:   end if
16:   { ▹ Second exploration method}
17:   Update the X i using Equation (10).
18:   if Fit( X 2 (t + 1)) < Fit(X(t)) then
19:    X(t) = ( X 2 (t + 1))
20:    if Fit( X 2 (t + 1)) < Fit( X b e s t (t)) then
21:      X b e s t (t) = X 2 (t + 1)
22:    end if
23:   end if
24:  else
25:   { ▹ First exploitation method}
26:   Update the X i using Equation (14).
27:   if Fit( X 3 (t + 1)) < Fit(X(t)) then
28:    X(t) = ( X 3 (t + 1))
29:    if Fit( X 3 (t + 1)) < Fit( X b e s t (t)) then
30:      X b e s t (t) = X 3 (t + 1)
31:    end if
32:   end if
33:   { ▹ Second exploitation method}
34:   Update X i using Equation (15).
35:   if Fitness( X 4 (t + 1)) < Fitness(X(t)) then
36:    X(t) = ( X 4 (t + 1))
37:    if Fitness( X 4 (t + 1)) < Fitness( X b e s t (t)) then
38:      X b e s t (t) = X 4 (t + 1)
39:    end if
40:   end if
41:  end if
42: end for
43: end while
44: return ( X b e s t ).

4. Proposed AO-ANFIS Model

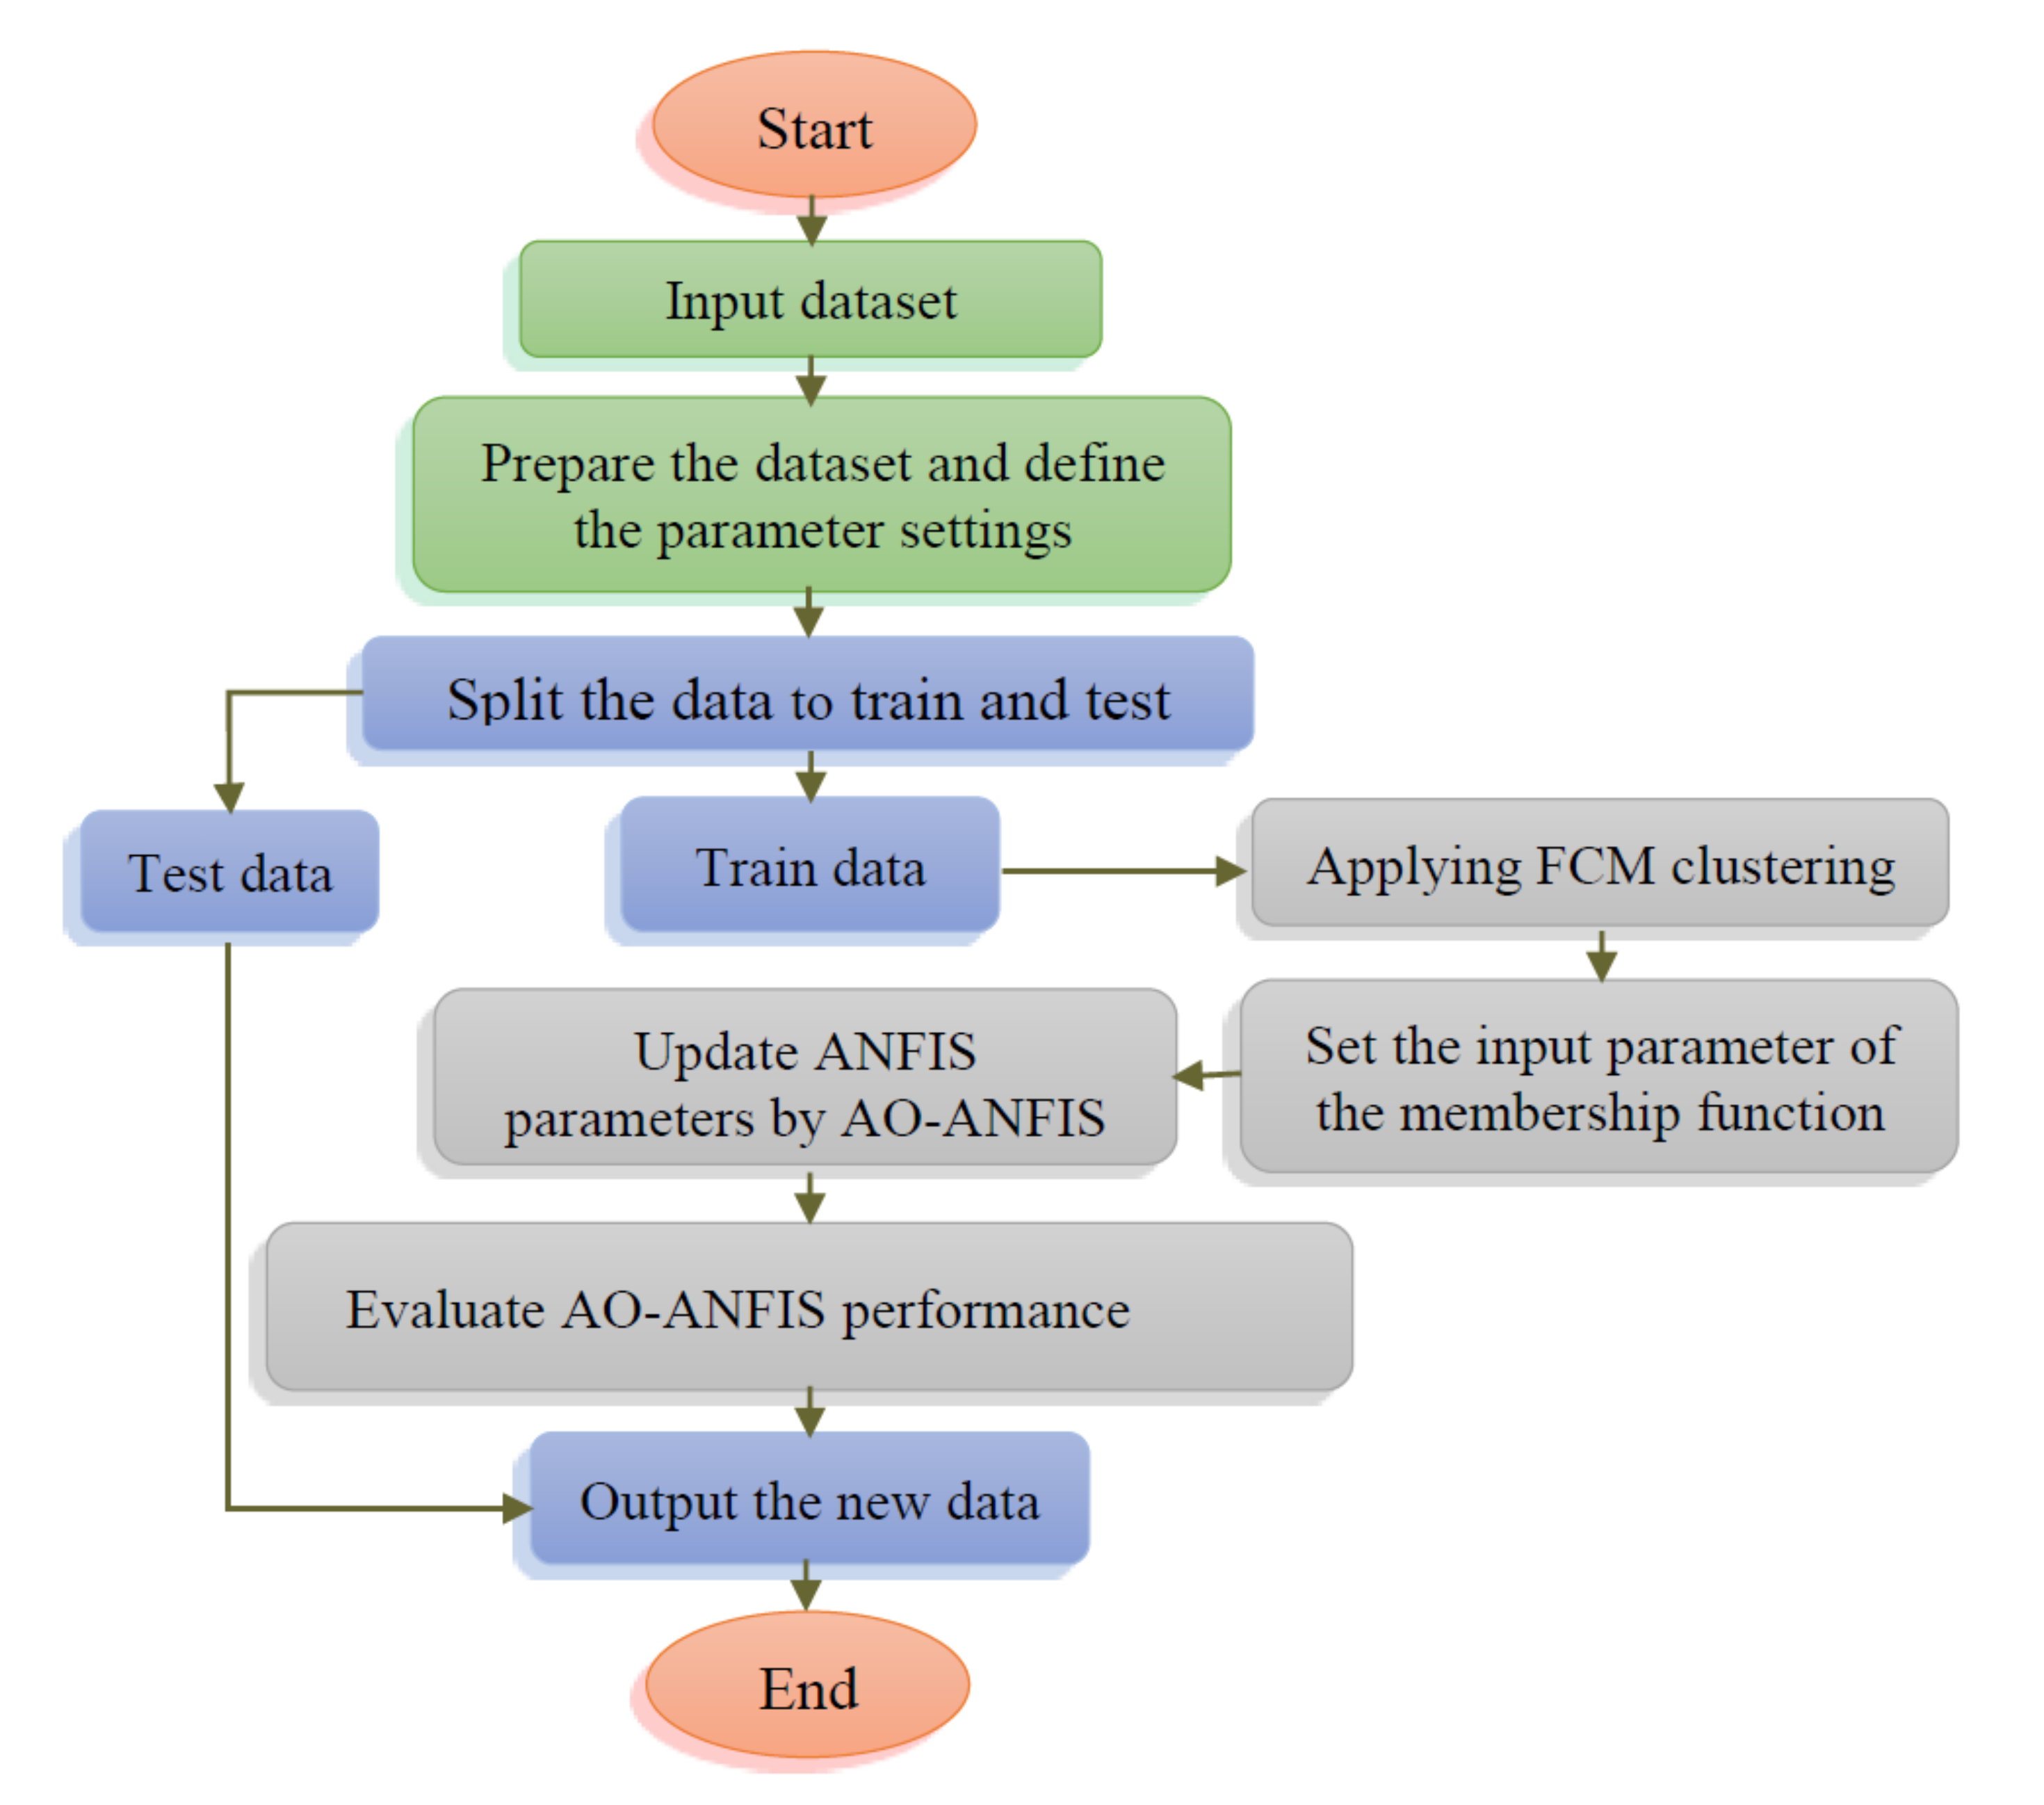
The framework of the developed forecasting oil production is given in Figure 2. The developed model aims to enhance the ability of the ANFIS network for forecasting oil using the behavior of the AO algorithm. This is achieved by determining the optimal parameters of ANFIS using AO.
Figure 2. The workflow of the proposed AO-ANFIS.
The developed AO-ANFIS starts by constructing the ANFIS network, followed by splitting the historical oil dataset into training and validation sets, which represent 70% and 30%, respectively. Then, the generation of a set of N individuals X, which represents the parameters for ANFIS (i.e., we have N configurations). The next step is to use the training part of the dataset and compute the quality of each configuration using the following fitness function (i.e., it is the root mean square error):
M S E = 1 N a i = 1 N s ( T i P i ) 2
where T and P refer to the actual and predicted output, respectively, and N a is the number of training samples.
This process is followed by updating the value of the best configuration X b e s t , and then updating other configurations using the operators of A O , as defined in Algorithm 1. Thereafter, the validation part is applied to the best configuration obtained so far and computed the quality of the output. Besides this quality, the proposed model is used for forecasting oil production.
The steps of the developed AO-ANFIS is given in Algorithm 2.
Algorithm 2 Proposed AO-ANFIS algorithm
1: Input: number of individuals (N) and total number of iterations ( t m a x ).
2: Build the ANFIS network and generate set of N individuals X.
3: Split the data into training and validation parts.
4: t = 1 .
5: while t < = t m a x do
6: Compute quality of each individual X i .
7: Find ( X b e s t ).
8: Update other individuals using operators of AO as defined in Equations (8)–(15).
9:  t = t + 1 .
10: end while
11: Return X b .

5. Experimental Evaluation

5.1. Study Areas

5.1.1. Masila Oilfield, Yemen

The Masila basin is considered the largest basin in Yemen. It is located in the south part of Yemen, Hadramout city, with a total area of 1250 km 2 (see Figure 3). Masila basin consists of more than 18 oilfields, including Sunah, N.E. Sunah, Hemiar, N.Camaal, and Tawila oilfield, etc. The Sunah oilfield is the second-largest oilfield in the Masila basin. The Sunah oilfield is an onshore oilfield located in the N.E. corner of the Masila basin. It is subdivided into three main reservoirs, namely S1, S2, and S3. The S1 reservoir is divided into S1A, S1B, S1C, and S1D. The Qishn formation (Upper Qishn formation) is the main target formation in the S1A reservoir [49,50]. The data is collected from 11/10/1993 to 01/14/2012 with 6640 records.
Figure 3. First study area: the Masila basin oilfield, Yemen.

5.1.2. Block 9, Tahe Oilfield, China

The Taha oilfield is located in Luntai city, Xinxiang province, China, as shown in Figure 4. It was discovered in the 1990s by the China National Petroleum Corporation (CNPC), with a proven reserve of 600 × 10 6 tonnes. The Taha oilfield consists of several areas, including block-9. Block-9 is located at east longitude as 84°13 9 –84°18 52 degree and northing latitude 41°15 56 –41°16 4 , about 60km southwest of Luntai County of Xinjiang, China [51,52]. The data used for this field is collected from 2006/01/01 to 2014/11/01 with about 3200 records.
Figure 4. The second study area (The Tahe oilfield, Block 9, China).

5.2. Performance Metrics

In the current study, we employed three performance metrics to evaluate the proposed AO-ANFIS model, the Mean Absolute Error (MAE), Mean Absolute Percentage Error (MAPE), Coefficient of Determination R 2 , Standard deviation (Std), Akaike information Criterion (AIC), and Bayesian information criterion (BIC). The definitions of the measures are presented in Table 1, where N represents the size of the testing set. Y and P y denote the target oil production and its prediction value using the model, respectively. Y ¯ is the mean of Y. Moreover, k is the number of data to be estimated, and L ^ is the maximized value of likelihood function.
Table 1. Performance measures.

5.3. Results

5.3.1. Masila Oilfields, Yemen

In this section, we assess the performance of the AO-ANFIS using datasets of Masila oilfields. Additionally, we compared the AO-ANFIS to the traditional ANFIS model and several modified ANFIS models, using several optimization methods, namely, sine cosine algorithm (SCA), grey wolf optimizer (GWO), particle swarm optimization (PSO) algorithm, slime mould algorithm (SMA), and genetic algorithm (GA).
From Table 2, we notice that the AO-ANFIS obtained the best performance in all applied performance measures, namely, RMSE, MAE, R 2 , Std, computation time, AIC, and BIC. For other models, in terms of RMSE, the GA-ANFIS came in the second rank, followed by PSO, SMA, GWO, SCA, and the original ANFIS. For MAE, the GA came in the second rank, followed by PSO, SMA, GWO, SCA, and the original ANFIS. For R 2 , the PSO and GA obtained the second and third ranks, respectively, followed by SMA, GWO, SCA, and the original ANFIS. For Std, the PSO and GA also obtained the second and third rank, respectively, followed by the original ANFIS, SMA, GWO, and SCA. For AIC and BIC, the PSO came in the second rank, followed by SMA, GA, GWO, original ANFIS, and SCA, respectively.
Table 2. The results of the Almasila oilfield, Yemen. The best values are shown in bold.
Additionally, the prediction results are drawn in Figure 5. As shown from this figure, the proposed AO-ANFIS showed better performance than other methods.
Figure 5. The results of the AO and the compared models for the Masila oilfield.

5.3.2. Results of Tahe Oilfield

The results of the AO-ANFIS and other compared methods for the Tahe oilfield are presented in this section. As shown in Table 3 and Table 4, in terms of RMSE and MAE, the proposed AO-ANFIS outperformed all compared models with the smallest RMSE and MAE values in nine out of ten wells. The PSO obtained the best RMSE and MAE values in one out of ten wells (well No. 10). Moreover, in terms of R 2 , the proposed AO-ANFIS obtained the best performance in eight out of ten wells. In comparison, the PSO obtained the best R 2 value in two out of ten wells (Wells No. 9 and 10), as recorded in Table 5. Additionally, Table 6 shows the results of all compared methods in terms of AIC and BIC. The AO obtained the best AIC and BIC results in seven out of ten oil wells (1–6, and 9). The GA obtained the best AIC and BIC results for wells No. 7 and 10, where for well No. 8, the best results were obtained by PSO.
Table 3. The results of the Tahe oilfield in terms of RMSE. The best values are shown in bold.
Table 4. The results of the Tahe oilfield in terms of MAE. The best values are shown in bold.
Table 5. The results of the Tahe oilfield, China, in terms of R 2 . The best values are shown in bold.
Table 6. The results of the Tahe oilfield, China, in terms of AIC and BIC measures. The best values are shown in bold.
Furthermore, Figure 6 shows the prediction results of the AO-ANFIS against the compared model. As noticed from this figure, AO-ANFIS achieved the nearest values to the target data.
Figure 6. The results of the AO and the compared models for well No. 1., Tahe oilfield.

5.4. Comparison to Other Forecasting Methods

We also compare the proposed AO-ANFIS model to other well-known time series forecasting methods, such as ARIMA and LSTM. Table 7 illustrates the comparisons results using the oil production datasets of the Almasila oilfield, Yemen. The AO-ANFIS obtained the best results in terms of RMSE, MAE, R 2 , and Std, whereas the ARIMA model obtained the best results in terms of AIC and BIC.
Table 7. The results of comparisons with other forecasting methods. The best values are shown in bold.

5.5. Statistical Tests

In this section, we implement a well-known statistical test, the Friedman test, to further evaluate the AO-ANFIS against the compared models.
The Friedman test results are illustrated in Table 8 for the Almasila oilfields data and in Table 9 for the Tahe oilfield data. From the results in the tables, we see that the AO-ANFIS obtained the best results in all datasets, in terms of RMSE, except in one oil well (well No.10), where the PSO-ANFIS recorded the best result in this well dataset.
Table 8. The results of the Friedman test for the Almasila oilfield’s dataset. The best value is shown in bold.
Table 9. The results of the Friedman test for the Tahe oilfield’s dataset using RMSE measure. The best values are shown in bold.
Overall, from all of the evaluation results, the AO-ANFIS method showed its high performance and superiority over all other compared models. Thus, AO-ANFIS can be considered an efficient time series forecasting model, which can be further utilized in other time series forecasting applications.

6. Conclusions

In the current study, we proposed a developed ANFIS model, called AO-ANFIS, for oil production time series forecasting. The Aquila Optimizer (AO) is a recently developed metaheuristic optimization algorithm that showed significant performance in addressing optimization tasks.
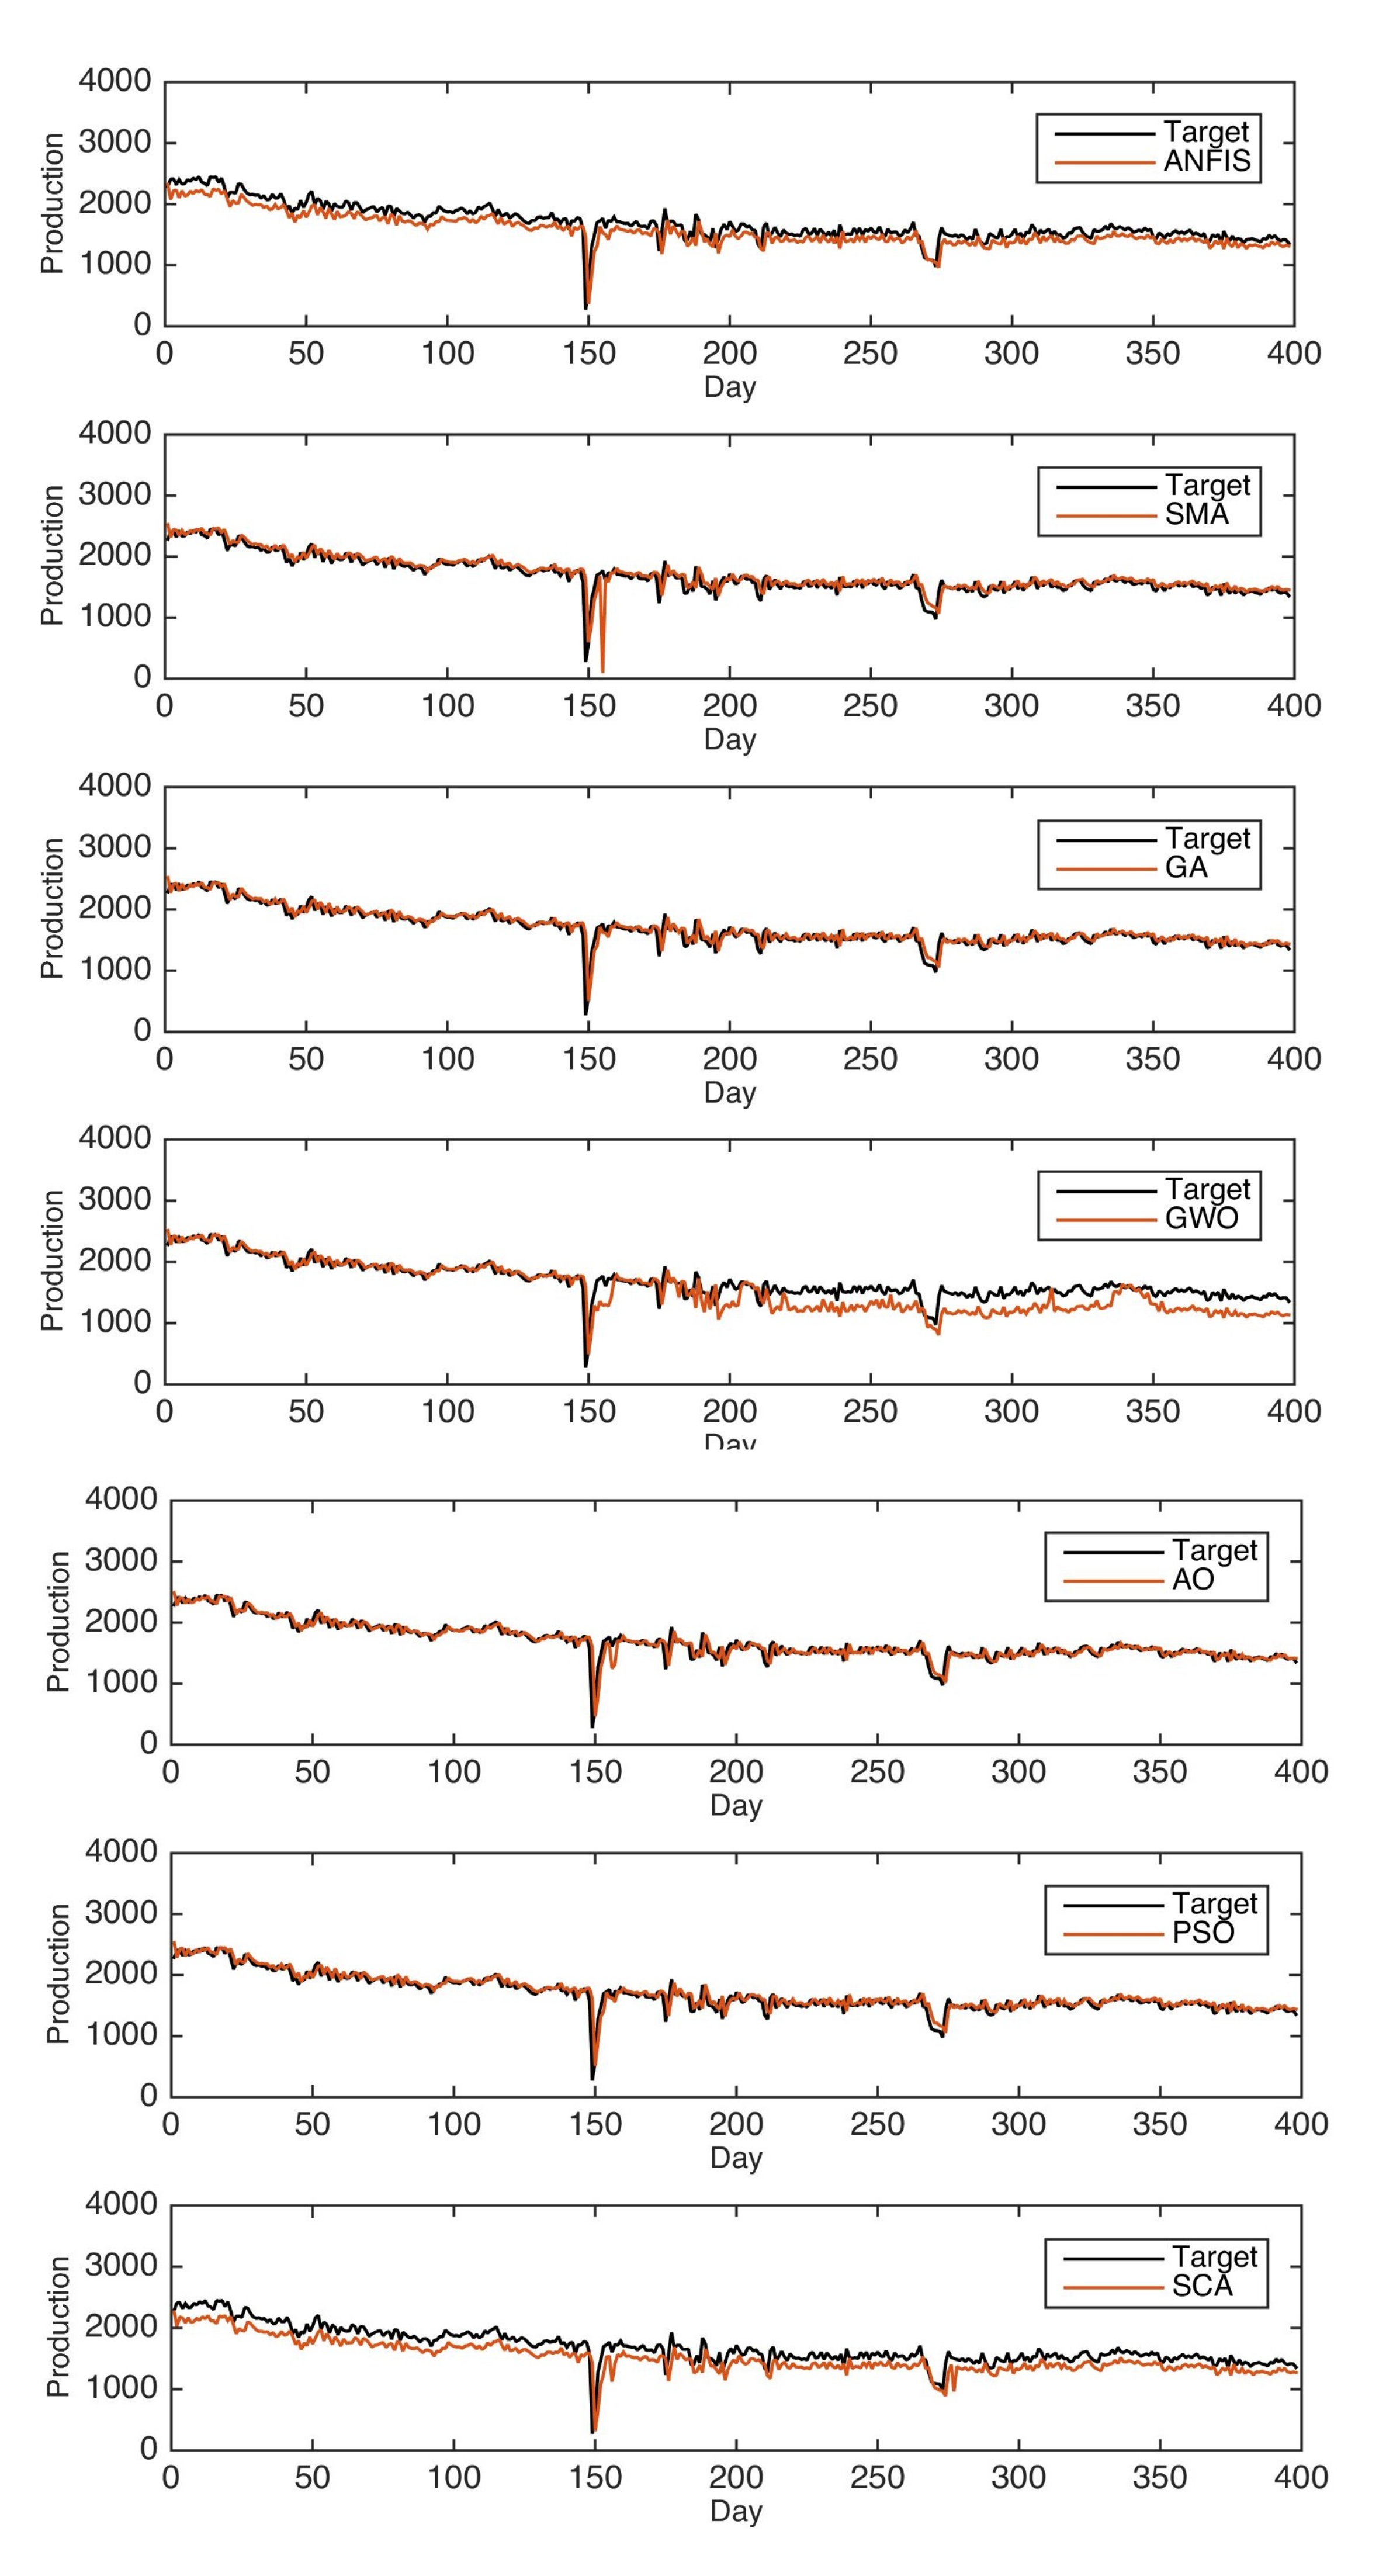
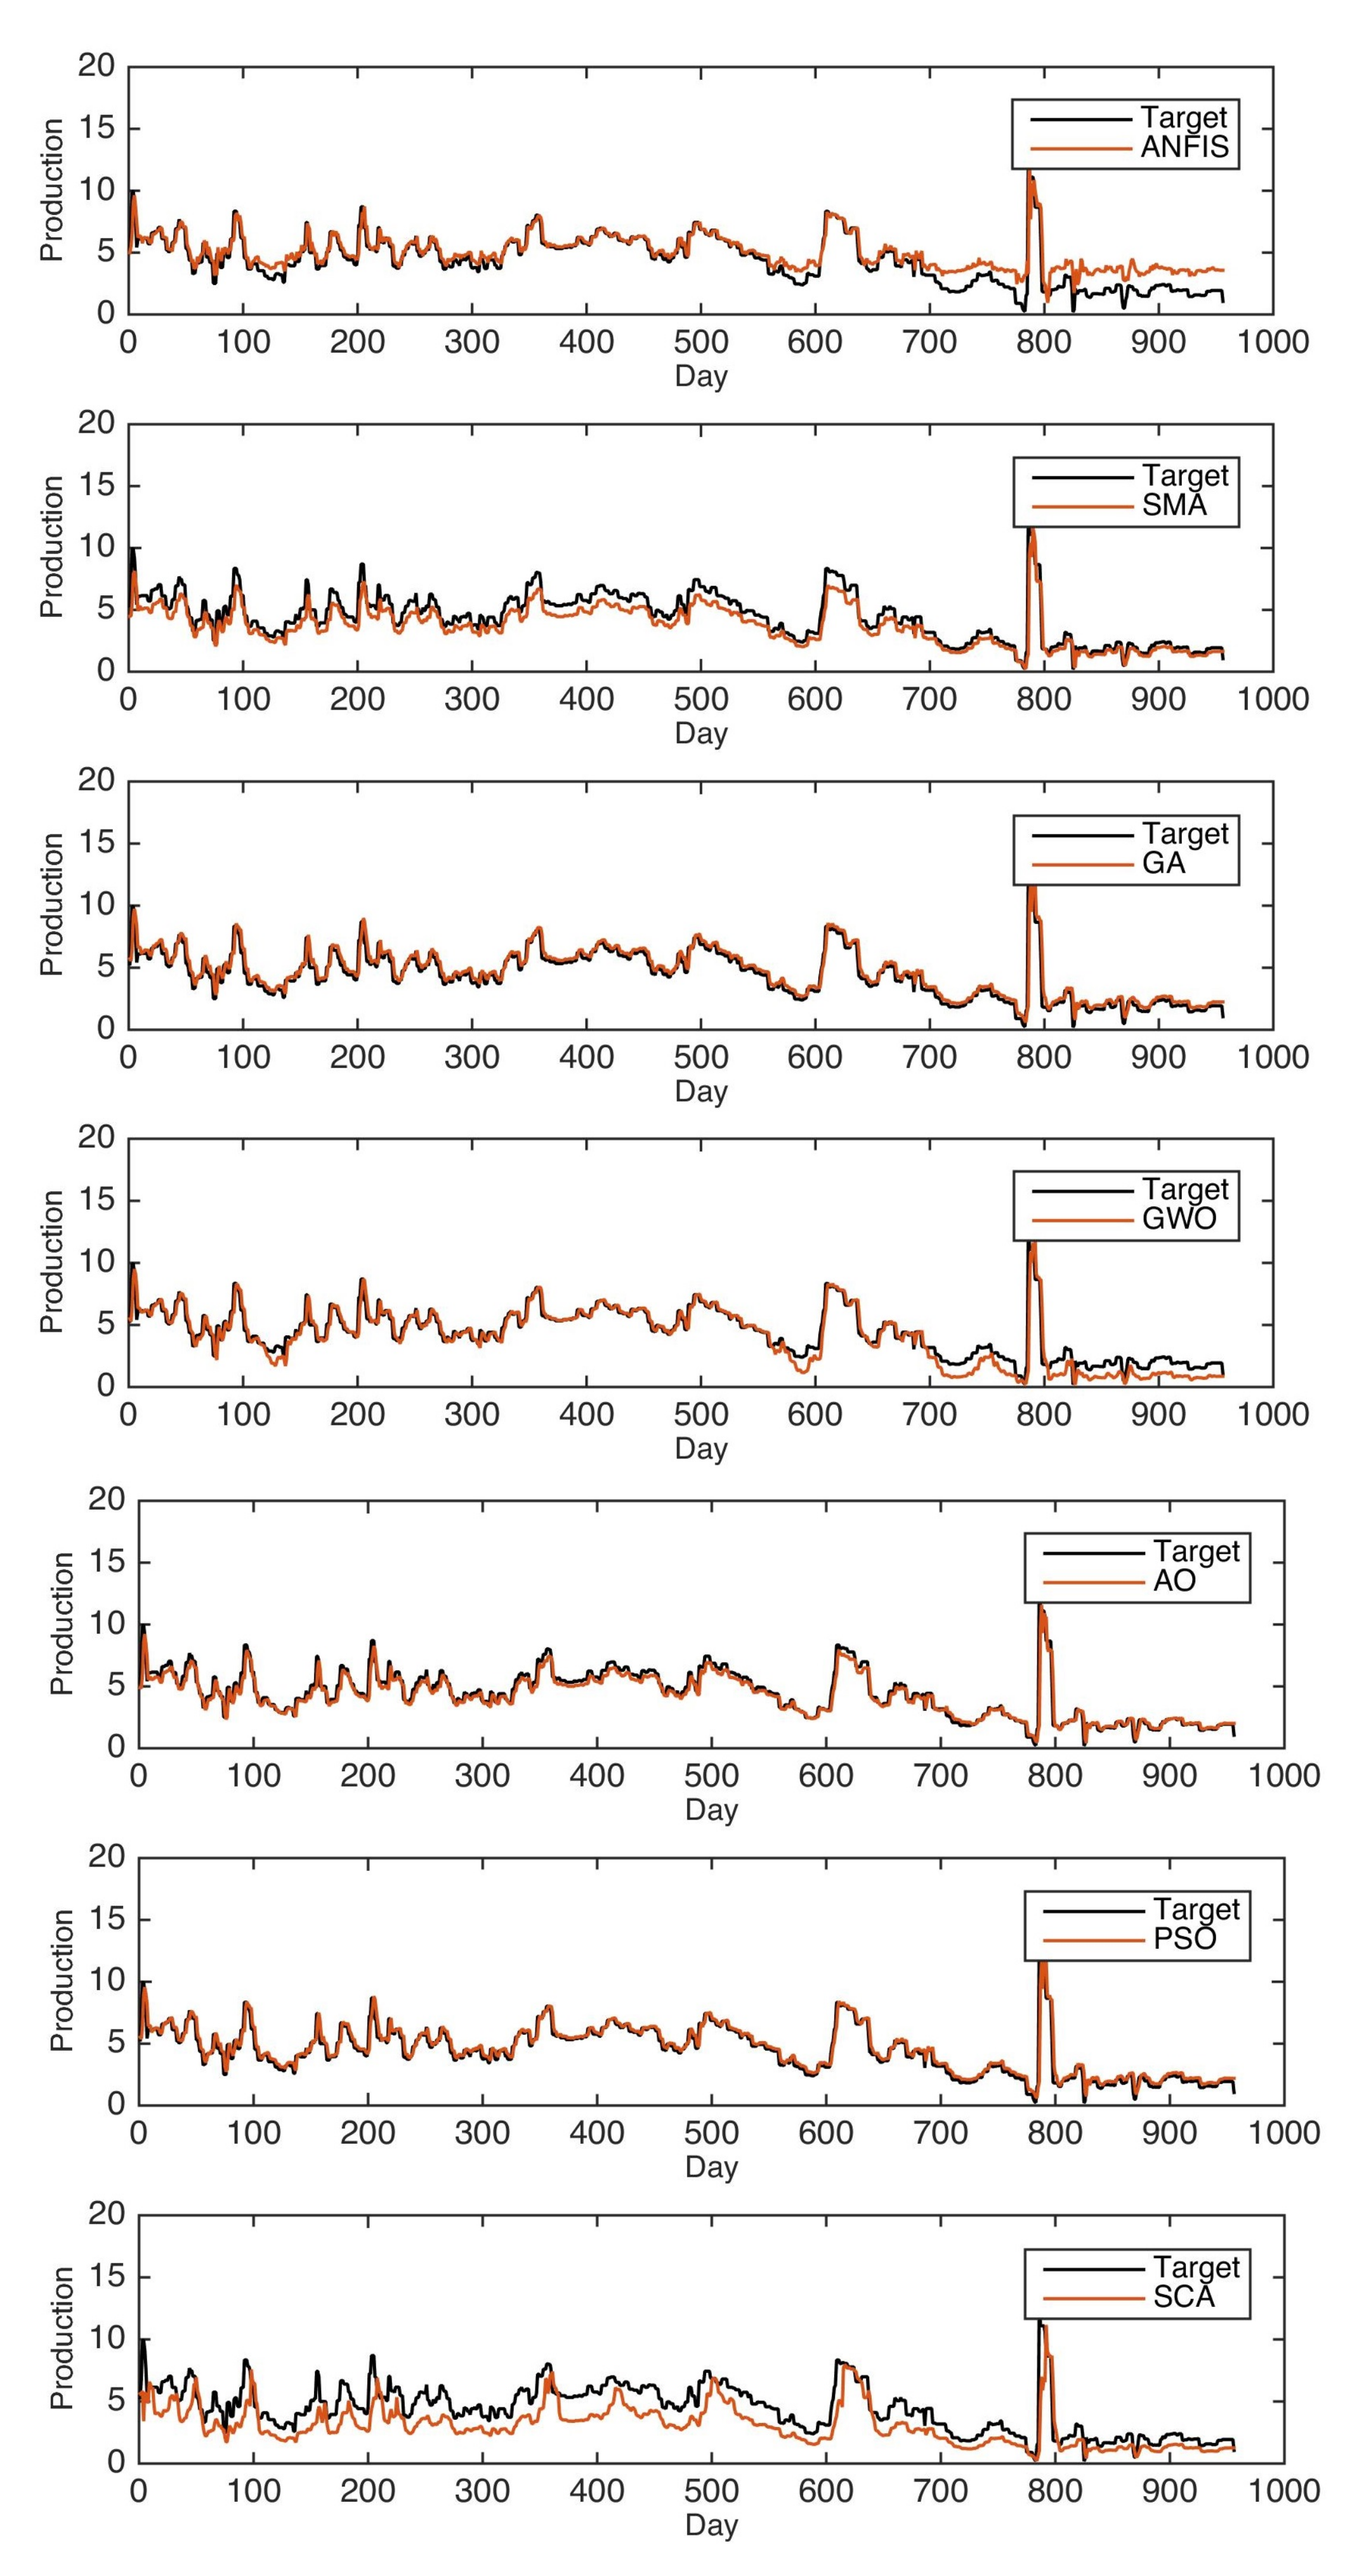
In this study, AO is applied to optimize ANFIS parameters to boost its prediction accuracy. The AO-ANFIS is evaluated with different datasets collected from two oilfields, namely, Tahe oilfields and Almasila oilfields, from China and Yemen, respectively. We also considered extensive experimental comparisons to state-of-art models, including the ANFIS traditional version, in addition to five modified versions of ANFIS using five optimization algorithms, called PSO, SCA, SSA, GWO, and SMA. AO-ANFIS has achieved significant results, and it outperformed the mentioned models in terms of RMSE, MAE, and R 2 .
The current AO-ANFIS model could be further developed to achieve more accurate results in future work. For example, applying a mutation strategy could further enhance the search process of the AO algorithm, which will result in improving ANFIS accuracy.

Author Contributions

Conceptualization, A.M.A. and M.A.A.A.-q.; data curation, A.M.A.; formal analysis, A.A.E. and S.R.; funding acquisition, T.K.; investigation, R.D. and T.K.; methodology, A.M.A., M.A.A.A.-q. and A.A.E.; project administration, M.A.A.A.-q.; resources, A.A.E. and M.A.E.; Software, A.M.A., A.A.E. and M.A.E.; supervision, S.R.; writing—original draft preparation, A.M.A., M.A.A.A.-q., A.A.E. and M.A.E.; writing—review and editing, S.R., R.D. and T.K.; validation, M.A.E., A.A.E. and R.D. All authors have read and agreed to the published version of the manuscript.

Funding

This research received no external funding.

Institutional Review Board Statement

Not applicable.

Data Availability Statement

Available by corresponding author upon request.

Conflicts of Interest

The authors declare no conflict of interest.

References

  1. Fan, D.; Sun, H.; Yao, J.; Zhang, K.; Yan, X.; Sun, Z. Well production forecasting based on ARIMA-LSTM model considering manual operations. Energy 2021, 220, 119708. [Google Scholar] [CrossRef]
  2. Haider, W.H. Estimates of total oil & gas reserves in the world, future of oil and gas companies and smart investments by E & P companies in renewable energy sources for future energy needs. In Proceedings of the International Petroleum Technology Conference, Dhahran, Saudi Arabia, 13–15 January 2020. [Google Scholar]
  3. Ado, M.R.; Greaves, M.; Rigby, S.P. Numerical simulation of the impact of geological heterogeneity on performance and safety of THAI heavy oil production process. J. Pet. Sci. Eng. 2019, 173, 1130–1148. [Google Scholar] [CrossRef]
  4. Yin, S.; Han, C.; Wu, Z.; Li, Q. Developmental characteristics, influencing factors and prediction of fractures for a tight gas sandstone in a gentle structural area of the Ordos Basin, China. J. Nat. Gas Sci. Eng. 2019, 72, 103032. [Google Scholar] [CrossRef]
  5. Mesbah, M.; Vatani, A.; Siavashi, M.; Doranehgard, M.H. Parallel processing of numerical simulation of two-phase flow in fractured reservoirs considering the effect of natural flow barriers using the streamline simulation method. Int. J. Heat Mass Transf. 2019, 131, 574–583. [Google Scholar] [CrossRef]
  6. Zhang, J.; Li, X.; Chen, Z.; Li, Q.; Li, G.; Lv, T. Numerical simulation of the improved gas production from low permeability hydrate reservoirs by using an enlarged highly permeable well wall. J. Pet. Sci. Eng. 2019, 183, 106404. [Google Scholar] [CrossRef]
  7. Nwaobi, U.; Anandarajah, G. Parameter determination for a numerical approach to undeveloped shale gas production estimation: The UK Bowland shale region application. J. Nat. Gas Sci. Eng. 2018, 58, 80–91. [Google Scholar] [CrossRef]
  8. Chen, K.P. Production from a fractured well with finite fracture conductivity in a closed reservoir: An exact analytical solution for pseudosteady-state flow. SPE J. 2016, 21, 550–556. [Google Scholar] [CrossRef]
  9. Ji, J.; Yao, Y.; Huang, S.; Ma, X.; Zhang, S.; Zhang, F. Analytical model for production performance analysis of multi-fractured horizontal well in tight oil reservoirs. J. Pet. Sci. Eng. 2017, 158, 380–397. [Google Scholar] [CrossRef]
  10. Asadi, M.B.; Dejam, M.; Zendehboudi, S. Semi-analytical solution for productivity evaluation of a multi-fractured horizontal well in a bounded dual-porosity reservoir. J. Hydrol. 2020, 581, 124288. [Google Scholar] [CrossRef]
  11. Zhang, H.; Rietz, D.; Cagle, A.; Cocco, M.; Lee, J. Extended exponential decline curve analysis. J. Nat. Gas Sci. Eng. 2016, 36, 402–413. [Google Scholar] [CrossRef]
  12. Wachtmeister, H.; Lund, L.; Aleklett, K.; Höök, M. Production decline curves of tight oil wells in eagle ford shale. Nat. Resour. Res. 2017, 26, 365–377. [Google Scholar] [CrossRef] [Green Version]
  13. Yamada, T. Non-uniqueness of history matching. In Proceedings of the SPE Asia Pacific Conference on Integrated Modelling for Asset Management 2000, Yokohama, Japan, 25–26 April 2000. [Google Scholar]
  14. Hutahaean, J.; Demyanow, V.; Christie, M.A. Impact of model parameterisation and objective choices on assisted history matching and reservoir forecasting. In Proceedings of the SPE/IATMI Asia Pacific Oil & Gas Conference and Exhibition, Bali, Indonesia, 20–22 October 2015. [Google Scholar]
  15. Hutahaean, J.; Demyanov, V.; Christie, M.A. On optimal selection of objective grouping for multiobjective history matching. SPE J. 2017, 22, 1–296. [Google Scholar] [CrossRef]
  16. Hutahaean, J.; Demyanov, V.; Christie, M. Many-objective optimization algorithm applied to history matching. In Proceedings of the 2016 IEEE Symposium Series on Computational Intelligence (SSCI), Athens, Greece, 6–9 December 2016; pp. 1–8. [Google Scholar]
  17. Tavassoli, Z.; Carter, J.N.; King, P.R. An analysis of history matching errors. Comput. Geosci. 2005, 9, 99–123. [Google Scholar] [CrossRef]
  18. Cancelliere, M.; Verga, F.; Viberti, D. Benefits and limitations of assisted history matching. In Proceedings of the SPE Offshore Europe Oil and Gas Conference and Exhibition, Aberdeen, UK, 6–8 September 2011. [Google Scholar]
  19. Alkinani, H.H.; Al-Hameedi, A.T.T.; Dunn-Norman, S.; Flori, R.E.; Alsaba, M.T.; Amer, A.S. Applications of artificial neural networks in the petroleum industry: A review. In Proceedings of the SPE Middle East Oil and Gas Show and Conference, Manama, Bahrain, 18–21 March 2019. [Google Scholar]
  20. Liu, W.; Liu, W.D.; Gu, J. Forecasting oil production using ensemble empirical model decomposition based Long Short-Term Memory neural network. J. Pet. Sci. Eng. 2020, 189, 107013. [Google Scholar] [CrossRef]
  21. Song, X.; Liu, Y.; Xue, L.; Wang, J.; Zhang, J.; Wang, J.; Jiang, L.; Cheng, Z. Time-series well performance prediction based on Long Short-Term Memory (LSTM) neural network model. J. Pet. Sci. Eng. 2020, 186, 106682. [Google Scholar] [CrossRef]
  22. Gharbi, R.B.; Elsharkawy, A.M.; Karkoub, M. Universal neural-network-based model for estimating the PVT properties of crude oil systems. Energy Fuels 1999, 13, 454–458. [Google Scholar] [CrossRef]
  23. El-Sebakhy, E.A. Forecasting PVT properties of crude oil systems based on support vector machines modeling scheme. J. Pet. Sci. Eng. 2009, 64, 25–34. [Google Scholar] [CrossRef]
  24. Ahmadi, M.A.; Bahadori, A. A LSSVM approach for determining well placement and conning phenomena in horizontal wells. Fuel 2015, 153, 276–283. [Google Scholar] [CrossRef]
  25. Nwachukwu, A.; Jeong, H.; Pyrcz, M.; Lake, L.W. Fast evaluation of well placements in heterogeneous reservoir models using machine learning. J. Pet. Sci. Eng. 2018, 163, 463–475. [Google Scholar] [CrossRef]
  26. Erofeev, A.; Orlov, D.; Ryzhov, A.; Koroteev, D. Prediction of porosity and permeability alteration based on machine learning algorithms. Transp. Porous Media 2019, 128, 677–700. [Google Scholar] [CrossRef] [Green Version]
  27. Ahmadi, M.A.; Chen, Z. Comparison of machine learning methods for estimating permeability and porosity of oil reservoirs via petro-physical logs. Petroleum 2019, 5, 271–284. [Google Scholar] [CrossRef]
  28. Capizzi, G.; Sciuto, G.L.; Woźniak, M.; Damaševičius, R. A Clustering Based System for Automated Oil Spill Detection by Satellite Remote Sensing. In Lecture Notes in Computer Science (Including Subseries Lecture Notes in Artificial Intelligence and Lecture Notes in Bioinformatics); Springer: Cham, Switzerland, 2016; pp. 613–623. [Google Scholar]
  29. Sagheer, A.; Kotb, M. Time series forecasting of petroleum production using deep LSTM recurrent networks. Neurocomputing 2019, 323, 203–213. [Google Scholar] [CrossRef]
  30. Alalimi, A.; Pan, L.; Al-qaness, M.A.; Ewees, A.A.; Wang, X.; Abd Elaziz, M. Optimized Random Vector Functional Link network to predict oil production from Tahe oil field in China. Oil Gas Sci. Technol. Rev. d’IFP Energies Nouv. 2021, 76, 3. [Google Scholar] [CrossRef]
  31. Al-Qaness, M.A.; Abd Elaziz, M.; Ewees, A.A. Oil consumption forecasting using optimized adaptive neuro-fuzzy inference system based on sine cosine algorithm. IEEE Access 2018, 6, 68394–68402. [Google Scholar] [CrossRef]
  32. Al-qaness, M.A.; Abd Elaziz, M.; Ewees, A.A.; Cui, X. A Modified Adaptive Neuro-Fuzzy Inference System Using Multi-Verse Optimizer Algorithm for Oil Consumption Forecasting. Electronics 2019, 8, 1071. [Google Scholar] [CrossRef] [Green Version]
  33. Al-Qaness, M.A.; Ewees, A.A.; Fan, H.; Abualigah, L.; Abd Elaziz, M. Marine Predators Algorithm for Forecasting Confirmed Cases of COVID-19 in Italy, USA, Iran and Korea. Int. J. Environ. Res. Public Health 2020, 17, 3520. [Google Scholar] [CrossRef]
  34. Abualigah, L.; Yousri, D.; Abd Elaziz, M.; Ewees, A.A.; Al-qanes, M.; Gandomi, A.H. Aquila Optimizer: A novel meta-heuristic optimization Algorithm. Comput. Indus. Eng. 2021. [Google Scholar] [CrossRef]
  35. Makhadmeh, S.N.; Al-Betar, M.A.; Alyasseri, Z.A.A.; Abasi, A.K.; Khader, A.T.; Damaševičius, R.; Mohammed, M.A.; Abdulkareem, K.H. Smart home battery for the multi-objective power scheduling problem in a smart home using grey wolf optimizer. Electronics 2021, 10, 447. [Google Scholar] [CrossRef]
  36. Jouhari, H.; Lei, D.; Al-qaness, M.A.A.; Abd Elaziz, M.; Damaševičius, R.; Korytkowski, M.; Ewees, A.A. Modified Harris Hawks optimizer for solving machine scheduling problems. Symmetry 2020, 12, 1460. [Google Scholar] [CrossRef]
  37. Połap, D.; Woźniak, M. Red fox optimization algorithm. Expert Syst. Appl. 2021, 166, 114107. [Google Scholar] [CrossRef]
  38. Abdullayeva, F.; Imamverdiyev, Y. Development of Oil Production Forecasting Method based on Deep Learning. Stat. Optim. Inf. Comput. 2019, 7, 826–839. [Google Scholar] [CrossRef] [Green Version]
  39. Calvette, T.; Gurwicz, A.; Abreu, A.C.; Cavalcanti Pacheco, M.A. Forecasting smart well production via deep learning and data driven optimization. In Proceedings of the Offshore Technology Conference Brasil, Rio de Janeiro, Brazil, 29–31 October 2019. [Google Scholar]
  40. Wang, Q.; Song, X.; Li, R. A novel hybridization of nonlinear grey model and linear ARIMA residual correction for forecasting US shale oil production. Energy 2018, 165, 1320–1331. [Google Scholar] [CrossRef]
  41. Heghedus, C.; Shchipanov, A.; Rong, C. Advancing Deep Learning to Improve Upstream Petroleum Monitoring. IEEE Access 2019, 7, 106248–106259. [Google Scholar] [CrossRef]
  42. Zhong, Z.; Sun, A.Y.; Ren, B.; Wang, Y. A Deep-Learning-Based Approach for Reservoir Production Forecast under Uncertainty. SPE J. 2021, 26, 1314–1340. [Google Scholar] [CrossRef]
  43. Wang, L.; Shao, M.; Kou, G.; Wang, M.; Zhang, R.; Wei, Z.; Sun, X. Time Series Analysis of Production Decline in Carbonate Reservoirs with Machine Learning. Geofluids 2021, 2021, 6638135. [Google Scholar]
  44. Yan, M.; MacDonald, J.C.; Reaume, C.T.; Cobb, W.; Toth, T.; Karthigan, S.S. Machine Learning and the Internet of Things Enable Steam Flood Optimization for Improved Oil Production. arXiv 2019, arXiv:1908.11319. [Google Scholar]
  45. Singh, H.; Seol, Y.; Myshakin, E.M. Prediction of gas hydrate saturation using machine learning and optimal set of well-logs. Comput. Geosci. 2021, 25, 267–283. [Google Scholar] [CrossRef]
  46. Zanjani, M.S.; Salam, M.A.; Kandara, O. Data-Driven Hydrocarbon Production Forecasting Using Machine Learning Techniques. Int. J. Comput. Sci. Inf. Secur. 2020, 18, 65–72. [Google Scholar]
  47. Liu, W.; Liu, W.D.; Gu, J. Petroleum Production Forecasting Based on Machine Learning. In Proceedings of the 2019 3rd International Conference on Advances in Image Processing, Chengdu, China, 8–10 November 2019; pp. 124–128. [Google Scholar]
  48. Jang, J.S. ANFIS: Adaptive-network-based fuzzy inference system. IEEE Trans. Syst. Man Cybern. 1993, 23, 665–685. [Google Scholar] [CrossRef]
  49. Hakimi, M.H.; Al Qadasi, B.A.; Al Sharrabi, Y.; Al Sorore, O.T.; Al Samet, N.G. Petrophysical properties of Cretaceous clastic rocks (Qishn Formation) in the Sharyoof oilfield, onshore Masila Basin, Yemen. Egypt. J. Pet. 2017, 26, 439–455. [Google Scholar] [CrossRef] [Green Version]
  50. Al-Areeq, N.M.; Maky, A.F. Organic geochemical characteristics of crude oils and oil-source rock correlation in the Sunah oilfield, Masila Region, Eastern Yemen. Mar. Pet. Geol. 2015, 63, 17–27. [Google Scholar] [CrossRef]
  51. Qin, S.; Zhao, J.; Li, M. A case study: Geochemical tracing indices on the migration of water-soluble gases in Hetianhe gas field, Tarim Basin. Earth Sci. Front. 2006, 13, 524. [Google Scholar]
  52. Wu, J.; Fan, T.; Gao, Z.; Gu, Y.; Wang, J.; Du, Y.; Li, C.; Wang, S.; Zhang, C.; Meng, M.; et al. Identification and characteristic analysis of carbonate cap rock: A case study from the Lower-Middle Ordovician Yingshan Formation in Tahe oilfield, Tarim Basin, China. J. Pet. Sci. Eng. 2018, 164, 362–381. [Google Scholar] [CrossRef]
Publisher’s Note: MDPI stays neutral with regard to jurisdictional claims in published maps and institutional affiliations.

Article Metrics

Citations

Article Access Statistics

Multiple requests from the same IP address are counted as one view.