Abstract
Taylor flow is a strategy-aimed flow to transfer conventional single-phase into a more efficient two-phase flow resulting in an enhanced momentum/heat/mass transfer rate, as well as a multitude of other advantages. To date, Taylor flow has focused on the processes involving gas–liquid and liquid–liquid two-phase systems in microchannels over a wide range of applications in biomedical, pharmaceutical, industrial, and commercial sectors. Appropriately micro-structured design is, therefore, a key consideration for equipment dealing with transport phenomena. This review paper highlights the hydrodynamic aspects of gas–liquid and liquid–liquid two-phase flows in microchannels. It covers state-of-the-art experimental and numerical methods in the literature for analyzing and simulating slug flows in circular and non-circular microchannels. The review’s main objective is to identify the considerable opportunity for further development of microflows and provide suggestions for researchers in the field. Available correlations proposed for the transition of flow patterns are presented. A review of the literature of flow regime, slug length, and pressure drop is also carried out.
1. Introduction
Multiphase flow in micro-sized structures refers to a microflow in which two or more distinct phases are recognizable, i.e., a carrying or continuous phase and one or more dispersed phases. A two-phase flow denotes a combination of two distinct phases, including gas, liquid, and solid particles. Gas–liquid (GL) and liquid–liquid (LL) are two common types of multiphase flows in microchannels encountered in various practical applications, such as biomedical, pharmacological, engineering, and commercial purposes. Immiscible LL two-phase flows can also be observed in many industrial applications, where the dispersive liquid flow is introduced as droplets into the carrying liquid flow. Intensified liquid–liquid extraction as a separation process is another application for two-phase flow in oil and gas industries. The gas bubbles with equivalent diameters of the microchannel diameter in a GL Taylor flow are surrounded by a thin liquid film of the continuous flow and separated by the liquid slugs [1]. The interaction between the different phases, flow rates, thermophysical properties, and geometrical details of the channel characterizes the flow pattern, liquid film thickness, gas bubble or droplet shape, pressure drop, heat, and mass transfer rates. Knowledge of two-phase flow characteristics enables researchers and designers to optimize channel size and operating conditions. Minimizing the pressure drop can reduce corrosion and erosion while providing a high heat transfer rate [1,2]. An essential feature of Taylor flow is the flow pattern in the liquid slug, which can also be classified in recirculation flow and bypass flow [2,3]. Therefore, knowledge of hydrodynamic properties of Taylor flow is certainly required to understand transport phenomena characteristics for improving the performance of microchannels and enabling operational conditions to be optimized.
A review on the hydrodynamic characteristics of Taylor flow was conducted by Angeli and Gavriilidis [1] for circular and non-circular small channels. Correlations for film thickness measurements were summarized and the key effects of Capillary number (Ca) on film thickness were discussed in detail. Recently, Etminan et al. [4] presented all of the correlations proposed for film thickness measuring in the literature. They found the best-fitted correlation between some experimental data and a wide range of Ca. It can be concluded that there is still a lack of certainties for the gradient of surface tension at the interfacial region resulting in discrepancies between experimental predictions and numerical/theoretical findings. Moreover, more attempts should be devoted to finding specific flow and operational conditions for enhancing the performance of microchannels.
For multiphase flows, it is necessary to predict the transport phenomena in terms of flow parameters, i.e., superficial flow velocity components, slug length, liquid film thickness, and the flow rates of each phase. Multiphase flow is valid as long as the separation between phases is recognizable at a scale greater than the molecular level. The ability to describe the behavior of multiphase flow requires a set of basic definitions and assumptions. The following subsections have been designed to represent the importance of these basic definitions and the role of dimensionless groups in describing the two-phase flows’ behavior. This paper is aimed to review two-phase flows in microchannels, with a particular focus on the hydrodynamic aspects. Fundamentals of multiphase flows, such as basic definitions and dimensionless parameters are studied. Identification of flow pattern and bubble/droplet formation are discussed in experimental investigations, numerical simulations, and flow regime transitions. Correlations of slug lengths and pressure drop are presented and classified in terms of cross-sectional areas of microchannels.
2. Basic Definitions in Two-Phase Flows
The capillary length has been used to identify the compaction in micro-sized applications, such as microchannels in heat exchangers. A micro-sized channel can be adequately assumed when the hydraulic diameter of the channel is less than the capillary length. In contrast, for large-diameter channels, the Laplace number (La) can be properly considered as a suitable length scale for calculations instead of the bubble or droplet diameter. Many other definitions have been developed to describe the characteristics of multiphase flows, including fluid flow, and heat and mass transfers, which are presented in Table 1. It should be noted that due to the presence of more than one phase and the interaction between all phases involved in multiphase flow, the thermophysical properties have been expressed differently compared to those of a single-phase flow [3,4,5].

Table 1.
Important definitions for multiphase flows.
3. Dimensionless Parameters
A dimensionless number can represent the ratio of two different forces or physical quantities, which play a significant role in the flow pattern and interaction between phases (see Table 2). The length scale of a channel, which appears for the majority of dimensionless numbers, is often defined as the diameter of tubes or the hydraulic diameter of ducts.
Table 2.
Some of the most common non-dimensional numbers in multiphase flow.
The relation of gravitational to viscous forces is Archimedes number (Ar) that the formal definition is given in Table 2. This number frequently appears in tube-shaped chemical process reactor designs, which describe the motion of fluids caused by the difference in densities. The Ar was linked to the Reynolds number (Re) as an explicit-iterative correlation [6]:
Hua et al. [7] found that ellipsoidal gas bubbles were produced as the Ar and Bond (Bo) numbers were gradually increased. In solid particle multiphase flows, the Ar has also been related to the drag force coefficient and the Re [8,9,10] and the wind threshold velocities of particles in GL flow [11]. The Ar number was also correlated with the inverse viscosity number (N) by Quan [12] in an upward or downward co-current Taylor flow,
For a large N, the elongated tail of the bubbles oscillated for upward flow, and the shortened tail was only observed for downward flow.
The Bond number (Bo), also called Eötvös number (Eo), is the inverse of the Ar number and denotes the ratio between the gravitational and capillary effects. Since the Bond number varies with the square of length–scale, each change, even small, in channel diameter causes significant variation in the Bo. For air–water two-phase flow in channels of a diameter less than 1 mm, which are very common in micro-sized applications, the Bo number is approximately in the order of 0.1 and the importance of viscous effects is predominant. Therefore, the gravitational effects can be negligible in most GL flows in microchannels. Hua et al. [7] and Uno and Kintner [13] showed that the gas bubble velocity was significantly impacted by the wall effects for high Bond numbers. They showed that bubble shape was significantly affected by the Bo number: elongated bubbles with spherical caps at both ends appeared for . Some other specific regions of Bo and numbers have been proposed by investigators to categorize the behavior of multiphase flows, for example, dominant surface tension for , non-negligible inertia, surface tension, and viscous effects for , and negligible surface tension effects for [14,15,16,17]. The absorption of CO2 in micro-scale reactors where the Chisholm parameter was correlated with the Bo number was studied by Ganapathy et al. [18]. Prajapati and Bhandari [19] quantified the instability increase of boiling flow in a microchannel for the region of .
The Cahn number (Cn) is defined as the ratio of the interface width (ξ) and the tube diameter or any other length scale (d),
Cahn and Hilliard [20,21] and Cahn [22] focused their studies on the free energy of the volume of an isotropic system, where the densities of components involved are non-uniform. The concept of the Cahn number was introduced by them when they found an increase in the thickness with temperature. Soon after, the efforts to obtain the governing equation in a non-equilibrium situation led to a well-known Cahn–Hilliard equation involving the Cahn number for the first time [23,24,25,26]. For example, Choi and Anderson [27] coupled the Cahn–Hilliard theory with the Extended Finite Volume Method (XFVM) for the dynamic modeling of suspended particles in two-phase flows.
The importance of viscous and capillary effects in two-phase flow in microchannels has been correlated by the capillary number based on the liquid slug velocity,
The capillary number is a dimensionless group to explain how viscous and surface tension forces affect the interface between the gas and liquid phases, and also between two immiscible liquids. Although, the length-scale does not appear in the capillary number, surface tension forces become more significant relative to gravity as the cross-sectional area of the channel is decreased. For most microflow applications, the approximate values of superficial velocity range from 10 μms−1 to 1 ms−1, when the viscosity is 10−3 kg m−1 s−1, and the surface tension can be reasonably considered at 0.05 N m−1. These flow conditions cause the Ca to range from 2 × 10⁻⁷ to 2 × 10⁻². For high viscosity liquids, such as silicone oil at a mixture velocity of 1 ms−1, the Ca becomes ~1. The Ca frequently appears in correlations measuring liquid film thickness [28,29,30,31,32,33,34,35,36,37,38,39,40,41,42,43,44,45,46,47,48,49,50,51,52], pressure drop [30,35,44,48,53,54,55,56,57], and slug length [58,59,60,61] in multiphase flows. Recently, the poor accuracy of classical pressure drop correlations with an increase of the Ca was emphasized by Ni et al. [51]. This was due to the presence of waves around the tail of the bubble, change of the semi-spherical head of the bubble, and powerful circulation inside the liquid slugs. Patel et al. [52] indicated that the film thickness at the corner of a square microchannel decreased with an increase of Ca, where a linear expression was derived for the film thickness in terms of Ca. Several other researchers showed an increasing trend in film thickness with Ca. These hydrodynamic features will be discussed in the following sections.
The Re expresses the ratio of inertial to viscous effects and predicts the flow pattern in different situations:
where ρ, μ, and U are the density, dynamic viscosity of the continuous phase fluid, and the velocity of flow, respectively. The thermophysical properties of a multiphase flow are different from a single-phase flow, which has been discussed by Awad [5] in detail. Regarding the value of the inertia forces, the flow regime remained laminar for the Re numbers less than ~2300 [62,63]. Since the cross-sectional area of a microchannel often has a diameter of 1 mm or smaller and the liquid velocity is less than 1 m s−1, the Re for water as the continuous phase is ~1000 or less. This means that the flow regime in the microchannel applications is normally laminar and the predominant effects of the viscous forces must be taken into account. Because more than one phase is involved, different approaches have been used by researchers to determine the value of Re and the thermophysical properties in the multiphase flows. To realize the importance of the Re definition, consider two following cases: first, the inertia effects of the gas phase are insignificant, when the gas and the liquid superficial velocities are in the same order. For instance, the air to water density ratio in two-phase flow is around , which indicates the dominant role of the liquid phase density in defining the Re. This situation can be recognized in a bubbly flow pattern. Second, the inertia effects of both phases are important when the gas superficial velocity is relatively high compared with the liquid superficial velocity. The friction factor is necessarily calculated for the pressure drop calculation, while the Re appears in other correlations of hydrodynamic concepts, see Section 6 for further information. The Re is in the correlations for liquid film thickness and pressure drop obtained by Heiszwolf et al. [39] and Han and Shikazono [46]. The product of the Re and the We numbers was introduced as a transition criterion from slug to slug-bubbly regimes by Suo and Griffith [64]. Jayawardena et al. [65] proposed the ratio of liquid phase to gas phase the Re numbers to identify the transitions from bubbly to slug and from slug to annular patterns. Several other non-dimensional numbers in multiphase flows have been gathered and discussed by Awad [5].
As the diameter of the channel and the velocity of flow decrease, the inertial, and gravitational effects become negligible, while the surface tension becomes a predominant factor. The knowledge of the hydrodynamics of multiphase flow is strictly intertwined with the dimensionless numbers presented in Table 3. According to this table, an accurate description of the flow map, bubble or droplet formation, and transition from one flow regime to another are highly depended on Bo or Eo, Ca, Re, We, Su, and Fr. While, Bo, Ca, and Re have appeared in the pressure drop correlations so far, the friction factor is only governed by the Re. The liquid film thickness has been correlated or described with Re, Ca, and We numbers. Finally, the slug length has only included the Re and the Ca numbers.
Table 3.
Dependency of hydrodynamic aspects and the dimensionless numbers.
A graphical flow map, which displays the specific region for each flow regime along with their transition lines, uses a few important characteristics of multiphase flow, such as superficial velocity, Re, Ca, and We. Table 4 summarizes the non-dimensional numbers and other flow parameters that use the x- and y-axis coordinates for quantitative-based flow map diagrams.
Table 4.
Some non-dimensional numbers and thermophysical properties selected by authors for displaying flow maps.
As a guide to reading this table; the kinetic energy of flow (ρV2) was used by the author’s group of 7 which its row and column are colored red. The first effort to display a flow pattern diagram dates back to 1953 when Baker [84] computed the mass velocity of each phase and two other expressions involving the viscosity and densities (G/λ and Bλψ/G) of both phases (see ‘5’ in Table 4). These dimensional terms were not chosen by others afterward. In contrast, it is the interfacial velocities of the phases that have frequently been selected by scholars for more than half a century (see ‘1’ in Table 4). After velocity, it seems that Re, We, and Ca numbers have the highest use by researchers for showing the flow pattern clearly and more understandably.
4. Identification of Flow Patterns and Bubble/Slug Formation
The first step of transport phenomena analysis of multiphase flows is to explain the flow characteristics in a phase-mapped diagram. The transition lines in such maps specify the criterion of a transition from one flow regime to another. A two-phase flow usually consists of a train of dispersed bubbles or droplets carried by a continuous phase, which potentially enhances the rates of heat and mass transfers in industrial applications. Although the flow patterns in microchannels and large-diameter channels show similarities, there are several differences. As the channel diameter increases, the laminar flow regime starts to be unstable due to the inertial effects. Kawaji and Chung [71] and Akbar et al. [70,87] indicated flow patterns in micro and minichannels, where the stratified flow regime was not present for larger channels. The effects of increasing the Reynolds number on the bubble profile were numerically and experimentally discussed by Kreutzer et al. [88]. Their results indicated a more elongated nose and flattened tail due to the lack of large enough interfacial forces to keep the hemispherical shape of the bubble caps as Reynolds number increased.
Figure 1 presents a schematic of GL flow patterns in capillaries. The geometrical details of the channel, configuration of the channel, properties of phases, superficial velocities of phases, and types of junctions are the predominant factors to determine flow patterns in microchannels. The wetting or drainage effects of each phase are responsible for at least part of the flow maps in multiphase flows. In a bubbly flow regime, the individual bubbles move through the continuous liquid phase at very low liquid superficial velocities. When the bubble size is small, the interaction between bubbles is negligible. Conversely, increasing the gas-to-liquid volumetric flow rate causes the bubbles to coalesce and a breakup occurs (Figure 1). Bubble coalescence becomes stronger as the gas-to-liquid volumetric flow rate is increased, to make large long bubbles with a rounded front that spans the cross-sectional area of the channel. Characteristics of the bullet-shaped bubbles most often called Taylor or slug flow in which the Taylor bubbles are surrounded by a thin layer of the carrier liquid phase, Figure 1. Some small dispersed bubbles are between the Taylor bubbles as the gas-to-liquid volumetric flow rate is enhanced to make a transition from slug to churn patterns (Figure 1e). In a churn flow pattern, neither dispersed nor carrier phases are continuous and irregular plugs of gas flow through the liquid phase and a wide variety of bubble lengths can be observed. This chaotic flow pattern occurs when the velocity is increased (Figure 1f). In large-diameter tubes, an oscillating chaotic flow is much more remarkable than that in small-diameter tubes. This flow regime is also named a semi-annular or unstable-slug flow pattern. In an annular flow pattern, a very thin thickness of the liquid phase remains on the walls of the channel for two flow conditions: the gas-to-liquid volumetric flow rate increases and the velocities of phases rise at low liquid volume fraction (Figure 1g). While very small-diameter droplets of the liquid phase are in the core of the gas phase, the flow pattern is mist (Figure 1h).
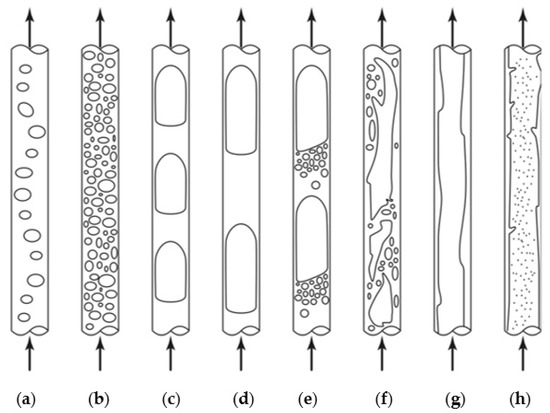
Figure 1.
The schematic of observed flow regimes in the vertical microchannels; (a,b) bubbly flow, (c,d) Taylor or segmented flow, (e) transitional flow from slug to churn, (f) churn flow, (g) annular-film flow, (h) mist-annular or wispy-annular flow [44]. Reproduced by permission from Kreutzer, M.T.; Kapteijn, F.; Moulijn, J.A.; Heiszwolf, J.J., Chemical Engineering Science; published by Elsevier, 2005.
An experimental study of a hydrophobic ionic/water two-phase flow in two T and Y inlet junctions on the flow patterns was carried out by Tsaoulidis et al. [89], resulting in a negligible impact of the inlet configuration. They also investigated the effects of capillaries’ materials made of glass, Fluorinated Ethylene Propylene (FEP), and Tefzel on flow patterns illustrated in Figure 2. Although the boundaries of the FEP and Tefzel are similar, the plug flow regime occupies a larger area in the flow map compared to the FEP capillary, and an annular pattern is observed in higher mixture velocities and lower ionic volume fraction. They did not observe annular and drop patterns in the glass capillary when the continuous phase was water.
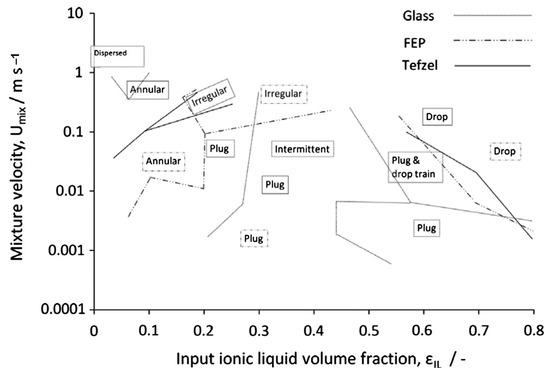
Figure 2.
Flow map boundaries observed in three different glass, FEP, and Tefzel microchannels with a T-junction [89]. Reproduced by permission from Tsaoulidis, D.; Dore, V.; Angeli, P.; Plechkova, N.V.; Seddon, K.R., International Journal of Multiphase Flow; published by Elsevier, 2013.
4.1. Experimental Investigations
Transport phenomena for multiphase flows in capillary passages involve the behavior of each phase individually, the mutual interactions of phases, and the interactions between phases and solid boundaries. The presence of gas bubbles in a multiphase flow can be considered as an obstacle to the liquid phase flow, which is known as the Jamin effect [90]. This phenomenon is prominent enough to decrease the productions of the petroleum industry due to the high-pressure drop and the flow pattern transition. At the interface between two components of a GL two-phase flow, the surface tension gradient is substantial, which affects the interaction between phases and other transport phenomena. Historically, this effect is known as the Marangoni effect, which pushes the liquid phase to flow away from low surface tension regions and was first explained by Gibbs [91].
A comprehensive experimental study on the flow maps by means of high-speed X-ray photography and flash methods simultaneously was reported by Hewitt and Roberts [66], which recognized the previous correlations for each flow pattern proposed by Baker [84] and Wallis [92]. A rough sketch of streamlines in the slug region of a GL flow was experimentally obtained by Taylor [31], where a stagnation point on the vortex and a stagnation ring on the curvature of the bubble were observed for two extreme cases of velocity fraction, (Vg − Vm)/Vg, greater and less than 0.5. The high-speed photography was compared with X-ray technology to provide clear images of air–water flow regimes through a capillary [66]. Irandoust and Andersson [34] experimentally depicted Taylor’s bubble profile, where the film thickness remained constant in the middle of the gas bubble. They also confirmed that the gas bubble was elongated in the front and squeezed in the rear parts. A review study on the flow maps was conducted by Akbar et al. [70] to show the dominant effects in each flow regime using available experimental data. They proposed a hydraulic diameter of 1 mm as a criterion for classifying the previous studies into the five regions: bubbly, plug or slug (surface tension dominated), annular (inertia dominated), dispersed, and transition zones regarding the amounts of superficial velocities and the Weber numbers. Micro-particle image velocimetry (μ-PIV) and fluorescence microscopy techniques were used by Günther et al. [73] to recognize a micro-segmented GL flow in a rectangular cross-section area channel. They showed that the roughness of the inner side of the channel and compressibility of the gas bubbles induce an imbalance into the flow field and accelerate the mixing rate accordingly. The periodic switching of recirculation regions in the liquid slugs caused a higher mixing rate in a meandering channel compared with a straight channel (Figure 3). Dore et al. [93] investigated the dynamics of water/ionic two-phase flow by exploring slug formation and recirculation flow in fluid segments at T-junction, straight and curved microchannel employing μ-PIV. As shown in Figure 4, the circulation patterns in water plug consisted of two main mirrored and counter rotating vortices for low mixture velocity. As the mixture velocity increased, two secondary vortices arose at the nose cap of water plug.
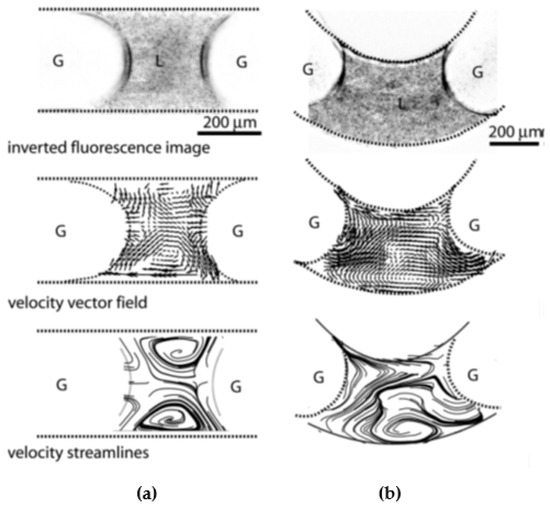
Figure 3.
The sketch of fluorescent micrographs for, (a) straight channel, and (b) meandering channel [73]. Reproduced with permission from Günther, A.; Khan, S.A.; Thalmann, M.; Trachsel, F.; Jensen, K.F., Lab on a Chip; published by Royal Society of Chemistry, 2001.
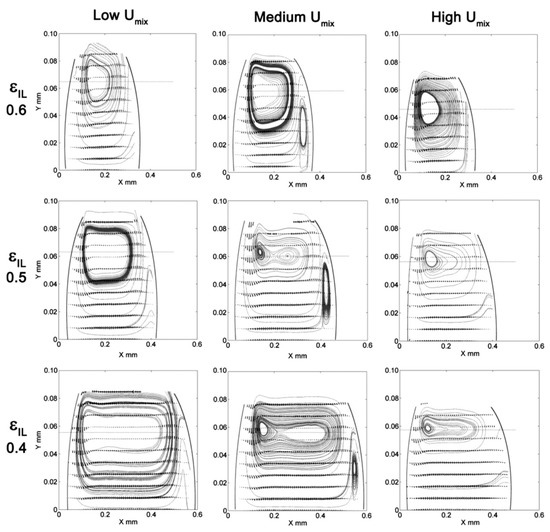
Figure 4.
Schematic representative of circulation patterns within water plugs for three different water holdups and mixture velocities [93]. Reproduced with permission from V Dore, D Tsaoulidis, P Angeli., Chemical engineering science; published by Elsevier, 2012.
The flow patterns of an LL two-phase flow in a rectangular cross-section duct were experimentally investigated by Zhao et al. [82]. The flow maps and the flow transitions were correlated by the inertia forces of each phase and the interfacial forces. They realized six distinctive flow maps in terms of dispersed phase droplet formation process at a T-junction as follows:
- Slug regime; when the interfacial tension is greater than inertial forces, and the Weber numbers are and .
- Monodispersed droplet regime; when the carrier phase flow rate is increased, and the Weber numbers.
- The droplet population regime; when and . This flow regime is observed at the center of the channel where the inertial effects of the continuous phase are significantly greater than the interfacial tension.
- Chaotic thin striations regime; when both flow rates are increased the We numbers are in a range of and . This flow map will be eventually changed into annular due to the instability of the flow.
A combination of experimental observations and numerical simulations was employed by Meyer et al. [94] to show velocity profile, flow patterns in a vertical channel, Figure 5. Both methods predicted a Couette velocity distribution within the liquid film region, a mirrored main recirculating region, and two small vortices in the nose and rear caps with a direction of opposite. They also realized some differences between the results of the two methods as shown previously by [95].
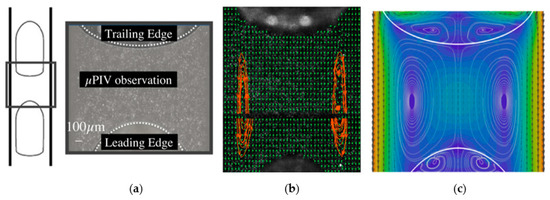
Figure 5.
Flow patterns and streamlines within the Taylor bubble and liquid plug predicted by (a,b) μ-PIV, and (c) numerical simulation [94]. Reproduced with permission from Meyer, C.; Hoffmann, M.; Schlüter, M., International Journal of Multiphase Flow; published by Elsevier, 2014.
Experimental analysis by Zhao et al. [82] revealed that the volume of dispersed flow was significantly affected by interfacial forces, inertia force, and the volumetric ratio of dispersed phase, which correlated by the multivariable least squares method,
where the dynamic hold-up fraction (ε) and equivalent radius (R) in terms of the volume of dispersed phase (Vd) are,
The diameter of the channel has a major role in the measured void fraction and a flow pattern which is shown in Figure 6 for the small diameter tube of 38.1 mm (upper row) and large diameter tube of 101.6 mm (lower row). An increase in tube diameter resulted in more compressed gas bubbles toward the top wall and occupied a smaller region of the cross-sectional area [96]. The measurement also showed that a further increase in superficial velocity ratio makes a more uniform gas phase distribution realized by a smaller portion of gas volume in the top region of the tube. As a consequence, the bubbly to plug/slug transition occurs at lower superficial velocity as the channel’s diameter increases (i.e., for the smaller pipe and for the larger pipe).
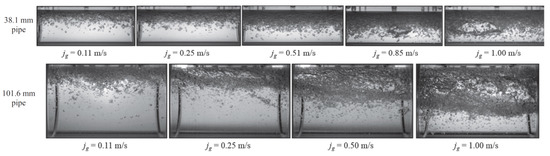
Figure 6.
Snapshot images to highlight the effects of channel’s diameter increase on bubbly to plug/slug transition regimes for different superficial velocities [96]. Reproduced with permission from Kong, R.; Kim, S.; Bajorek, S.; Tien, K.; Hoxie, C., Experimental Thermal and Fluid Science; published by Elsevier, 2018.
A critical Reynolds number of ~300 was found by Butler et al. [97], where the time-averaged gas phase volume fraction showed a significant difference by means of the PIV measurements in capillaries with a T-junction. As shown in Figure 7, a large mirrored recirculation region was observed between two consecutive O2 bubbles with a relative velocity of resulting in the most efficient convective transport (regimes 1, 2, 11, and 13 in Figure 7). They also revealed the key role of the recirculating motion in the liquid plug on the dynamics of mass transfer and its dependency on the bubble velocity.
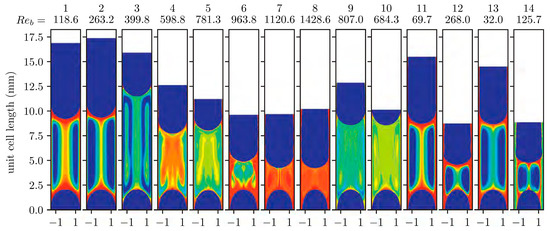
Figure 7.
Time-averaged O2 volume fraction plots for 14 different flow regimes in terms of in the liquid plug regions between two consecutive gas bubbles [97]. Reproduced with permission from Butler, C.; Lalanne, B.; Sandmann, K.; Cid, E.; Billet, A.M., International Journal of Multiphase Flow; published by Elsevier, 2018.
Two different structures named high-concentrated and low-concentrated were observed by Yao et al. [98] to characterize the mass transfer and flow patterns of liquid–liquid slug flow at the bend region of a rectangular meandering microchannel. As is shown in Figure 8a, smaller flow rates created a non-crossing evolution pattern where the red filaments occupied the outer and inner layers when moving through the bend. Conversely, when the flow rates were increased, Figure 8b, the outer red filament was shifted to the central region of the bend.
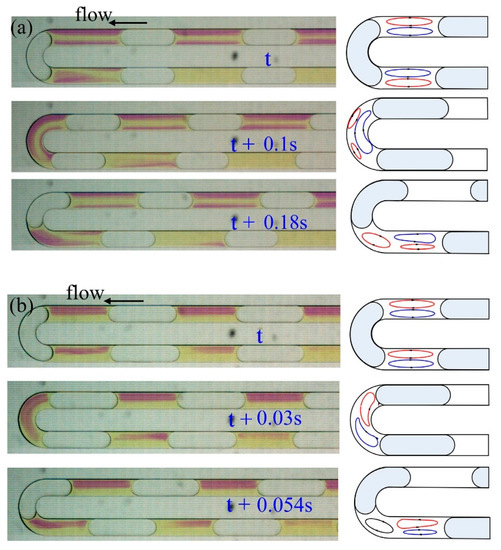
Figure 8.
The evolution patterns of a typical water/toluene two-phase flow at the bend of microchannel for (a) non-crossing pattern and (b) crossing pattern [98]. Reproduced with permission from Yao, C.; Ma, H.; Zhao, Q.; Liu, Y.; Zhao, Y.; Chen, G., Chemical Engineering Science; published by Elsevier, 2020.
Table 5 presents selected experimental studies on the flow patterns of two-phase flows in tubular and non-tubular microchannels and gas bubble or droplet formation.
Table 5.
The literature of selected experimental studies on the flow pattern maps and bubble or droplet formation.
4.2. Numerical Simulations
Numerical modeling methods can be categorized into four main groups; electronic, atomistic, mesoscale, and continuum [110]. In the following, we only review some of the widely-used numerical methods in the modeling of Taylor flows, and more in-depth reviews on the rest of numerical studies can be found in literature, i.e., [111].
Two different methods may be considered in numerical analysis when describing the motions of fluids in two-phase flows: continuous fluid (Eulerian) and discrete particle (Lagrangian). The first method solves the governing partial differential equations to predict the motion of the continuum-based fluid flow, while the second method follows the movement of fluid particles or molecules to predict fluid flow and heat transfer. The interaction between different phases is calculated by both methods to determine the coalescence and interference of interfacial forces [112]. Hashim et al. [113] simulated transport phenomena and biological components, such as proteins, DNA, and cells using the Eulerian method. The innovative aspect of their simulation was to describe the mixing concentration distribution at the interaction of biological components. Apte et al. [114] numerically investigated the liquid fuel spray from a nozzle using the Eulerian-Lagrangian approach with a point-particle approximation for the liquid droplets. Ni et al. [51] investigated numerical study of the GL and LL Taylor flows on an Arbitrary Lagrangian–Eulerian (ALE) formulation to track interfacial and curvatures of slugs. They showed the predominant roles of the viscosity ratio and density ratio of continuous phase to the disperse phase for quite large Ca causing a non-stagnant liquid film region. The Lagrangian approach was also used by [115,116,117,118,119], but not limited to. Therefore, these methods can be widely employed in applications concerning fluid motion.
The Lattice Boltzmann Method (LBM) is a Computational Fluid Dynamics (CFD) method that simulates a fluid density on a lattice framework with streaming and collision (relaxation) processes instead of solving the Navier-Stokes equation directly [120]. This method is an efficient tool for modeling complex fluid systems that include complex boundaries, microscopic interactions, propagations, and the collusions of particles [121,122,123,124,125,126,127,128]. The LBM in a GL two-phase flow modeling was proposed by Seta and Kono [129], based on a particle velocity-dependent forcing scheme. Their results revealed that the effects of high potential caused instability in a three-dimensional model. A diffuse interface free energy LBM was utilized by Komrakova et al. [130] to study the behavior of a single liquid-droplet suspended in another liquid. They found that for droplets with a radius of less than 30 lattice units, a smaller interface thickness is required. Li et al. [131] comprehensively reviewed different uses of LBM proposed by others for simulating thermal boundary treatments, interaction forces between two different phases, mechanical stability conditions, liquid-vapor phase changes, fuel cells, droplet collisions, and energy storage systems. Recently, Fei et al. [132] developed a three-dimensional, multiple-relaxation-time LBM based on a set of non-orthogonal vectors for modeling realistic multiphase flows. Some other uses of the LBM have also been developed by many investigators, e.g., [133,134,135].
Another widely used method for modeling two-phase flows is the Volume of Fluid (VoF), which is a numerical technique that determines the location of a free surface, GL, and LL interface by following the Eulerian approach. This numerical method is a powerful tool for modeling the interfaces of incompressible and immiscible two-phase flows because it is able to predict the interface between two phases even though the interface is becoming too weak to capture the curvature of the interfacial line [136]. Ketabdari [137] discussed VoF regarding the governing equations, as well as its advantages and capabilities predicting the interface line between two phases with large deformation. Osher and Sethian [138] devised a new numerical algorithm to realize and determine the propagation of curvature-dependent speed, which can be combined with VoF. This algorithm approximates the equations of motion by using hyperbolic conversation laws. Many investigators employed this method when simulating a two-phase flow’s interface, e.g., [139,140,141,142]. The general applications of this method and a comprehensive review were conducted by Osher and Fedkiw [143], which discusses the variants and extension methods, such as fast methods for steady-state problems, diffusion generated motion and the variation level set approach. The growth of liquid film thickness was governed by one equation [144]. They assumed a constant pressure gradient in the channel direction and a linear velocity distribution over the liquid film thickness, emphasizing that the model was valid only for a film thickness less than near-wall grid size.
An effort to predict the bubble profile was analytically conducted by Bretherton [30], where he found that considering gravitation as a buoyancy force produced nonsensical results in the vertical configuration of a capillary tube. A critical value of 0.842 was introduced to show no upward movement of the bubble for the amount less than the critical value. Kolb and Cerro [145] found an axisymmetric bubble profile for the Ca greater than 0.1, where the lubrication’s law predicts the interface profiles and the flow patterns adequately. The effects of bubble and slug lengths on the mass transfer in a GL flow was experimentally studied by Berčič and Pintar [146]. Their results revealed that the amount of nitrite transported was independent of the gas bubble length and primarily depended on the liquid slug length. The flow field predictions were numerically obtained by Giavedoni and Saita [36], who illustrate the streamlines for showing the bubble profiles and the slug region. They found that with an increase in the Ca, the recirculation flow disconnected the GL interface and moved downstream. Brauner et al. [147] followed an exact analytical solution to model the interface curvature of two-dimensional stratified flow. Heil [43] numerically simulated the influence of fluid inertia, Re, on the flow patterns and the propagation of an air bubble on two flexible and rigid walls of a GL flow in a two-dimensional channel. Fujioka and Grotberg [148] numerically analyzed the propagation of liquid plugs inside a two-dimensional channel using a finite volume method. They showed that as the liquid plug grew, the frontal part swept the interfacial surfactant from the precursor liquid film. A pair of recirculation regions was found inside the liquid plug shortening as the magnitude of the velocity decreased. They also noted that micelle production and its transport process must be added to the numerical model when plug propagation occurs with a much higher concentration. Their results revealed that as the Re increases, a recirculation flow appears inside the plug core and is then skewed toward the rear part of the bubble. Kreutzer et al. [44] denoted that the inertia effects due to an increase in the Reynolds number elongated the nose and flattened the rear menisci of the gas bubble profile.
The influence of pressure gradient on the flow patterns and bubble profile were illustrated in Figure 9. According to this figure, as the pressure gradient increases, the elongated gas bubble is stretched along the tube axis and the impact of the no-slip conditions at the walls becomes weaker on the bubble shape. Strong, and clockwise circulation is predicted next to the head cap of the bubble resulted in bubble elongation when the pressure is intermediate. Falconi et al. [149] numerically and experimentally studied a vertical-upward three-dimensional Taylor flow in a square mili-channel using the VoF in-house finite volume code and μ-PIV measurements, respectively, Figure 10a. Instantaneous streamlines in Figure 10b show three vortices within the bubble; a large central vortex, two small toroidal vortices at the caps of the bubble. The main central vortex represents the highest z-component velocity next to the channel axis with the direction of rotation of opposite to the smaller vortices. Valizadeh et al. [150] conducted a numerical parametric study of non-Newtonian turbulent flow in a spiral duct by investigating the effects of geometry, consistency index, and power-law index values of viscosity. Since their study was dealt with a wide range of large Reynolds numbers in mili-channel, we do not discuss their findings anymore.
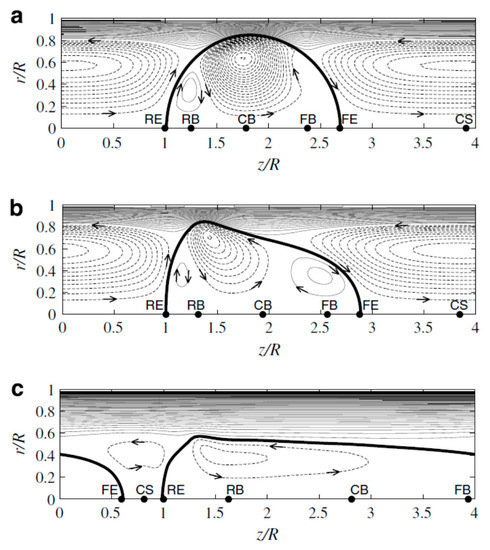
Figure 9.
The streamlines inside and outside the bubbles for different pressure gradients (a) 85 M Pam−1, (b) 850 M Pam−1, and (c) 3000 M Pam−1 [139]. Reproduced with permission from Fukagata, K.; Kasagi, N.; Ua-arayaporn, P.; Himeno, T., International Journal of Heat and Fluid Flow; published by Elsevier, 2007.
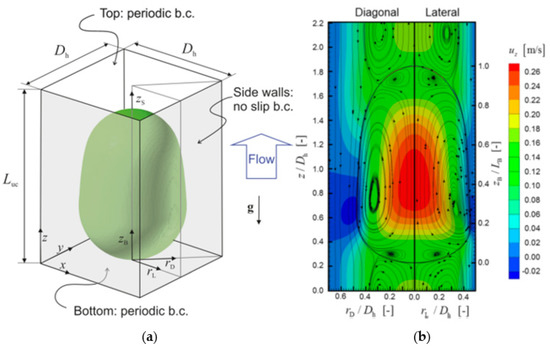
Figure 10.
(a) The schematic of computational setup and coordinate system, and (b) instantaneous streamlines in the moving frame with the bubble and z-component velocity contour-plot in a fixed frame of reference [149]. Reproduced with permission from Falconi, C.J.; Lehrenfeld, C.; Marschall, H.; Meyer, C.; Abiev, R.; Bothe, D.; Reusken, A.; Schlüter, M.; Wörner, M., Physics of Fluids, published by AIP Publishing, 2016.
Both experimental and 3D numerical simulations were carried out by Abdollahi et al. [151] for liquid–liquid Taylor flow in a square channel with hydraulic diameters of 1 and 2 mm. Figure 11 displays the non-dimensional contour of the radial velocity component highlighting its key effects on heat transfer enhancement and recirculating flow within the slugs and the carrying phase. The highest radial velocity occurred at the nose and rear of the slug to make two vortices rotating in the opposite direction of the main recirculation zone in the middle of the slugs as observed by [139,149]. In a constant length unit cell, as the dispersed phase volume fraction increased, the liquid film thickness remained constant. The large recirculating zone in the middle of the slug show less axial flow and more radial flow as the droplet length was decreased. Their results also showed a huge increase of heat transfer rate up to 700% compared to single-phase flow indicating more effectiveness of short slugs on the heat transfer rate.
Figure 11.
Radial velocity component contours with different dispersed phase volume fraction in a fixed unit cell length [151]. Reproduced with permission from Abdollahi, A.; Norris, S.E.; Sharma, R.N., Applied Thermal Engineering; published by Elsevier, 2020.
Xu et al. [152] numerically simulated 3D Taylor flow in a microchannel with a square cross-section under ultrasonic oscillation. A harmonic, vertical, and ultrasonic oscillating applied to microreactor as,
where the amplitude of the microreactor oscillation (A) is in the order of 2–8 microns and the angular frequency as a function of a constant vibrating frequency of is
They found the channel oscillation affected the flow pattern and hydrodynamic characteristics in both liquid slugs and bubbles as shown in Figure 12 for Taylor flow in bends and oscillating bubbly flows, for example. Twisted flow structure in the liquid slugs improved mixing rate and transport phenomena. Wavy interface of bubble enhanced the interfacial area accelerating the mass transfer rate across the channel and improved the performance of microreactor. The sub-harmonic bubble surface wave was also created by the pressure pulsation in the parallel direction of the oscillation.
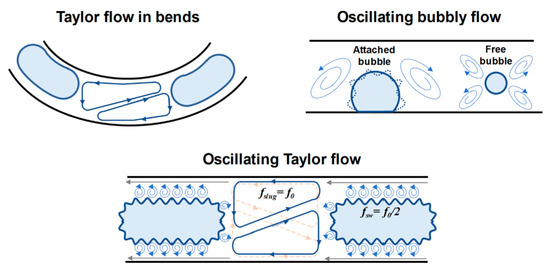
Figure 12.
Schematic of different gas–liquid Taylor flow in microchannel; Taylor flow in bends, oscillating bubbly flow, and oscillating Taylor flow observed by [152]. Reproduced with permission from Xu, F.; Yang, L.; Liu, Z.; Chen, G., Chemical Engineering Science; published by Elsevier, 2021.
A summary of analytical and numerical investigations on the flow patterns and the formations of the gas/liquid slugs is presented in Table 6.
Table 6.
Selected numerical and analytical studies on the flow patterns and the bubble or the droplet formation.
5. Flow Regime Transitions
A transition from one flow regime to another often occurs when the flow or boundary conditions are changed. The actual flow maps and the transition conditions specifically depend on a group of effective features during an experiment or the assumptions in numerical simulations [157,158,159,160]. For example, Bottin et al. [161] experimentally obtained various flow regimes for a horizontal two-phase flow in a pipe with an inner diameter of 0.1 m. They attempted to describe different flow regimes regarding the values of superficial velocities of the gas and liquid phases in the earlier experiments [162,163,164,165,166,167]. Some of the transition criteria from a flow regime to another in microchannels are presented in Table 7.
Table 7.
Summary of proposed criteria for the transition of flow pattern.
Jayawardena et al. [65] showed the ratio of gas to liquid Reynolds numbers as a function of the Suratman number for recognizing the flow maps. An accurate transitional value of the Su occurs between 104 and 107 from a bubble to a slug transition. However, the transition from a slug regime to an annular regime has two different criteria regarding the value of Su, greater and less than 106. The motion of the gas bubble through a microchannel with a square cross-sectional area was experimentally studied by Cubaud and Ho [72] and Cubaud et al. [100]. Regarding the liquid fraction, Ql / (Ql + Qg), they classified the flow patterns into several categories: bubbly, wedging, slug, annular, and dry, which are illustrated in Figure 13. Their experiments specified some critical liquid fractions for a transition from one flow regime to another, which are ~0.75 from bubbly to wedging, ~0.20 from wedging to slug, ~0.04 from slug to annular, and ~0.005 from annular to dry transitions. They also found that at low liquid velocity, the gas bubbles clogged at the sharp corner of the channel bend before merging and eventually passing the bend. The corner of the channel bend trapped a gas bubble to merge into another upcoming bubble, producing a single larger bubble.
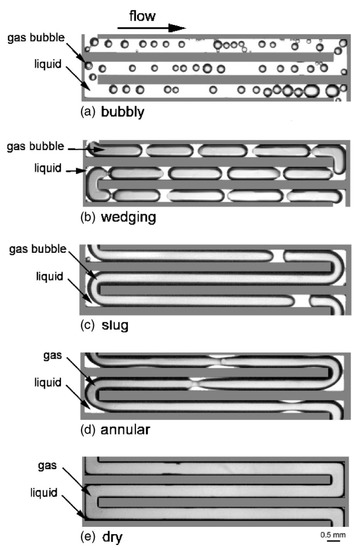
Figure 13.
The different flow patterns from high to low liquid fraction [100] (Reproduced with permission from Cubaud, T.; Ulmanella U.; Ho, C.M., Fluid Dynamics Research; published by Elsevier, 2006).
6. Slug Length
The hydrodynamic characteristics of slug flows are highly dependent on the profile and length of the liquid slug. Bubble length measuring was experimentally conducted by Marchessault and Mason [29], where the change in the shape of the liquid film thickness around short bubbles was likely caused by end effects, buoyancy, and cylindrical model assumption. According to Schwartz et al. [32], the liquid film thickness left behind a gas bubble in a capillary was adequately close to the predictions of lubrication theory when the length of bubbles was short. They also found that for the length of bubbles shorter than the tube diameter, the thin film layer region was no longer observed. According to Kashid and Agar [101] and Kashid et al. [102], slug length is significantly affected by the capillary number and the junction dimensions. In a slug flow regime, the lengths of slugs of both phases are greater than their diameters, but at relatively low volumetric flow rates the slug pattern is established with the length equal to the inner diameter of the tube. In the case of a high volumetric flow rate and surrounded water slugs by cyclohexane, the deformed interface regime is made with long water slugs and small cyclohexane droplets. A few simple linear equations to compute the stable slug lengths were reported by [163,170,181,182], which indicated that the ratio of the liquid slug length to the tube diameter remained at a constant value of 16, 20.7, 7.5, and 21.5, respectively.
Table 8 presents the correlations for measuring the length of liquid slugs of two-phase flow in a microchannel including the void fractions. Beyond the data provided in Table 8, two other recent studies, Han and Chen [183] and Qian et al. [184], are concerned with the slug length and its formation, but the correlations of slug length were not proposed by the authors. The first study numerically simulated the droplet formation at a T-junction in a microchannel. The effective diameter of droplets was studied in terms of contact angle, continuous phase viscosity, flow rate ratio, and interfacial tension. The latter experimental investigation considered the influence of flow rate on the liquid slug generation in a microchannel with a square cross-sectional area. They found the slug lengths vary from 0.923 to 1.186 mm based on different flow rates of the continuous and dispersed phases. The distance between subsequent water slugs was also measured.
Table 8.
The literature on the correlation of the slug length in two-phase flows in circular and non-circular cross-section area microchannels.
7. Pressure Drop
The interactive structure of different phases and between phases and solid walls represent the predominant parameters to describe the flow pattern of multiphase flow and pressure loss through the channel. Two homogenous and separated flow models have been employed by researchers to predict the frictional pressure drop [62]. The first model postulates the same velocity for both gas and liquid phases, which implies that the slip ratio at the interactive boundaries is equal to one. This model considers two or more different phases as a single phase. The values of the flow properties are dependent on the quality, while the frictional pressure drop can be obtained by single-phase theory [63]:
where z indicates the axial direction of the channel.
The Hagen–Poiseuille equation is a physical law to compute the pressure drop of a Newtonian and incompressible flow through a long and circular tube with a constant cross-section area [63]. The flow regime remained laminar due to the Reynolds number of the microflows, where the friction factor becomes for round tubes and the equation above can be rearranged as:
where L and d are the length and the diameter of the tube, respectively.
The presence of the second phase in two-phase flow causes an additional term to the pressure loss of a single-phase flow and does not satisfy Poiseuille’s law anymore. Therefore, the total pressure drop is the sum of the single-phase pressure drop and the interaction pressure drop caused by introducing the secondary phase. These pressure drop components can be shown together as follows:
The non-dimensional pressure drop and length scale in Equation (12) were proposed by Walsh et al. [54], as below:
where μ and Ls denote the dynamic viscosity of the continuous phase and the length of liquid slugs, respectively.
The pressure drop over a unit cell can also be described by three components [51,88,107]:
Furthermore, Abiev [192] assumed the total pressure losses in the capillary tubes were a summation of two components, named the formation of a new surface during the motion of bubble and the arrangement of a velocity profile in liquid slugs as below (refer to Table 9 for further details):
Table 9.
The literature on pressure drop correlations of the two-phase flow in the microchannels.
Besides, Song et al. [180] expressed the total pressure drop considering the total number of water slugs (n), including the pinching off slug,
where the first term indicates the pressure drop of single-phase flow of gas, the second term is the critical pressure drop to break up the water slugs, and the last term denotes the pressure drop due to the moving slugs through the capillary.
According to the literature, a circular cross-sectional area has been assumed for the gas bubble, where the velocity gradient is limited to the confined liquid region surrounding the bubbles, not inside the bubbles [29]. However, the linear ratio between the pressure and velocity fields is valid for a straight tube, independent of the diameter of the channel. Introducing gas bubbles into the continuous phase flow changes the relation to be nonlinear. The moving bubbles in a tube leave a backfill of liquid left behind the bubble, where the volumetric flow rate of this backflow can be calculated by . Marchessault and Mason [29] also showed the pressure gradient as a function of surface tension, film thickness, and the radius of the tube. They experimentally determined that at high velocities the liquid film thickness increases in the direction of the gas-bubble movement, when the profile of the bubble shows a tendency to be conic at the front.
Table 9 presents the correlations to calculate the pressure drop created by bubble/droplet in a microflow. One of the first empirical correlations of pressure loss in a capillary tube for horizontal and vertical configurations was experimentally and analytically obtained by Bretherton [30]. He discovered that the pressure drop was enhanced from a coefficient of 14.894 at the leading to 18.804 at the trailing regions due to the slight difference between the frontal and rear menisci of the bubble. Ratulowski and Chang [35] proposed a correlation for pressure drop over a finite gas bubble approaching Bretherton’s law for low Ca along with two other correlations for a square tube. Using a Finite Element Method (FVM), Giavedoni and Saita [36] determined the pressure gradient between two specific points; the first at the stagnation point of the gas bubble, and the second in the uniform film thickness region. Their results revealed an increasing trend in pressure gradient with the capillary number. They also found that the backflow region disappears when the capillary number is sufficiently high. Interfacial pressure along the free surface on the rear half of the gas bubble was found by them two years later, where the pressure was significantly decreased because of leaving liquid phase from the uniform film thickness region [38]. Kawaji and Chung [71] found that the shape of the ducts had an impact on the frictional pressure loss or the void fraction. They showed that the total pressure drop was a summation of pressure loss in the single-phase part and the two-phase part of a unit cell. The size impact of the cross-section area of a rectangular microchannel was experimentally carried out by Harirchian and Garimella [104] for a boiling heat transfer situation. A slight decrease in pressure drop was found with a heat flux increase caused by liquid viscosity reduction as the liquid phase temperature increased. They also observed an increase in pressure loss as the cross-sectional area decreased. Niu et al. [105] showed the total pressure drop in a two-phase microflow was the summation of the wall friction and the sudden expansion components showing good agreement when compared with homogenous and separated models.
8. Conclusions
In this review paper, the literature of GL and LL two-phase flows through microchannels with different cross-sectional areas were discussed. Key results can be summarized in the following way.
- The maps of Taylor flow and the transition boundaries between each flow regime have been explained by x-y graphs, where the axes are defined by the superficial phase velocities, dimensionless numbers, and volumetric flow rates.
- Most often the gas bubbles and dispersed liquid droplets are surrounded by a thin film of carrying phase, except in non-circular tubes with very high void fraction where the dry-out at the inner surface of the tube has been observed.
- There is still no universal agreement to classify all flow regimes due to the experimental apparatus and capturing equipment, which force investigators to name the flow regimes differently.
- As more efficient numerical solutions and supercomputers emerge, they are used to solve interesting microflow problems with acceptable accuracy. Since the hydrodynamic of the film thickness is crucial and informative, high-resolution images can be produced via CFD. Meanwhile, there is still room to pay more attention to this region because of the important effect of film thickness on the frictional pressure drop, bubble or droplet profile, and heat and mass transfer.
- Contact angle can play a major role in the flow pattern as long as two phases are in contact with the inner surface of the tube, except for Taylor flow is, i.e., gas bubbles or dispersed liquid droplets surrounded by a liquid film.
- The transition criterion from one flow regime into another one has been investigated by many researchers, resulting in numerous criteria based on the nature of the flow, experimental approach, and key parameters.
- The quantitative attempts to correlate slug length, liquid film thickness (recently summarized by [4] in a comprehensive review paper), and pressure drop have been compared. These correlations include non-dimensional numbers, superficial velocity ratios, volumetric flow rate ratios, void fraction, and other thermophysical characteristics of phases.
Author Contributions
Conceptualization, A.E.; methodology, A.E.; investigation, A.E.; writing—original draft preparation, A.E.; writing—review and editing, K.P. and Y.S.M.; funding acquisition, Y.S.M. and K.P. All authors have read and agreed to the published version of the manuscript.
Funding
This research was funded by the Natural Sciences and Engineering Research Council of Canada (NSERC) under grant numbers 200,439 and 209,780. The authors would also like to thank the Memorial University Libraries Open Access Author Fund, who assisted with funding this paper.
Institutional Review Board Statement
Not applicable.
Informed Consent Statement
Not applicable.
Data Availability Statement
Not applicable.
Conflicts of Interest
The authors declare no conflict of interest.
Nomenclature
| Dimensionless numbers (discussed in the text) | ||
| Ar | Archimedes number | |
| Bo | Bond number | |
| Ca | Capillary number | |
| Cn | Cahn number | |
| Eo | Eötvös number | |
| Fr | Froude number | |
| La | Laplace number | |
| N | viscosity number | |
| Oh | Ohnesorge number | |
| Re | Reynolds number | |
| Su | Suratman number | |
| We | Weber number | |
| English letters | ||
| A | [m2] | area of the channel |
| A | [micron] | microreactor oscillation in Equation (9) |
| B | [lb hr−1 ft−2] | mass velocity of the liquid phase |
| C | [–] | Chisholm constant (5, 10, 15, and 20 for different flow regimes) |
| d | [m] | tube diameter |
| f | [–] | friction factor and a function defined by Wang et al. [179] |
| [kHz] | constant vibrating frequency | |
| [–] | a function defined by Wang et al. [179] | |
| F | [s−1] | frequency of gas bubbles |
| g | [m s−2] | gravity acceleration |
| G | [lb hr−1 ft−2] | mass velocity of the gas phase |
| h | [mm] | the height of the rectangular cross-sectional area channel |
| H | [m] | Kelvin-Helmholtz instability index |
| K | [–] | end effect of a bubble |
| j | [ms−1] | superficial velocity in Figure 6 |
| L | [m] | length |
| [kg s−1] | mass flow rate | |
| n | [–] | number of slugs |
| p | [Nm−2] | pressure |
| Q | [ml s−1] | volumetric flow rate |
| r | [m] | radial distance from the axis of the tube |
| R | [m] | radius of channel, equivalent radius in Equation (6) |
| s | [–] | channel gap |
| S | [–] | slip ratio |
| t | [s] | time |
| U | [ms−1] | average velocity |
| v | [volt] | voltage |
| V | [ms−1] | superficial velocity |
| w | [mm] | the width of the rectangular channel |
| x | [–] | the quality or the dryness fraction |
| X | [–] | Lockhart-Martinelli parameter |
| z | [m] | axial length (m) |
| Greek letters | ||
| α | [–] | void fraction |
| β | [–] | the volumetric quality |
| γ | [–] | the ratio between the dynamic viscosity of droplet to continuous phase |
| δ | [m] | liquid film thickness |
| ε | [–] | the gas phase holdup |
| λ | ||
| µ | [Pa.s] | dynamic viscosity |
| ν | the volume of liquid flowing per bubble and slug | |
| ξ | [m] | interface width |
| ρ | [kgm−3] | density |
| σ | [Nm−1] | interfacial tension |
| [s−1] | angular frequency | |
| [mm3] | volume of the dispersed phase | |
| φ | [–] | two-phase friction multiplier |
| ψ | ||
| Δ | [–] | gradient operator |
| Subscripts and superscripts | ||
| * | minimum or maximum, and dimensionless parameters | |
| 0 | initial | |
| 3D | droplet at the junction | |
| a | aqueous phase | |
| b | the equivalent diameter of a sphere | |
| b | bubble | |
| c | continuous | |
| ca | capillary | |
| cap | head or rear meniscuses of the gas bubble | |
| CH1 | the first detection point | |
| CH2 | the second detection point | |
| cr | critical | |
| d | dispersed | |
| D | diagonal direction in Figure 10 | |
| f | film | |
| g | gas | |
| H | hydraulic | |
| i | interfacial | |
| l | liquid | |
| L | lateral direction in Figure 10 | |
| ks | kerosene-superficial | |
| m | mixture or mean | |
| max | maximum | |
| mf | moving film | |
| min | minimum | |
| o | organic phase | |
| rec | receding | |
| s | slug | |
| sf | stagnant film | |
| s∞ | the radius of the gas bubble in the uniform film thickness region | |
| t | total | |
| th | macro-to-micro-scale threshold | |
| tp | two-phase velocity | |
| uc | unit cell | |
| ws | water-superficial | |
| Acronyms | ||
| FEP | fluorinated ethylene propylene | |
| GL | gas–liquid | |
| LBM | lattice Boltzmann method | |
| LL | liquid–liquid | |
| probability density function | ||
| VoF | volume of fluid | |
| XFVM | extended finite volume method | |
| μ-PIV | micro-particle image velocimetry | |
References
- Angeli, P.; Gavriilidis, A. Hydrodynamics of Taylor flow in small channels: A review. J. Mech. Eng. Sci. 2008, 222, 737–751. [Google Scholar] [CrossRef]
- Awad, M.M.; Muzychka, Y.S. Two-phase flow modeling in microchannels and minichannels. Heat Transfer Eng. 2010, 31, 1023–1033. [Google Scholar] [CrossRef]
- Awad, M.M.; Muzychka, Y.S. Effective property models for homogeneous two-phase flows. Exp. Therm. Fluid Sci. 2008, 33, 106–113. [Google Scholar] [CrossRef]
- Etminan, A.; Muzychka, Y.S.; Pope, K. Liquid film thickness of two-phase slug flows in capillary microchannels: A review paper. Can. J. Chem. Eng. 2021, 1, 1–24. [Google Scholar] [CrossRef]
- Awad, M.M. Two-phase flow. In An Overview of Heat Transfer Phenomena; Salim, N.K., Ed.; IntechOpen: London, UK, 2012. [Google Scholar] [CrossRef]
- Turton, R.; Clark, N.N. An explicit relationship to predict spherical particle terminal velocity. Powder Technol. 1987, 53, 127–129. [Google Scholar] [CrossRef]
- Hua, J.; Quan, S.; Nossen, J. Numerical simulation of an intermediate sized bubble rising in a vertical pipe. Comp. Meth. Multiph. Flow 2009, 63, 111–121. [Google Scholar] [CrossRef]
- Yin, X.; Koch, D.L. Hindered settling velocity and microstructure in suspensions of solid spheres with moderate Reynolds numbers. Phys. Fluids 2007, 19, 093302. [Google Scholar] [CrossRef]
- Zhang, Q.; Prosperetti, A. Physics-based analysis of the hydrodynamic stress in a fluid-particle system. Phys. Fluids 2010, 22, 033306. [Google Scholar] [CrossRef]
- Zhan, C.; Sardina, G.; Lushi, E.; Brandt, L. Accumulation of motile elongated micro-organisms in turbulence. J. Fluid Mech. 2014, 739, 22–36. [Google Scholar] [CrossRef]
- Rabinovich, E.; Kalman, H. Pickup, critical and wind threshold velocities of particles. Powder Technol. 2007, 176, 9–17. [Google Scholar] [CrossRef]
- Quan, S. Co-current flow effects on a rising Taylor bubble. Int. J. Multiph. Flow 2011, 37, 888–897. [Google Scholar] [CrossRef]
- Uno, S.; Kintner, R.C. Effect of wall proximity on the rate of rise of single air bubbles in a quiescent liquid. AIChE J. 1956, 2, 420–425. [Google Scholar] [CrossRef]
- Li, W.; Wu, Z. A general criterion for evaporative heat transfer in micro/mini-channels. Int. J. Heat Mass Tranf. 2010, 53, 1967–1976. [Google Scholar] [CrossRef]
- Li, W.; Wu, Z. A general correlation for adiabatic two-phase pressure drop in micro/mini-channels. Int. J. Heat Mass Tranf. 2010, 53, 2732–2739. [Google Scholar] [CrossRef]
- Wu, Z.; Li, W. A new predictive tool for saturated critical heat flux in micro/mini–channels: Effect of the heated length-to-diameter ratio. Int. J. Heat Mass Tranf. 2010, 54, 2880–2889. [Google Scholar] [CrossRef]
- Wu, Z.; Li, W.; Ye, S. Correlations for saturated critical heat flux in micro-channels. Int. J. Heat Mass Tranf. 2010, 54, 379–389. [Google Scholar] [CrossRef]
- Ganapathy, H.; Shooshtari, A.; Dessiatoun, S.; Alshehhi, M.; Ohadi, M. Fluid flow and mass transfer characteristics of enhanced CO2 capture in a minichannel reactor. Appl. Energ. 2014, 119, 43–56. [Google Scholar] [CrossRef]
- Prajapati, Y.K.; Bhandari, P. Flow boiling instabilities in microchannels and their promising solutions—A review. Exp. Therm. Fluid Sci. 2017, 88, 576–593. [Google Scholar] [CrossRef]
- Cahn, J.W.; Hilliard, J.E. Free energy of a nonuniform system. I. interfacial free energy. J. Chem. Phys. 1958, 28, 258–267. [Google Scholar] [CrossRef]
- Cahn, J.W.; Hilliard, J.E. Free energy of a nonuniform system. III. nucleation in a two-component incompressible fluid. J. Chem. Phys. 1959, 31, 688–699. [Google Scholar] [CrossRef]
- Cahn, J.W. Free energy of a nonuniform system. II. thermodynamic basis. J. Chem. Phys. 1959, 30, 1121–1123. [Google Scholar] [CrossRef]
- Cahn, J.W. On spinodal decomposition. Acta Metal. 1961, 9, 795–801. [Google Scholar] [CrossRef]
- Langer, J.S. Spinodal decomposition. In Fluctuations, Instabilities, and Phase Transitions; NATO Advanced Study Institutes Series (Series B: Physics); Springer: Boston, MA, USA, 1975. [Google Scholar] [CrossRef]
- Anderson, D.M.; McFadden, G.B. Diffuse-interface methods in fluid mechanics. Annu. Rev. Fluid Mech. 1998, 30, 139–165. [Google Scholar] [CrossRef]
- He, Q.; Hasegawa, Y.; Kasagi, N. Heat transfer modelling of gas-liquid slug flow without phase change in a micro tube. Int. J. Heat Fluid Flow 2010, 31, 126–136. [Google Scholar] [CrossRef]
- Choi, Y.J.; Anderson, P.D. Cahn-Hillard modelling of particles suspended in two-phase flows. Int. J. Numer. Meth. Fluids 2011, 69, 995–1015. [Google Scholar] [CrossRef]
- Fairbrother, F.; Stubbs, A.E. Studies in electro-endosmosis: Part VI. The “bubble-tube” method of measurement. J. Chem. Soc. 1935, 1, 527–529. [Google Scholar] [CrossRef]
- Marchessault, R.N.; Mason, S.G. Flow of entrapped bubbles through a capillary. Ind. Eng. Chem. 1960, 52, 79–84. [Google Scholar] [CrossRef]
- Bretherton, F.P. The motion of long bubbles in tubes. J. Fluid Mech. 1961, 10, 166–188. [Google Scholar] [CrossRef]
- Taylor, G.I. Deposition of a viscous fluid on the wall of a tube. J. Fluid Mech. 1961, 10, 161–165. [Google Scholar] [CrossRef]
- Schwartz, L.W.; Princen, H.M.; Kiss, A.D. On the motion of bubbles in capillary tubes. J. Fluid Mech. 1986, 172, 259–275. [Google Scholar] [CrossRef]
- Teletzke, G.F.; Davis, H.T.; Scriven, L.E. Wetting hydrodynamics. Rev. Phys. Appl. 1988, 23, 989–1007. [Google Scholar] [CrossRef]
- Irandoust, S.; Andersson, B. Simulation of flow and mass transfer in Taylor flow through a capillary. Compu. Chem. Eng. 1989, 13, 519–526. [Google Scholar] [CrossRef]
- Ratulowski, J.; Chang, H.C. Transport of gas bubbles in capillaries. Phys. Fluids A Fluid Dyn. 1989, 1, 1642–1655. [Google Scholar] [CrossRef]
- Giavedoni, M.D.; Saita, F.A. The axisymmetric and plane cases of a gas phase steadily displacing a Newtonian liquid–A simultaneous solution of the governing equations. Phys. Fluids 1997, 9, 2420–2428. [Google Scholar] [CrossRef]
- Thulasidas, T.C.; Abraham, M.A.; Cerro, R.L. Flow patterns in liquid slugs during bubble-train flow inside capillaries. Chem. Eng. Sci. 1997, 52, 2947–2962. [Google Scholar] [CrossRef]
- Giavedoni, M.D.; Saita, F.A. The rear meniscus of a long bubble steadily displacing a Newtonian liquid in a capillary tube. Phys. Fluids 1999, 11, 786–794. [Google Scholar] [CrossRef]
- Heiszwolf, J.J.; Engelvaart, L.B.; Gvd Eijnden, M.; Kreutzer, M.T.; Kapteijn, F.; Moulijn, J.A. Hydrodynamic aspects of the monolithic loop reactor. Chem. Eng. Sci. 2001, 56, 805–812. [Google Scholar] [CrossRef]
- Aussillous, P.; Quéré, D. Quick deposition of a fluid on the wall of a Tube. Phys. Fluids 2000, 12, 2367–2371. [Google Scholar] [CrossRef]
- Bico, J.; Quéré, D. Liquid trains in a tube. Europhys. Lett. 2000, 51, 546–550. [Google Scholar] [CrossRef][Green Version]
- Kreutzer, M.T.; Du, P.; Heiszwolf, J.J.; Kapteijn, F.; Moulijn, J.A. Mass transfer characteristics of three-phase monolith reactors. Chem. Eng. Sci. 2001, 56, 6015–6023. [Google Scholar] [CrossRef]
- Heil, M. Finite Reynolds number effects in the Bretherton problem. Phys. Fluids 2001, 13, 2517–2521. [Google Scholar] [CrossRef]
- Kreutzer, M.T.; Kapteijn, F.; Moulijn, J.A.; Heiszwolf, J.J. Multiphase monolith reactors: Chemical reaction engineering of segmented flow in microchannels. Chem. Eng. Sci. 2005, 60, 5895–5916. [Google Scholar] [CrossRef]
- Grimes, R.; King, C.; Walsh, E. Film thickness for two phase flow in a microchannel. In Proceedings of the ASME 2006 International Mechanical Engineering Congress and Exposition, Chicago, IL, USA, 5–10 November 2006; pp. 207–211. [Google Scholar] [CrossRef]
- Han, Y.; Shikazono, N. Measurement of the liquid film thickness in micro tube slug flow. Int. J. Heat Fluid Flow 2009, 30, 842–853. [Google Scholar] [CrossRef]
- Eain, M.M.G.; Egan, V.; Punch, J. Film thickness measurements in liquid-liquid slug flow regimes. Int. J. Heat Fluid Flow 2013, 44, 515–523. [Google Scholar] [CrossRef]
- Gupta, R.; Leung, S.S.Y.; Manica, R.; Fletcher, D.F.; Haynes, B.S. Hydrodynamics of liquid-liquid Taylor flow in microchannels. Chem. Eng. Sci. 2013, 92, 180–189. [Google Scholar] [CrossRef]
- Klaseboer, E.; Gupta, R.; Manica, R. An extended Bretherton model for long Taylor bubbles at moderate capillary Numbers. Phys. Fluids 2014, 26, 032107. [Google Scholar] [CrossRef]
- Huang, H.; Dhir, V.K.; Pan, L.M. Liquid film thickness measurement underneath a gas slug with miniaturized sensor matrix in a microchannel. Microfluid Nanofluid 2017, 21, 159. [Google Scholar] [CrossRef]
- Ni, D.; Hong, F.J.; Cheng, P.; Chen, G. Numerical study of liquid-gas and liquid-liquid Taylor flows using a two-phase flow model based on Arbitrary-Lagrangian-Eulerian (ALE) Formulation. Int. Commun. Heat Mass 2017, 88, 37–47. [Google Scholar] [CrossRef]
- Patel, R.S.; Weibel, J.A.; Garimella, S.V. Characterization of liquid film thickness in slug-regime microchannel flows. Int. J. Heat Mass Tranf. 2017, 115, 1137–1143. [Google Scholar] [CrossRef]
- Kreutzer, M.T.; van der Eijnden, M.G.; Kapteijn, F.; Moulijn, J.A.; Heiszwolf, J.J. The pressure drop experiment to determine slug lengths in multiphase monoliths. Catal. Today 2005, 105, 667–672. [Google Scholar] [CrossRef]
- Walsh, E.; Muzychka, Y.S.; Walsh, P.; Egan, V.; Punch, J. Pressure drop in two phase slug/bubble flows in mini scale capillaries. Int. J. Multiph. Flow 2009, 35, 879–884. [Google Scholar] [CrossRef]
- Warnier, M.J.F.; de Croon, M.H.J.M.; Rebrov, E.V.; Schouten, J.C. Pressure drop of gas-liquid Taylor flow in round micro-capillaries for low to intermediate Reynolds numbers. Microfluid Nanofluid 2010, 8, 33–45. [Google Scholar] [CrossRef]
- Jovanović, J.; Zhou, W.; Rebrov, E.V.; Nijhuis, T.A.; Hessel, V.; Schouten, J.C. Liquid-liquid slug flow: Hydrodynamics and pressure drop. Chem. Eng. Sci. 2011, 66, 42–54. [Google Scholar] [CrossRef]
- Eain, M.M.G.; Egan, V.; Howard, J.; Walsh, P.; Walsh, E.; Punch, J. Review and extension of pressure drop models applied to Taylor flow regimes. Int. J. Multiph. Flow 2015, 68, 1–9. [Google Scholar] [CrossRef]
- Qian, D.; Lawal, A. Numerical study on gas and liquid slugs for Taylor flow in a T-junction microchannel. Chem. Eng. Sci. 2006, 61, 7609. [Google Scholar] [CrossRef]
- Tan, J.; Xu, J.H.; Li, S.W.; Luo, G.S. Drop dispenser in a cross-junction microfluidic device: Scaling and mechanism of break-up. Chem. Eng. J. 2008, 136, 306–311. [Google Scholar] [CrossRef]
- Fries, D.M.; von Rohr, P.R. Liquid mixing in gas-liquid two-phase flow by meandering microchannels. Chem. Eng. Sci. 2009, 64, 1326–1335. [Google Scholar] [CrossRef]
- Steegmans, M.L.J.; Schroën, K.G.P.H.; Boom, R.M. Characterization of emulsification at flat microchannel Y junctions. Langmuir 2009, 25, 3396–3401. [Google Scholar] [CrossRef]
- White, F.M. Viscous Fluid Flow, 3rd ed.; McGraw–Hill: New York, NY, USA, 2006. [Google Scholar]
- White, F.M. Fluid Mechanics, 8th ed.; McGraw–Hill: New York, NY, USA, 2016. [Google Scholar]
- Suo, M.; Griffith, P. Two-phase flow in capillary tube. J. Basic Eng. 1964, 86, 576–582. [Google Scholar] [CrossRef]
- Jayawardena, S.S.; Balakotaiah, V.; Witte, L.C. Flow pattern transition maps for microgravity two-phase flows. AIChE J. 1997, 43, 1637–1640. [Google Scholar] [CrossRef]
- Hewitt, G.F.; Roberts, D.N. Studies of Two-Phase Flow Patterns by Simultaneous X-Ray and Flash Photography. Atomic Energy Research Establishment, Harwell, England, AERE–M 2159. 1969. Available online: https://www.osti.gov/servlets/purl/4798091 (accessed on 5 January 2021).
- Fukano, T.; Kariyasaki, A. Characteristics of gas-liquid two-phase flow in a capillary tube. Nucl. Eng. Des. 1993, 141, 59–68. [Google Scholar] [CrossRef]
- Triplett, K.A.; Ghiaasiaan, S.M.; Abdel–Khalik, S.I.; Sadowskia, D.L. Gas-liquid two-phase flow in microchannels Part I: Two-phase flow patterns. Int. J. Multiph. Flow 1999, 25, 377–394. [Google Scholar] [CrossRef]
- Zhao, T.S.; Bi, Q.C. Co–current air-water two-phase flow patterns in vertical triangular microchannels. Int. J. Multiph. Flow 2001, 27, 765–782. [Google Scholar] [CrossRef]
- Akbar, M.K.; Plummer, D.A.; Ghiaasiaan, S.M. Gas-liquid two-phase flow regimes in microchannels. In Proceedings of the ASME International Mechanical Engineering Congress and Exposition, New Orleans, LO, USA, 17–22 November 2002; pp. 527–534. [Google Scholar] [CrossRef]
- Kawaji, M.; Chung, P.M.-Y. Unique characteristics of adiabatic gas-liquid flows in microchannels: Diameter and shape effects on flow patterns, void fraction and pressure drop. In Proceedings of the ASME 1st International Conference on Microchannels and Minichannels, Rochester, NY, USA, 24–25 April 2003; pp. 115–127. [Google Scholar] [CrossRef]
- Cubaud, T.; Ho, C.M. Transport of bubbles in square microchannels. Phys. Fluids 2004, 16, 4575–4585. [Google Scholar] [CrossRef]
- Günther, A.; Khan, S.A.; Thalmann, M.; Trachsel, F.; Jensen, K.F. Transport and reaction in microscale segmented gas-liquid Flow. Lab. Chip 2004, 4, 278–286. [Google Scholar] [CrossRef]
- Yue, J.; Chen, G.; Yuan, Q.; Luo, L.; Gonthier, Y. Hydrodynamics and mass transfer characteristics in gas-liquid flow through a rectangular microchannel. Chem. Eng. Sci. 2007, 62, 2096–2108. [Google Scholar] [CrossRef]
- Kirpalani, D.M.; Patel, T.; Mehrani, P.; Macchi, A. Experimental analysis of the unit cell approach for two-phase flow dynamics in curved flow channels. Int. J. Heat Mass Tranf. 2008, 51, 1095–1103. [Google Scholar] [CrossRef]
- Yue, J.; Luo, L.; Gonthier, Y.; Chen, G.; Yuan, Q. An experimental investigation of gas-liquid two-phase flow in single microchannel contactors. Chem. Eng. Sci. 2008, 63, 4189–4202. [Google Scholar] [CrossRef]
- Dessimoz, A.L.; Raspail, P.; Berguerand, C.; Kiwi–Minsker, L. Quantitative criteria to define flow patterns in micro-capillaries. Chem. Eng. J. 2010, 160, 882–890. [Google Scholar] [CrossRef]
- Roudet, M.; Loubiere, K.; Gourdon, C.; Cabassud, M. Hydrodynamic and mass transfer in inertial gas-liquid flow regimes through straight and meandering millimetric square channels. Chem. Eng. Sci. 2011, 66, 2974–2990. [Google Scholar] [CrossRef]
- Deendarlianto; Rahmandhika, A.; Widyatama, A.; Dinaryanto, O.; Widyaparaga, A.; Indarto. Experimental study on the hydrodynamic behavior of gas-liquid air-water two-phase flow near the transition to slug flow in horizontal pipes. Int. J. Heat Mass Tranf. 2019, 130, 187–203. [Google Scholar] [CrossRef]
- Wu, Z.; Sundén, B. Liquid-liquid two-phase flow patterns in ultra-shallow straight and serpentine microchannels. Heat Mass Transfer 2019, 55, 1095–1108. [Google Scholar] [CrossRef]
- Farokhpoor, R.; Liu, L.; Langsholt, M.; Hald, K.; Amundsen, J. Dimensional analysis and scaling in two-phase gas-liquid stratified pipe flow-methodology evaluation. Int. J. Multiph. Flow 2020, 122, 103139. [Google Scholar] [CrossRef]
- Zhao, Y.; Chen, G.; Yuan, Q. Liquid-liquid two-phase flow patterns in a rectangular microchannel. AIChE J. 2006, 52, 4052–4060. [Google Scholar] [CrossRef]
- Yagodnitsyna, A.A.; Kovalev, A.V.; Bilsky, A.V. Flow patterns of immiscible liquid-liquid flow in a rectangular microchannel with T-junction. Chem. Eng. J. 2016, 303, 547–554. [Google Scholar] [CrossRef]
- Baker, O. Design of pipelines for the simultaneous flow of oil and gas. In Proceedings of the Fall Meeting of the Petroleum Branch of AIME, Dallas, TX, USA, 19–21 October 1953; p. 323-G. [Google Scholar] [CrossRef]
- Sato, T.; Minamiyama, T.; Yanai, M.; Tokura, T.; Ito, Y. Study of heat transfer in boiling two-phase channel flow Part II, Heat transfer in the nucleate boiling region. Heat Tran. Jap. Res. 1972, 1, 15–30. [Google Scholar]
- Cubaud, T.; Mason, T.G. Capillary threads and viscous droplets in square microchannels. Phys. Fluids 2008, 20, 053302. [Google Scholar] [CrossRef]
- Akbar, M.K.; Plummer, D.A.; Ghiaasiaan, S.M. On gas-liquid two-phase flow regimes in microchannels. Int. J. Multiph. Flow 2003, 29, 855–865. [Google Scholar] [CrossRef]
- Kreutzer, M.T.; Kapteijn, F.; Moulijn, J.A.; Kleijn, C.R.; Heiszwolf, J.J. Inertial and interfacial effects on pressure drop of Taylor flow in capillaries. AIChE J. 2005, 51, 2428–2440. [Google Scholar] [CrossRef]
- Tsaoulidis, D.; Dore, V.; Angeli, P.; Plechkova, N.V.; Seddon, K.R. Flow patterns and pressure drop of ionic liquid-water two-phase flows in microchannels. Int. J. Multiph. Flow 2013, 54, 1–10. [Google Scholar] [CrossRef]
- Wright, R. Jamin effect in oil production. AAPG Bull. 1934, 18, 548–549. [Google Scholar] [CrossRef]
- Gibbs, J.W. On the equilibrium of heterogeneous substances. Am. J. Sci. 1878, 16, 441–458. [Google Scholar] [CrossRef]
- Wallis, G.B. The Transition from Flooding to Upwards Concurrent Annular Flow in a Vertical Pipe; UKAEA Report, AEEW–R–142; United Kingdom Atomic Energy Authority: Abingdon, UK, 1962.
- Dore, V.; Tsaoulidis, D.; Angeli, P. Mixing patterns in water plugs during water/ionic liquid segmented flow in microchannels. Chem. Eng. Sci. 2012, 80, 334–341. [Google Scholar] [CrossRef]
- Meyer, C.; Hoffmann, M.; Schlüter, M. Micro-PIV analysis of gas–liquid Taylor flow in a vertical oriented square shaped fluidic channel. Int. J. Multiph. Flow 2014, 67, 140–148. [Google Scholar] [CrossRef]
- Aland, S.; Lehrenfeld, C.; Marschall, H.; Meyer, C.; Weller, S. Accuracy of two phase flow simulations: The Taylor flow benchmark. In Proceedings of the 84th Annual Meeting of the International Association of Applied Mathematics and Mechanics (GAMM), Novi Sad, Serbia, 18 March 2013; pp. 595–598. [Google Scholar] [CrossRef]
- Kong, R.; Kim, S.; Bajorek, S.; Tien, K.; Hoxie, C. Effects of pipe size on horizontal two-phase flow: Flow regimes, pressure drop, two-phase flow parameters, and drift–flux analysis. Exp. Therm. Fluid Sci. 2018, 96, 75–89. [Google Scholar] [CrossRef]
- Butler, C.; Lalanne, B.; Sandmann, K.; Cid, E.; Billet, A.M. Mass transfer in Taylor flow: Transfer rate modelling from measurements at the slug and film scale. Int. J. Multiph. Flow 2018, 105, 185–201. [Google Scholar] [CrossRef]
- Yao, C.; Ma, H.; Zhao, Q.; Liu, Y.; Zhao, Y.; Chen, G. Mass transfer in liquid-liquid Taylor flow in a microchannel: Local concentration distribution, mass transfer regime and the effect of fluid viscosity. Chem. Eng. Sci. 2020, 223, 115734. [Google Scholar] [CrossRef]
- Kew, P.A.; Cornwell, K. Correlations for the prediction of boiling heat transfer in small-diameter channels. Appl. Therm. Eng. 1997, 17, 705–715. [Google Scholar] [CrossRef]
- Cubaud, T.; Ulmanella, U.; Ho, C.M. Two-phase flow in microchannels with surface modifications. Fluid Dyn. Res. 2006, 38, 772–786. [Google Scholar] [CrossRef]
- Kashid, M.N.; Agar, D.W. Hydrodynamics of liquid–liquid slug flow capillary microreactor: Flow regimes, slug size and pressure drop. Chem. Eng. J. 2007, 131, 1–13. [Google Scholar] [CrossRef]
- Kashid, M.N.; Harshe, Y.M.; Agar, D.W. Liquid-liquid slug flow in a capillary: An alternative to suspended drop or film contactors. Ind. Eng. Chem. Res. 2007, 46, 8420–8430. [Google Scholar] [CrossRef]
- Steijn, V.V.; Kreutzerb, M.T.; Kleijn, C.R. μ-PIV study of the formation of segmented flow in microfluidic T-junctions. Chem. Eng. Sci. 2007, 62, 7505–7514. [Google Scholar] [CrossRef]
- Harirchian, T.; Garimella, S.V. The critical role of channel cross-sectional area in microchannel flow boiling heat transfer. Int. J. Multiph. Flow 2009, 35, 904–913. [Google Scholar] [CrossRef]
- Niu, H.; Pan, L.; Su, H.; Wang, S. Flow pattern, pressure drop, and mass transfer in a gas-liquid concurrent two-phase flow microchannel reactor. Ind. Eng. Chem. Res. 2009, 48, 1621–1628. [Google Scholar] [CrossRef]
- Kashid, M.N.; Fernández Rivas, D.; Agar, D.W.; Turek, S. On the hydrodynamics of liquid-liquid slug flow capillary microreactors. Asia-Pac. J. Chem. Eng. 2008, 3, 151–160. [Google Scholar] [CrossRef]
- Fouilland, T.S.; Fletcher, D.F.; Haynes, B.S. Film and slug behaviour in intermittent slug–annular microchannel flows. Chem. Eng. Sci. 2010, 65, 5344–5355. [Google Scholar] [CrossRef]
- Ong, C.L.; Thome, J.R. Macro-to-microchannel transition in two-phase flow: Part 1–Two phase flow patterns and film thickness measurements. Exp. Therm. Fluid Sci. 2011, 35, 37–47. [Google Scholar] [CrossRef]
- Khaledi, H.A.; Smith, I.E.; Unander, T.E.; Nossen, J. Investigation of two-phase flow pattern, liquid holdup and pressure drop in viscous oil-gas flow. Int. J. Multiph. Flow 2014, 67, 37–51. [Google Scholar] [CrossRef]
- Gubbins, K.E.; Moore, J.D. Molecular modeling of matter: Impact and prospects in engineering. Ind. Eng. Chem. Res. 2010, 49, 3026–3046. [Google Scholar] [CrossRef]
- Wörner, M. Numerical modeling of multiphase flows in microfluidics and micro process engineering: A review of methods and applications. Microfluid Nanofluid 2012, 12, 841–886. [Google Scholar] [CrossRef]
- Keyes, D.E.; McInnes, L.C.; Woodward, C.; Gropp, W.; Myra, E.; Pernice, M.; Bell, J. Multiphysics simulations: Challenges and opportunities. Int. J. High. Perform. C 2013, 27, 4–83. [Google Scholar] [CrossRef]
- Hashim, U.; Diyana, P.N.A.; Adam, T. Numerical simulation of microfluidic devices. In Proceedings of the 10th IEEE International Conference on Semiconductor Electronics (ICSE), Kuala Lumpur, Malaysia, 19–21 September 2012; pp. 26–29. [Google Scholar] [CrossRef]
- Apte, S.V.; Mahesh, K.; Lundgren, T. A Eulerian-Lagrangian Model to Simulate Two-Phase/Particulate Flows. Center for Turbulence Research, Center for Turbu-lence Research, Annual Research Briefs. 2003, pp. 161–171. Available online: https://apps.dtic.mil/sti/citations/ADP014800 (accessed on 5 January 2021).
- Trapp, J.A.; Mortensen, G.A. A discrete particle model for bubble slug two-phase flow. J. Comput. Phy. 1993, 107, 367–377. [Google Scholar] [CrossRef]
- Delnoij, E.; Lammers, F.A.; Kuipers, J.A.M.; van Swaaij, W.P.M. Dynamic simulation of dispersed gas-liquid two-phase flow using a discrete bubble model. Chem. Eng. Sci. 1997, 52, 1429–1458. [Google Scholar] [CrossRef]
- Ye, M.; Van Der Hoef, M.A.; Kuipers, J.A.M. From discrete particle model to a continuous model of Geldart a particles. Chem. Eng. Res. Des. 2005, 83, 833–843. [Google Scholar] [CrossRef][Green Version]
- Pepiot, P.; Desjardins, O. Numerical analysis of the dynamics of two-and three-dimensional fluidized bed reactors using an Euler-Lagrange approach. Powder Technol. 2012, 220, 104–121. [Google Scholar] [CrossRef]
- Barbosa, M.V.; De Lai, F.C.; Junqueira, S.L.M. Numerical evaluation of CFD-DEM coupling applied to lost circulation control: Effects of particle and flow inertia. Math. Prob. Eng. 2019, 1–13. [Google Scholar] [CrossRef]
- Chen, S.; Doolen, G.D. Lattice Boltzmann method for fluid flows. Annu. Rev. Fluid Mech. 1998, 30, 329–364. [Google Scholar] [CrossRef]
- Frisch, U.; Hasslacher, B.; Pomeau, Y. Lattice-gas automata for the Navier-Stokes equation. Phys. Rev. Lett. 1986, 56, 1505–1508. [Google Scholar] [CrossRef] [PubMed]
- McNamara, G.R.; Zanetti, G. Use of the Boltzmann equation to simulate lattice-gas automata. Phys. Rev. Lett. 1988, 61, 2332–2335. [Google Scholar] [CrossRef]
- Chen, S.; Chen, H.; Martnez, D.; Matthaeus, W. Lattice Boltzmann model for simulation of magnetohydrodynamics. Phys. Rev. Lett. 1991, 67, 3776–3779. [Google Scholar] [CrossRef] [PubMed]
- Gunstensen, A.K.; Rothman, D.H. Lattice Boltzmann model of immiscible fluids. Phys. Rev. A 1991, 43, 4320–4327. [Google Scholar] [CrossRef] [PubMed]
- Grunau, D.; Chen, S.; Eggert, K. A lattice Boltzmann model for multiphase fluid flows. Phys. Fluids A Fluid 1993, 5, 2557–2562. [Google Scholar] [CrossRef]
- Shan, X.; Chen, H. Lattice Boltzmann model for simulating flows with multiple phases and components. Phys. Rev. A 1993, 47, 1815–1819. [Google Scholar] [CrossRef] [PubMed]
- Takada, N.; Misawa, M.; Tomiyama, A.; Fujiwara, S. Numerical simulation of two- and three-dimensional two-phase fluid motion by lattice Boltzmann method. Comput. Phys. Commun. 2000, 129, 233–246. [Google Scholar] [CrossRef]
- Inamuro, T.; Miyahara, T.; Ogino, F. Lattice Boltzmann simulations of drop deformation and breakup in a simple shear flow. In Computational Fluid Dynamics 2000; Satofuka, N., Ed.; Springer: Berlin/Heidelberg, Germany, 2001; pp. 499–504. [Google Scholar] [CrossRef]
- Seta, T.; Kono, K. Thermal lattice Boltzmann method for liquid-gas two-phase flows in two dimension. JSME Int. J. Ser. B Fluids Therm. Eng. 2004, 47, 572–583. [Google Scholar] [CrossRef]
- Komrakova, A.E.; Shardt, O.; Eskin, D.; Derksen, J.J. Lattice Boltzmann simulations of drop deformation and breakup in shear flow. Int. J. Multiph. Flow 2014, 59, 24–43. [Google Scholar] [CrossRef]
- Li, Q.; Luo, K.H.; Kang, Q.J.; He, Y.L.; Chen, Q.; Liu, Q. Lattice Boltzmann methods for multiphase flow and phase-change heat transfer. Prog. Energ. Combust. 2016, 52, 62–105. [Google Scholar] [CrossRef]
- Fei, L.; Du, J.; Luo, K.H.; Succi, S.; Lauricella, M.; Montessori, A.; Wang, Q. Modeling realistic multiphase flows using a non-orthogonal multiple-relaxation-time lattice Boltzmann method. Phys. Fluids 2019, 31, 042105. [Google Scholar] [CrossRef]
- Qin, F.; Mazloomi Moqaddam, A.; Kang, Q.; Derome, D.; Carmeliet, J. Entropic multiple-relaxation-time multirange pseudopotential lattice Boltzmann model for two-phase flow. Phys. Fluids 2018, 30, 032104. [Google Scholar] [CrossRef]
- Shi, Y.; Tang, G.H.; Lin, H.F.; Zhao, P.X.; Cheng, L.H. Dynamics of droplet and liquid layer penetration in three-dimensional porous media: A lattice Boltzmann study. Phys. Fluids 2019, 31, 042106. [Google Scholar] [CrossRef]
- Cui, Y.; Wang, N.; Liu, H. Numerical study of droplet dynamics in a steady electric field using a hybrid lattice Boltzmann and finite volume method. Phys. Fluids 2019, 31, 022105. [Google Scholar] [CrossRef]
- Katopodes, N.D. Free Surface Flow Computational Methods; Butterworth-Heinemann: Oxford, UK, 2018. [Google Scholar]
- Ketabdari, M.J. Free surface flow simulation using VOF method. In Numerical Simulation-from Brain Imaging to Turbulent Flows; IntechOpen: London, UK, 2016; pp. 365–398. [Google Scholar] [CrossRef]
- Osher, S.; Sethian, J.A. Fronts propagating with curvature dependent speed: Algorithms based on hamilton–jacobi formulations. J. Comput. Phys. 1988, 79, 12–49. [Google Scholar] [CrossRef]
- Fukagata, K.; Kasagi, N.; Ua-arayaporn, P.; Himeno, T. Numerical simulation of gas-liquid two-phase flow and convective heat transfer in a micro tube. Int. J. Heat Fluid Flow 2007, 28, 72–82. [Google Scholar] [CrossRef]
- Adalsteinsson, D.; Sethian, J.A. A fast level set method for propagating interfaces. J. Comput. Phys. 1995, 118, 269–277. [Google Scholar] [CrossRef]
- Adalsteinsson, D.; Sethian, J.A. The fast construction of extension velocities in level set methods. J. Comput. Phys. 1999, 148, 2–22. [Google Scholar] [CrossRef]
- Mahady, K.; Afkhami, S.; Kondic, L. A volume of fluid method for simulating fluid/fluid interfaces in contact with solid boundaries. J. Comput. Phys. 2015, 294, 243–257. [Google Scholar] [CrossRef]
- Osher, S.; Fedkiw, R.P. Level set methods: An overview and some recent results. J. Comput. Phys. 2001, 169, 463–502. [Google Scholar] [CrossRef]
- Thomas, S.; Esmaeeli, A.; Tryggvason, G. Multiscale computations of thin films in multiphase flows. Int. J. Multiph. Flow 2010, 36, 71–77. [Google Scholar] [CrossRef]
- Kolb, W.B.; Cerro, R.L. The motion of long bubbles in tubes of square cross section. Phys. Fluids A Fluid 1993, 5, 1549–1557. [Google Scholar] [CrossRef]
- Berčič, G.; Pintar, A. The role of gas bubbles and liquid slug lengths on mass transport in the Taylor flow through capillaries. Chem. Eng. Sci. 1997, 52, 3709–3719. [Google Scholar] [CrossRef]
- Brauner, N.; Maron, D.M.; Rovinsky, J. A two-fluid model for stratified flows with curved interfaces. Int. J. Multiph. Flow 1998, 24, 975–1004. [Google Scholar] [CrossRef]
- Fujioka, H.; Grotberg, J.B. The steady propagation of a surfactant-laden liquid plug in a two dimensional channel. Phys. Fluids 2005, 17, 082102. [Google Scholar] [CrossRef]
- Falconi, C.J.; Lehrenfeld, C.; Marschall, H.; Meyer, C.; Abiev, R.; Bothe, D.; Reusken, A.; Schlüter, M.; Wörner, M. Numerical and experimental analysis of local flow phenomena in laminar Taylor flow in a square mini-channel. Phys. Fluids 2016, 28, 012109. [Google Scholar] [CrossRef]
- Valizadeh, K.; Farahbakhsh, S.; Bateni, A.; Zargarian, A.; Davarpanah, A.; Alizadeh, A.; Zarei, M. A parametric study to simulate the non-Newtonian turbulent flow in spiral tubes. Energy Sci. Eng. 2020, 8, 134–149. [Google Scholar] [CrossRef]
- Abdollahi, A.; Norris, S.E.; Sharma, R.N. Fluid flow and heat transfer of liquid-liquid Taylor flow in square microchannels. Appl. Therm Eng. 2020, 172, 115123. [Google Scholar] [CrossRef]
- Xu, F.; Yang, L.; Liu, Z.; Chen, G. Numerical investigation on the hydrodynamics of Taylor flow in ultrasonically oscillating microreactors. Chem. Eng. Sci. 2021, 235, 116477. [Google Scholar] [CrossRef]
- Kumar, V.; Vashisth, S.; Hoarau, Y.; Nigam, K.D.P. Slug flow in curved microreactors: Hydrodynamic study. Chem. Eng. Sci. 2007, 62, 7494–7504. [Google Scholar] [CrossRef]
- Goel, D.; Buwa, V.V. Numerical simulations of bubble formation and rise in microchannels. Ind. Eng. Chem. Res. 2009, 48, 8109–8120. [Google Scholar] [CrossRef]
- Gupta, R.; Fletcher, D.F.; Haynes, B.S. On the CFD modelling of Taylor flow in microchannels. Chem. Eng. Sci. 2009, 64, 2941–2950. [Google Scholar] [CrossRef]
- Gupta, R.; Fletcher, D.F.; Haynes, B.S. CFD modelling of flow and heat transfer in the Taylor flow regime. Chem. Eng. Sci. 2010, 65, 2094–2107. [Google Scholar] [CrossRef]
- Satterfield, C.N.; Ózel, F. Some characteristics of two-phase flow in monolithic catalyst structures. Ind. Eng. Chem. Fund. 1977, 16, 61–67. [Google Scholar] [CrossRef]
- Lowe, D.C.; Rezkallah, K.S. Flow regime identification in microgravity two-phase flows using void fraction signals. Int. J. Multiph. Flow 1999, 25, 433–457. [Google Scholar] [CrossRef]
- Kreutzer, M.T. Hydrodynamics of Taylor Flow in Capillaries and Monoliths Channels. Ph.D. Thesis, Delft University of Technology, Delft, The Netherlands, 2003. [Google Scholar]
- Zhang, M.; Pan, L.M.; Ju, P.; Yang, X.; Ishii, M. The mechanism of bubbly to slug flow regime transition in air-water two phase flow: A new transition criterion. Int. J. Heat Mass Tranf. 2017, 108, 1579–1590. [Google Scholar] [CrossRef]
- Bottin, M.; Berlandis, J.P.; Hervieu, E.; Lance, M.; Marchand, M.; Öztürk, O.C.; Serre, G. Experimental investigation of a developing two-phase bubbly flow in horizontal pipe. Int. J. Multiph. Flow 2014, 60, 161–179. [Google Scholar] [CrossRef]
- Govier, G.W.; Aziz, K. The Flow of Complex Mixtures in Pipes; Van Nostrand Reinhold Company: New York, NY, USA, 2008. [Google Scholar]
- Taitel, Y.; Bornea, D.; Dukler, A.E. Modelling flow pattern transitions for steady upward gas-liquid flow in vertical tubes. AIChE J. 1980, 26, 345–354. [Google Scholar] [CrossRef]
- Barnea, D.; Shoham, O.; Taitel, Y. Flow pattern transition for downward inclined two-phase flow; horizontal to Vertical. Chem. Eng. Sci. 1982, 37, 735–740. [Google Scholar] [CrossRef]
- Barnea, D.; Shoham, O.; Taitel, Y. Flow pattern transition for vertical downward two-phase flow. Chem. Eng. Sci. 1982, 37, 741–744. [Google Scholar] [CrossRef]
- Dukler, A.E.; Taitel, Y. Flow pattern transitions in gas-liquid systems: Measurement and modeling. In Multiphase Science and Technology; Springer: Berlin/Heidelberg, Germany, 1986; pp. 1–94. [Google Scholar] [CrossRef]
- Andreussi, P.; Paglianti, A.; Silva, F.S. Dispersed bubble flow in horizontal pipes. Chem. Eng. Sci. 1999, 54, 1101–1107. [Google Scholar] [CrossRef]
- Radovcich, N.A.; Moissis, R. The Transition from Two Phase Bubble Flow to Slug Flow. Department of Mechanical Engineering, Massachusetts Institute of Technology, Report No. 7–7673–22. 1962. Available online: https://dspace.mit.edu/bitstream/handle/1721.1/11439/33322807-MIT.pdf?sequence=2 (accessed on 5 January 2021).
- Mishima, K.; Ishii, M. Flow regime transition criteria for upward two-phase flow in vertical tubes. Int. J. Heat Mass Tranf. 1984, 27, 723–737. [Google Scholar] [CrossRef]
- Kelessidis, V.C.; Dukler, A.E. Modeling flow pattern transitions for upward gas-liquid flow in vertical concentric and eccentric annuli. Int. J. Multiph. Flow 1989, 15, 173–191. [Google Scholar] [CrossRef]
- Brauner, N.; Moalem Maron, D. Stability analysis of stratified liquid-liquid flow. Int. J. Multiph. Flow 1992, 18, 103–121. [Google Scholar] [CrossRef]
- Das, R.K.; Pattanayak, S. Bubble to slug flow transition in vertical upward two-phase flow through narrow tubes. Chem. Eng. Sci. 1994, 49, 2163–2172. [Google Scholar] [CrossRef]
- Cheng, H.; Hills, J.H.; Azzorpardi, B.J. A study of the bubble-to-slug transition in vertical gas-liquid flow in columns of different diameters. Int. J. Multiph. Flow 1998, 24, 431–452. [Google Scholar] [CrossRef]
- Hibiki, T.; Ishii, M. Two-group interfacial area transport equations at bubbly-to-slug flow transition. Nucl. Eng. Des. 2000, 202, 39–76. [Google Scholar] [CrossRef]
- Hibiki, T.; Mishima, K. Flow regime transition criteria for upward two-phase flow in vertical narrow rectangular channels. Nucl. Eng. Des. 2001, 203, 117–131. [Google Scholar] [CrossRef]
- Wang, T.; Wang, J.; Jin, Y. Theoretical prediction of flow regime transition in bubble columns by the population balance model. Chem. Eng. Sci. 2005, 60, 6199–6209. [Google Scholar] [CrossRef]
- Das, A.K.; Das, P.K.; Thome, J.R. Transition of bubbly flow in vertical tubes: New criteria through CFD simulation. ASME J. Fluids Eng. 2009, 131, 091303. [Google Scholar] [CrossRef]
- Das, A.K.; Das, P.K.; Thome, J.R. Transition of bubbly flow in vertical tubes: Effect of bubble size and tube diameter. ASME J. Fluids Eng. 2009, 131, 091304. [Google Scholar] [CrossRef]
- Wang, X.; Sun, X.; Doup, B.; Zhao, H. Dynamic modeling strategy for flow regime transition in gas-liquid two-phase flows. J. Comput. Multiph. Flow 2012, 4, 387–397. [Google Scholar] [CrossRef]
- Song, Y.; Xin, F.; Guangyong, G.; Lou, S.; Cao, C.; Wang, J. Uniform generation of water slugs in air flowing through superhydrophobic microchannels with T-junction. Chem. Eng. Sci. 2019, 199, 439–450. [Google Scholar] [CrossRef]
- Akagawa, K.; Sakaguchi, T. Fluctuation of void ratio in two-phase flow: 2nd report, analysis of flow configuration considering the existence of small bubbles in liquid slugs. Bull. JSME 1966, 9, 104–110. [Google Scholar] [CrossRef]
- Fernandes, R.C. Experimental and Theoretical Studies of Isothermal Upward Gas-Liquid Flows in Vertical Tubes. Ph.D. Thesis, University of Houston, Houston, TX, USA, 1981. [Google Scholar]
- Han, W.; Chen, X. Numerical simulation of the droplet formation in a T-junction microchannel by a level-set method. Aust. J. Chem. 2018, 71, 957–964. [Google Scholar] [CrossRef]
- Qian, J.Y.; Chen, M.R.; Wu, Z.; Jin, Z.J.; Sunden, B. Effects of a dynamic injection flow rate on slug generation in a cross-junction square microchannel. Processes 2019, 7, 765. [Google Scholar] [CrossRef]
- Laborie, S.; Cabassud, C.; Durand–Bourlier, L.; Lainé, J.M. Characterisation of gas-liquid two-phase flow inside capillaries. Chem. Eng. Sci. 1999, 54, 5723–5735. [Google Scholar] [CrossRef]
- Broekhuis, R.R.; Machado, R.M.; Nordquist, A.F. The ejector-driven monolith loop reactor-experiments and modelling. Catal. Today 2001, 69, 87–93. [Google Scholar] [CrossRef]
- Garstecki, P.; Fuerstman, M.; Stone, H.; Whitesides, G. Formation of droplets and bubbles in a microfluidic T-junction-scaling and mechanism of break-up. Lab. Chip 2006, 6, 437–446. [Google Scholar] [CrossRef]
- Sobieszuk, P.; Cygański, P.; Pohorecki, R. Bubble lengths in the gas-liquid Taylor flow in microchannels. Chem. Eng. Res. Des. 2010, 88, 263–269. [Google Scholar] [CrossRef]
- Chaoqun, Y.; Yuchao, Z.; Chunbo, Y.; Minhui, D.; Zhengya, D.; Guangwen, C. Characteristics of slug flow with inertial effects in a rectangular microchannel. Chem. Eng. Sci. 2013, 95, 246–256. [Google Scholar] [CrossRef]
- Miki, Y.; Matsumoto, S.; Kaneko, A.; Abe, Y. Formation behavior of two-phase slug flow and pressure fluctuation in a microchannel T-junction. Jap. J. Multiph. Flow 2013, 26, 587–594. [Google Scholar] [CrossRef]
- Xu, B.; Cai, W.; Liu, X.; Zhang, X. Mass transfer behavior of liquid-liquid slug flow in circular cross-section microchannel. Chem. Eng. Res. Des. 2013, 91, 1203–1211. [Google Scholar] [CrossRef]
- Abiev, R.S. Modeling of pressure losses for the slug flow of a gas-liquid mixture in mini- and microchannels. Theor. Found. Chem. Eng. 2011, 45, 156–163. [Google Scholar] [CrossRef]
- Coleman, J.W.; Garimella, S. Characterization of two-phase flow patterns in small diameter round and rectangular tubes. Int. J. Heat Mass Transf. 1999, 42, 2869–2881. [Google Scholar] [CrossRef]


Publisher’s Note: MDPI stays neutral with regard to jurisdictional claims in published maps and institutional affiliations. |
© 2021 by the authors. Licensee MDPI, Basel, Switzerland. This article is an open access article distributed under the terms and conditions of the Creative Commons Attribution (CC BY) license (https://creativecommons.org/licenses/by/4.0/).