Abstract
When the Lithium-ion battery operates at high temperature, it would bring about short circuit; if it reaches a critical temperature, it will explode. It is important to reduce its maximum temperature by appropriate heat transfer technique. When it operates without an external force for cooling, it needs natural convection technique to take away heat dissipation. Therefore, this study numerically examines three-dimensional transient natural convection of cylindrical lithium-ion batteries inside a rectangular pack with air between cylinders. The heat transfer technique in this study applies PCM (phase change material) between cylinders without or with fin array on top changing distance between cells. The results indicated that for no fin array, the package adopting the PCM could achieve the peak temperature 14.2 °C smaller than the package adopting the air. However, the package adopting the PCM with fin array vertical to the top of the package can best enhance average Nusselt number by 120% compared with using air and no fin array. Replacing the air by the PCM can keep the peak temperature of the batteries within the desirable operation range.
1. Introduction
Alternate power source such as Lithium-ion battery, fuel cell, solar energy, and so on, plays an irreplaceable and indispensable role in the perspective of environmental preservation. Among power sources mentioned above, Lithium-ion battery had the potential to be a promising technology to fulfill the achievement of renewable and sustainable energy in the near future [1].
Since there was a high energy density in the Lithium-ion battery, it might cause the batteries in danger of thermal runway. Researchers pointed out that Lithium-ion battery might bring about short circuit as the batteries operated at high temperature. Under these circumstances, Lithium-ion batteries might encounter a series of thermal runaway reaction. When they reached the critical temperature point, Lithium-ion batteries would likely explode [2]. Therefore, thermal control is crucial to the development of Lithium-ion battery. Taheri et al. [3] simulated the behavior of heat generation for prismatic Lithium-ion batteries. Thermal control problems for given various cooling conditions at its surfaces was encountered in Lithium-ion batteries. They set natural convection coefficient h (5, 10, 15, 20, and 30 W/m2·K) and calculated Biot number. When Biot number was lower than 0.1, the conduction heat transfer rate would be very faster than convective heat transfer rate at the surface. The discrepancy amid the center and the surface temperature was negligible when Bi number was higher than 0.1. It was thus essential to assess the temperature difference in the issues of the battery design. Michael et al. [4] analyzed electric vehicles, hybrid electric vehicles with the cost of energy density, and electronic storage systems. Their results showed that Lithium-ion batteries were highly recommended for the renewable transportation use. Wang et al. [5] developed a 3D CFD cylindrical battery pack modeling with forced air cooling and operated in narrow optimal range for investigating the effect of different cell arrangement structures including hexagonal, circular, and cubic arrangement. They observed that the fan placed at the top of the package exhibited the highest heat transfer performance and when adopting forced air cooling, the cubic arrangement represented the trade–off structure between the cooling capability and cost. Mohammadian et al. [6] studied 3D transient convective to explore prismatic Li-ion cells module with pin array in an air-cooling system. Heights of the pin array increased with increasing the duct width. Their results indicated that when it was compared to without pin array, the pin array could decrease the overall temperature inside the battery with pin array.
Most of the lithium cells are cylindrical in electrical vehicle application [7] because the cylinder gives good electrode surface relative to the amount of contained matter and produces heat, which causes heat transfer problems in various applications. There are various kinds of heat transfer problems for flow past heated cylinders in different heat dissipation devices. Jue et al. [8] examined drag coefficient and Nusselt number of mixed convection across three heated cylinders in a channel, and found that the overall averaged Nusselt number reached the maximum value at spacing over diameter ratio equal to 0.75 among the spacing over diameter ratios (0.5 to 1.25). Deka et al. [9] investigated transient natural convection across an infinite perpendicular cylinder with constant heat flux at the cylinder surface. Their results indicated that the temperature as well as velocity increased limitlessly with increasing time when the concentration approached the steady situation at greater periods. Wu et al. [10] explored how transient mixed convection amid circular cylinders and duct surfaces affected heat transfer in a horizontal duct. When the spacing amid cylinders was kept fixed, the overall mean Nusselt number of mixed convection was higher than that of forced convection. In addition, the heat transfer analysis on cylindrical heat source via PCM or fins with PCM has been reported by several studies. Rosler and Bruggemann [11] performed computation and experiment to analyze the heat storage of paraffin wax within a shell tube space. Al-Abidi et al. [12] experimentally explored how the intake temperature and flow rate affected the steady and transient thermal transfer in the PCM melting process in a triplex tube heat exchanger with fins. They discovered that the intake temperature affected the PCM melting process more. Nomura et al. [13] built PCM of erythritol in direct-contact thermal apparatus, used a heat transfer oil (HTO) for speeding heat storage, and found that greater HTO flow rate and inlet temperature could rapidly store thermal energy. Mat et al. [14] numerically studied how fin length of interior, exterior, and interior- exterior fin techniques enhanced the heat transfer for thermal apparatus adopting PCM. Their results depicted that the melting period of using a triplex tube with interior- exterior fins dropped to 43.3% against the triplex tube with no fins.
A phase change material has been investigated within the battery module to absorb the heat dissipation for reducing the cell temperature during melting progression. Ling et al. [15] proposed an integrated setup combining PCMs, adopting forced convective heat transfer, and found that this integrated system prevented thermal collection and maintained the peak temperature below 50 °C. Rao et al. [16] examined the thermal response of cylindrical power battery for EV with a three-dimensional simulation model utilizing PCM. The PCM using thermal conductivity higher than 0.8 m−1 K−1 could substantially decrease the peak temperature within battery pack below 223 K at a constant heat production rate of 170,000 W m−3 for heat transfer enhancement. The thermal management using PCM was then recommended for heat dissipation due to the fact that PCM could reserve abundant energy when the battery discharged and released heat to the ambient air. Parsons [17] designed a Lithium-ion battery module in an unmanned vehicle and simulated the transient thermal performance under the buoyancy-driven natural convection to compare the PCM with the air. His results indicated that the peak temperature of batteries could decline amid 338.7 K and 323.4 K after 630 s at peak power of 3600 watts. The passive thermal management was then beneficial for the purpose of limiting a rise in temperature among batteries. Hussain et al. [18] experimentally investigated how nickel foam-paraffin combination affected the temperature of lithium ion batteries in a line arrangement. They observed that applying the nickel foam-paraffin combination showed a temperature decrease about 31% than using natural air convection mode and 24% than using pure PCM cooling mode under 2 C rate of discharge. Tay et al. [19] used a numerical method to develop a tube-in-shell PCM system and validated through experimental results. Niu et al. [20] compared thermal transfer of prismatic battery module with small thermal conductivity of PCM, small thermal conductivity of material, and high-thermal-conductive pad. They found that modules with PCM through small thermal conductivity acquired the minimum average cell temperature. The greater the width of PCM through small thermal conductivity was, the smaller the average cell temperature became. Huang et al. [21] numerically and experimentally explored maximum temperature of a battery module employing PCM. Their results illustrated that paraffin metal foam exhibited the smallest maximum temperature for a battery module. Wang et al. [22] used PCM nano-emulsions to estimate the maximum temperature of lithium-ion battery package. They discovered that the maximum temperature declined with raising the cooling flow rate. The PCM nano-emulsions obtained maximum temperature lower than water.
Materials such as salt hydrates, fatty acids, esters, and paraffin are the common PCM. The selection of the suitable PCM and the knowledge of its thermo-properties for each application played a significant part in heat transfer enhancement techniques. It is also an essential factor to the selection of passive heat management devices [23,24]. For PCM used in heat transfer enhancement for cylindrical batteries inside a pack, the above cited references only focused on forced convection inside a rectangular pack without fin array or natural convection inside a rectangular or non-rectangular pack without fin array. The fin array by forced convection can take away more heat by way of airstreams generated through fans while this cooling device uses more energy and is limited by the fan life. When no huge heat dissipation occurs in electronic devices, natural convection is therefore adopted [25]. Therefore, the aim of the current study is to examine transient natural convection of nine upright cylindrical batteries at constant discharge rate (2 C) with constant heat source under natural convection with air or PCM between cylinders inside a rectangular pack with or without fin array on top under different distances between cylinders. The different above cases were compared by this work further to discuss the temperature distribution and heat transfer among them.
2. Numerical Method and Geometry
At present, a numerical approach has been a useful tool to develop the heat and fluid flow simulation as electronic appliances became more and more important. With the heat and fluid flow simulation, an initial design can be examined and evaluated quickly. The numerical simulation of the PCM melting with 3D Navier-Stokes for VOF and energy equations are resolved by a SIMPLE algorithm [26]. The convergence criterion requires that the scaled residuals drop to 10−3 for all equations except that the scaled residuals is 10−6 for the energy.
2.1. Mathematical Formulation
In the present study, the heat transfer for heat-sources inside a rectangular pack are considered in the following conditions: (1) three dimension (2) laminar fluid flow (3) transient status (4) gravity field (5) natural convective heat transfer (6) symmetric calculation domain (7) no interaction between the PCM and the air. The gravity treatment is adopted by Boussinesq approximation [27].
In the heat transfer for heat-sources, a single-region technique is employed to solve the natural convection question considering fluid and cylindrical heat source with volumetric heat generation, 88,914 (W/m3) inside a rectangular pack as one region in which no internal boundary conditions have to exist. For the natural convective problem, the governing equations made of the continuity, momentum, and energy conservation equations are mentioned in the following:
(1) Continuity Equation
in which is the volumic fraction of the nth fluid within the computational regio, is Cartesian coordinate, and t denotes time.
(2) Momentum Equation
where denotes velocity components, represents dynamic viscosity, is density, and is the source. The gravity treatment for fluid in y direction is adopted by Boussinesq approximation [27].
(3) Energy Equation
where denotes thermal conductivity, represents specific enthalpy, and contains volumetric heat sources.
For the control volume composed of N phase, the volume-fraction-averaged density, dynamic viscosity, and thermal conductivity are given by the following equations.
The PCM enthalpy is written to be the summation of the sensible enthalpy and the enthalpy change , where the sensible enthalpy is defined as follows:
where is referred enthalpy, referred temperature, and specific heat.
For the melting process, the enthalpy change is written below.
where represents the liquid fraction and L denotes the latent heat of the material for the melting progression. The liquid fraction is expressed in the following:
- if T < Tsolid.
- if T > Tliquid.
- if Tsolids < T < Tliquid.
The source item in the momentum conservation equation is defined as follows.
where C is a constant applied in the present study and the constant is to prevent zero in the equation. is the porosity function defined by reference [28]. The source term is calculated when the is greater than zero.
Describing the PCM–air system through a moving interior surface with no permeation amid the two fluids could be established on the volume-of-fluid (VOF) method [29]. Three conditions are mentioned below:
- αn = 0 for the control volume which is void in the nth fluid;
- αn = 1 for the control volume which is filled in the nth fluid;
- 0 < αn < 1 for the control volume which comprises the surface amid the nth fluid and at least one other fluids.
The local Nusselt number is calculated as follows.
where D represents the diameter of cylinder, wall temperature, and the fluid temperature.
The average Nusselt number is then obtained by Equation (12).
2.2. Geometry Model
The geometry cases in Figure 1a are for case A (air between cylinders inside a rectangular pack without fin array) or case B (PCM between cylinders inside a rectangular pack without fin array) while the other ones in Figure 1b are for case C (air between cylinders inside the rectangular pack with fin array on top) or case D (PCM between cylinders inside a rectangular pack with fin array on top). The reason for choosing fin array on top is that.
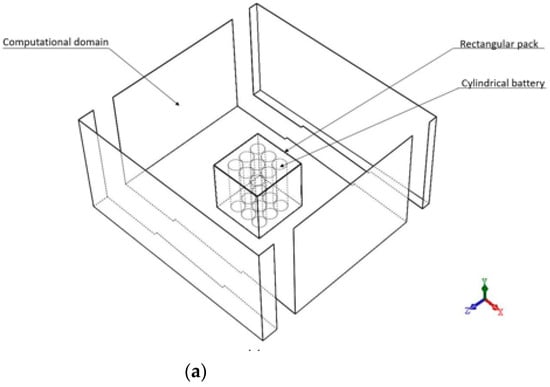
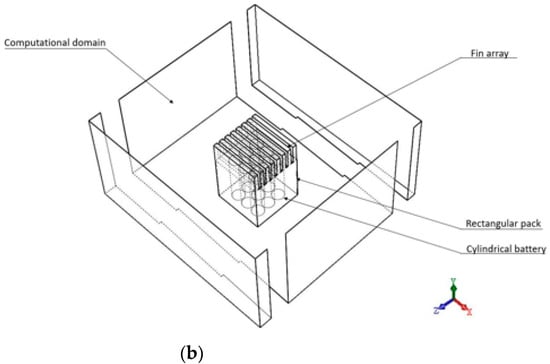
Figure 1.
Full heat sources inside a rectangular pack modelled (a) cases A and B (b) cases C and D.
The fin-channel is parallel with the direction of buoyancy-driven flow to enhance heat transfer. The difference among the four cases is the material between cylinders and fin array. The material between cylinders and the pack in case A and case C is the air while that in case B and case D is the PCM. The cases C and D both have fin array on the top of the rectangular pack. To minimize the computational memory requirements and time, this study modelled only one-fourth of the heat sources inside a rectangular pack due to bisymmetrical geometry as the domain boundary are shown in Figure 2a,b. The origin point is located in the middle position of the heat sources inside a rectangular pack within the computational domain. In Figure 2b, the rectangular pack is length of 50 mm, width of 50 mm, and height of 69 mm; and the fin array has 7 plate fins with length of 50 mm, width of 3.7 mm, and height of 13.8 mm. The computational region is highly stretched to procure the natural convective entrance conditions for the heat sources inside a rectangular pack. Some preceding runs have been conducted as far as the farther spread of computational region has alleviated influences on the thermal convection phenomenon. The geometrical sizes of the computational region are finally set to be L/l = 5, H/h = 5.2 and W/w = 5. In the present computation, the transient state 3D laminar thermal fluid flows adopting presumed Newtonian fluid. Type 18650 was selected as the Lithium-ion Battery in this work. The battery comes as a standard cylinder with 18 mm diameter × 65 mm height. The parameters of the Lithium-ion battery at fixed discharge rate (2 C) are referred to Table 1. As mentioned in the previous section, the filled material between cylinders for Case B and Case D is the PCM. The air spacing was set by 1 mm for the volume change for the accommodation of the expanded volume correlated the phase change proceeding. Table 2 summarizes the properties of N-eicosane (PCM), aluminum and the air. The density and viscosity of the solid PCM are changed with the temperature. The density of air is also varied with the temperature, but smaller than that of N-eicosane.
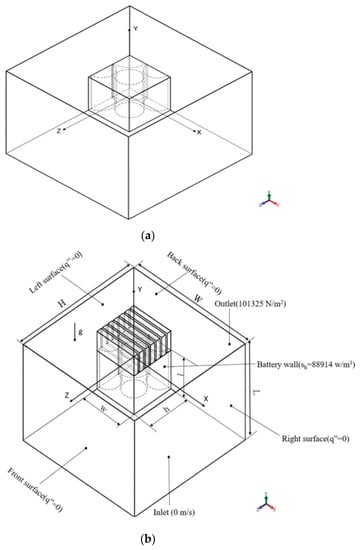
Figure 2.
One-fourth of heat sources inside a rectangular pack modelled (a) case A and B (b) cases C and D.

Table 1.
Parameters and properties of the Li-ion Battery.
Table 2.
Properties of PCM, aluminum, and air.
2.3. Initial and Boundary Conditions
At the start of the simulation, the ambient and operating temperatures of the cylinders inside the rectangular pack were initialized at the temperature of 30.15 °C. The boundary conditions of the rectangular pack comprise velocity-inlet, pressure-outlet, symmetric planes, and right wall (for example, Figure 2b). The boundary conditions are summarized as follows: computational domain: velocity-inlet: 0 m/s, pressure-outlet: the given pressure, 101,325 (N/m2); symmetric planes: zero heat flux; right surface: zero heat flux.
2.4. Grid Independence Test
With nearest grids around batteries surface in cross section at middle plane (x-z plane, y = 0), the average Nusselt number is acquired to understand the thermal transfer performance of different cylindrical batteries in a rectangular pack. This study built the numerical grid at mesh 1 of 285,066, mesh 2 of 410,535, and mesh 3 of 500,389 in order to verify the grid independence. Among the three types of grids under the same boundary conditions, the differences of maximum temperature between mesh 2 and mesh 3 are within 0.4% as shown in Figure 3a. The differences of average Nusselt number between mesh 2 and mesh 3 are within 1% as shown in Figure 3b. Mesh 2 was therefore chosen based on simulation accuracy and computational efficiency requirements.
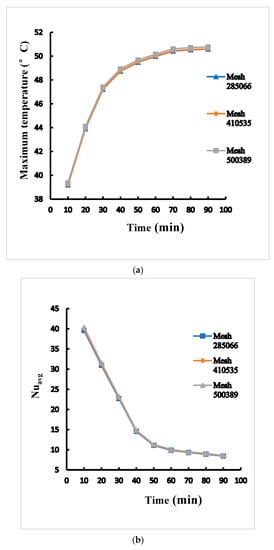
Figure 3.
Mesh independent test of (a) the maximum temperature (b) average Nusselt number for case B adopting 1 mm between cylinders.
2.5. Time Step Validation
The time step plays a pivotal part for the numerical divergence. Larger time step will result in numerical divergence and low accuracy of simulation. Among time steps of 0.04 s, 0.05 s, and 0.06 s under the same boundary conditions, the difference of maximum temperature for time steps ranging from 0.05 s to 0.04 s is within 0.4% as shown in Figure 4a. The difference of average Nusselt number for time steps ranging from 0.05 s to 0.04 s is also within 0.8% as shown in Figure 4b. The time step 0.05 s is then chosen. Figure 5 displays the comparison between the results of the present method and Parsons [17] for maximum temperature versus time of a Lithium-ion battery inside a pack each battery with heat production rate of 21.97 W within the enclosure of the phase change material and expanded graphite. It can be found that the comparison shows fairly agreeable.
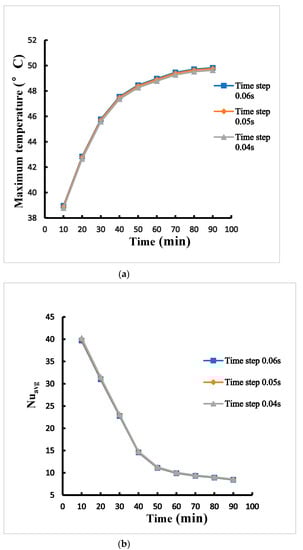
Figure 4.
Time-step independence test for (a) the maximum temperature (b) average Nusselt numberthe maximum temperature profiles of case B adopting 1 mm between cylinders.
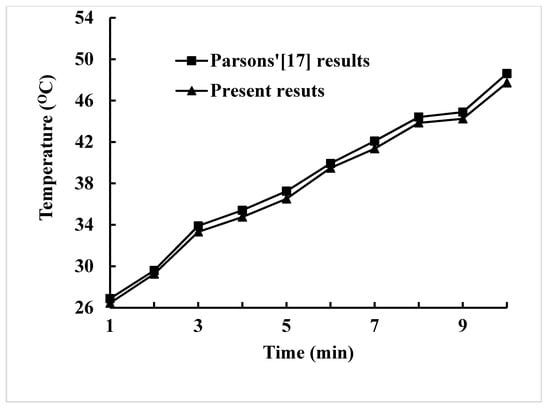
Figure 5.
Comparison of the maximum temperature between the present method and Parsons [17].
3. Results and Discussion
3.1. Influence of Inter-Cylinder Distance on Maximum Temperature and Heat Transfer
Performance
Table 3 lists the maximum temperature of cylinders inside a rectangular pack at 90 min for the four various cases with six different inter-cylinder distances. These different inter-cylinder distances range from 1 mm to 6 mm with an increment of 1 mm for this work (natural convection) while Wang et al. [5] studied inter-cylinder distances of 0, 0.5, 1, 2, and 3 mm for forced air convection. They concluded that as the distance was smaller, the greater fan power was needed to raise airflow speed, and the trade-off inter-cylinder distance was 1 mm for cost and heat transfer performance. However, this work adopted 1 mm as the minimum inter-cylinder distance instead of 0 mm to allow enough fluid upward due to buoyancy effect. With the same inter-cylinder distances, the maximum temperature among batteries for case A is the largest caused by the poorest nature convection due to the lowest density medium and smallest heat dissipating area, whereas that of batteries for case D is the smallest resulted from the best nature convection because of the greatest density medium and greater heat dissipating area. Case D has better decreasing change percentage of maximum temperature relative to case A than the other cases. It can be found that for case C, the decreasing change percentage of maximum temperature relative to case A with inter-cylinder distance is more obvious than the other cases. This is because the maximum temperature with inter-cylinder distance is almost the same for case C, but the peak temperature of case A for inter-cylinder distance of 1 mm is higher than that for the other inter-cylinder distances. Furthermore, the smaller inter-cylinder distance has the better decreasing change rate of the maximum temperature relative to case A up to 23.4% occurring in case D. When the discharge rate of battery rise, this increase will be obvious due to greater temperature gradient. Therefore, cases under the smallest inter-cylinder distance (1 mm) will be discussed in the following.
Table 3.
Maximum temperature of batteries at 90 min for four various cases with six different inter-cylinder distances (the value in parentheses representing decreasing change percentage relative to case A).
3.2. Effect of Fin Array on Temperature and Liquid Fraction Contours
Figure 6a shows the temperature contour of cross-sectional view of case B under inter-cylinder distance of 1 mm at the transient time equal to 50 min on the x-z plane. It can be observed that the greatest temperature occurs at the middle one of batteries, and the innermost cylinder has the greatest temperature caused by the accumulation of heats produced by itself and the surrounding batteries. Figure 6b depicts the temperature contour of cross-sectional view of case D under inter-cylinder distance of 1 mm at the transient time of 50 min on the x-z plane. The highest temperature is about 48 °C with the average temperature of 46 °C. Case D has a more low-temperature area inside and outside the cylinders than case B due to fin array having a greater extended area parallel to the direction of natural convective heat transfer caused by buoyancy effect. Figure 7a indicates the liquid fraction contour of case of cross-sectional view of case B under inter-cylinder distance of 1 mm at the transient time of 50 min on the x-z plane. At time equal to 50 min, the phase change medium expands to all filling space around all cylinders when the maximum temperature of each cylinder reaches 46 °C. Figure 7b displays the liquid fraction contour of case of cross-sectional view of case D under inter-cylinder distance of 1 mm at the transient time of 50 min on the x-z plane. Case B begins to produce a liquid phase at 30 min while case D begins to produce a liquid phase at 35 min. The reason why case B is 5 min earlier than case D to produce a liquid phase is that the temperature of case B is higher than that of case D because of the worse PCM cooling between cylinders with a lower dissipating area. Therefore, phase change of case B occurs at a greater area around all the cylinders as depicted in Figure 7a. Figure 8a illustrates the temperature contour of cross-sectional view of case B under inter-cylinder distance of 1 mm at the transient time of 90 min on the x-z plane. The highest temperature of case B is above 49 °C and occurs at the middle one of cylinders. Figure 8b depicts the temperature contour of cross-sectional view of case D under inter-cylinder distance of 1 mm at the transient time stage of 90 min on the x-z plane. The maximum temperature of case D is above 48 °C. Case D has greater zone of low temperature near out edges than case B due to a greater dissipating area. Figure 9a displays the liquid fraction contour of case of cross-sectional view of case B under inter-cylinder distance of 1 mm at the transient time stage of 90 min on the x-z plane. There are a greater area entering liquid fraction of 1 when the time is at 90 min because the maximum temperature is greater than the melting temperature of 48 °C. It can be concluded that if the cylinder temperature is equal to the melting temperature of the PCM, it will melt with a rise in cylinder temperature. Figure 9b indicates the liquid fraction profile of cross-sectional view of case D under inter-cylinder distance of 1 mm at the transient time of 90 min on the x-z plane. Case D has a smaller area of higher liquid fraction than case B due to a greater dissipating area.
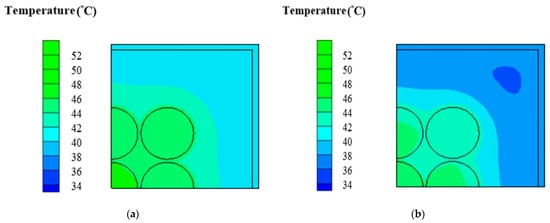
Figure 6.
Temperature profile of (a) case B (b) case D adopting 1 mm amid cylinders on the x-z plane at 50 min.

Figure 7.
Liquid fraction profile of (a) case B (b) case D under 1 mm amid cylinders on the x-z plane at 50 min.
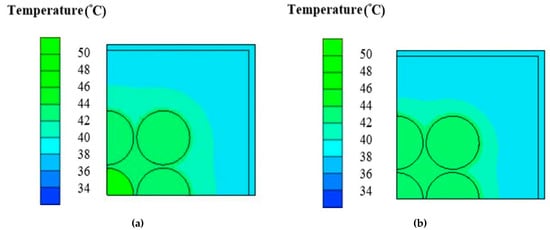
Figure 8.
Temperature profile of (a) case B (b) case D under 1 mm amid cylinders on the x-z plane at 90 min.
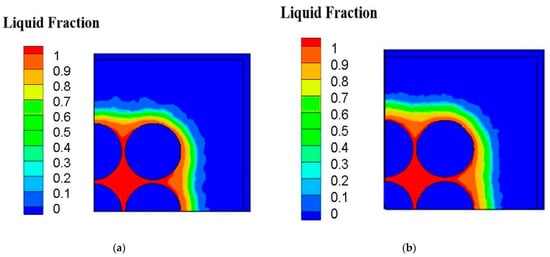
Figure 9.
Liquid fraction profile of (a) case B (b) case D under 1 mm amid cylinders on the x-z plane at 90 min.
3.3. Variation of Maximum Temperature and Heat Transfer Performance
Figure 10a compares the maximum temperature among A, B, C and D cases adopting 1 mm amid cylinders. For case B, the relative difference of maximum temperature of 60 min to 50 min is 0.99% and of 70 to 60 min 0.90%. The declined trends of the both relative differences report that the maximum temperature field begins to balance. Next, compared to 80 min, the relative temperature difference at 90 min is 0.036%. It could be found that the maximum temperature of case B approaches the steady state. For other cases, the maximum temperature also approaches the steady state at 90 min. Furthermore, this figure illustrates that of case B has convection performance far better than case A. The rectangular pack using the PCM between cylinders without fin array can greatly decrease the overall maximum temperature because the PCM has a higher thermal conductivity and density than the air. Under these circumstances, the PCM can dissipate more heat to the exterior aluminum surface of the rectangular pack. With the PCM, the peak temperature of the batteries drops from 64.84 °C of case A to 50.6 °C of case B. The case B can reduce the overall temperature about 14.2 °C. On the other hand, the highest temperature of case C is about 59 °C and 49.6 °C for case D. The temperature difference between case C and case D approximates 9.4 °C. It can be observed in this figure that case A always exhibits the highest temperature while the lowest temperature occurs in case D. Figure 10b compares average values of Nsselt number among A, B, C and D cases adopting 1 mm amid cylinders. This figure displays that case D has the greatest heat transfer performance among four different cases. Furthermore, the average Nusselt number of case D is greater than that of case A by 120% at all times. This is because PCM has higher thermal conductivity and convective heat transfer than air, and the extended surface area increases the convective heat transfer. It is obvious that since the cylindrical batteries inside a pack with fin array improve the heat transfer effect due to a greater dissipating area, both the overall temperatures of cases C and D are lower than those of cases A and B. Therefore, with the fin array, the cylindrical batteries could have a significant effect of the decrease in the overall temperature. Figure 11 displays three-dimensional temperature profile of A and D cases adopting 1 mm amid cylinders at 90 min. The maximum temperature in each cylinder occurs at the vertical middle area, which is similar to that of reference [16]. In particular, the vertical middle area inside the innermost cylinder for case A has the higher maximum temperature than that for case D. It is evident that overall temperature of case A is much greater than that of case D because PCM has higher thermal conductivity and convection, and the stretched surface area raises the convective heat transfer. This can be explained by the streamline patterns on xy section tangent to the right cylinder at z = 10 mm as indicated in Figure 12. The left port in the rectangular pack for case A exhibits several small recirculation zones in, but there is no recirculation zone for case D in the left side. The right region in the rectangular pack for case D has a dense recirculation zone larger than case A. Both phenomena mean that case D has greater buoyancy driving more hot fluid upward to encounter the cold top surface and loose more heat. Additionally, more cold fluid moves downward to the hot cylinder surfaces, absorbs heat, becomes warmer, and then moves upward. There is a recirculation region outside the top surface of the rectangular pack for case A while case D has two smaller recirculation zones outside the top with closer streamline near the right side wall, which means case D has greater buoyancy effect. As a result, case D has a lower temperature distribution as depicted in Figure 11b and greater average Nusselt number as Figure 10b indicates.
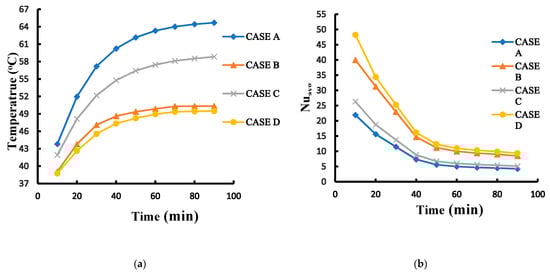
Figure 10.
Variations of (a) the maximum temperature (b) average Nusselt number with time for different cases A, B, C and D under 1 mm amid cylinders.
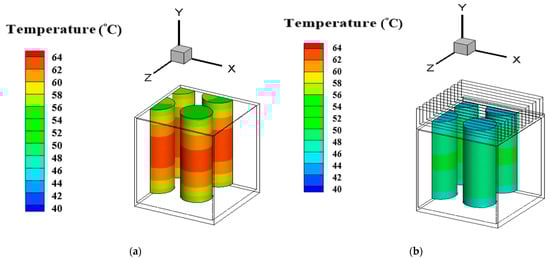
Figure 11.
Three-dimensional temperature profile of (a) case A (b) case D adopting 1 mm amid cylinders at 90 min.
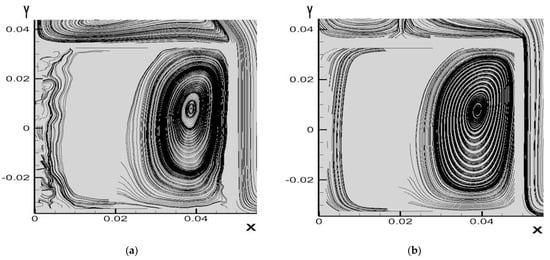
Figure 12.
Streamline patterns on xy section at z = 10 mm of (a) case A (b) case D adopting 1 mm amid cylinders at 90 min.
4. Conclusions
PCMs have significant advantages such as compact size, lightweight, simple design, and cost effective, and its thermal performance is improved with the addition of aluminum fins. Employing PCMs can enhance cooling effect in addition to air cooling without the use of a complicated system or fan power.
A transient three-dimensional heat transfer of nine cylindrical batteries inside a rectangular pack is investigated numerically with six different inter-cylinder distances for four different cases, including the air between cylinders without fin array (case A), the PCM between cylinders without fin array (case B), the air with fin array (case C), and the PCM between cylinders with fin array (case D). Through the present study, the utilization of PCM between cylinders with fin array on top of the pack can be the best way to limit the temperature rise for the cylindrical batteries.
The conclusions are made based on the above results and discussion as follows. The smaller inter-cylinder distance obtains the better decreasing rate of the maximum temperature relative to case A up to 23.4%. Replacing the air by the PCM can greatly lower the overall temperatures of the cylindrical batteries for both case B and case D. The maximum temperature of the cylinder can be reduced from 64.84 °C of case A to 50.6 °C of case B. The case B reduces the maximum temperature about 14.2 °C when it is in comparison with case A. The temperature contour relates to the liquid fraction contour agrees well in both case B and case D. Furthermore, by way of utilizing PCM, the peak temperature of the cylindrical batteries can be kept within the desirable operation range. In comparison with case A and case B, cases with fin array like case C and case D can reduce the overall temperature. Case D can best enhance the convective heat transfer by 120% compared with case A at all times. The overall temperature drops about 15.2 °C when it is in comparison with case A. Furthermore, compared with A, case D has greater buoyancy due to larger dense recirculation zone inside the rectangular pack and two smaller recirculation zones above the rectangular pack with the accelerated surrounding fluid resulting in forcing upward flow inside the rectangular pack to exchange heat with hot cylinder surfaces.
Author Contributions
Conceptualization, H.-W.W. and Y.-C.C.; software, Y.-C.C.; validation, J.-K.W., D.-A.H.; formal analysis, Y.-C.C.; investigation, J.-K.W.; writing—original draft preparation, Y.-C.C.; writing—review and editing, H.-W.W.; funding acquisition, H.-W.W. All authors have read and agreed to the published version of the manuscript.
Funding
The authors are thankful to the Ministry of Science and Technology of the Republic of China for its partial assistance via the project of MOST 104-2221- E-006-197-MY3.
Conflicts of Interest
The authors declare no conflict of interest.
Abbreviations
| Nomenclature | |
| Cp | Specific heat at constant pressure (J/kg °C) |
| D | cylinder diameter (mm) |
| g | Gravity (m/s2) |
| H | Height of calculation domain (m) |
| ℏ | Enthalpy (J/kg) |
| h | Heat transfer coefficient (W/m2 °C) or height of the rectangular pack (m) |
| k | Thermal conductivity (W/m °C) |
| L | Latent heat (J/kg) or length of computational region (m) |
| l | length of the rectangular pack (m) |
| Nuavg | Average Nusselt number (hL/k) |
| Heat flux (w/m2) | |
| p | Pressure (N/mm2) |
| Sh | Heat production rate of cylindrical heat source (w/m3) |
| t | Time (s) |
| T | Temperature (°C) |
| u | Velocity component for x direction (m/s) |
| v | Velocity component for y direction (m/s) |
| w | Velocity component for z direction (m/s) or width of the rectangular pack (m) |
| W | Width of calculation domain (m) |
| x | Cartesian coordinate (m) |
| Greek symbols | |
| α | Phase volume fraction |
| Thermal expansion coefficient | |
| γ | Liquid fraction |
| μ | Dynamic viscosity (kg/m s) |
| ρ | Density (kg/m3) |
| Subscripts | |
| f | Fluid |
| i | Component |
| l | Liquid |
| n | nth |
| ref | Reference value |
| s | Solid |
References
- Scrosati, B.; Hassoun, J.; Sun, Y.K. Lithium-ion batteries. A look into the future. Energy Environ. 2011, 4, 3287–3295. [Google Scholar] [CrossRef]
- Wang, Q.S.; Sun, J.H.; Chu, G.Q. Lithium ion battery fire and explosion. Fire Safety Sci. 2005, 8, 375–382. [Google Scholar] [CrossRef]
- Taheri, P.; Bahrami, M. Temperature rise in prismatic polymer lithium-ion batteries: An analytic approach. SAE Int. 2012. [Google Scholar] [CrossRef]
- Michael, A.R.; Sauer, D.U. Dynamic electric behavior and open circuit voltage modeling of LiFePO4 based lithium ion secondary batteries. J. Power Sources 2011, 196, 331–336. [Google Scholar]
- Wang, T.; Tseng, K.J.; Zhao, J.Y.; Wei, Z.B. Thermal investigation of lithium-ion battery module with different cell arrangement structures and forced air-cooling strategies. Appl. Energy 2014, 134, 229–238. [Google Scholar] [CrossRef]
- Mohammadian, S.K.; Zhang, Y. Thermal management optimization of an air-cooled Li-ion battery module using pin-fin heat sinks for hybrid electric vehicles. J. Power Sources 2015, 273, 431–439. [Google Scholar] [CrossRef]
- Wang, Q.; Jiang, B.; Li, B.; Yan, Y.Y. A Critical Review of Thermal Management Models and Solutions of Lithium-ion Batteries for the Development of Pure Electric Vehicles. Renew. Sustain. Energy Rev. 2016, 64, 106–128. [Google Scholar] [CrossRef]
- Jue, T.C.; Wu, H.W.; Hung, S.Y. Heat Transfer Predictions around Three Heated Cylinders between two Parallel Plates. Numer. Heat Transf. Part A Appl. 2001, 40, 715–733. [Google Scholar]
- Deka, R.K.; Paul, A.; Chaliha, A. Transient free convection flow past vertical cylinder with constant heat flux and mass transfer. Ain. Shams Engr. J. 2017, 8, 643–651. [Google Scholar] [CrossRef][Green Version]
- Wu, H.W.; Perng, S.W.; Hung, S.Y.; Jue, T.C. Transient Mixed Convective Heat Transfer Predictions around Three Heated Cylinders in a Horizontal Channel. Int. J. Numer. Methods Heat Fluid Flow 2006, 16, 674–692. [Google Scholar] [CrossRef]
- Rosler, F.; Bruggemann, D. Shell-and-tube type latent heat thermal energy storage: Numerical analysis and comparison with experiments. Heat Mass Transfer 2011, 47, 1027–1033. [Google Scholar] [CrossRef]
- Al-Abidi, A.A.; Mat, S.; Sopian, K.; Sulaiman, M.Y.; Mohammad, A.T. Experimental study of melting and solidification of PCM in a triplex tube heat exchanger with fins. Energy Build 2014, 68, 33–41. [Google Scholar] [CrossRef]
- Nomura, T.; Tsubota, M.; Oya, T.; Okinaka, N.; Akiyama, T. Heat storage in direct-contact heat exchanger with phase change material. Appl. Therm. Eng. 2013, 50, 26–34. [Google Scholar] [CrossRef]
- Mat, S.; Al-Abidi, A.A.; Sopian, K.; Sulaiman, M.Y.; Mohammad, A.T. Enhance heat transfer for PCM melting in triplex tube with internal-external fins. Energy Convers. Manag. 2013, 74, 223–236. [Google Scholar] [CrossRef]
- Ling, Z.Y.; Wang, F.X.; Fang, X.M.; Gao, X.N.; Zhang, Z.G. A hybrid thermal management system for lithium ion batteries combining phase change materials with forced-air cooling. Appl. Energy 2015, 148, 403–409. [Google Scholar] [CrossRef]
- Rao, Z.H.; Wang, S.F.; Zhang, Y.L. Simulation of heat dissipation with phase change material for cylindrical power battery. Energy Inst. 2012, 85, 38–43. [Google Scholar] [CrossRef]
- Parsons, K.K. Design and Simulation of Passive Thermal Management System of Passive Thermal Management System for Lithium-Ion Battery Packs on an Unmanned Ground Vehicle. Master’s Thesis, Science in Mechanical Engineering. California Polytechnic State University, San Luis Obispo, CA, USA, 2012. [Google Scholar]
- Hussain, A.; Tso, C.Y.; Chao, C.Y.H. Experimental investigation of a passive thermal management system for high-powered lithium ion batteries using nickel foam-paraffin composite. Energy 2016, 115, 209–218. [Google Scholar] [CrossRef]
- Tay, N.H.S.; Bruno, F.; Belusko, M. Experimental validation of a CFD model for tubes in a phase change thermal energy storage system. Int. J. Heat Mass Transfer 2012, 55, 574–585. [Google Scholar] [CrossRef]
- Niu, J.Y.; Xie, N.; Zhon, Y.; Gao, X.N.; Fang, Y.T.; Zhang, Z.G. Numerical analysis of battery thermal management system coupling with low-thermal-conductive phase change material and liquid cooling. J. Energy Storage 2021, 39, 102605. [Google Scholar] [CrossRef]
- Huang, R.; Li, Z.; Hon, W.H.; Wu, Q.C.; Yu, X.L. Experimental and numerical study of PCM thermophysical parameters on lithium-ion battery thermal management. Energy Rep. 2020, 6, 8–19. [Google Scholar] [CrossRef]
- Wang, F.X.; Cao, J.H.; Ling, Z.Y.; Zhang, Z.G.; Fang, X.M. Experimental and simulative investigations on a phase change material nano-emulsion-based liquid cooling thermal management system for a lithium-ion battery pack. Energy 2020, 207, 118215. [Google Scholar] [CrossRef]
- Behi, H.; Karimi, D.; Youssef, R.; Patil, M.S.; van Mierlo, J.; Berecibar, M. Comprehensive Passive Thermal Management Systems for Electric Vehicles. Energies 2021, 14, 3881. [Google Scholar] [CrossRef]
- Wang, Y.N.; Wang, Z.K.; Min, H.T.; Li, H.; Li, Q.F. Performance investigation of a passive battery thermal management system applied with phase change material. J. Energy Storage 2021, 35, 102279. [Google Scholar] [CrossRef]
- Chang, S.W.; Wu, H.W.; Guo, D.Y.; Shi, J.J.; Chen, T.H. Heat transfer enhancement of vertical dimpled fin array in natural convection. Inter. J. Heat Mass Transfer 2017, 106, 781–792. [Google Scholar] [CrossRef]
- Pletcher, H.R.; Tannehill, J.C.; Anderson, D. Computational Fluid Mechanics and Heat Transfer, 3rd ed.; CRC Press: New York, NY, USA, 2011; pp. 554–556. [Google Scholar]
- Bejan, A. Convection Heat Transfer, 4th ed.; Wiley: New York, NY, USA, 2013; pp. 175–176. [Google Scholar]
- Brent, A.D.; Voller, V.R.; Reid, K.J. Enthalpy-porosity technique for modeling convectione diffusion phase change: Application to the melting of a pure metal. Numer. Heat Transfer 1998, 13, 297–318. [Google Scholar]
- Nichols, B.; Hirt, C. Volume of fluid (VOF) method for the dynamics of free boundaries. J. Comput. Phys. 1981, 39, 201–225. [Google Scholar]
Publisher’s Note: MDPI stays neutral with regard to jurisdictional claims in published maps and institutional affiliations. |
© 2021 by the authors. Licensee MDPI, Basel, Switzerland. This article is an open access article distributed under the terms and conditions of the Creative Commons Attribution (CC BY) license (https://creativecommons.org/licenses/by/4.0/).