
Equivalence Ratio Measurements in CH4/Air Gases Based on the Spatial Distribution of the Emission Intensity of Femtosecond Laser-Induced Filament


Abstract
1. Introduction
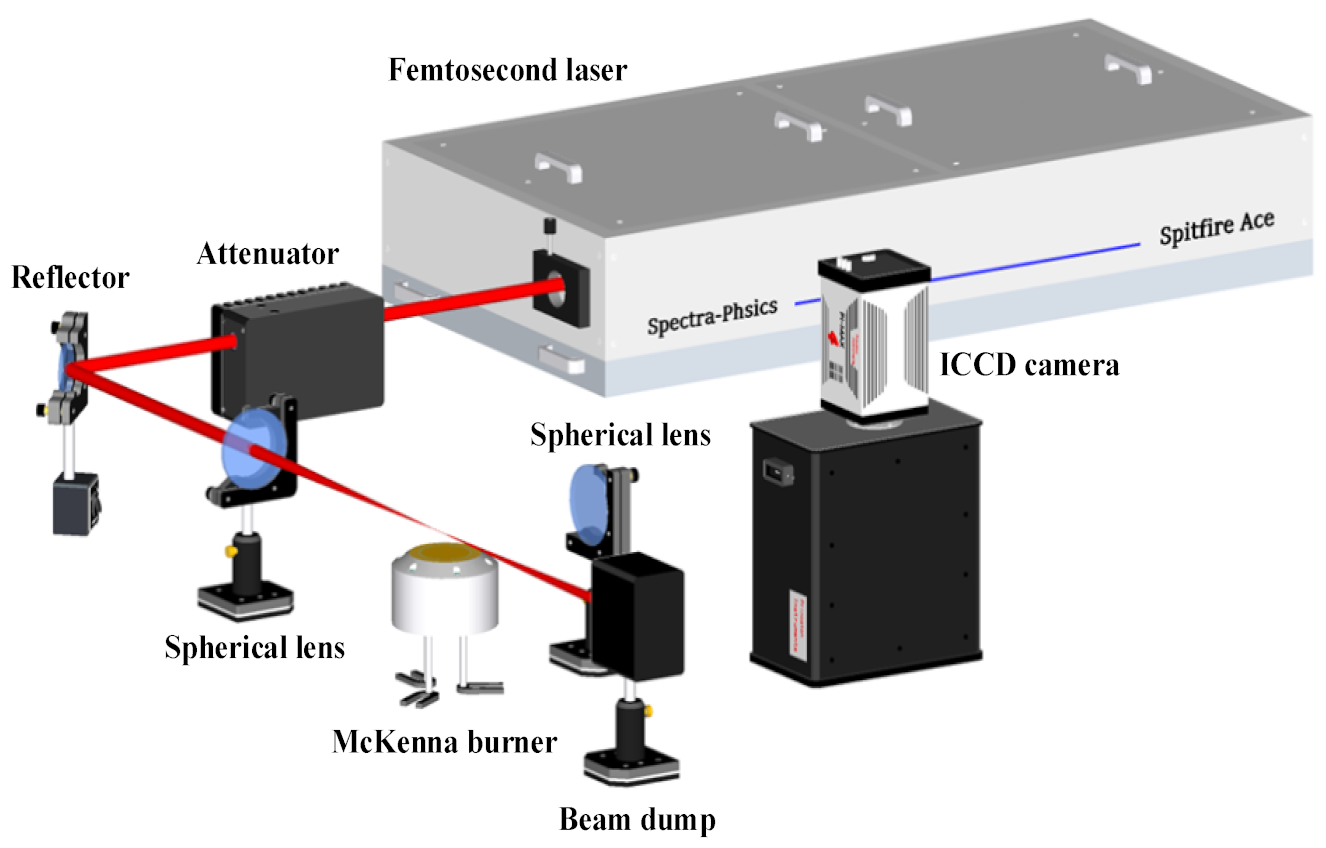
2. Experimental
3. Results and Discussion
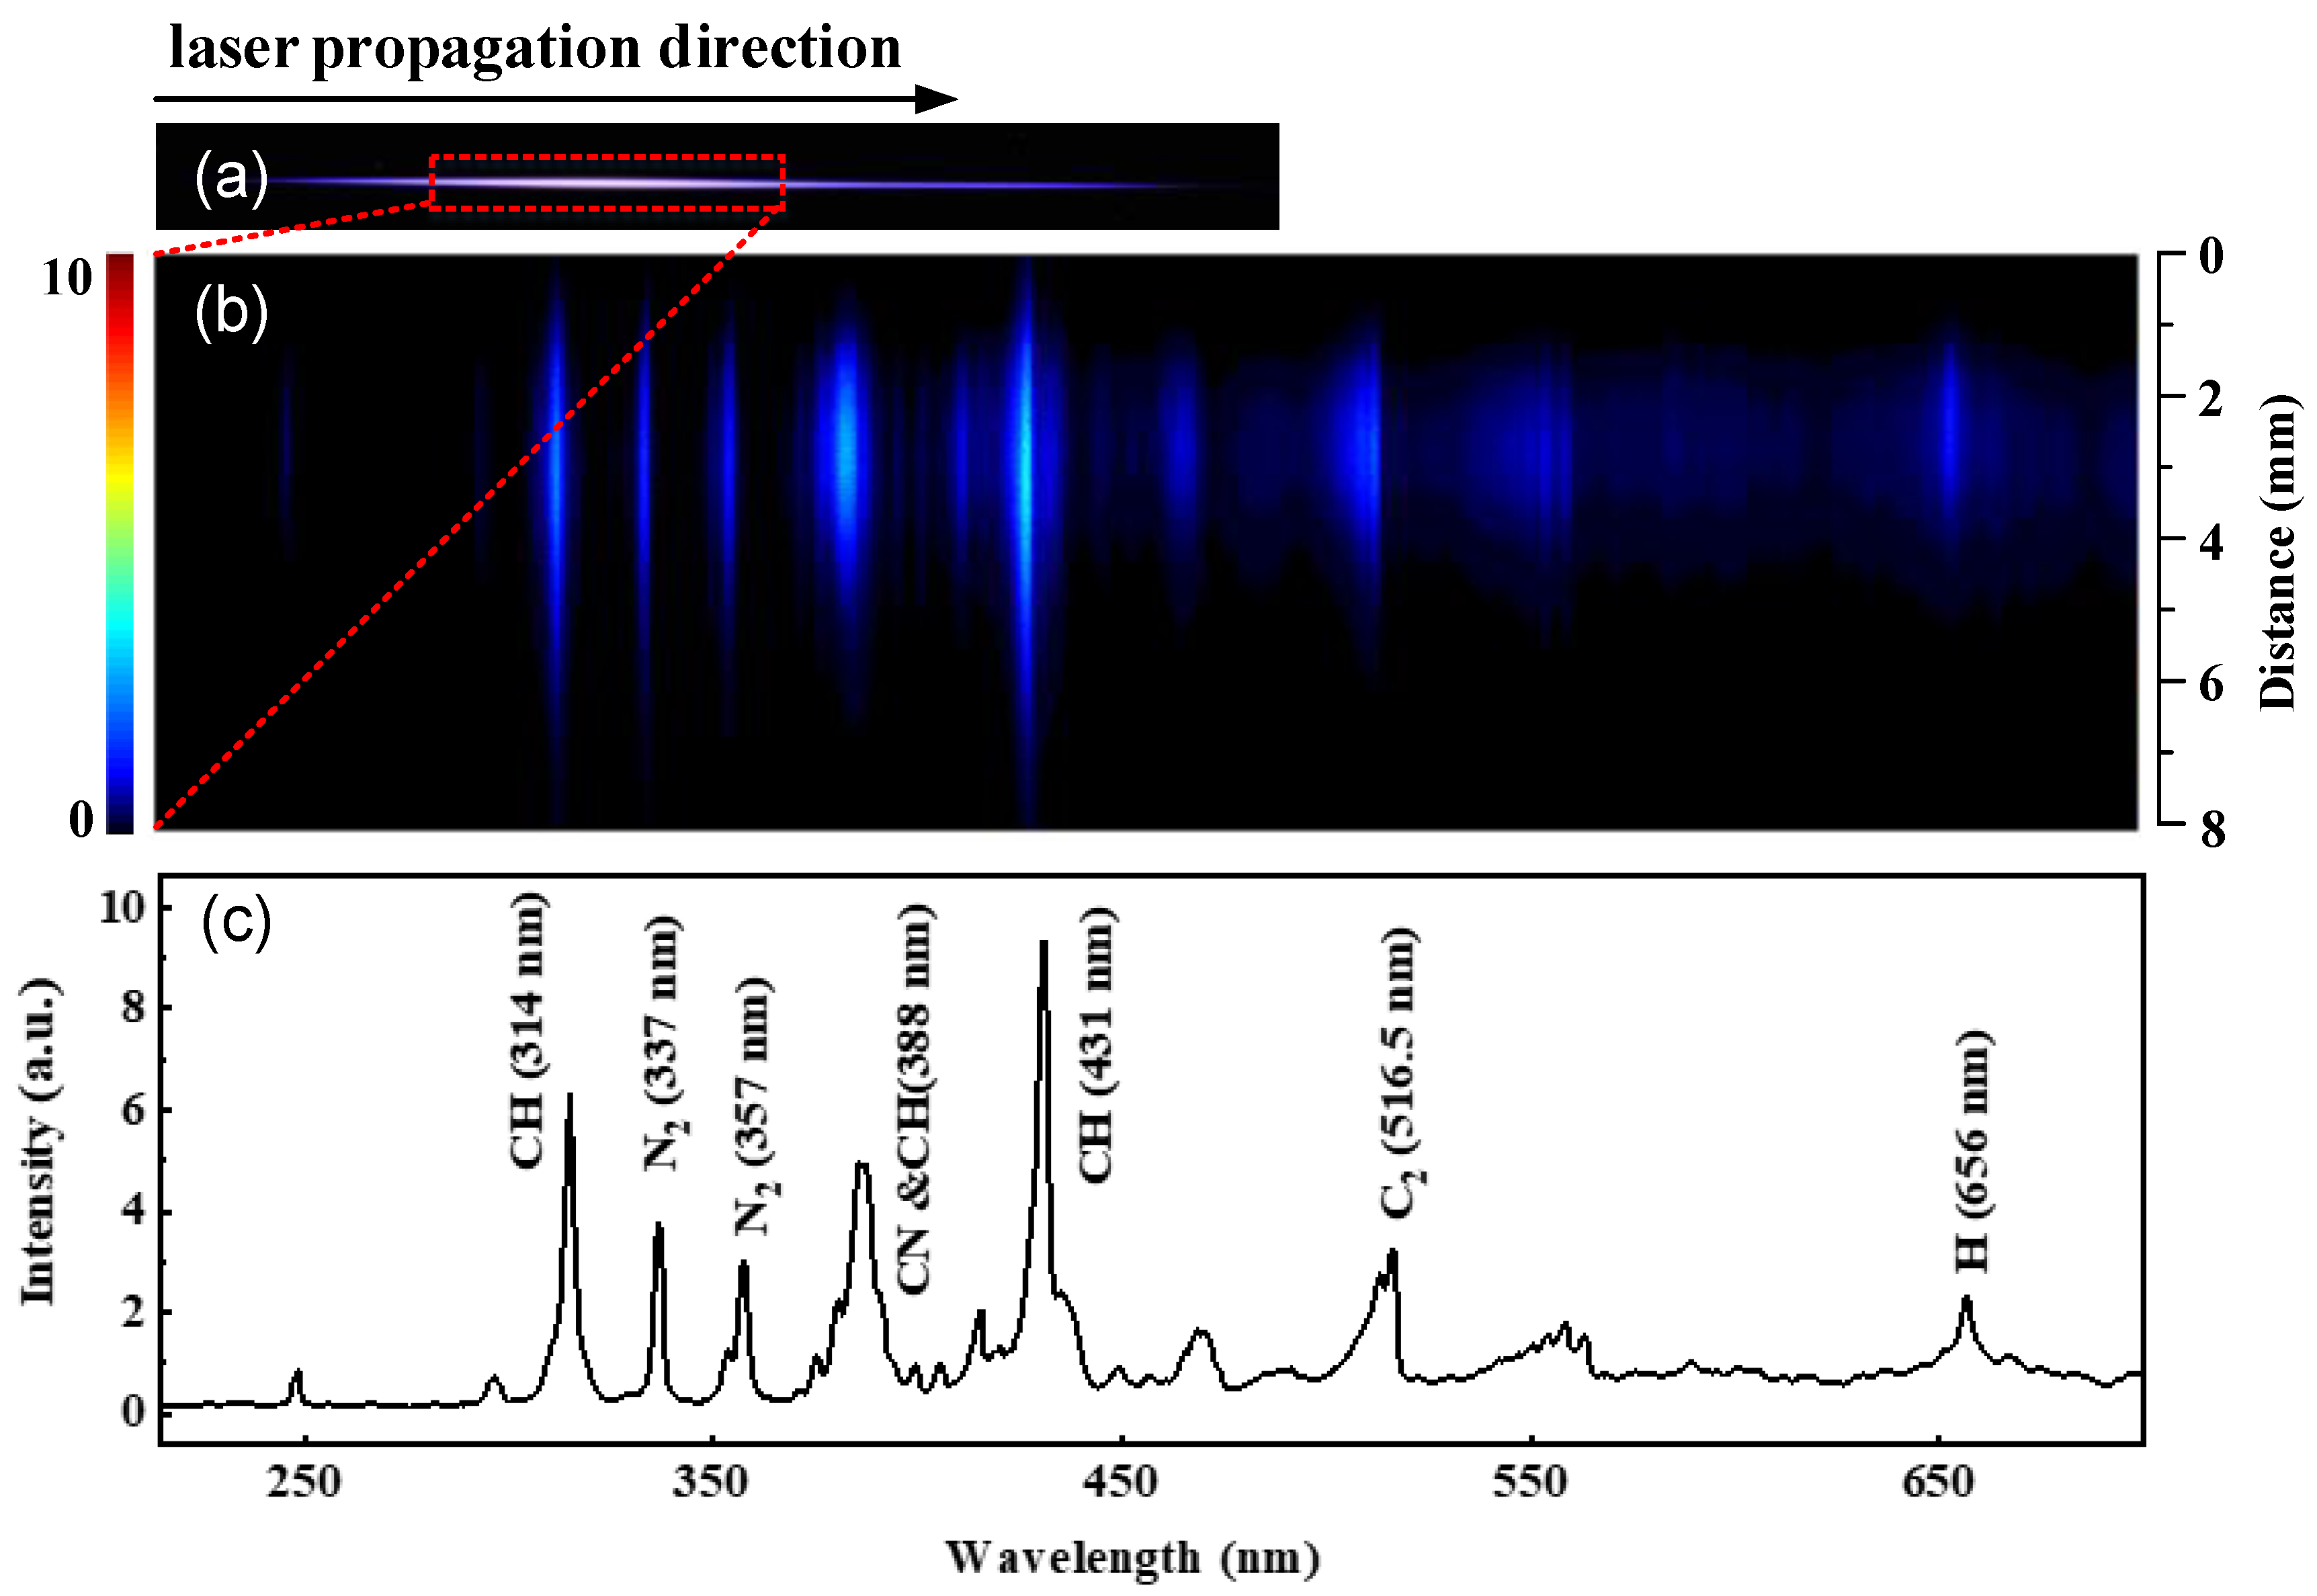
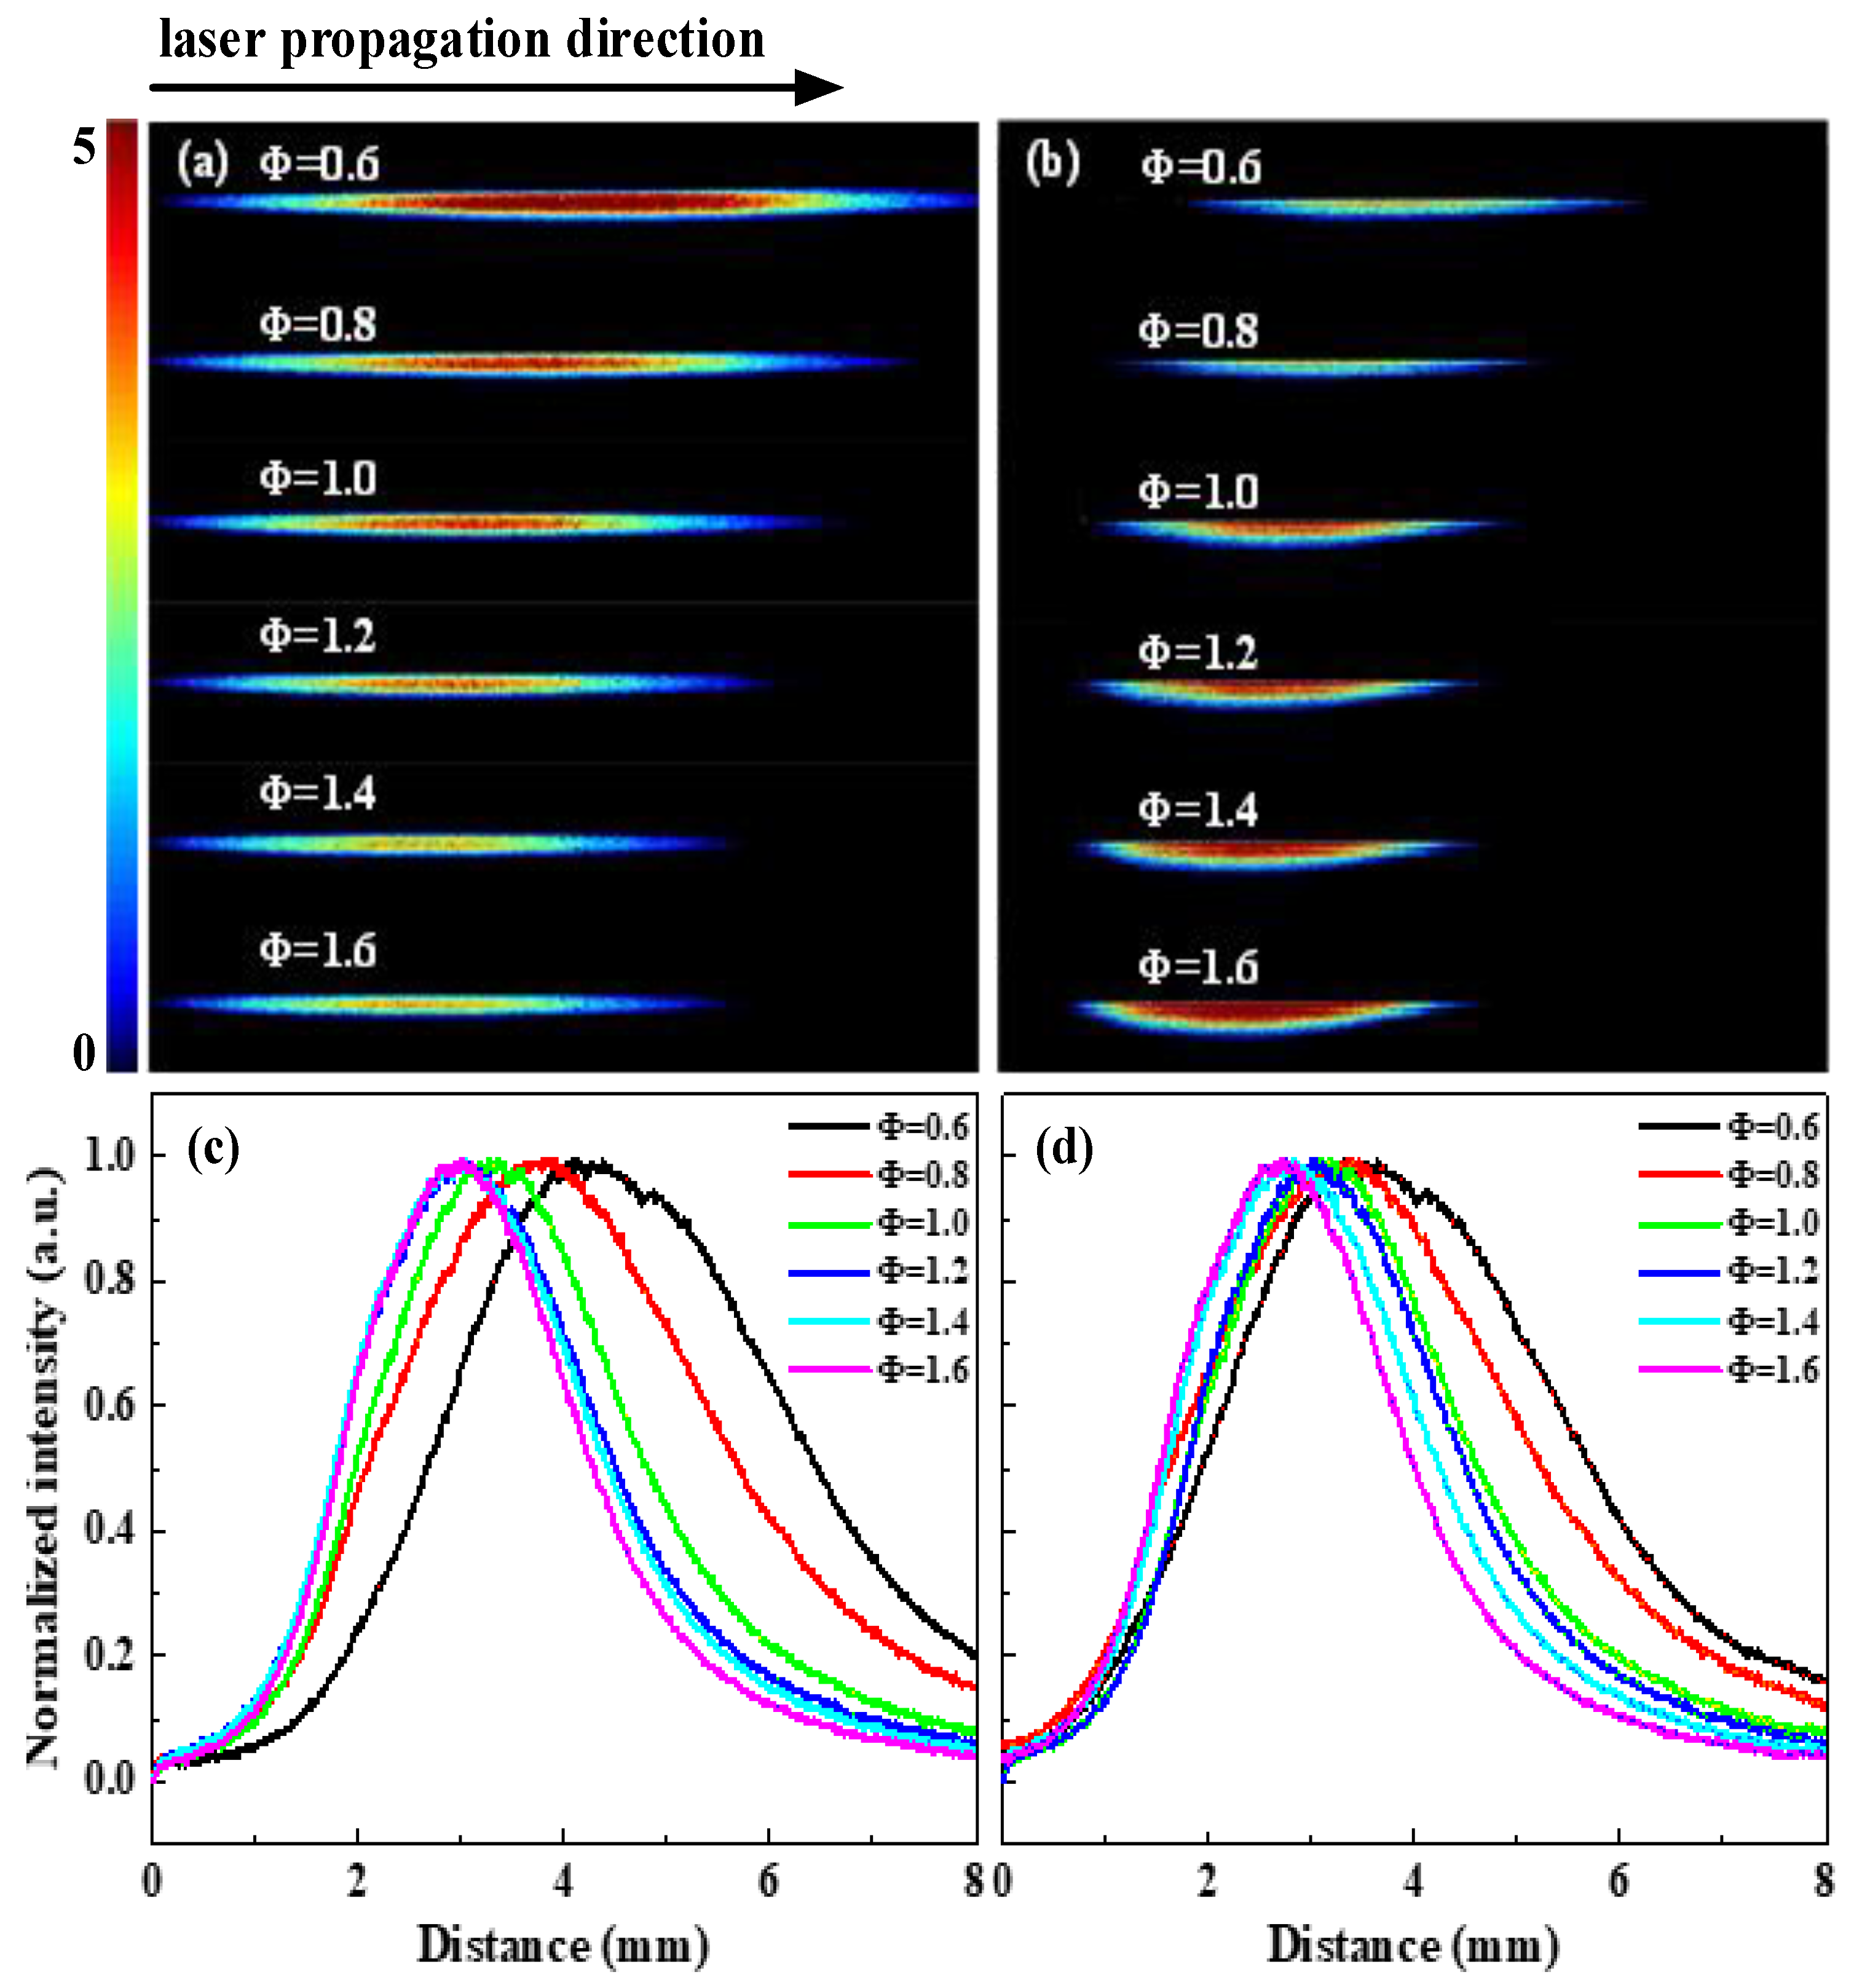
3.1. Spatially Resolved Spectrum
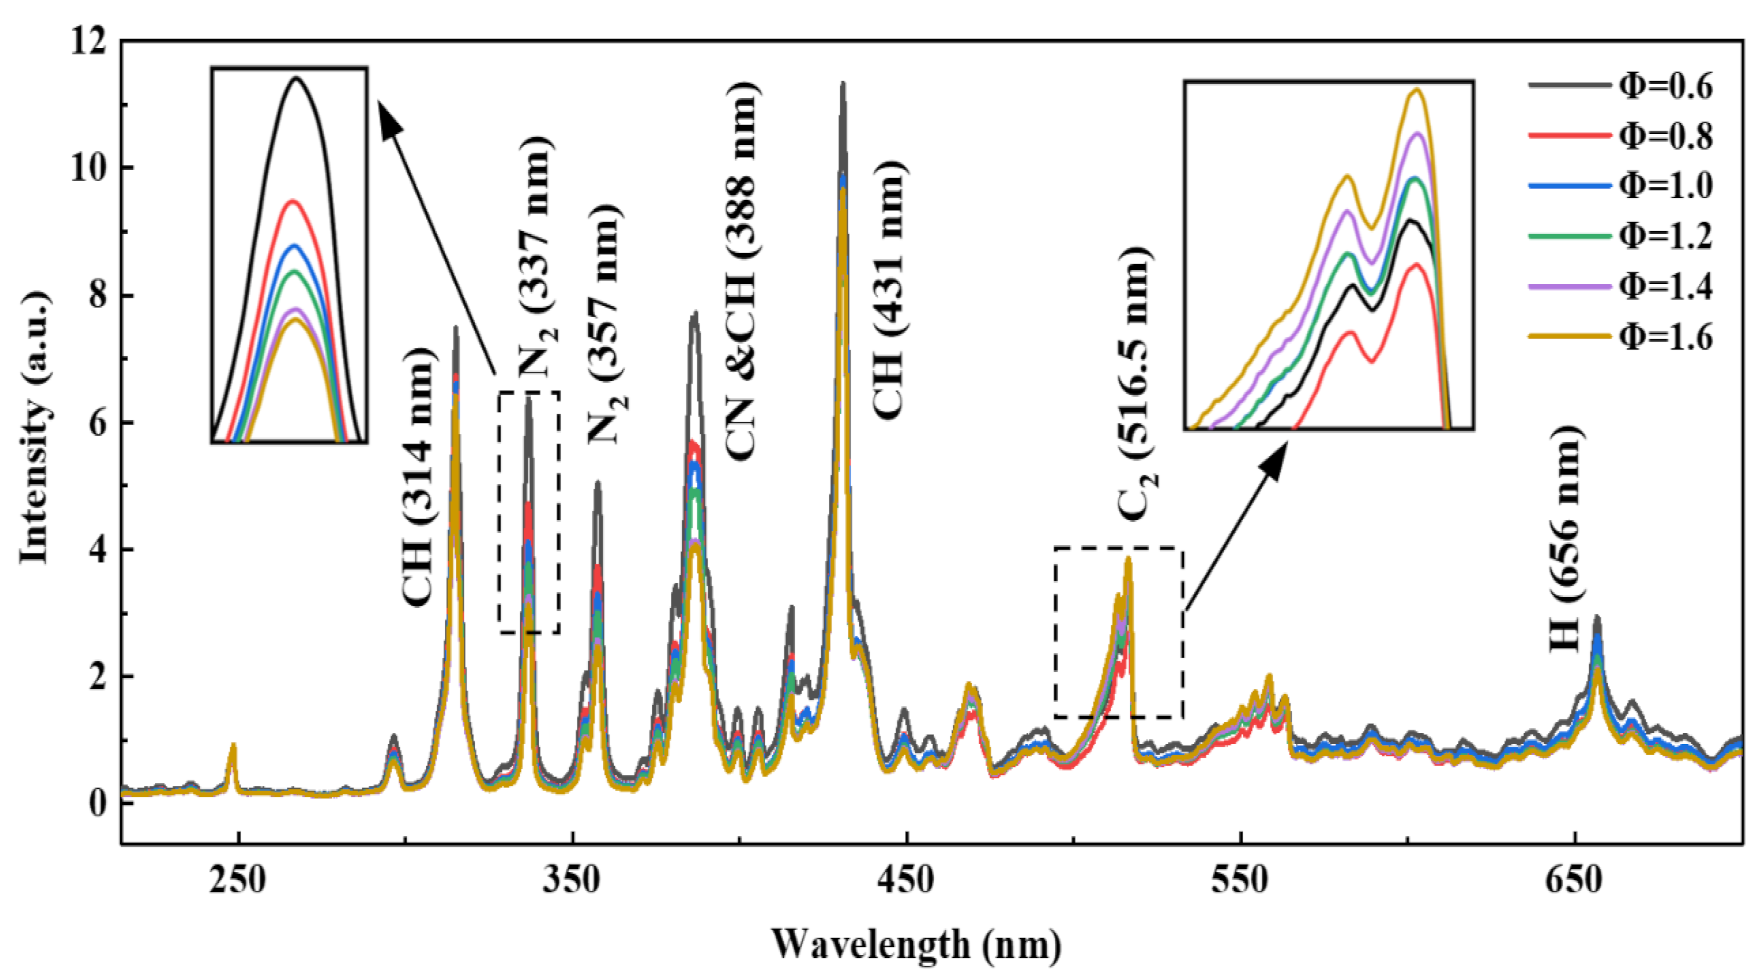
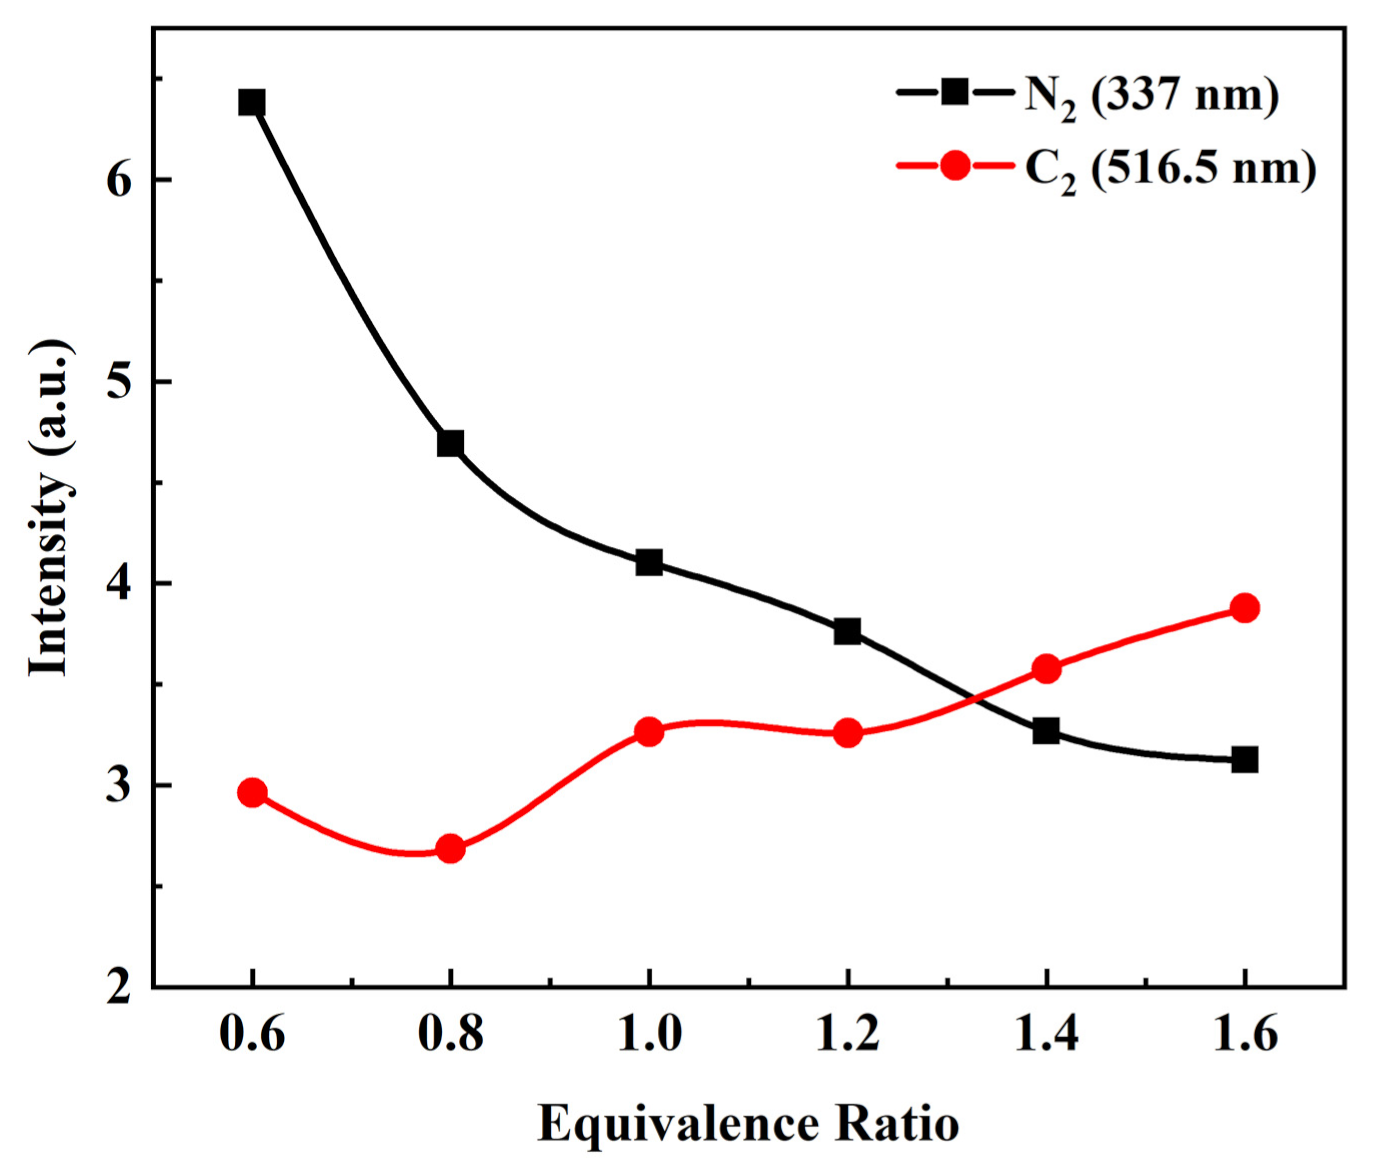
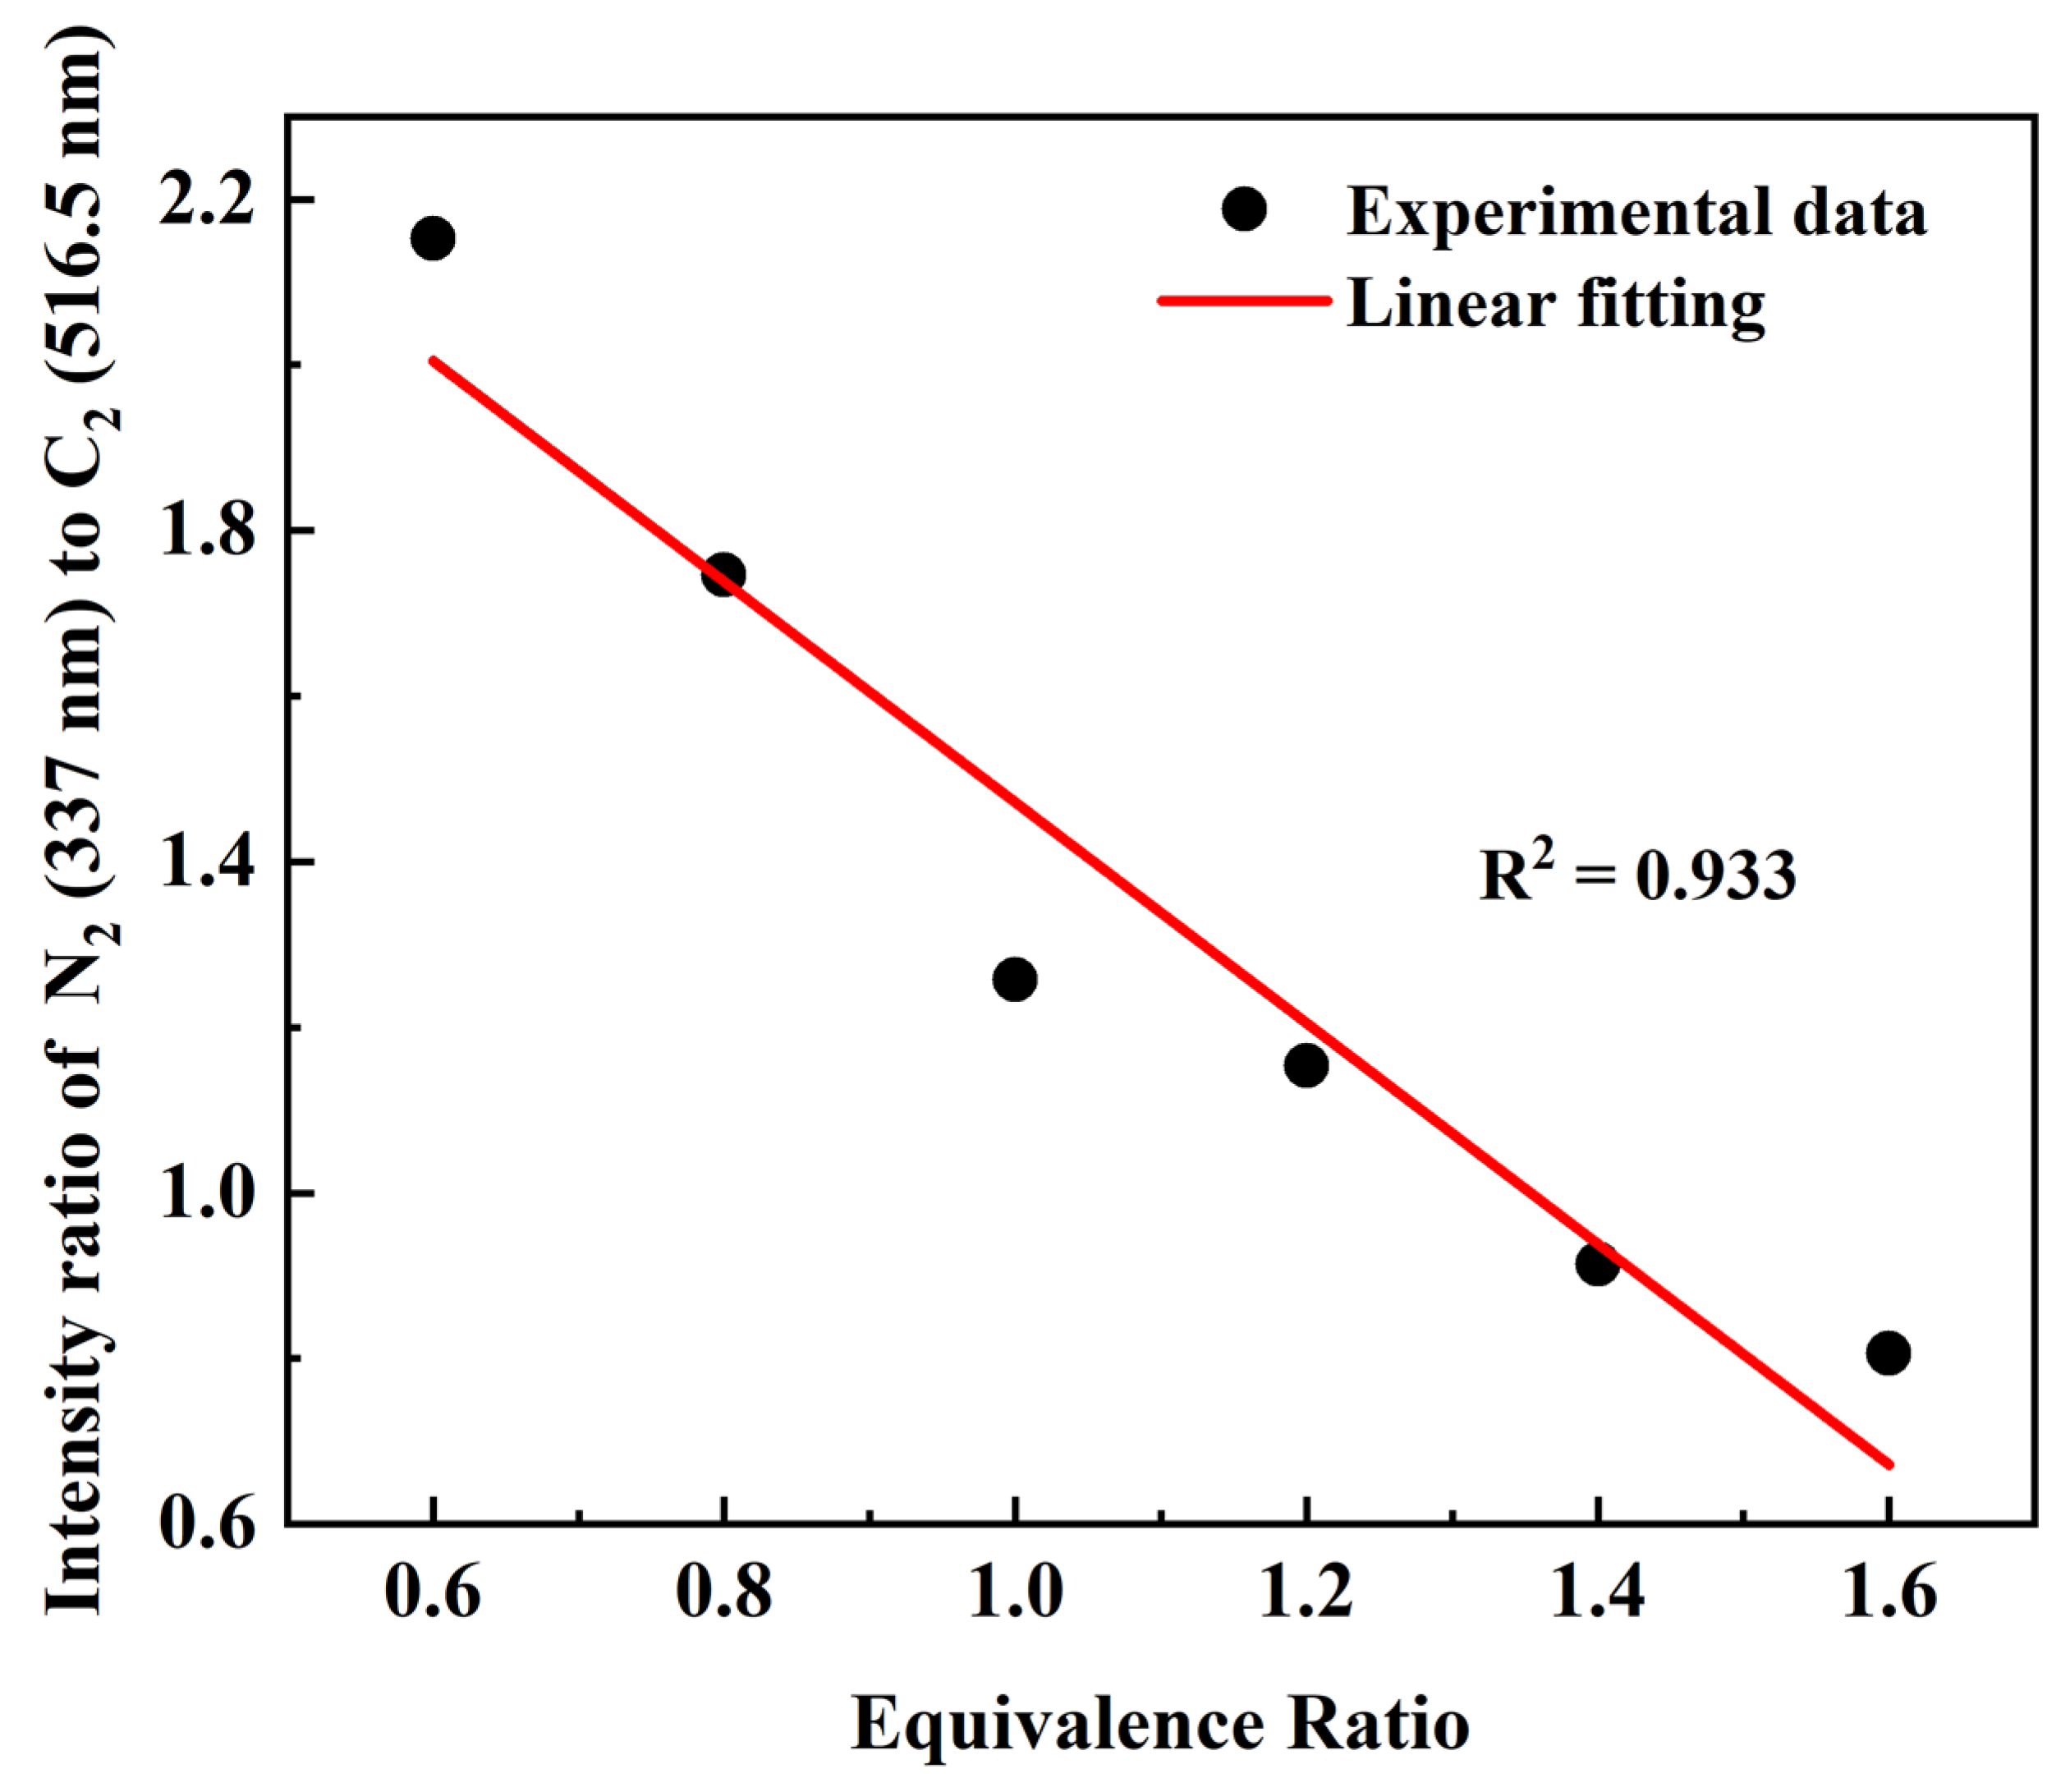
3.2. Equivalence Ratio Measurements Based on the Emission Intensity Ratio between Two Species in the fs Laser-Induced Filament
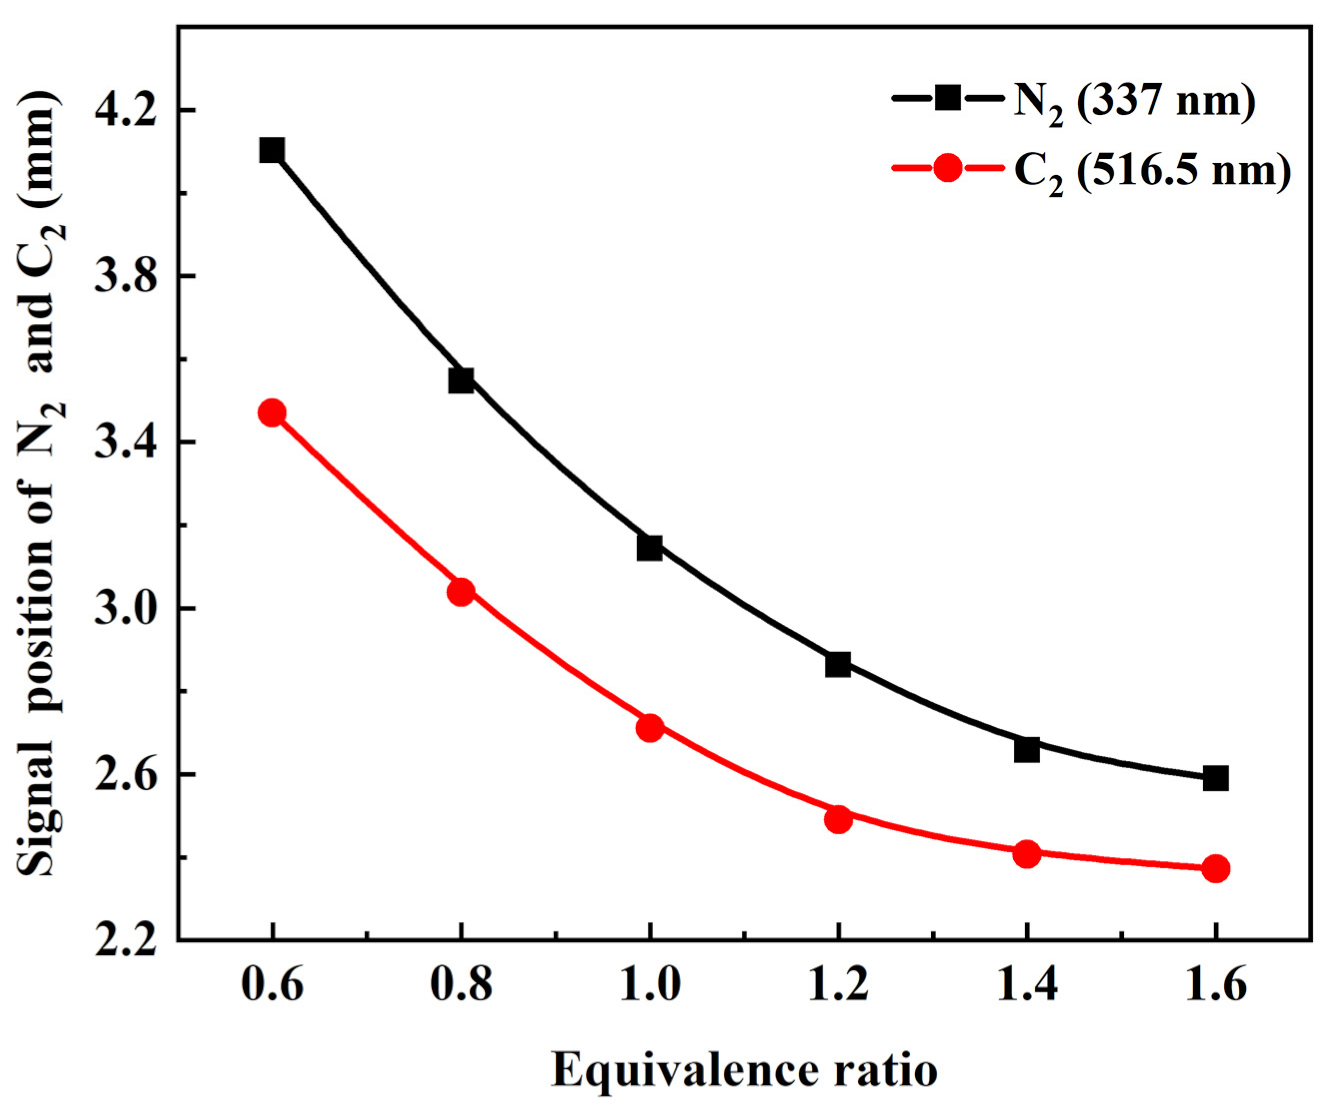
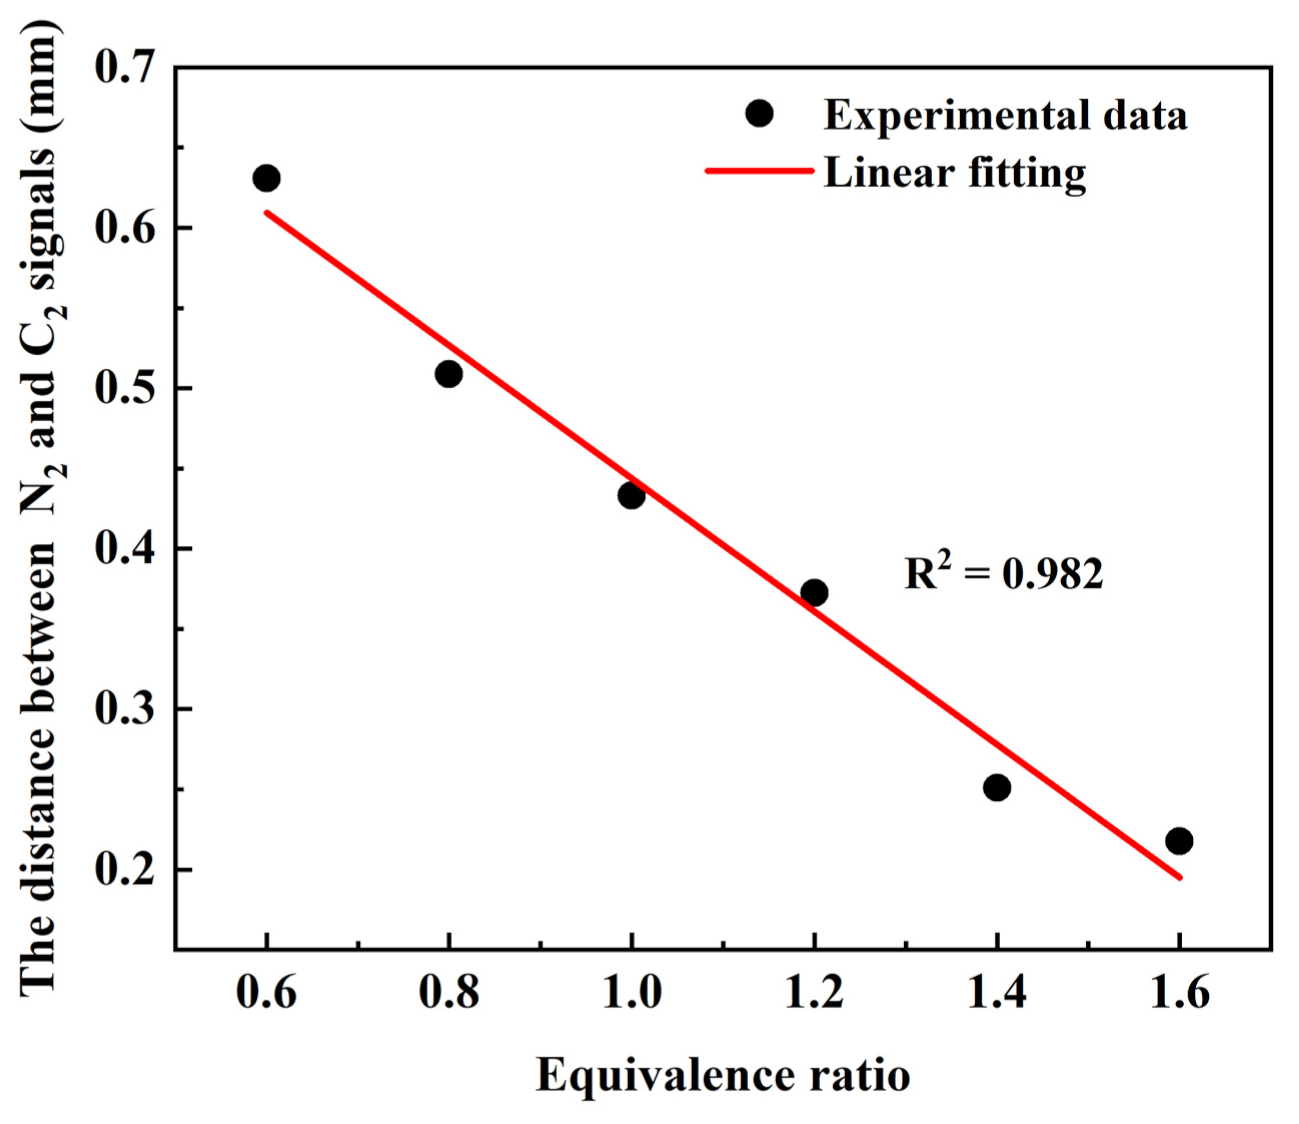
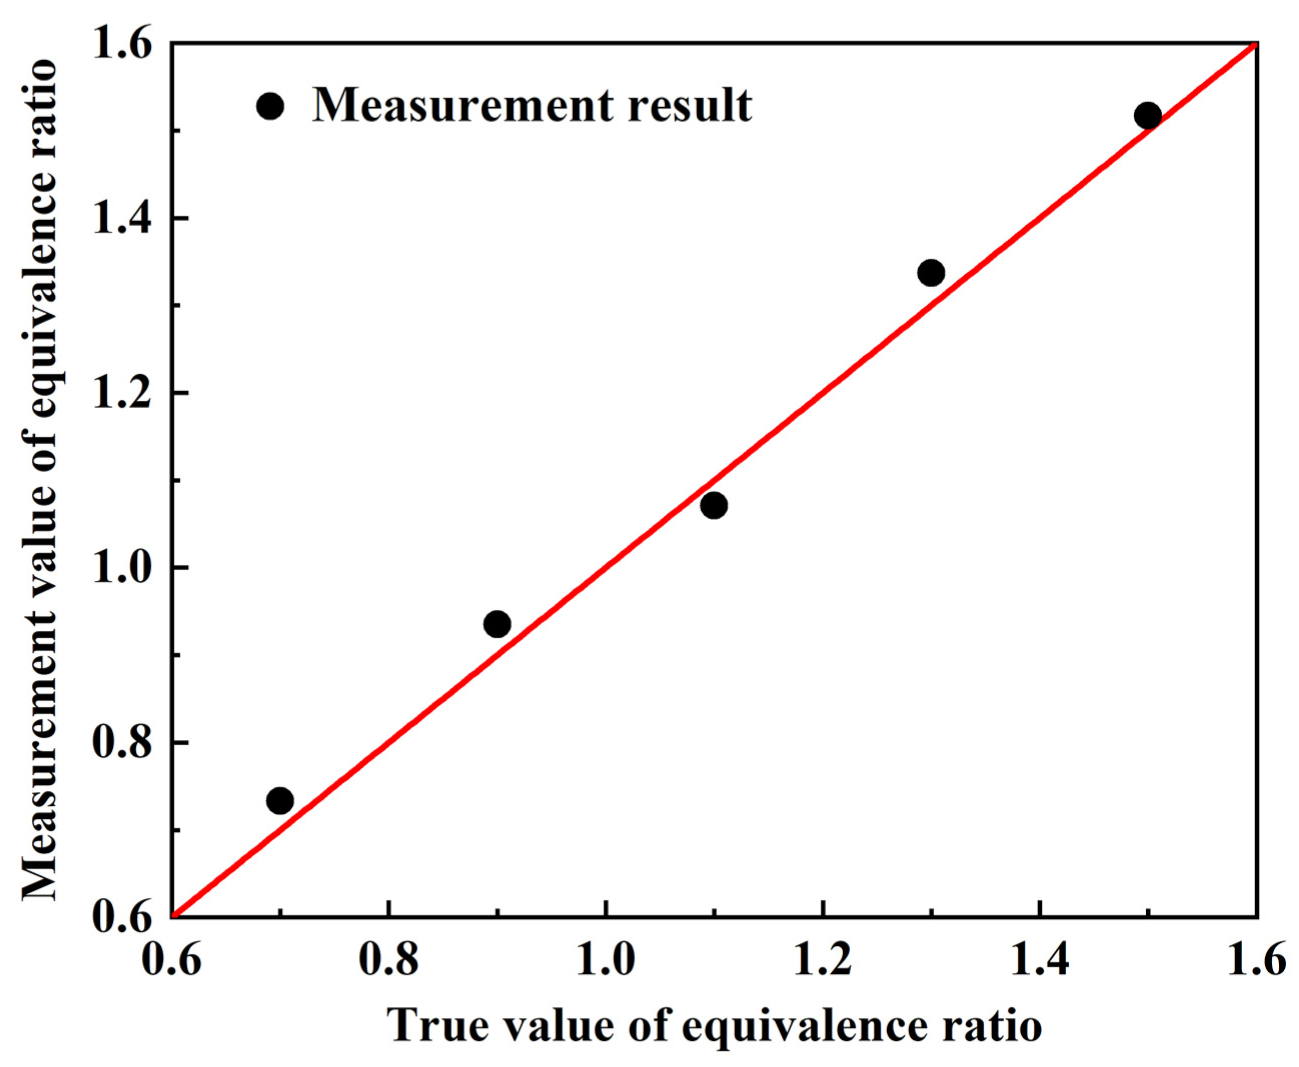
3.3. Equivalence Ratio Measurements Based on the Spatial Distribution of the Emission Intensity of the fs Laser-Induced Filament
4. Conclusions
Author Contributions
Funding
Institutional Review Board Statement
Informed Consent Statement
Data Availability Statement
Conflicts of Interest
References
- Li, B.; Zhang, D.Y.; Liu, J.X.; Tian, Y.F.; Gao, Q.; Li, Z.S. A Review of Femtosecond Laser-Induced Emission Techniques for Combustion and Flow Field Diagnostics. Appl. Sci. 2019, 9, 1906. [Google Scholar] [CrossRef]
- Aldén, M.; Bood, J.; Li, Z.S.; Richter, M. Visualization and understanding of combustion processes using spatially and temporally resolved laser diagnostic techniques. Proc. Combust. Inst. 2011, 33, 69–97. [Google Scholar] [CrossRef]
- Allison, P.M.; Frederickson, K.; Kirik, J.W.; Rockwell, R.D.; Goyne, C.P.; Lempert, W.R.; Sutton, J.A. Flame Structure and Dynamics in a Premixed Dual-Mode Scramjet Combustor from Fluorescence Imaging. J. Propuls. Power 2019, 35, 552–564. [Google Scholar] [CrossRef]
- Zhao, W.D.; Wang, W.G.; Li, H.Y. Numerical simulation and experimental investigation of the production of multiply charged ions by the ionization of benzene cluster with a moderate intensity laser. Acta Phys. Sin. 2014, 63, 103602. [Google Scholar]
- Richardson, D.R.; Jiang, N.; Blunck, D.L.; Gord, J.R.; Roy, S. Characterization of inverse diffusion flames in vitiated cross flows via two-photon planar laser-induced fluorescence of CO and 2-D thermometry. Combust. Flame 2016, 168, 270–285. [Google Scholar] [CrossRef]
- Chan, V.S.S.; Turner, J.T. Velocity measurement inside a motored internal combustion engine using three-component laser Doppler anemometry. Opt. Laser Technol. 2000, 32, 557–566. [Google Scholar] [CrossRef]
- Braun, A.; Korn, G.; Liu, X.; Du, D.; Mourou, G. Self-channeling of high-peak-power femtosecond laser pulses in air. Opt. Lett. 1995, 20, 73–75. [Google Scholar] [CrossRef]
- Spence, D.E.; Kean, P.N.; Sibbett, W. 60-fsec pulse generation from a self-mode-locked Ti:sapphire laser. Opt. Lett. 1991, 16, 42–44. [Google Scholar] [CrossRef]
- Chen, X.W.; Liu, J.; Zhu, Y.; Leng, Y.X.; Ge, X.C.; Li, R.X.; Xu, Z.Z. Self-compression of femtosecond pulses in argon with a power close to the self-focusing threshold. Chin. Phys. B 2008, 17, 1826–1832. [Google Scholar]
- Li, H.L.; Chu, W.; Xu, H.L.; Cheng, Y.; Chin, S.L.; Yamanouchi, K.; Sun, H.B. Simultaneous identification of multi-combustion-intermediates of alkanol-air flames by femtosecond filament excitation for combustion sensing. Sci. Rep. 2016, 6, 27340. [Google Scholar] [CrossRef]
- Li, H.L.; Xu, H.L.; Yang, B.S.; Chen, Q.D.; Zhang, T.; Sun, H.B. Sensing combustion intermediates by femtosecond filament excitation. Opt. Lett. 2013, 38, 1250–1252. [Google Scholar] [CrossRef][Green Version]
- Brodeur, A.; Chin, S.L. Ultrafast white-light continuum generation and self-focusing in transparent condensed media. J. Opt. Soc. Am. B 1999, 16, 637–650. [Google Scholar] [CrossRef]
- Kosareva, O.G.; Kandidov, V.P.; Brodeur, A.; Chien, C.Y.; Chin, S.L. Conical emission from laser–plasma interactions in the filamentation of powerful ultrashort laser pulses in air. Opt. Lett. 1997, 22, 1332–1334. [Google Scholar] [CrossRef]
- Luo, Q.; Liu, W.; Chin, S.L. Lasing action in air induced by ultra-fast laser filamentation. Appl. Phys. B Lasers Opt. 2003, 76, 337–340. [Google Scholar] [CrossRef]
- Couairon, A.; Mysyrowicz, A. Femtosecond filamentation in transparent media. Phys. Rep. 2007, 441, 47–189. [Google Scholar] [CrossRef]
- Li, H.L.; Xu, H.L. Ultrafast strong laser filamentation and applications in high-temperature combustion field. Chin. Sci. Bull. 2017, 62, 2876–2885. [Google Scholar] [CrossRef]
- Li, H.L.; Wei, X.Y.; Xu, H.L.; Chin, S.L.; Yamanouchi, K.; Sun, H.B. Femtosecond laser filamentation for sensing combustion intermediates: A comparative study. Sens. Actuators B Chem. 2014, 203, 887–890. [Google Scholar] [CrossRef]
- Li, B.; Tian, Y.F.; Gao, Q.; Zhang, D.Y.; Li, X.F.; Zhu, Z.F.; Li, Z.S. Filamentary anemometry using femtosecond laser-extended electric discharge—FALED. Opt Express. 2018, 26, 21132–21140. [Google Scholar] [CrossRef]
- Li, S.Y.; Zhang, D.Y.; Gao, Q.; Li, B.; He, Y.; Wang, Z.H. Temperature measurement in combustion flow field with femtosecond laser-induced filament. Acta Phys. Sin. 2020, 69, 234207. [Google Scholar]
- Li, Y.; Gao, W.; Zhang, P.; Fu, Z.; Cao, X. Influence of the equivalence ratio on the knock and performance of a hydrogen direct injection internal combustion engine under different compression ratios. Int. J. Hydrog. Energy 2021, 46, 11982–11993. [Google Scholar] [CrossRef]
- Wang, X.; Jin, T.; Luo, K.H. Response of heat release to equivalence ratio variations in high karlovitz premixed H2/air flames at 20 atm. Int. J. Hydrog. Energy 2019, 44, 3195–3207. [Google Scholar] [CrossRef]
- Al-Farayedhi, A.A.; Antar, M.A.; Khan, A. Effect of the equivalence ratio on the concentration of CH4/NO2/O2 combustion products. Int. J. Energy Res. 2015, 23, 1165–1175. [Google Scholar] [CrossRef]
- Zhang, D.Y.; Gao, Q.; Li, B.; Zhu, Z.F.; Li, Z.S. Instantaneous one-dimensional equivalence ratio measurements in methane/air mixtures using femtosecond laser-induced plasma spectroscopy. Opt. Express. 2019, 27, 2160. [Google Scholar] [CrossRef]
- Kasparian, J.; Wolf, J.P. Physics and applications of atmospheric nonlinear optics and filamentation. Opt. Express. 2008, 16, 466–493. [Google Scholar] [CrossRef]
- Zang, H.W.; Yao, D.W.; Wang, S.Q.; Fu, Y.; Zhang, W.; Chen, S.M.; Li, H.L.; Xu, H.L. In situ determination of the equivalence ratio in a methane/air flow field by femtosecond filament excitation. Laser Phys. 2020, 30, 035402. [Google Scholar] [CrossRef]
- Simek, M.; Babický, V.; Clupek, M.; Sunka, P. Observation of the N2 Herman infrared system in pulsed positive streamer induced emission at atmospheric pressure. J. Phys. D Appl. Phys. 2001, 34, 3185–3190. [Google Scholar] [CrossRef]
- Keith, S.; Martin, S. CH and C2 Measurements Imply a Radical Pool within a Pool in Acetylene Flames. J. Phys. Chem. A 2007, 111, 2098–2114. [Google Scholar]
- Xu, H.L.; Azarm, A.; Bernhardt, J.; Kamali, Y.; Chin, S.L. The mechanism of nitrogen fluorescence inside a femtosecond laser filament in air. Chem. Phys. 2009, 360, 171–175. [Google Scholar] [CrossRef]
- Kong, F.; Luo, Q.; Xu, H.L.; Sharifi, M.; Song, D.; Chin, S.L. Explosive photodissociation of methane induced by ultrafast intense laser. J. Chem. Phys. 2006, 125, 133320. [Google Scholar] [CrossRef] [PubMed]
- Pintassilgo, C.D.; Cernogora, G.; Loureiro, J. Spectroscopy study and modelling of an afterglow created by a low-pressure pulsed discharge in N2–CH4. Plasma Sources Sci. Technol. 2001, 10, 147–161. [Google Scholar] [CrossRef]
- Li, B.; Zhang, D.Y.; Li, X.F.; Gao, Q.; Zhu, Z.F.; Li, Z.S. Femtosecond laser-induced cyano chemiluminescence in methane-seeded nitrogen gas flows for near-wall velocimetry. J. Phys. D Appl. Phys. 2018, 51, 295102. [Google Scholar] [CrossRef]
- Zimmer, L.; Tachibana, S. Laser induced plasma spectroscopy for local equivalence ratio measurements in an oscillating combustion environment. Proc. Combust. Inst. 2007, 31, 737–745. [Google Scholar] [CrossRef]
- Joshi, S.; Olsen, D.B.; Dumitrescu, C.; Puzinauskas, P.V.; Yalin, A.P. Laser-induced breakdown spectroscopy for in-cylinder equivalence ratio measurements in laser-ignited natural gas engines. Appl. Spectrosc. 2009, 63, 549–554. [Google Scholar] [CrossRef]
- Zhang, S.H.; Yu, X.L.; Li, F.; Kang, G.J.; Chen, L.H.; Zhang, X.Y. Laser induced breakdown spectroscopy for local equivalence ratio measurement of kerosene/air mixture at elevated pressure. Opt. Lasers Eng. 2012, 50, 877–882. [Google Scholar] [CrossRef]
- Kammermann, T.; Merotto, L.; Bleiner, D.; Soltic, P. Spark-induced breakdown spectroscopy for fuel-air equivalence ratio measurements at internal combustion engine-relevant conditions. Spectrochim. Acta Part B At. Spectrosc. 2019, 155, 79–89. [Google Scholar] [CrossRef]
- Liu, W.; Chin, S.L. Direct measurement of the critical power of femtosecond Ti:sapphire laser pulse in air. Opt. Express 2005, 13, 5750–5755. [Google Scholar] [CrossRef] [PubMed]
- Li, H.L.; Chu, W.; Zang, H.W.; Xu, H.L.; Cheng, Y.; Chin, S.L. Critical power and clamping intensity inside a filament in a flame. Opt. Express 2016, 24, 3424–3431. [Google Scholar] [CrossRef] [PubMed]
- Loriot, V.; Hertz, E.; Faucher, O.; Lavorel, B. Measurement of high order Kerr refractive index of major air components: Erratum. Opt. Express 2010, 18, 3011–3012. [Google Scholar] [CrossRef]
- Shaw, M.J.; Hooker, C.J.; Wilson, D.C. Measurement of the nonlinear refractive index of air and other gases at 248 nm. Opt. Commun. 1993, 103, 153–160. [Google Scholar] [CrossRef]
- Wu, J.B.; Wu, Z.Y.; Chen, T.; Zhang, H.; Zhang, Y.F.; Zhang, Y.; Lin, S.; Cai, X.M.; Chen, A.M.; Jiang, Y.F.; et al. Spatial distribution of the fluorescence induced by femtosecond laser filamentation in ambient air. Opt. Laser Technol. 2020, 131, 106417. [Google Scholar] [CrossRef]


| Case | Equivalence Ratio | CH4 Flow Rate (10−4 m3/s) | Air Flow Rate (10−4 m3/s) | Total Flow Rate (10−4 m3/s) |
|---|---|---|---|---|
| 1 | 0.6 | 0.98 | 3.26 | 4.24 |
| 2 | 0.8 | 1.21 | 3.03 | 4.24 |
| 3 | 1 | 1.41 | 2.83 | 4.24 |
| 4 | 1.2 | 1.59 | 2.65 | 4.24 |
| 5 | 1.4 | 1.75 | 2.49 | 4.24 |
| 6 | 1.6 | 1.88 | 2.36 | 4.24 |
| Component | Wavelength | Transition |
|---|---|---|
| CH | ~314 nm | C2Σ+−X2Π (0, 0) |
| N2 | ~337 nm | C3Πu−B3Πg (0, 0) |
| N2 | ~357 nm | C3Πu−B3Πg (0, 1) |
| CN | ~388 nm | B2Σ+−Χ2Σ+ (0, 0) |
| CH | ~388 nm | B2Σ−−Χ2Π (0, 0) |
| CH | ~431 nm | A2Δ−Χ2Π (0, 0) |
| C2 | ~516.5 nm | d3Πg−a3Πu (0, 0) |
| H | ~656 nm | 3p2P−2s2S |
Publisher’s Note: MDPI stays neutral with regard to jurisdictional claims in published maps and institutional affiliations. |
© 2021 by the authors. Licensee MDPI, Basel, Switzerland. This article is an open access article distributed under the terms and conditions of the Creative Commons Attribution (CC BY) license (https://creativecommons.org/licenses/by/4.0/).
Share and Cite
Li, M.; Gu, J.; Zhang, D.; Gao, Q.; Li, B. Equivalence Ratio Measurements in CH4/Air Gases Based on the Spatial Distribution of the Emission Intensity of Femtosecond Laser-Induced Filament. Processes 2021, 9, 2022. https://doi.org/10.3390/pr9112022
Li M, Gu J, Zhang D, Gao Q, Li B. Equivalence Ratio Measurements in CH4/Air Gases Based on the Spatial Distribution of the Emission Intensity of Femtosecond Laser-Induced Filament. Processes. 2021; 9(11):2022. https://doi.org/10.3390/pr9112022
Chicago/Turabian StyleLi, Ming, Jiangpeng Gu, Dayuan Zhang, Qiang Gao, and Bo Li. 2021. "Equivalence Ratio Measurements in CH4/Air Gases Based on the Spatial Distribution of the Emission Intensity of Femtosecond Laser-Induced Filament" Processes 9, no. 11: 2022. https://doi.org/10.3390/pr9112022
APA StyleLi, M., Gu, J., Zhang, D., Gao, Q., & Li, B. (2021). Equivalence Ratio Measurements in CH4/Air Gases Based on the Spatial Distribution of the Emission Intensity of Femtosecond Laser-Induced Filament. Processes, 9(11), 2022. https://doi.org/10.3390/pr9112022