
Influencing Factors on the Accuracy of Soil Calibration Models by EDG

Abstract
:1. Introduction
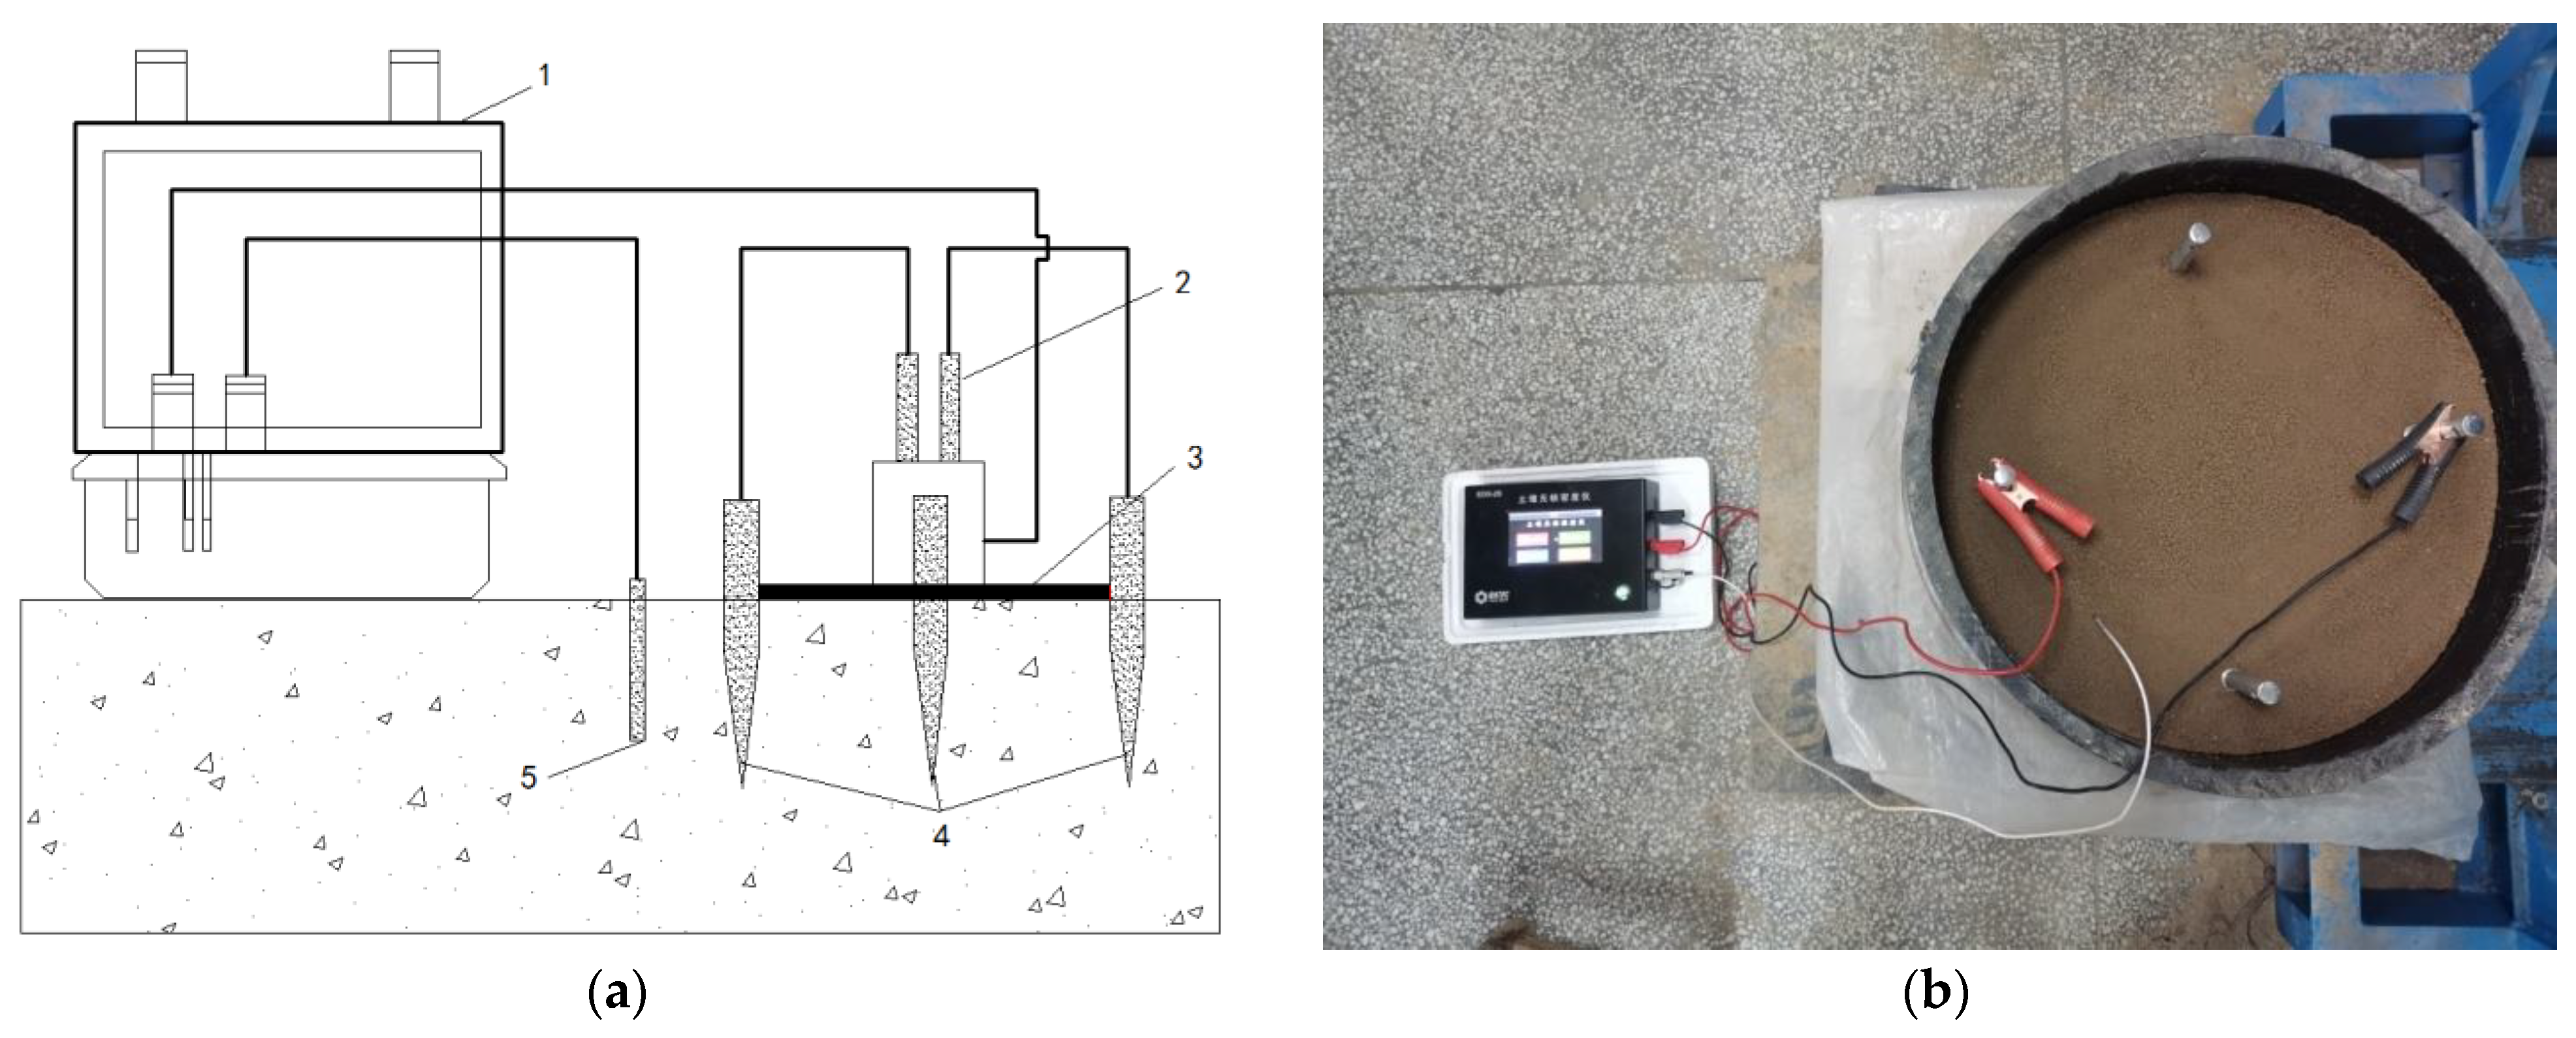
2. Test Principle
3. Calibration and Verification
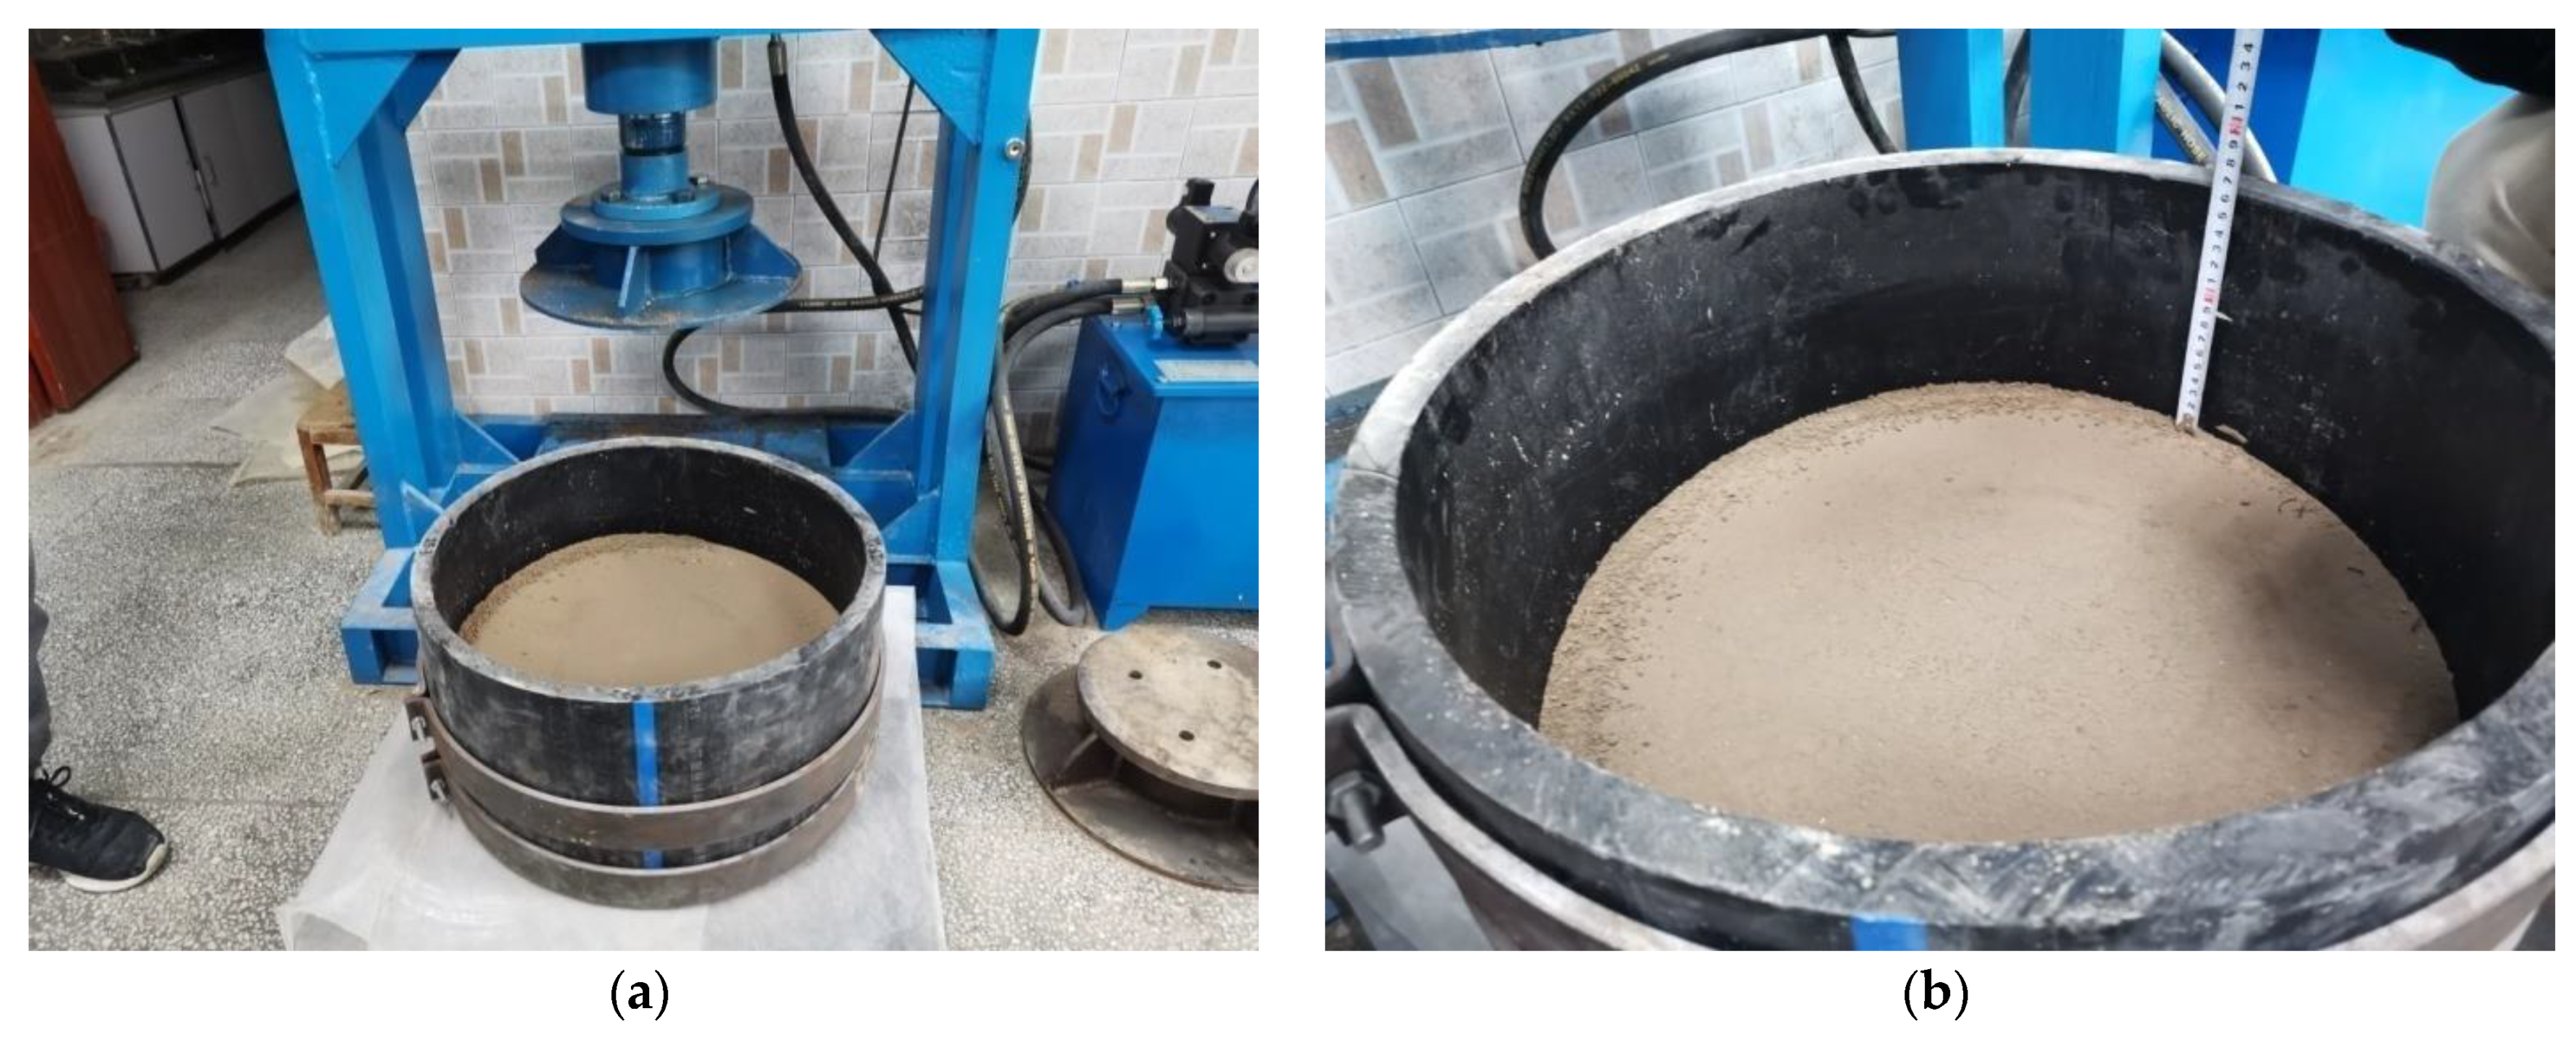
3.1. Soil Sample Properties and Test Method
3.2. Effect of Density and Water Content Ranges of Soil Samples
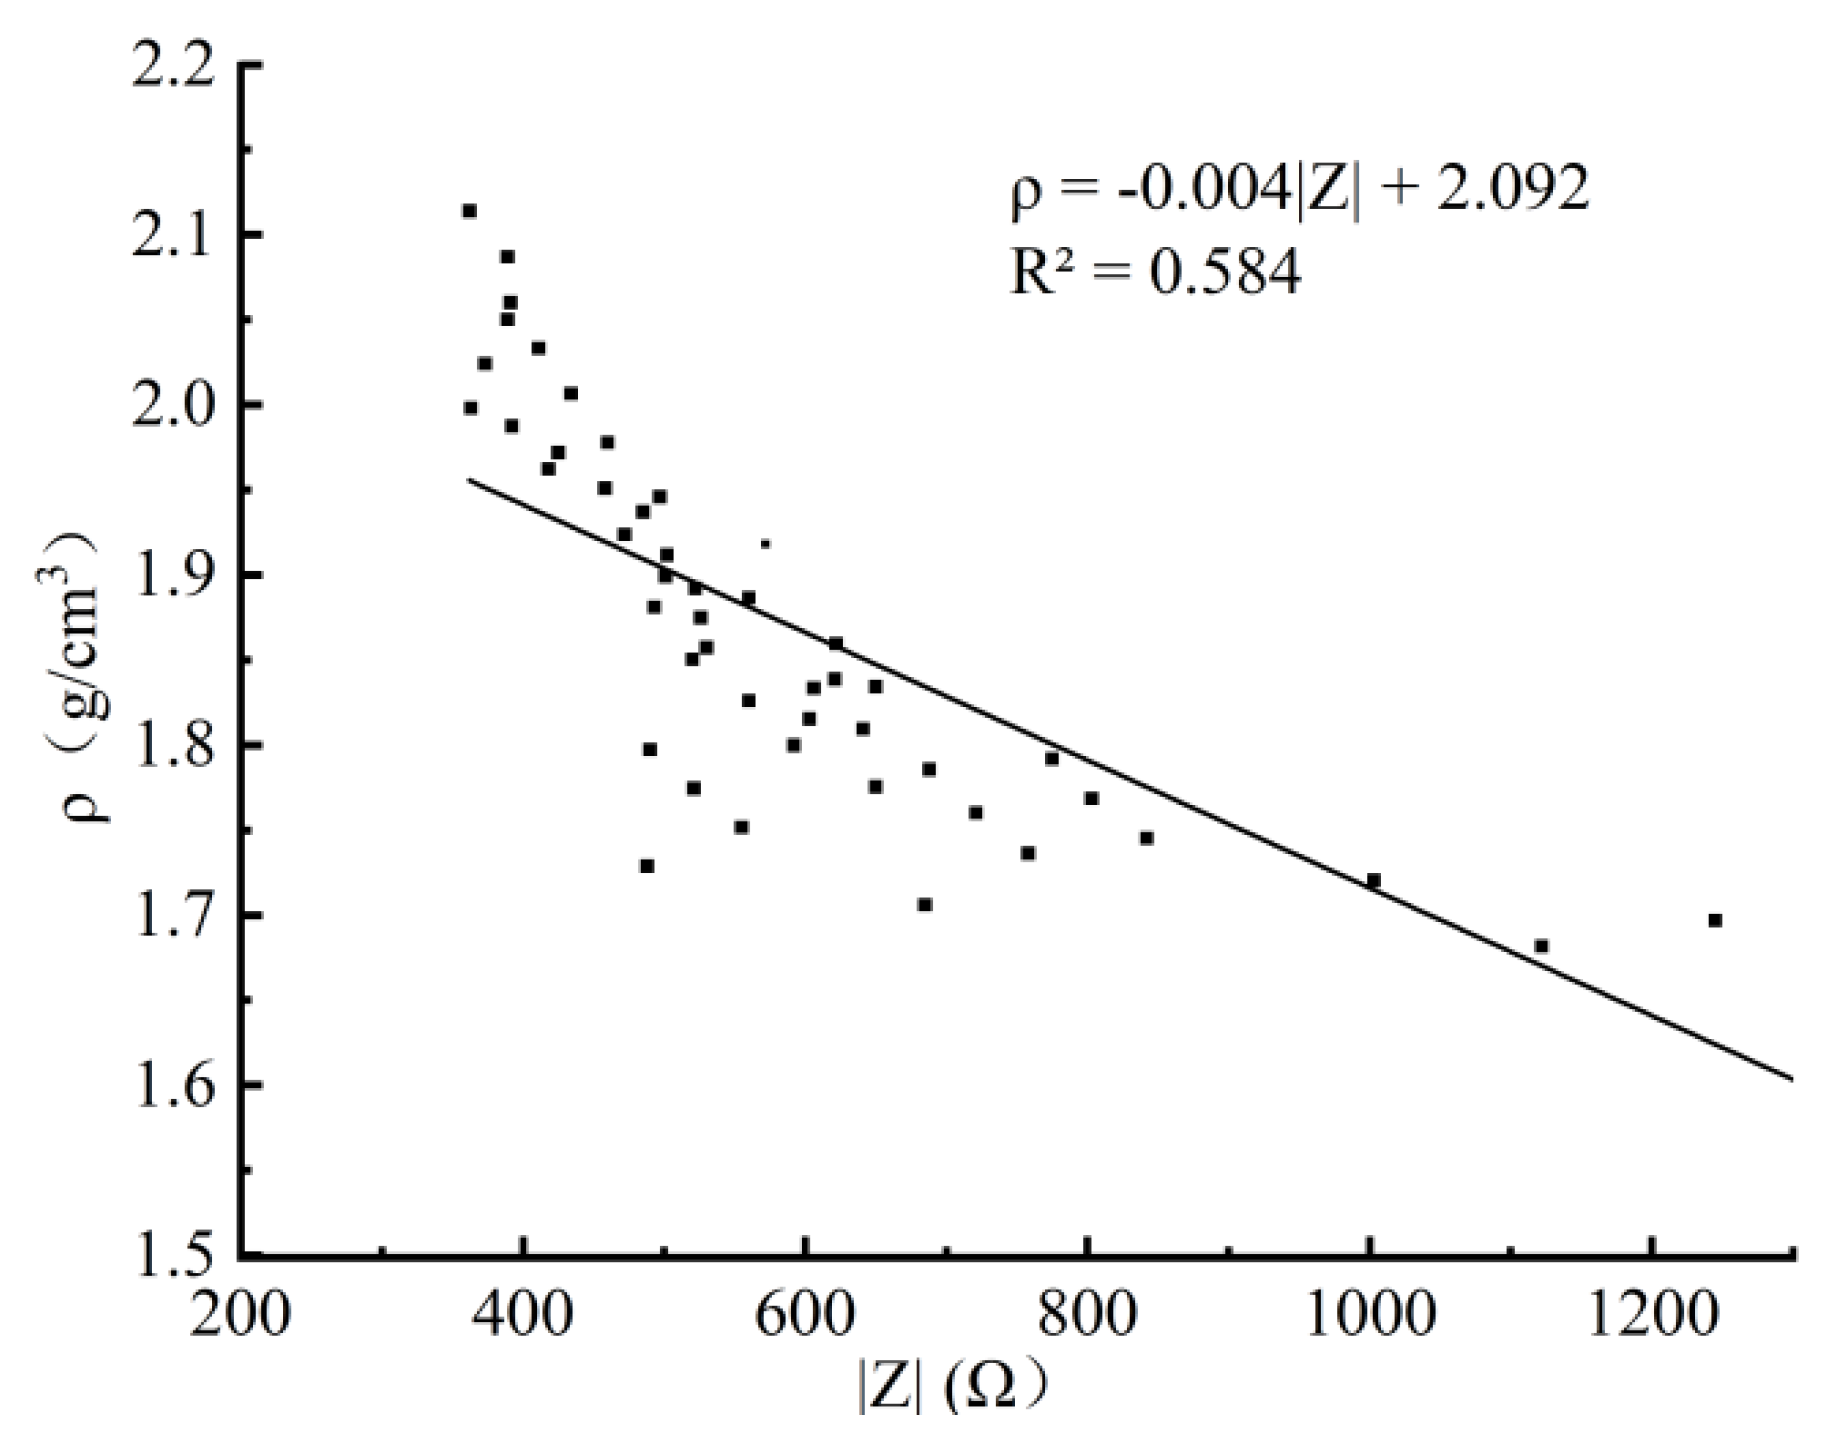
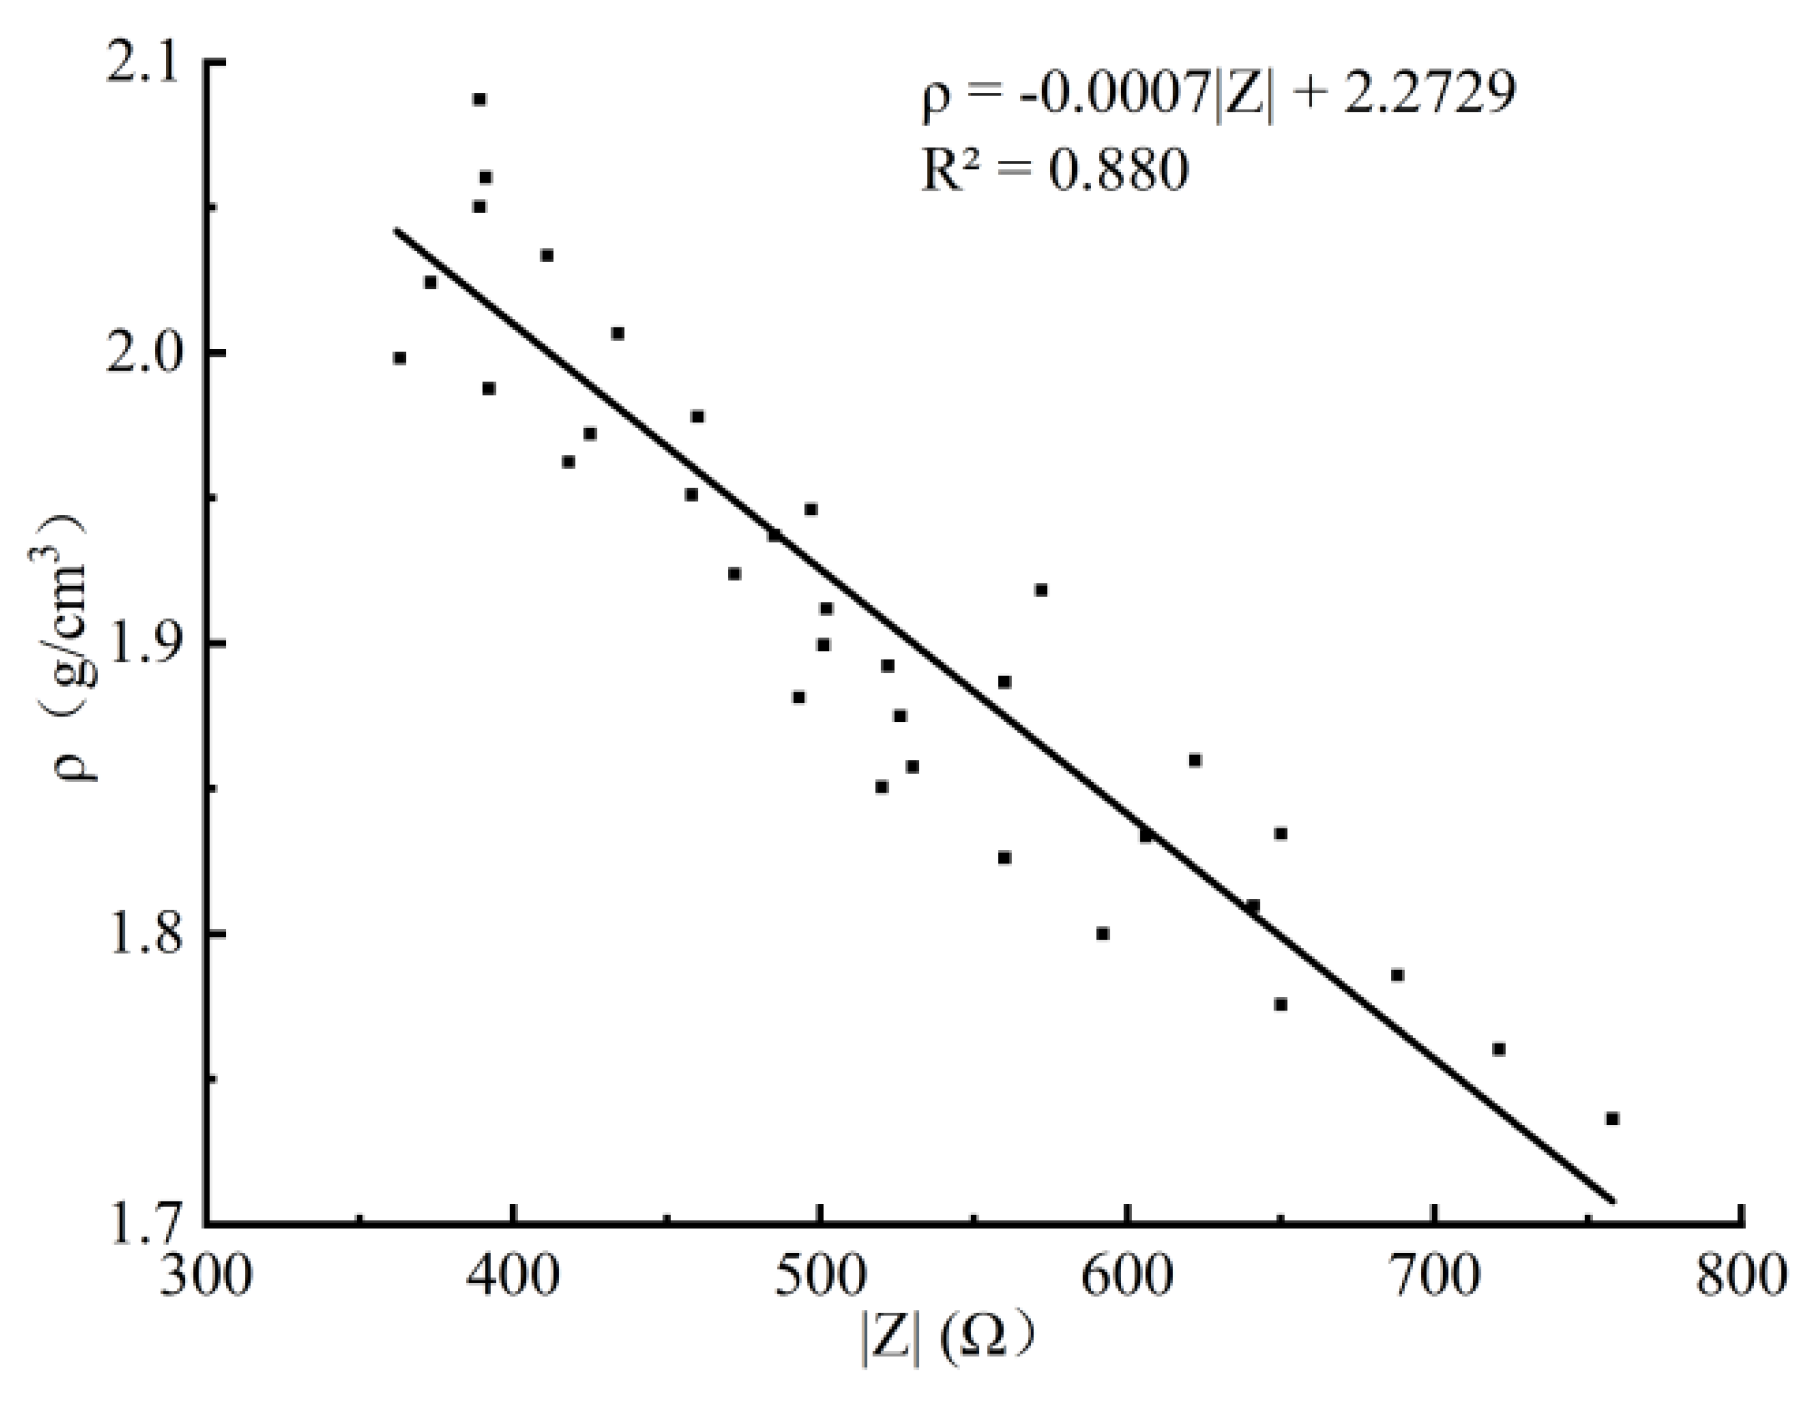
3.2.1. Effect of Soil Density Range
3.2.2. Effect of Soil Water Content Range
3.3. Effect of SamplingSizeon the Accuracy of Soil Calibration Model
4. Verification and Comparison of the Accuracy of Soil Calibration Model
- (1)
- When the number of samples used to establish the ρ-|Z| calibration equation increased, the relative error of dry density measurements decreased, the frequency of −2–2% increased, and the expected value μ decreased, suggesting that the central tendency position of the measurements was close to the point 0; the standard deviation σ also decreased, indicating that the dispersion of the measurements was decreasing.
- (2)
- When the number of samples used to establish the θv-R/C calibration equation increased, the relative error of water content measurements did not significantly change, and the expected value μ decreased, suggesting that the central tendency position of the measurements was close to the point 0; the standard deviation σ did not significantly change, indicating that the dispersion of the measurements had little change.
- (3)
- When the number of samples used to establish the ρ-|Z| calibration equation was equal, namely 6 sample data and 12 sample data, the number of dry density groups was greater than the number of water content groups; both the expected value μ and the standard deviation σ were small, suggesting that this calibration equation was more advantageous for dry density measurements.
- (4)
- The accuracy of water content measurements was significantly higher than those of dry density measurements, which was consistent with the case where the R2 of θv-R/C calibration equation was higher than that of the ρ-|Z| calibration equation.
5. Conclusions
- (1)
- The dry density and water content ranges of soil samples, whose setting was closely related to the maximum dry density (ρmax) and optimal water content (wop) of the soil samples, had a significant influence on the R2 of calibration equations. When the compaction (K) of the soil samples was 0.89–1.00 and the water content range (w) was wop − 6.0%–wop +1.0%, R2 ≥ 0.85 (R2 of ρ-|Z| and θv-R/C calibration equations).
- (2)
- The number of samples had a significant influence on the R2 of ρ-|Z| and θv-R/C calibration equations. The average R2 of ρ-|Z| and θv-R/C calibration equations generated by four sample data points was significantly lower than that generated by the six sample data points. The average R2 of ρ-|Z| calibration equation generated by the sixteen sample data points increased slightly, but the average R2 of θv-R/C calibration equation did not significantly change. Therefore, while ensuring the minimum workload in modeling, the soil calibration models generated by six or nine sample data points were believed to meet the accuracy requirements.
- (3)
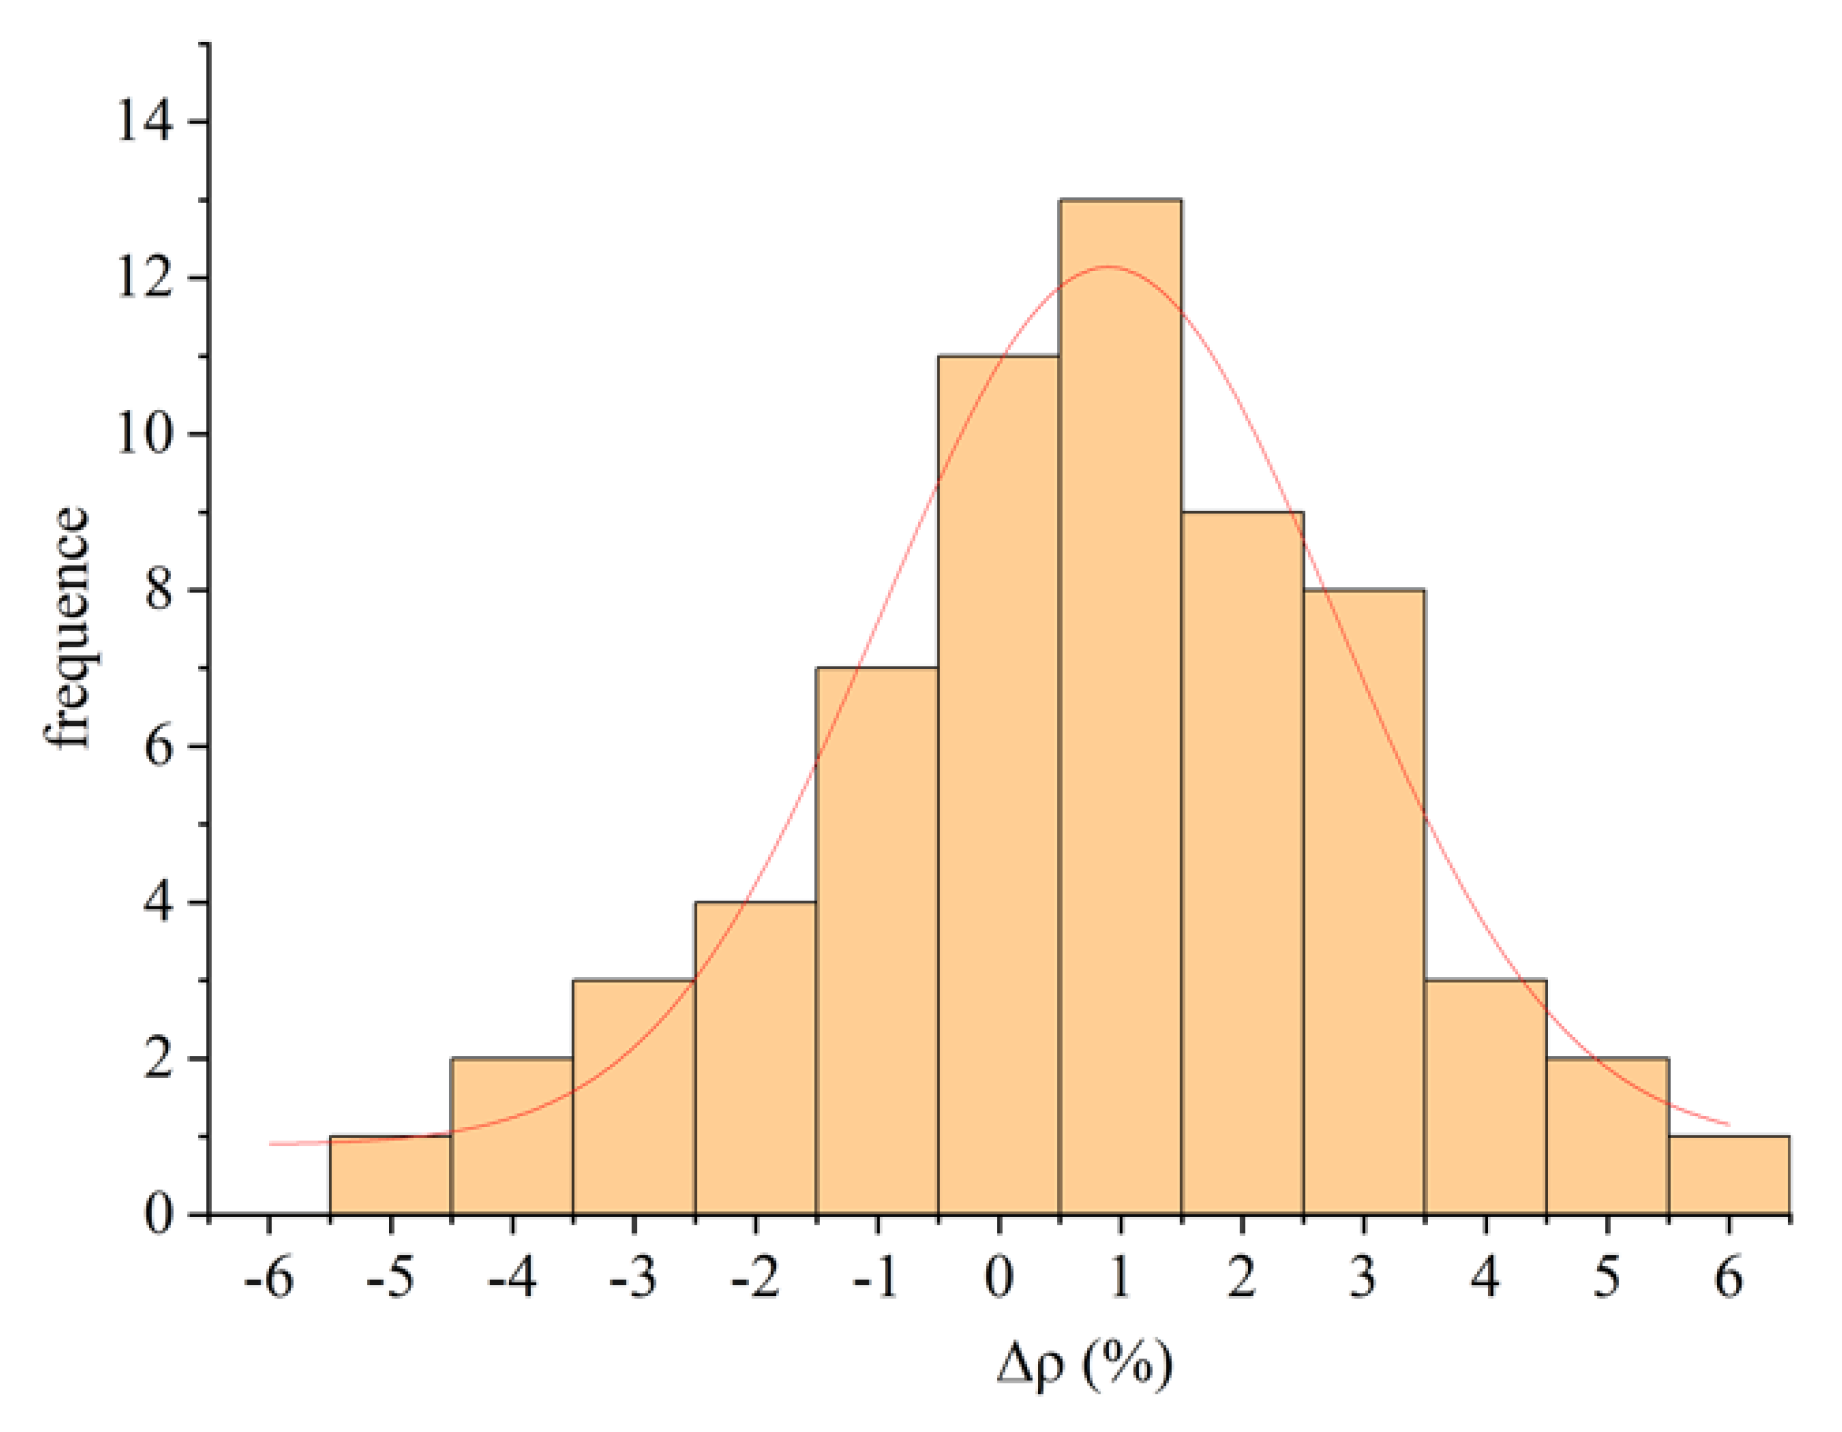
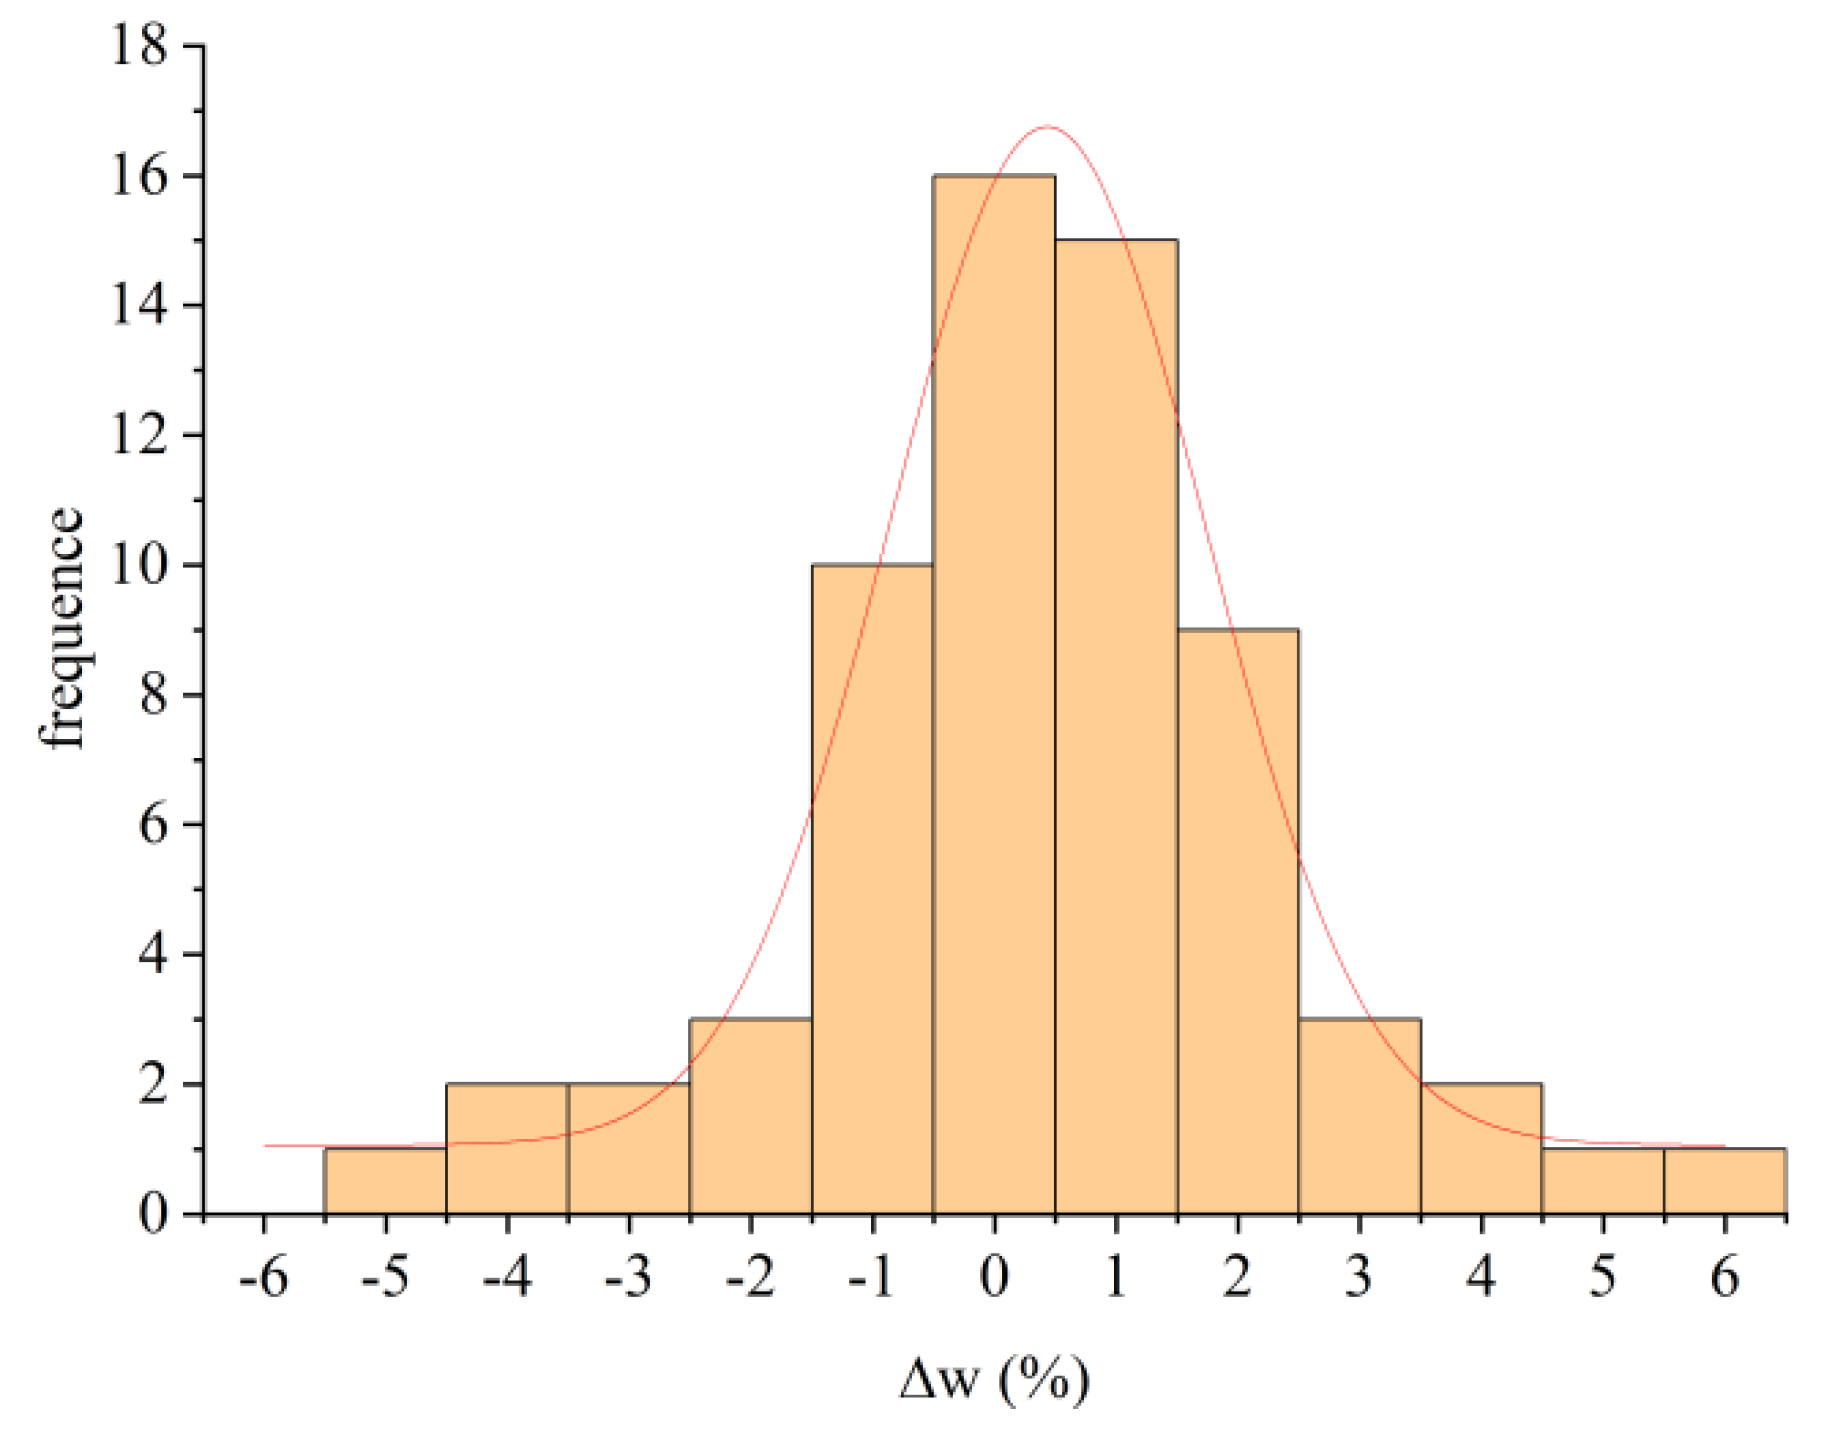
- The frequency curves of the relative errors of dry density and water content measurements showed a normal distribution. Both the expected value μ and the standard deviation σ deviated from 0, and the accuracy of the water content measurements was significantly higher than that of dry density measurements. When the number of samples used to establish the ρ-|Z| calibration equation increased, both the expected value μ and the standard deviation σ decreased slightly, suggesting that the central tendency position of the measurements was close to the point 0 and the dispersion of the measurements was decreasing. When the number of samples used to establish the θv ‒ R/C calibration equation increased, the expected value μ decreased, and the standard deviation σ did not significantly change.
- (4)
- When the number of samples used to establish the ρ-|Z| calibration equation wasequal, namely 6 sample data and 12 sample data, and the number of dry density groups was greater than the number of water content groups, both the expected value μ and the standard deviation σ were small, suggesting that this calibration equation was more advantageous for dry density measurements.
Author Contributions
Funding
Institutional Review Board Statement
Informed Consent Statement
Data Availability Statement
Conflicts of Interest
References
- Veenstra, M.W.; Schaefer, V.R.; White, D.J. Synthesis of nondestructive testing technologies for geometrical applications. Cent. Transp. Res. Educ. 2005, 8, 78–79. [Google Scholar]
- Randrup, T.B.; Lichter, J.M. Measuring soil compaction on construction sites: A review of surface nuclear gauges and penetrometers. J. Arboric. 2001, 27, 109–117. [Google Scholar]
- Fares, A.; Hamdhani, H.; Jenkins, D.M. Temperature-Dependent scaled frequency: Improved accuracy of multisensor capacitance probes. Soil Sci. Soc. Am. J. 2007, 71, 894–900. [Google Scholar] [CrossRef]
- Gamache, R.W.; Kianirad, E.; Pluta, S.E.; Jersey, S.; Alshawabkeh, A.N. Rapid field soil characterization system for construction control. In Proceedings of the Transportation Research Board 88th Annual Meeting, Washington, DC, USA, 11–15 January 2009; p. 09-2767. [Google Scholar]
- Yu, X.; Drnevich, V.P. Soil water content and dry density by time domain reflectometry. J. Geotech. Geo-Environ. Eng. 2004, 130, 922–934. [Google Scholar] [CrossRef]
- American Society for Testing and Materrial. D7698-11 Standard Test Methof for in-Place Estimation of Density and Water Content of Soil and Aggregate by Correlation with Complex Impedance Method; American Society for testing and Material (ASTM): West Conshohocken, PA, USA, 2011. [Google Scholar]
- Wang, L.; Yang, T.; Wang, B.; Lin, Q.; Zhu, S.; Li, C.; Ma, Y.; Tang, J.; Xing, J.; Li, X.; et al. RALF1-FERONIA complex affects splicing dynamics to modulate stress responses and growth in plants. Sci. Adv. 2020, 6, z1622. [Google Scholar] [CrossRef] [PubMed]
- He, L.; Shao, F.; Ren, L. Sustainability appraisal of desired contaminated groundwater remediation strategies: An information-entropy-based stochastic multi-criteria preference model. Environ. Dev. Sustain. 2020, 23, 1759–1779. [Google Scholar] [CrossRef]
- Jeff, B.; Willam, E.A. Non-Nuclear Compaction Gauge Comparison Study (Final Report); State of Vermont Agency of Transportation Materials and Research Section: Montpelier, VT, USA, 2007. [Google Scholar]
- Hertz, J.S.; Meehan, C.L. Comparisons of Data from a Complex-Impedance Measuring Instrument and Conventional Compaction Control Tests; American Society of Civil Engineers Geo-Congress: San Diego, CA, USA, 2013; pp. 353–362. [Google Scholar]
- Ernest, S.B.; Mariely, M.S.; James, D.K. Non-Nuclear Alternatives to Monitoring Moisture-Density Response in Soils; U.S. Army Engineer Research and Development Center: Vicksburg, MS, USA, 2013. [Google Scholar]
- Wang, X.; Zhao, X.S.; Ai, C.G.; Mo, L.L. Study on accuracy improvement of laboratory compaction experiment. J. East China Jiaotong Univ. 2013, 30, 18–23. [Google Scholar]
- Yin, S.; Kong, L.W.; Yang, A.W.; Kun, M. Indoor experimental study of road performance of granite residual soil for subgrade materials. Rock Soil Mech. 2016, 37, 287–293. [Google Scholar]
- Zheng, J.G.; Yang, Q.F.; Liu, Z.H.; Yu, Y.T.; Du, W.F.; Chen, X.S. Experimental study of soil model and test error of electronic density gauge. Chin. J. Rock Mech. Eng. 2016, 35, 1697–1704. [Google Scholar]
- Jiao, T.; Nie, Z.H.; Wang, X. Evaluation of compaction weak areas based on continuous compaction quality detection. J. China Railw. Soc. 2015, 37, 66–71. [Google Scholar]
- Li, D.X.; Wang, Y.F.; Cheng, L.; Yan, L.M.; Chen, B.C. Earth-filled construction and quality control in Zhengzhou section of the middle south-to-north water transfer project. J. North China Inst. Water Conserv. Hydroelectr. Power 2012, 33, 13–15. [Google Scholar]
- Ma, J.C. Settlement and Deformation Characteristics of High Embankment Based on Unsaturated Theory; China University of Geosciences: Wuhan, China, 2018. [Google Scholar]
- He, L.; Shen, J.; Zhang, Y. Ecological vulnerability assessment for ecological conservation and environmental management. J. Environ. Manag. 2018, 206, 1115–1125. [Google Scholar] [CrossRef]


| Indicator | GS | ρmax (g/cm3) | wop (%) | Cu | Cc | Ip |
|---|---|---|---|---|---|---|
| Value | 2.71 | 1.79 | 15.9 | 3.8 | 1.96 | 12.3 |
| No. | 1 | 2 | 3 | 4 | 5 | 6 | 7 |
|---|---|---|---|---|---|---|---|
| Control value of compaction | 0.85 | 0.87 | 0.89 | 0.91 | 0.94 | 0.97 | 1.00 |
| Design value of dry density (g/cm3) | 1.522 | 1.557 | 1.593 | 1.629 | 1.683 | 1.736 | 1.790 |
| Water content (%) | 9.9 | 10.9 | 11.9 | 12.9 | 13.9 | 14.9 | 15.9 |
| Group No. | A1 | A2 | A3 | A4 | A5 | A6 | A7 |
|---|---|---|---|---|---|---|---|
| Compaction range | 0.85–1.00 | 0.85–0.97 | 0.85–0.94 | 0.87–1.00 | 0.87–0.97 | 0.89–0.97 | 0.89–1.00 |
| Correlation coefficient R2 | 0.584 | 0.596 | 0.613 | 0.750 | 0.766 | 0.869 | 0.880 |
| No. | 1 | 2 | 3 | 4 | 5 | 6 | 7 | 8 | 9 | 10 | 11 | 12 | 13 |
|---|---|---|---|---|---|---|---|---|---|---|---|---|---|
| Water content (%) | 7.9 | 8.9 | 9.9 | 10.9 | 11.9 | 12.9 | 13.9 | 14.9 | 15.9 | 16.9 | 17.9 | 18.9 | 19.9 |
| Group No. | B1 | B2 | B3 | B4 | B5 | B6 | B7 |
|---|---|---|---|---|---|---|---|
| Water content range (%) | 7.9–19.9 | 7.9–18.9 | 8.9–18.9 | 9.9–18.9 | 9.9–17.9 | 9.9–16.9 | 10.9–16.9 |
| Difference with optimum water content | −8.0/+4.0 | −8.0/+3.0 | −7.0/+3.0 | −6.0/+3.0 | −6.0/+2.0 | −6.0/+1.0 | −5.0/+1.0 |
| Correlation coefficient R2 | 0.729 | 0.733 | 0.757 | 0.796 | 0.857 | 0.901 | 0.915 |
| No. | Number of Sample Data Point Groups | Sample Data Combination | Number of Measurements | Average R2 of ρ-|Z| Calibration Equation | Average R2 of θv-R/C Calibration Equation | |
|---|---|---|---|---|---|---|
| Number of Density Groups (n) | Number of Water Content Groups (m) | |||||
| 1 | 4 | 2 | 2 | 3 | 0.793 | 0.848 |
| 2 | 6 | 2 | 3 | 0.887 | 0.913 | |
| 3 | 3 | 2 | 0.893 | 0.902 | ||
| 4 | 9 | 3 | 3 | 0.907 | 0.929 | |
| 5 | 12 | 3 | 4 | 0.894 | 0.913 | |
| 6 | 4 | 3 | 0.916 | 0.924 | ||
| 7 | 16 | 4 | 4 | 0.913 | 0.910 | |
| Model No. | Sample Data Combination | ||||||
|---|---|---|---|---|---|---|---|
| n*m | Dry Density (g/cm3) | Water Content (%) | Calibration Equation | R2 | Calibration Equation | R2 | |
| M1 | 2*3 | 1.593/1.736 | 9.9/12.9/16.9 | = −0.0007 + 2.268 | 0.892 | = 1.4350 + 0.044 | 0.920 |
| M2 | 3*2 | 1.593/1.683/1.790 | 10.9/15.9 | = −0.0008 + 2.349 | 0.902 | = 1.3765 + 0.051 | 0.912 |
| M3 | 3*3 | 1.593/1.683/1.36 | 9.9/13.9/16.9 | = −0.0008 + 2.345 | 0.898 | = 1.5011 + 0.037 | 0.928 |
| M4 | 3*4 | 1.593/1.683/1.790 | 9.9/11.9/13.9/15.9 | = −0.0008 + 2.356 | 0.907 | = 1.3782 + 0.060 | 0.907 |
| M5 | 4*3 | 1.593/1.629/1.736/1.790 | 9.9/12.9/15.9 | = −0.0008 + 2.342 | 0.913 | = 1.3951 + 0.058 | 0.901 |
| Model No. | Sample Data Combination | Relative Error Frequency of Dry Density | Relative Error Frequency of Water Content | ||
|---|---|---|---|---|---|
| μ | σ | μ | σ | ||
| M1 | 2*3 | 1.02 | 2.79 | 0.73 | 1.68 |
| M2 | 3*2 | 0.68 | 2.42 | 0.62 | 1.57 |
| M3 | 3*3 | 0.77 | 2.51 | −0.42 | 1.83 |
| M4 | 3*4 | −0.68 | 2.60 | −0.50 | 1.41 |
| M5 | 4*3 | 0.55 | 2.48 | 0.48 | 1.56 |
| Model No. | Sample Data Combination | Probability Curve of the Relative Error Frequency of Dry Density | Probability Curve of the Relative Error Frequency of Water Content | ||
|---|---|---|---|---|---|
| μ | σ | μ | σ | ||
| M1 | 2*3 | 0.97 | 3.59 | 0.73 | 1.68 |
| M2 | 3*2 | 0.68 | 3.12 | 0.62 | 1.57 |
| M3 | 3*3 | 0.77 | 3.06 | −0.42 | 1.83 |
| M4 | 3*4 | −0.62 | 2.92 | −0.50 | 1.41 |
| M5 | 4*3 | 0.55 | 2.72 | 0.48 | 1.56 |
Publisher’s Note: MDPI stays neutral with regard to jurisdictional claims in published maps and institutional affiliations. |
© 2021 by the authors. Licensee MDPI, Basel, Switzerland. This article is an open access article distributed under the terms and conditions of the Creative Commons Attribution (CC BY) license (https://creativecommons.org/licenses/by/4.0/).
Share and Cite
Yang, H.; Yang, X.; Zhang, M.; Hou, J. Influencing Factors on the Accuracy of Soil Calibration Models by EDG. Processes 2021, 9, 1892. https://doi.org/10.3390/pr9111892
Yang H, Yang X, Zhang M, Hou J. Influencing Factors on the Accuracy of Soil Calibration Models by EDG. Processes. 2021; 9(11):1892. https://doi.org/10.3390/pr9111892
Chicago/Turabian StyleYang, Haoming, Xiaoping Yang, Min Zhang, and Jiaojian Hou. 2021. "Influencing Factors on the Accuracy of Soil Calibration Models by EDG" Processes 9, no. 11: 1892. https://doi.org/10.3390/pr9111892
APA StyleYang, H., Yang, X., Zhang, M., & Hou, J. (2021). Influencing Factors on the Accuracy of Soil Calibration Models by EDG. Processes, 9(11), 1892. https://doi.org/10.3390/pr9111892