Article

Investigation of Hydrogen Content and Dilution Effect on Syngas/Air Premixed Turbulent Flame Using OH Planar Laser-Induced Fluorescence

1
Key Laboratory for Technology in Rural Water Management of Zhejiang Province, Zhejiang University of Water Resources and Electric Power, Hangzhou 310018, China
2
College of Electrical Engineering, Zhejiang University of Water Resources and Electric Power, Hangzhou 310018, China
3
Division of Combustion Physics, Lund University, P.O. Box 118, S-22100 Lund, Sweden
4
State Key Laboratory of Clean Energy Utilization, Zhejiang University, Hangzhou 310012, China
*
Author to whom correspondence should be addressed.
Processes 2021, 9(11), 1894; https://doi.org/10.3390/pr9111894
Submission received: 6 October 2021 / Revised: 15 October 2021 / Accepted: 20 October 2021 / Published: 23 October 2021
(This article belongs to the Special Issue Advanced Combustion and Combustion Diagnostic Techniques)

Abstract

:
Syngas produced by gasification, which contains a high hydrogen content, has significant potential. The variation in the hydrogen content and dilution combustion are effective means to improve the steady combustion of syngas and reduce NOx emissions. OH planar laser-induced fluorescence technology (OH-PLIF) was applied in the present investigation of the turbulence of a premixed flame of syngas with varied compositions of H2/CO. The flame front structure and turbulent flame velocities of syngas with varied compositions and turbulent intensities were analyzed and calculated. Results showed that the trend in the turbulent flame speed with different hydrogen proportions and dilutions was similar to that of the laminar flame speed of the corresponding syngas. A higher hydrogen proportion induced a higher turbulent flame speed, higher OH concentration, and a smaller flame. Dilution had the opposite effect. Increasing the Reynolds number also increased the turbulent flame speed and OH concentration. In addition, the effect of the turbulence on the combustion of syngas was independent of the composition of syngas after the analysis of the ratio between the turbulent flame speed and the corresponding laminar flame speed, for the turbulent flames under low turbulent intensity. These research results provide a theoretical basis for the practical application of syngas with a complex composition in gas turbine power generation.

1. Introduction

Syngas, which is mainly composed of hydrogen and CO, is considered a form of potential fuel and has wide application prospects in gas turbine power generation. However, like all other fossil fuels, syngas emits pollutants such as NOx as it burns. Diluting the combustion mixture is a general method to control NOx emissions [1,2,3], especially with high temperature diluents to create a distributed reaction zone and mild combustion [2]. Gas diluents, which normally denote incombustible gas, including N2, CO2, H2O, and exhaust gas re- circulation (EGR) [4], can significantly reduce the chemical reaction rate and temperature of the reaction zone, and thus decrease the formation of NOx. The utilization of low calorific value (LCV) gas fuels, including a massive amount of incombustible gas, such as syngas, is a typical dilution combustion. It is of great significance to study the effect of dilution on the combustion characteristics of syngas in future applications.
Mixing hydrogen with hydrocarbon fuels can significantly reduce carbon emissions. Premixed, lean-burn is an effective combustion method to reduce the emission of nitrogen oxide [5]. The premixed dilution combustion of hydrogen-blended fuel is also an important method to improve efficiency and reduce emissions of gas turbine [6].
Laser diagnostic technologies, including planar laser-induced fluorescence (PLIF) and Rayleigh scattering (RS), are widely used in the research of combustion. PLIF technology is used widely, especially for turbulent combustion, and much essential information of flames can be obtained, such as the structure of the turbulent flame [7,8], OH radical laser measurement [9,10], and other intermediate free radical products [11]. Zhang et al. [12] investigated the turbulent premixed flame structure characteristics of hydrogen-enriched methane/air flames diluted with CO2 using OH-PLIF and revealed the role of hydrogen addition and CO2 dilution on the features of the turbulent flame. Zhang et al. [4] pointed out that both CO2 and H2O diluents have a certain effect on inhibiting the NO generation of CH4/air premixed flame by OH-PLIF and Fluent in combination with the simplified mechanism. Zhang et al. [13] studied the influence of hydrogen addition on the detailed flame structure of turbulent premixed flame of CH4/H2/air mixture using CH2O/OH PLIF and revealed that hydrogen broadens the reaction zone slightly but largely decreases the preheat zone thickness.
The effect of N
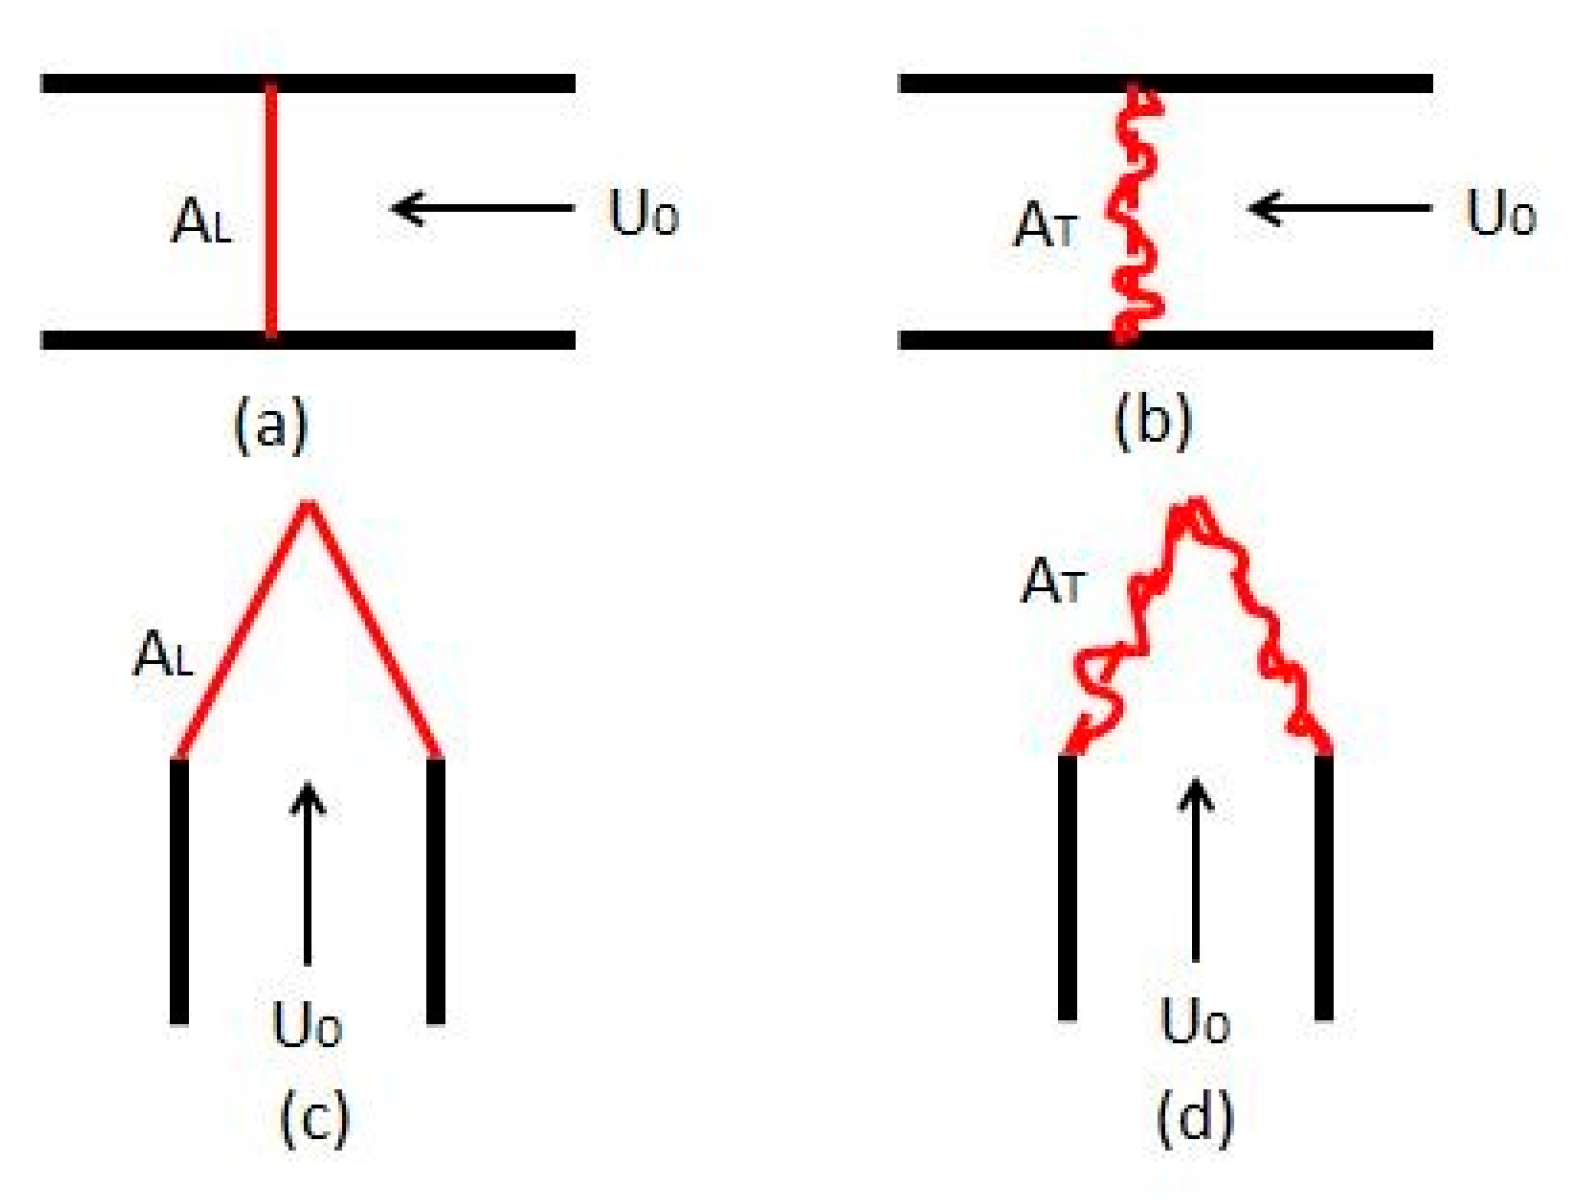
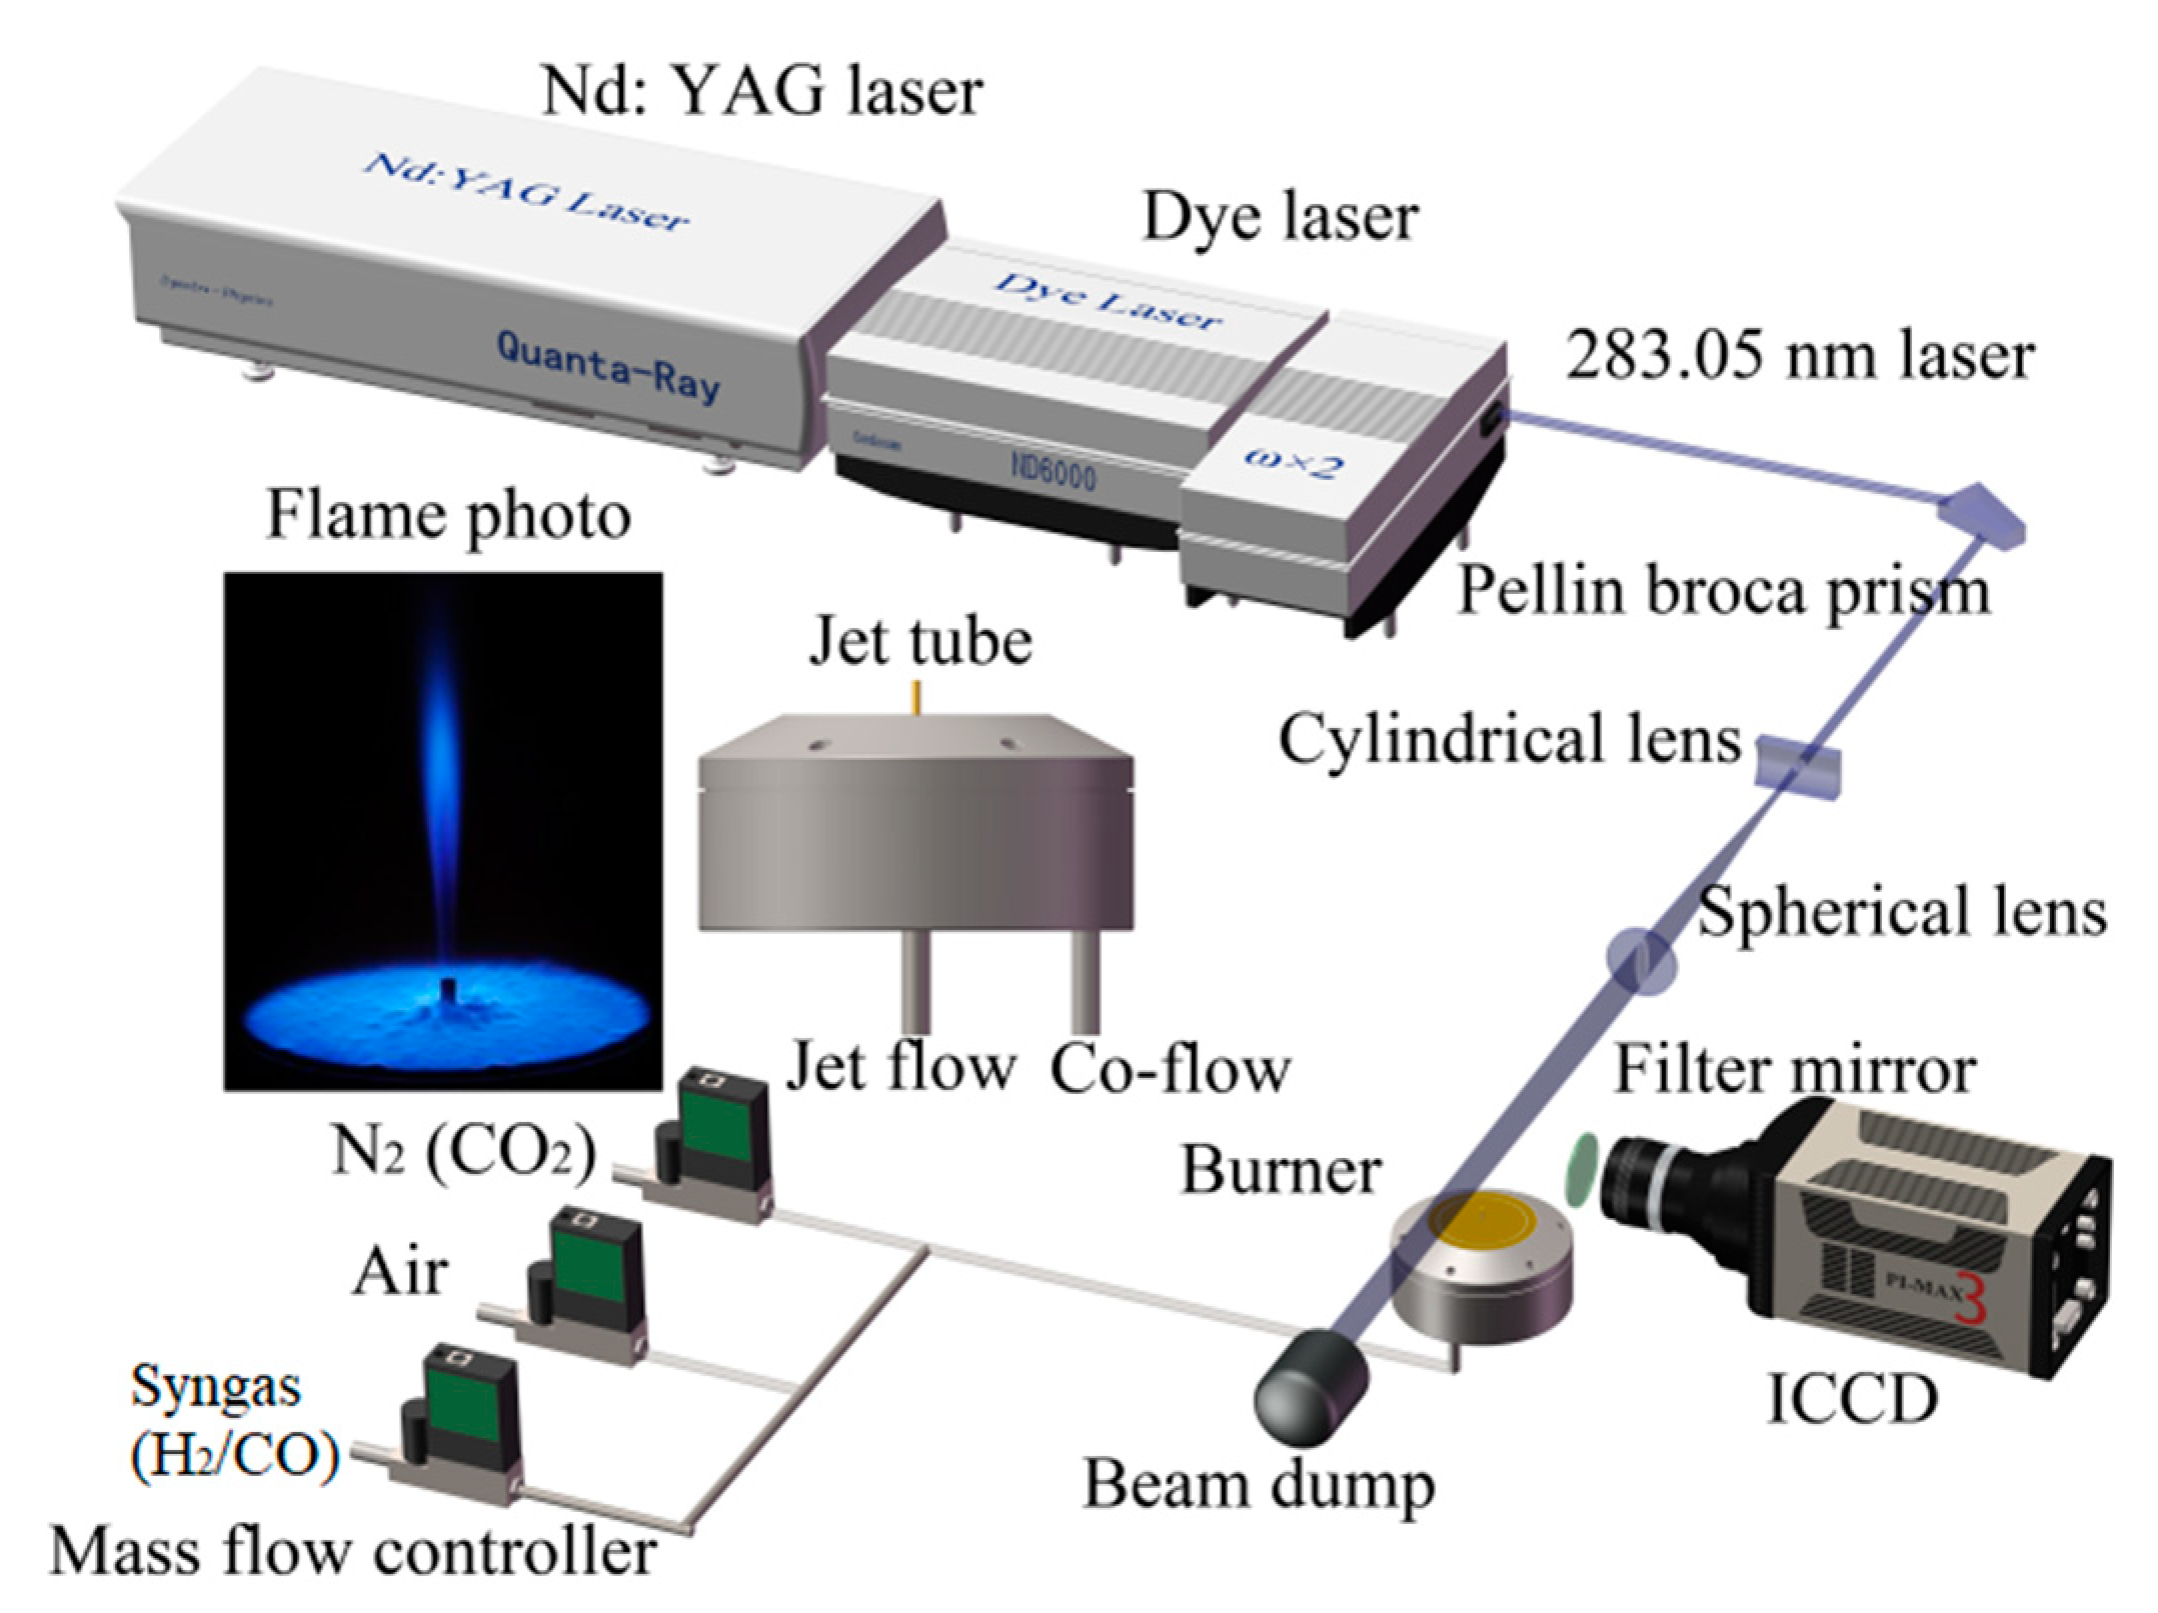
2 dilution and hydrogen content on the combustion characteristics of the syngas/air premixed turbulent flame with different dilution ratios and different exit Reynolds numbers was examined in the present work. The distribution of free radical OH in the jet flame was measured by PLIF, which was mainly used to obtain the structure of the flame front and to extract the turbulent flame velocity [2]. Different fuels were studied, which mainly consisted of a mixture of hydrogen and carbon monoxide in different proportions. The ratio of hydrogen to carbon monoxide varied from 5/95 to 75/25, which represented different types of syngas. In order to determine the effect of a high degree of dilution on the premixed turbulent flame, the proportion of dilution gas used in the experiment was up to 50%, which was higher than that used in other literature [2,3,14,15].

2. Experiment Methods

2.1. Experiment Setup

The experiment setup employed in the present work is shown in Figure 1, including the combustion system and laser diagnostic system. The combustion system is comprised of a water-cooled McKenna burner with a center jet tube, and several mass flow controllers (Alicat) to provide a precise supply of gas. The center jet tube was surrounded by a co-flow comprised of hot flue gas which was generated from a laminar premixed flame of methane/air (φ = 0.9) located about 2 mm below the jet tube exit, and the exit was 4 mm above the surface of the McKenna burner. In the present work for syngas, the inner diameter of the center jet tube was 2.3 mm, which was slightly different from our previous work for methane [16].
The jet flow conditions of syngas/air premixed jet flame used in the present experiment are shown in Table 1. The equivalence ratio was maintained at 0.9. The volumetric ratio of gaseous hydrogen to carbon monoxide varied from 5/95 to 75/25, which represented different types of syngas. Air was emulated with 21v% O2 and 79v% N2, and the proportion of dilution gas varied from 0 to 50v%, in order to determine the effect of high dilution on the premixed turbulent flame. The dilution ratio is equal to the volume of dilute gas divided by the total volume of gas mixture. For each of the operation conditions, velocities of 40 m/s (Re = 6110), 70 m/s (Re = 10,690), and 100 m/s (Re = 15,270) at the jet exit were selected to achieve different Reynolds numbers.
The PLIF system was adopted for OH measurement. A frequency-double Quanta-Ray Nd:YAG laser (PRO-250-10H, Spectra physics, Santa Clara, CA, USA) was used to produce a 10 Hz pulse laser with a single pulse energy of 1500 mJ. The laser pulse width was about 10 nanoseconds. At the same time, the laser can generate pulses of 532, 355, or 266 nanometers using the double frequency crystal, triple frequency crystal or quadruple frequency crystal, respectively, carried by the laser itself. In the present experimental system, the Nd:YAG laser with a 532 nanometer pulse was used to pump a dye laser (ND6000, Continuum, Boston, MA, USA) to generate a 283.049 nm UV laser (with a pulse energy of 15 mJ) with a frequency doubler. This UV laser was transformed into a vertical laser sheet with a length of 32 mm (the thickness of laser sheet was very thin) using a spherical convex lens (f = +300 mm) and a cylindrical concave lens (f = −30 mm), passing vertically through the center of the flame to excite the Q1(8) line of OH with the transition of A 2 Σ Χ 2 Π ( 1 , 0 ) . The corresponding fluorescence was captured by an intensified charge coupled device (ICCD) camera (PI MAX 3, Princeton Instruments, Trenton, NJ, USA) with a 1024 × 1024 pixel array. A UV lens (105 mm focal length, Nikon, Tokyo, Japan) and two combined Schott filters (WG305 and UG11) were used to obtain the fluorescence signal around 308 nm. The spectra of the laser-induced fluorescence was analyzed using a monochromator (SP2358, Acton-type spectrometer, Princeton Instrument).

2.2. Data Process

The area of the flame front surface, the average area of the flame surface, the wrinkled rate of the flame surface, and the rate of the unburned premixed gas consumption per average flame front area, the so-called turbulent flame velocity, were analyzed in the present experiment in the wrinkled and corrugated regions. In Figure 2, the laminar flame velocity in (a) can be expressed as SL = U0 = Q/AL, where AL represents the area of the front of the laminar premixed flame and AT represents the area of the corrugated front of the turbulent premixed flame. U0 is the inlet velocity. The solid lines represent the front surface and the dashed lines represent the average front surface. Q is the outlet flow of unburned gas. Thus, the laminar flame velocity can be understood as the volume consumption rate of unburned premixed gas per unit flame front surface. For turbulent flames with wrinkling, this parameter can also be extracted using the same method. The volume consumption rate of unburned premixed gas or the turbulent flame velocity per unit flame front surface can be expressed as ST = U0 = SL × AT/Aavg = Q/Aavg. Aavg represents the average front area of turbulent flame, which is indicated by a dotted line in (b)(d). For the Bunsen burner flame in (c), SL = U0 × A0/AL, where A0 represents the exit area of the Bunsen burner. Different syngas jet flames can be processed as the Bunsen burner flame, as shown in Figure 2d.
The premixed turbulent jet flames have low turbulent intensity, and they are wrinkled flames and corrugated flames, which were generated with different Reynolds number by a flat flame burner which contains a center jet tube. The single shot of the OH-PLIF image clearly presents the structure of the flame front. These images were used in the present study to calculate the turbulent flame speed of the syngas with varied compositions and turbulent intensities. The corresponding turbulent flame velocities were obtained by processing the OH-PLIF images of different syngas jet flames. The whole data process is shown in Figure 3. The color bar with the value from 0 to 2000 represents the signal intensity of the OH radical: the larger the color number, the stronger the signal intensity. All of the color bars with values in the following figures represent the signal intensity of OH radical. Figure 3a represents a typical OH-PLIF instantaneous image of a jet flame. The unburned area and the burned area can be distinguished according to the intensity of the OH fluorescence signal. During the image processing, the unburned region was assigned to 0 and the burned region was assigned to 1, as shown in Figure 3b. The flame is shown as black for the unburned region, assigned 0, white for the burned region, and assigned 1. In the present experiment, 500 instantaneous images were collected for each operation condition. The unburned area and the burned area were treated with the binary method, and 500 average images (Figure 3c) were obtained, which showed the probability distributions of the unburned and burned regions. The isolines with a value of 0.5 were extracted from Figure 3c to obtain the average flame front of the turbulent flame. The contours of isolines with a value of 0.5 and the corresponding fitting lines are shown in Figure 3d because of the symmetry of the flame. The average front surface area of turbulent flame was obtained by rotating the integral of the fitted line, and then the turbulent flame velocity was calculated by the following formula:
S T = U 0 × A 0 / A T
where ST represents the turbulent flame velocity, U0 represents the jet exit velocity, A0 represents the jet exit area, and AT represents the average front surface area of the turbulent flame.
Figure 4a presents a typical OH-PLIF instantaneous flame image of an operation condition. The instantaneous front surface structure of the flame can be extracted from the OH-PLIF instantaneous flame image (Figure 4a), and the flame front (Figure 4b) can be achieved distinctly with the adaptive threshold method. First, the background signal was subtracted and the effect of the uneven distribution of laser energy was removed from the original image using MATLAB. Second, the spot was assigned to 1 when the intensity of the OH fluorescence signal was more than 0, or the spot was assigned to 0. Therefore, a black and white picture could be obtained and the burned region was white and the unburned region was black. In the present experiment, 500 transient images were collected for each case. Overlaying of the flame front boundaries (Figure 4c) was obtained by superposing 500 fronts, which can be used in statistical analysis with averaging and root mean square (RMS) values to obtain the analysis of the distribution of the fronts and other important information.
Additionally, the wrinkle ratio of flames was also calculated according to those flame front boundaries. The wrinkle ratio is a significant parameter to demonstrate the scale of the turbulent flame front fractality. The bigger the wrinkle ratio, the stronger the turbulent intensity, and the more flame front fractality. The wrinkle ratio of flames is equal to the flame front length divided by the given flame height at the vertical distance, which was determined as 1 mm in the current experiment. The flame front length is the length within a given flame height at a given downstream position. The distance between two neighboring pixels with corner connection was counted as the square root of two times that of the number of pixels with a side connection, as shown in Figure 4b.

3. Results and Discussions

In the present work, the premixed jet flame of a syngas/air mixture with different nitrogen dilutions was investigated. The volumetric ratio of hydrogen to carbon monoxide varied from 5/95, 25/75, and 50/50 to 75/25, which represented different types of syngas. The volumetric proportion of dilution gas varied from 0, 10%, and 30% to 50% to determine the effect of high dilution on the premixed turbulent flame. The turbulent flame velocities under different operating conditions were calculated and analyzed at different Reynolds numbers.
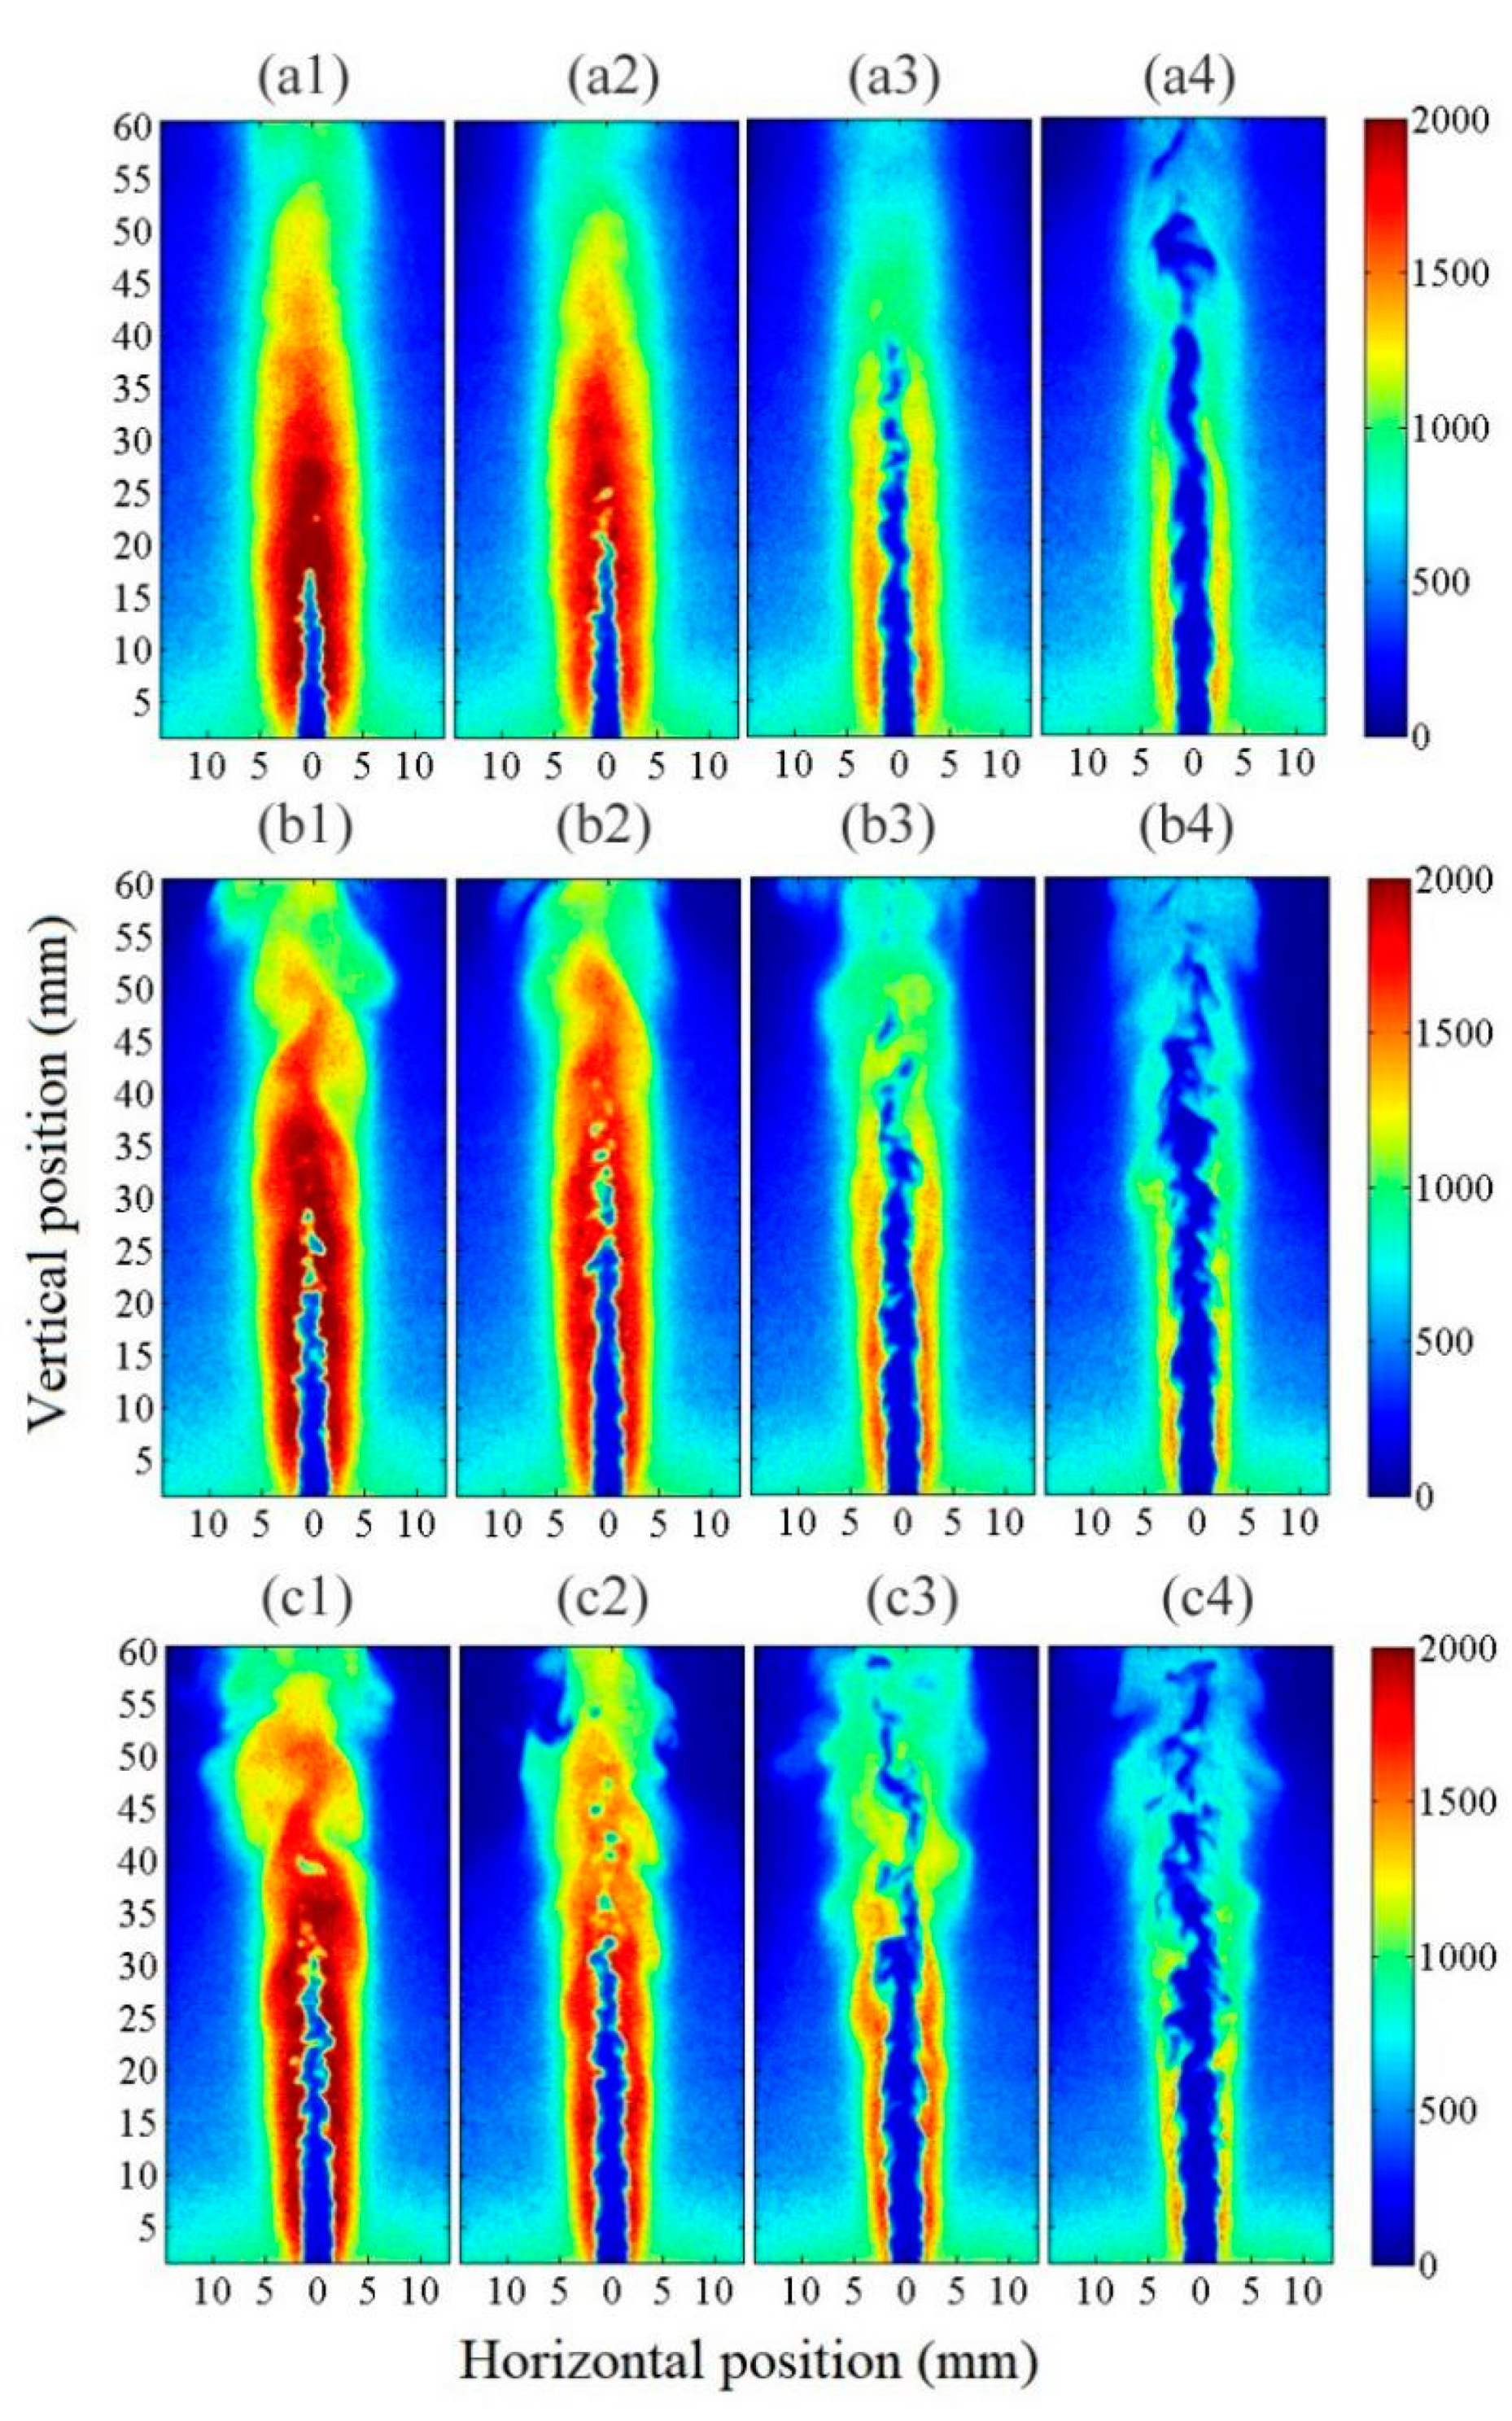
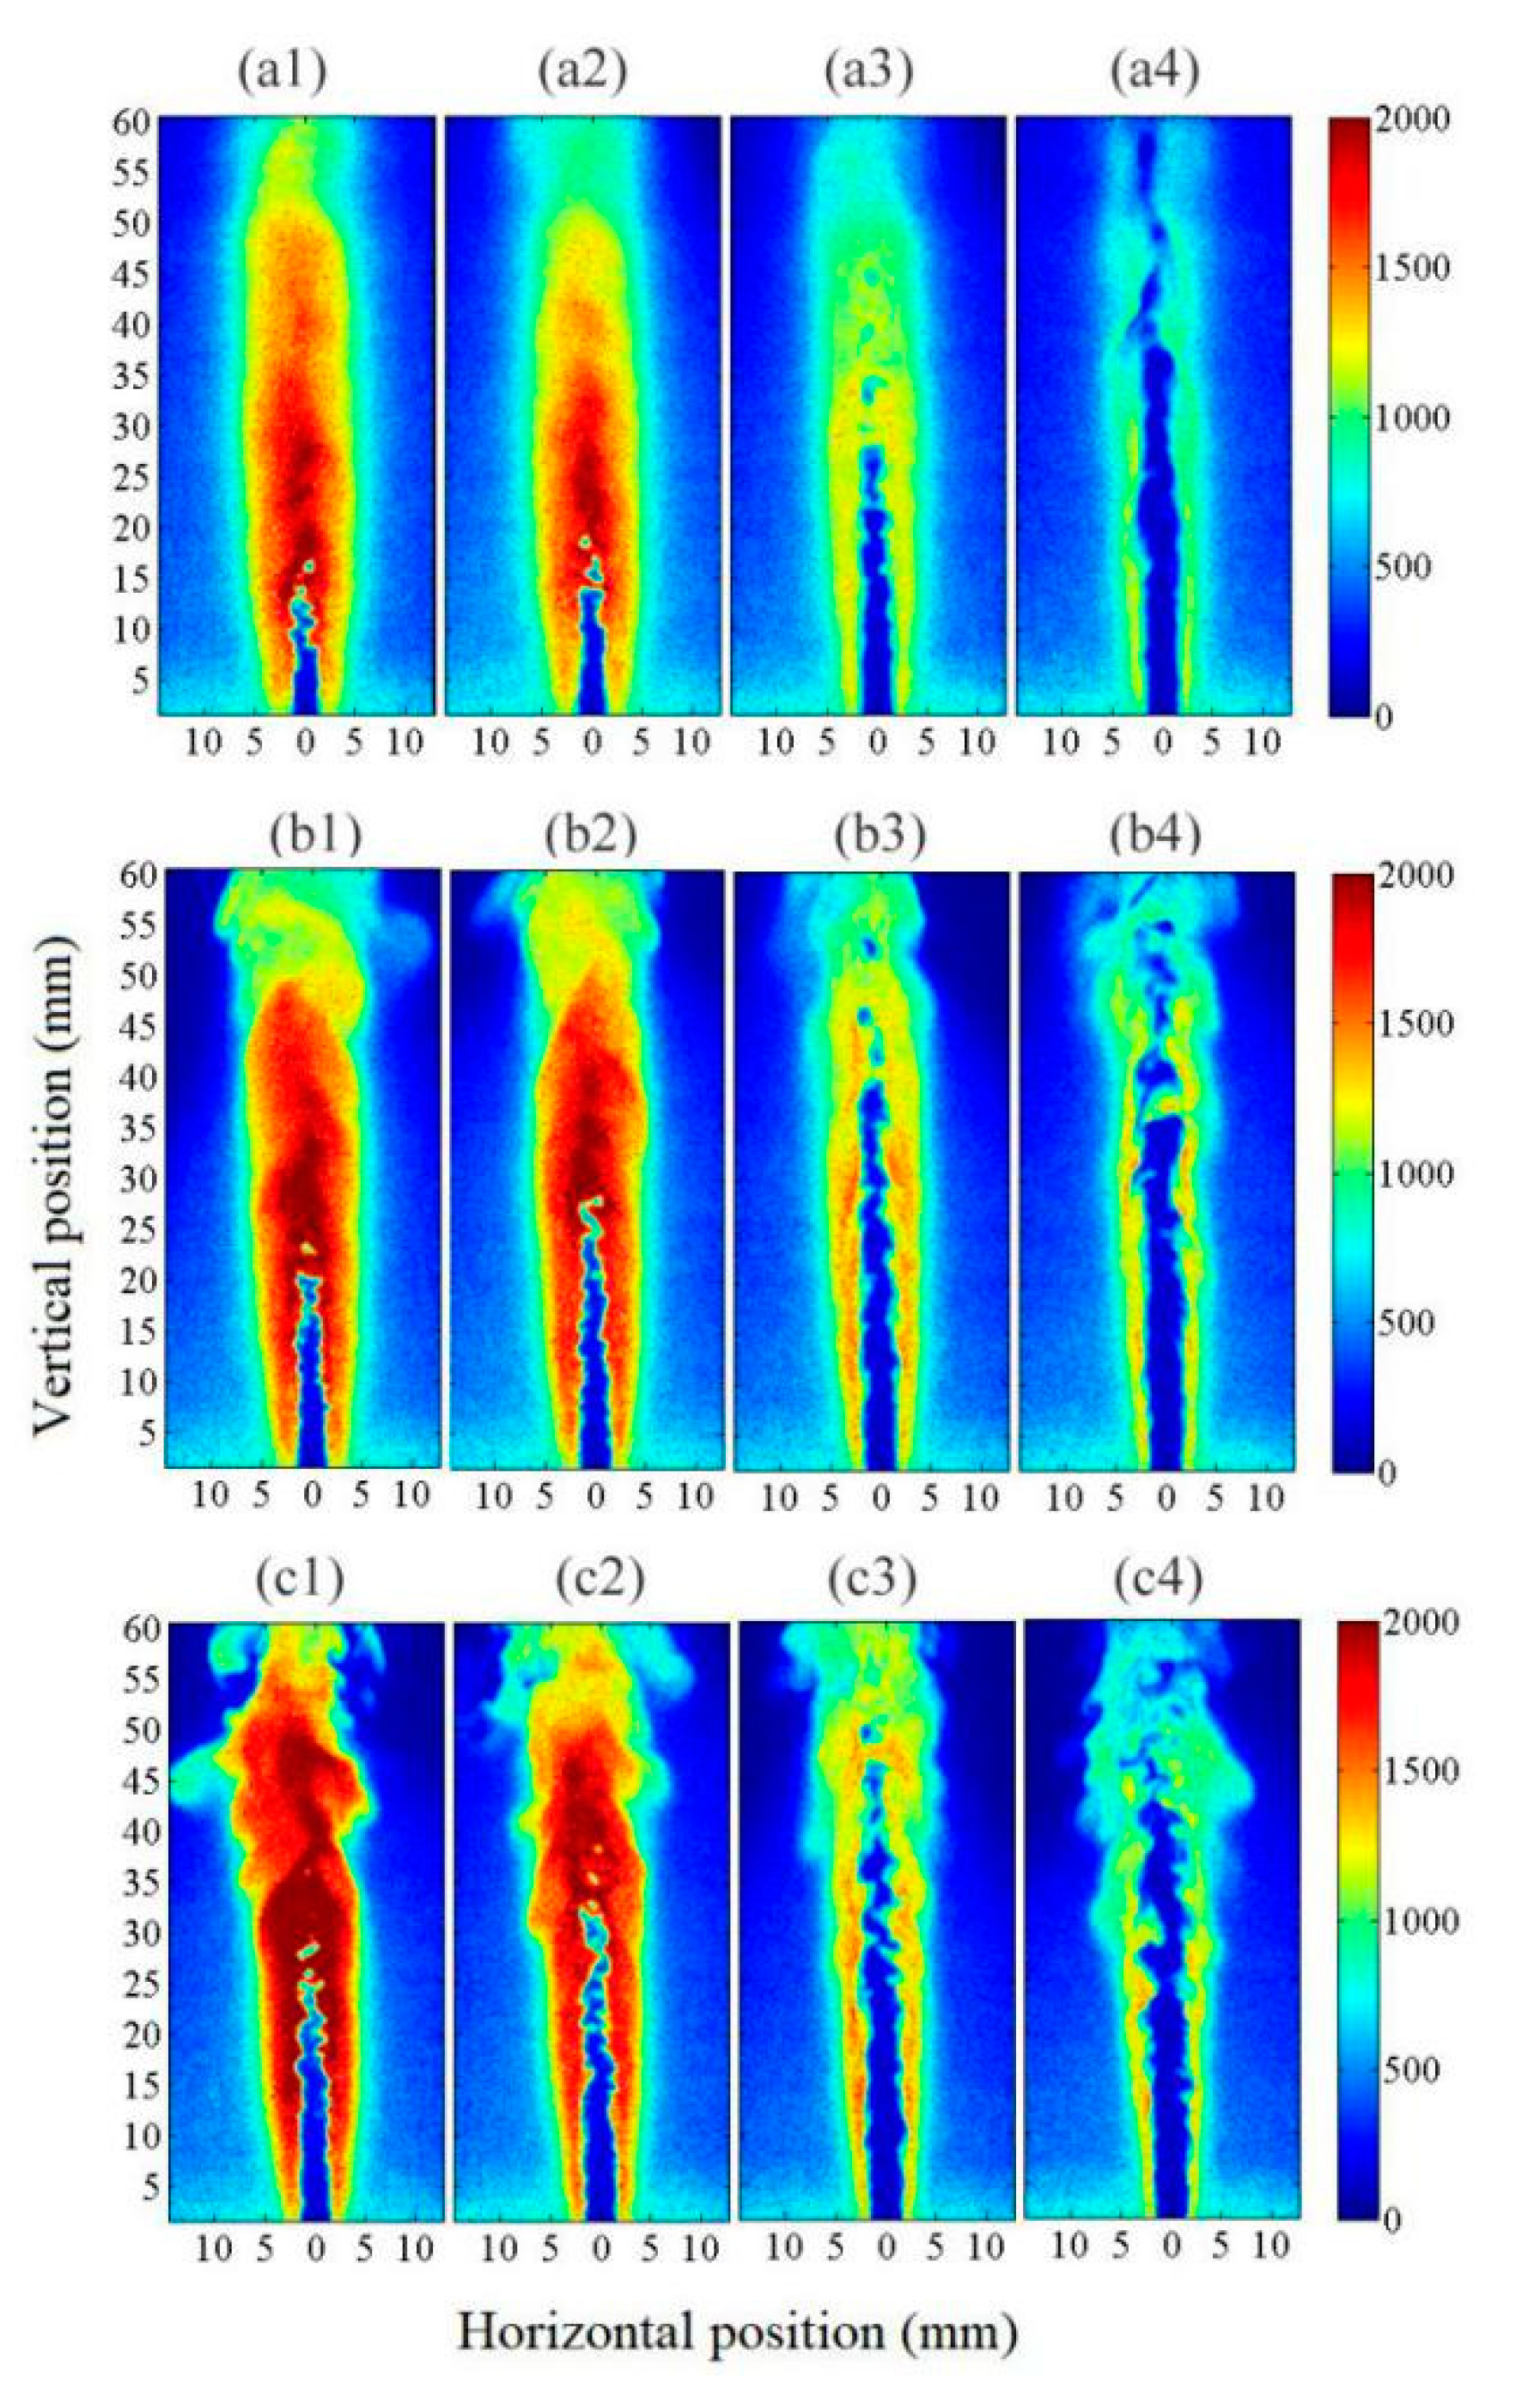
Figure 5, Figure 6, Figure 7 and 
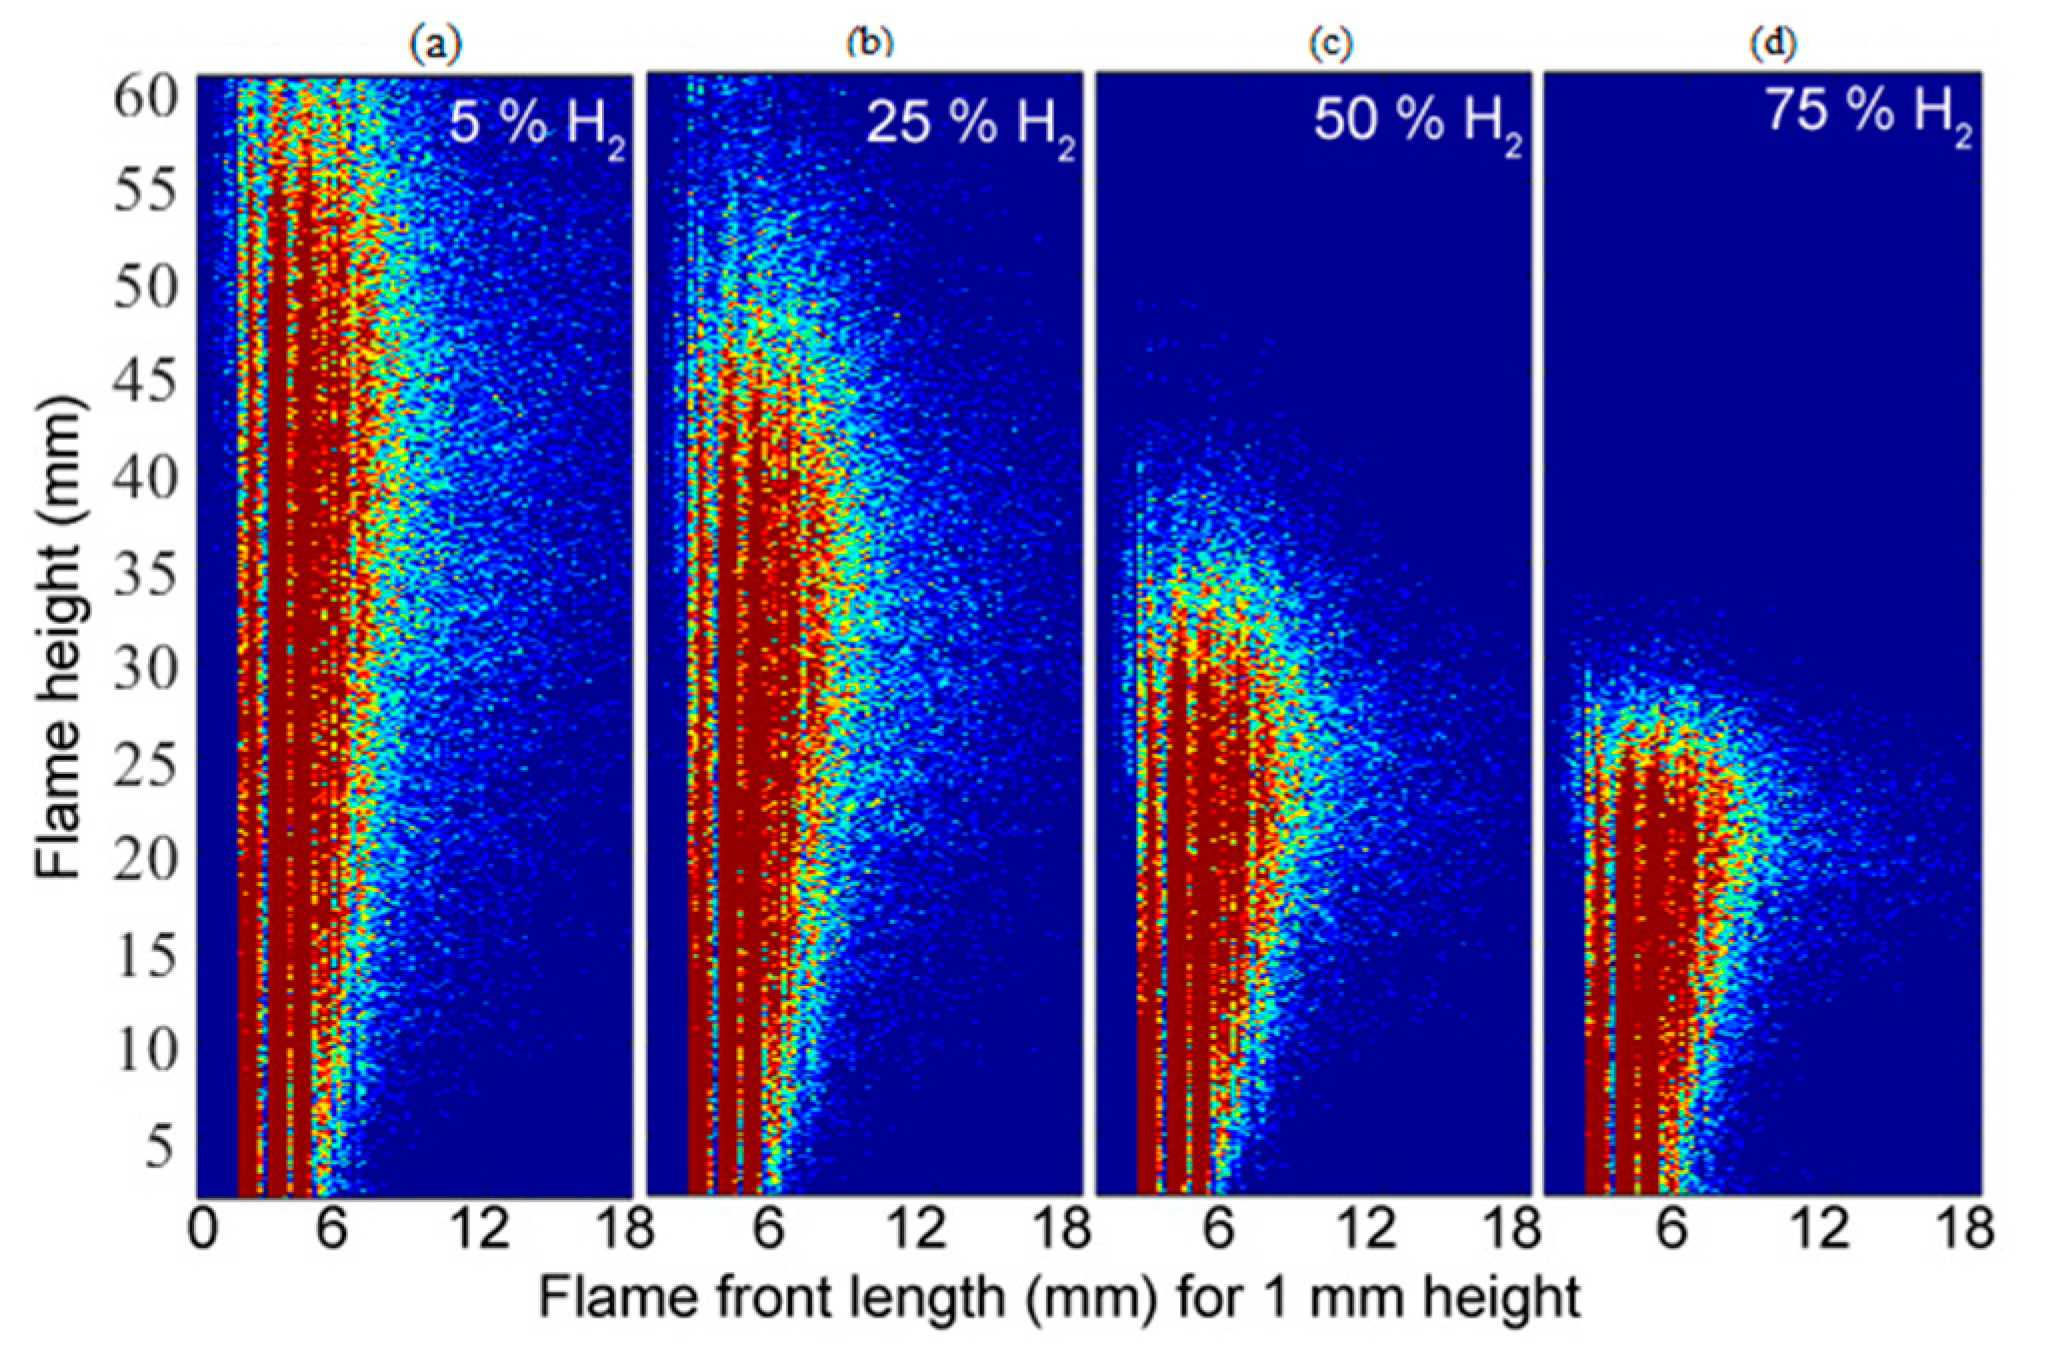
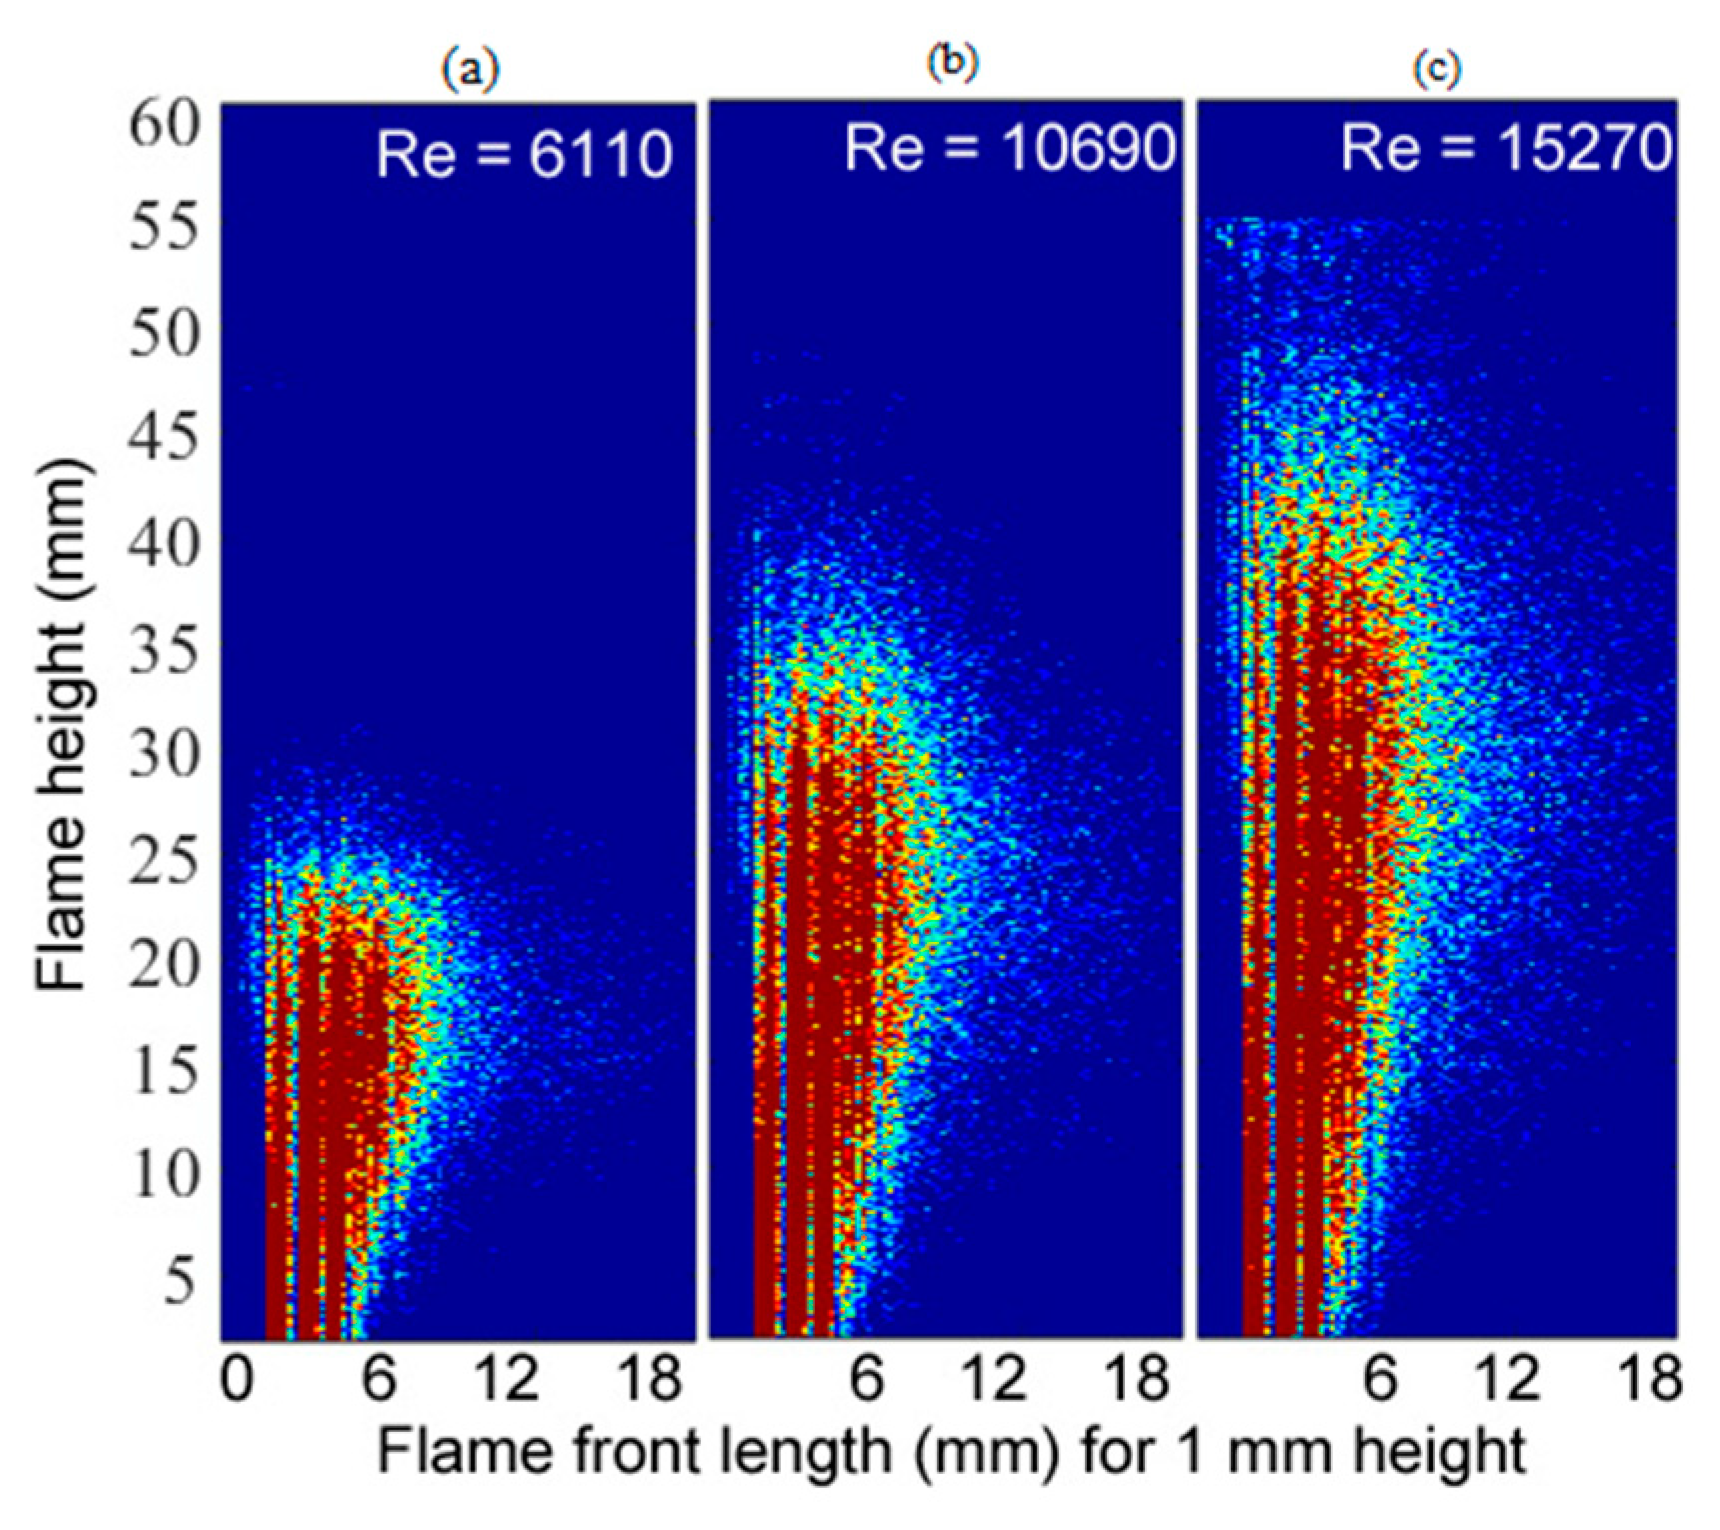
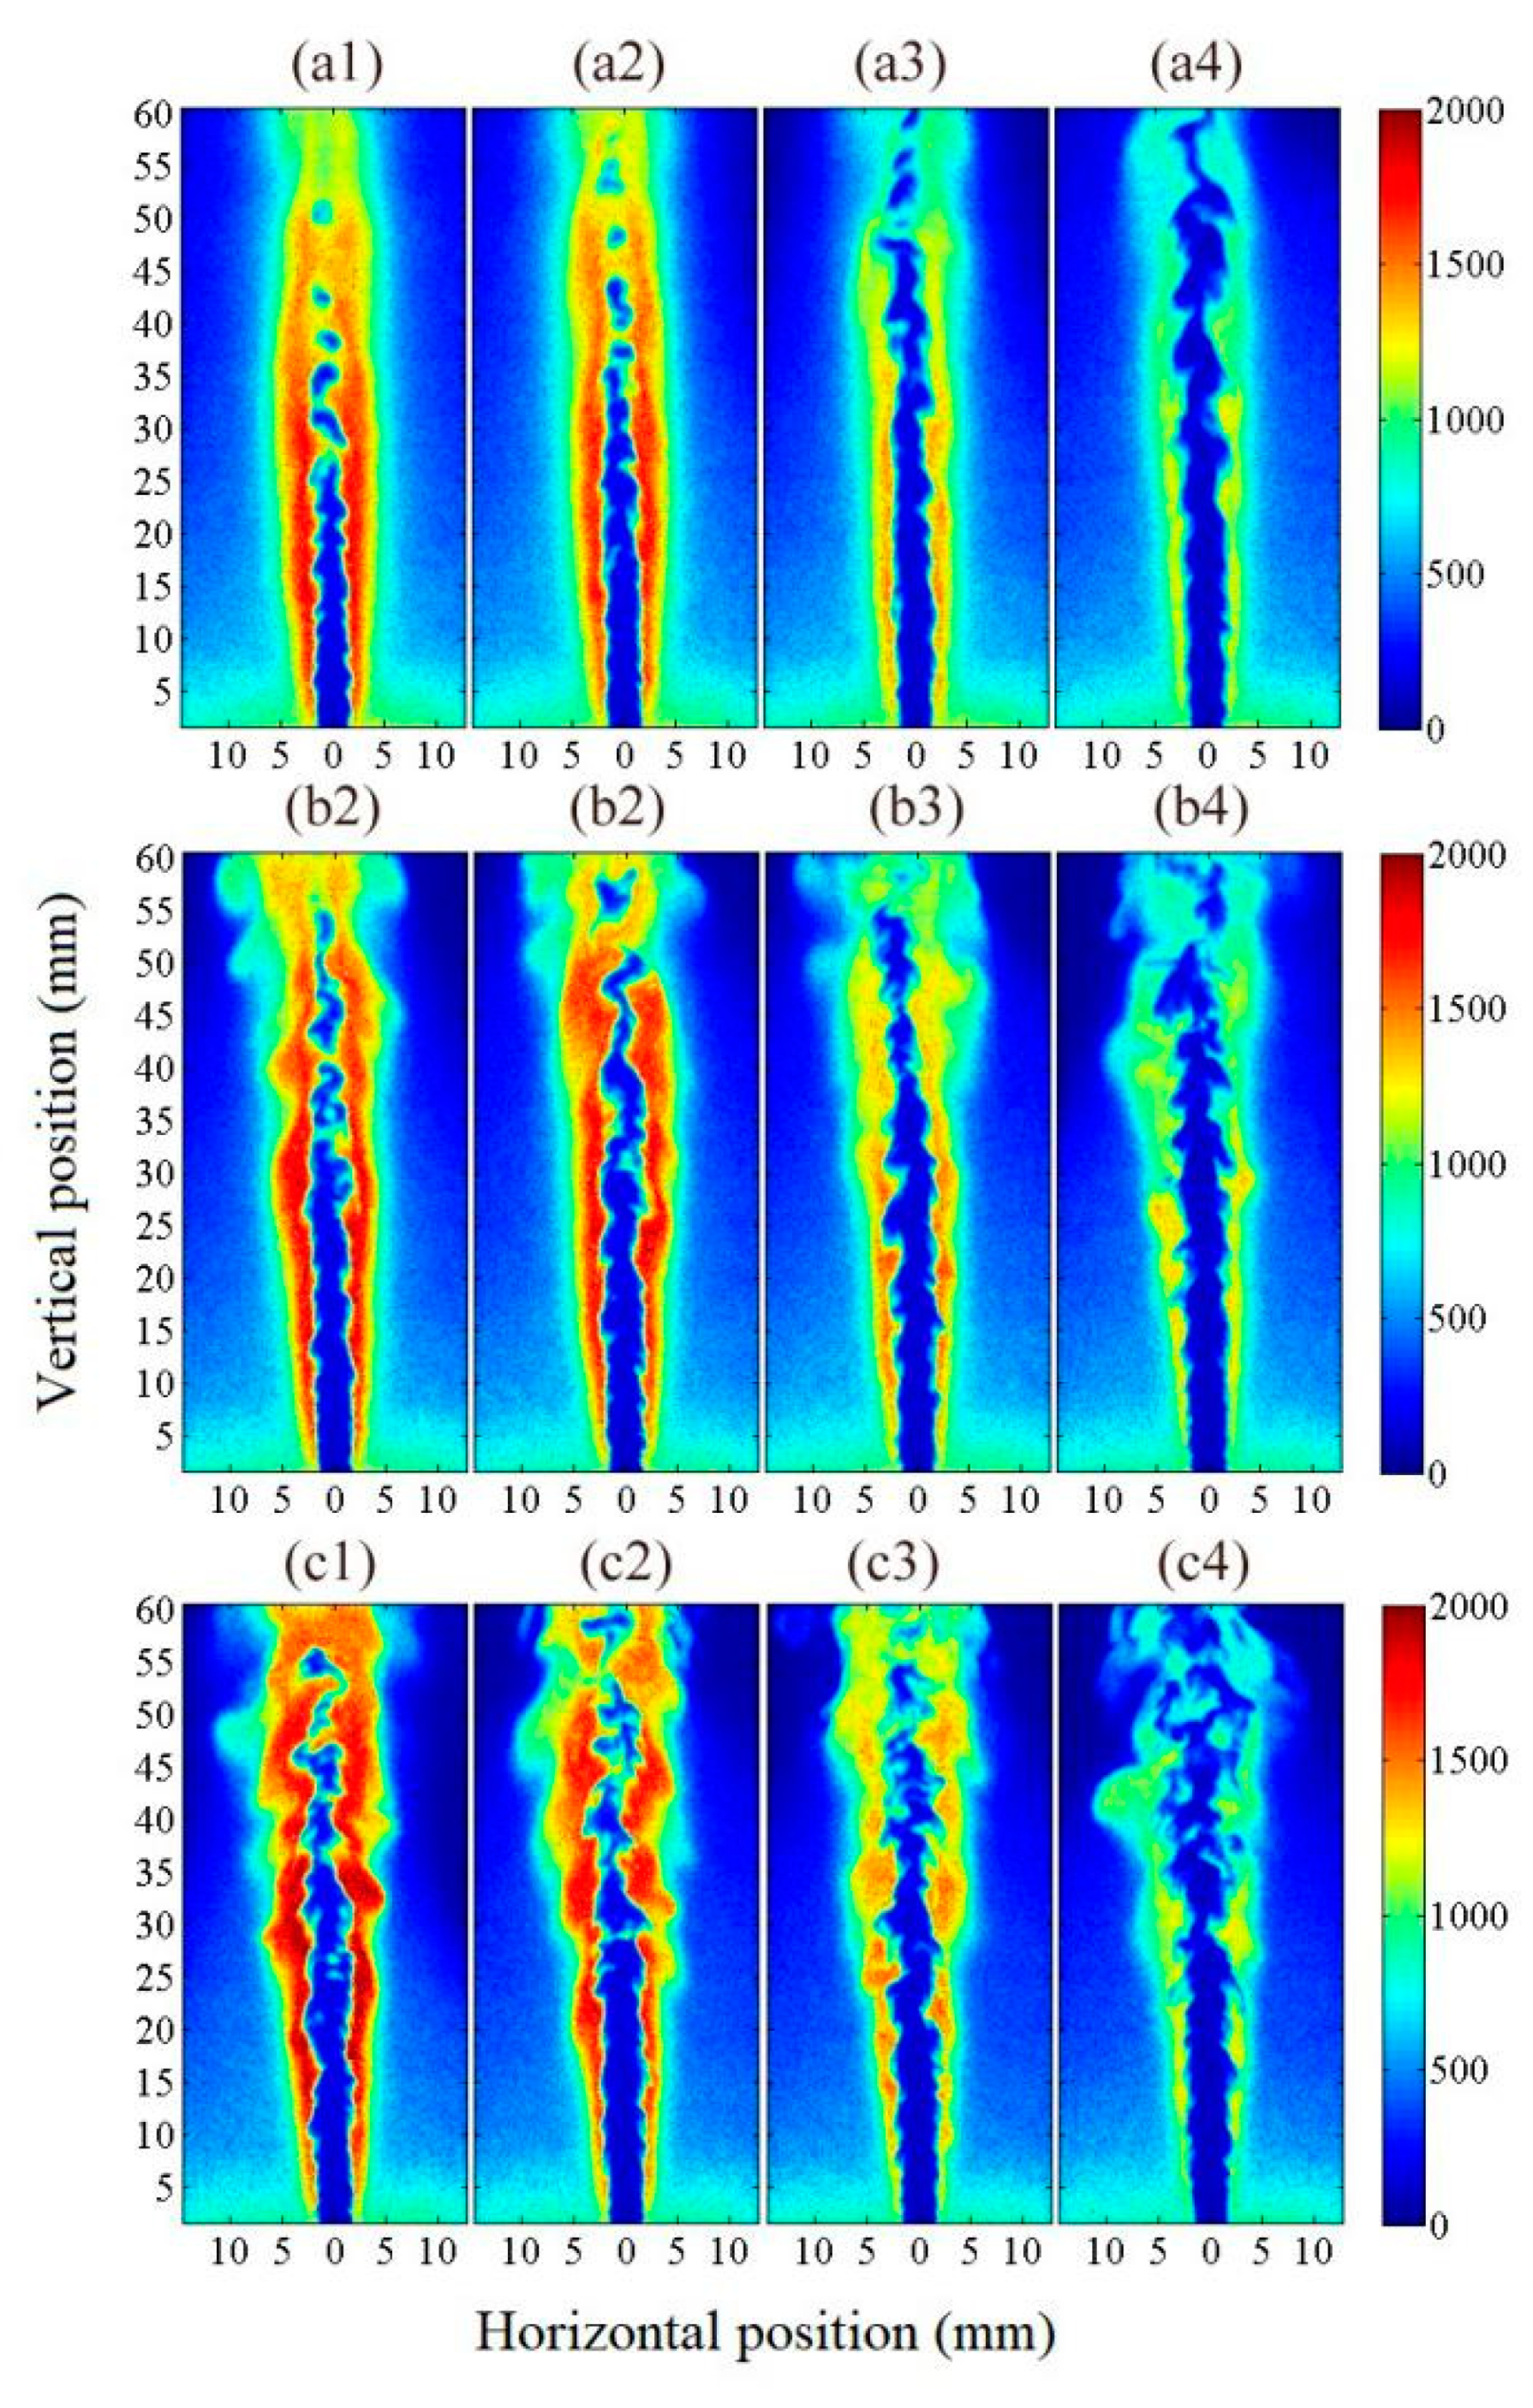
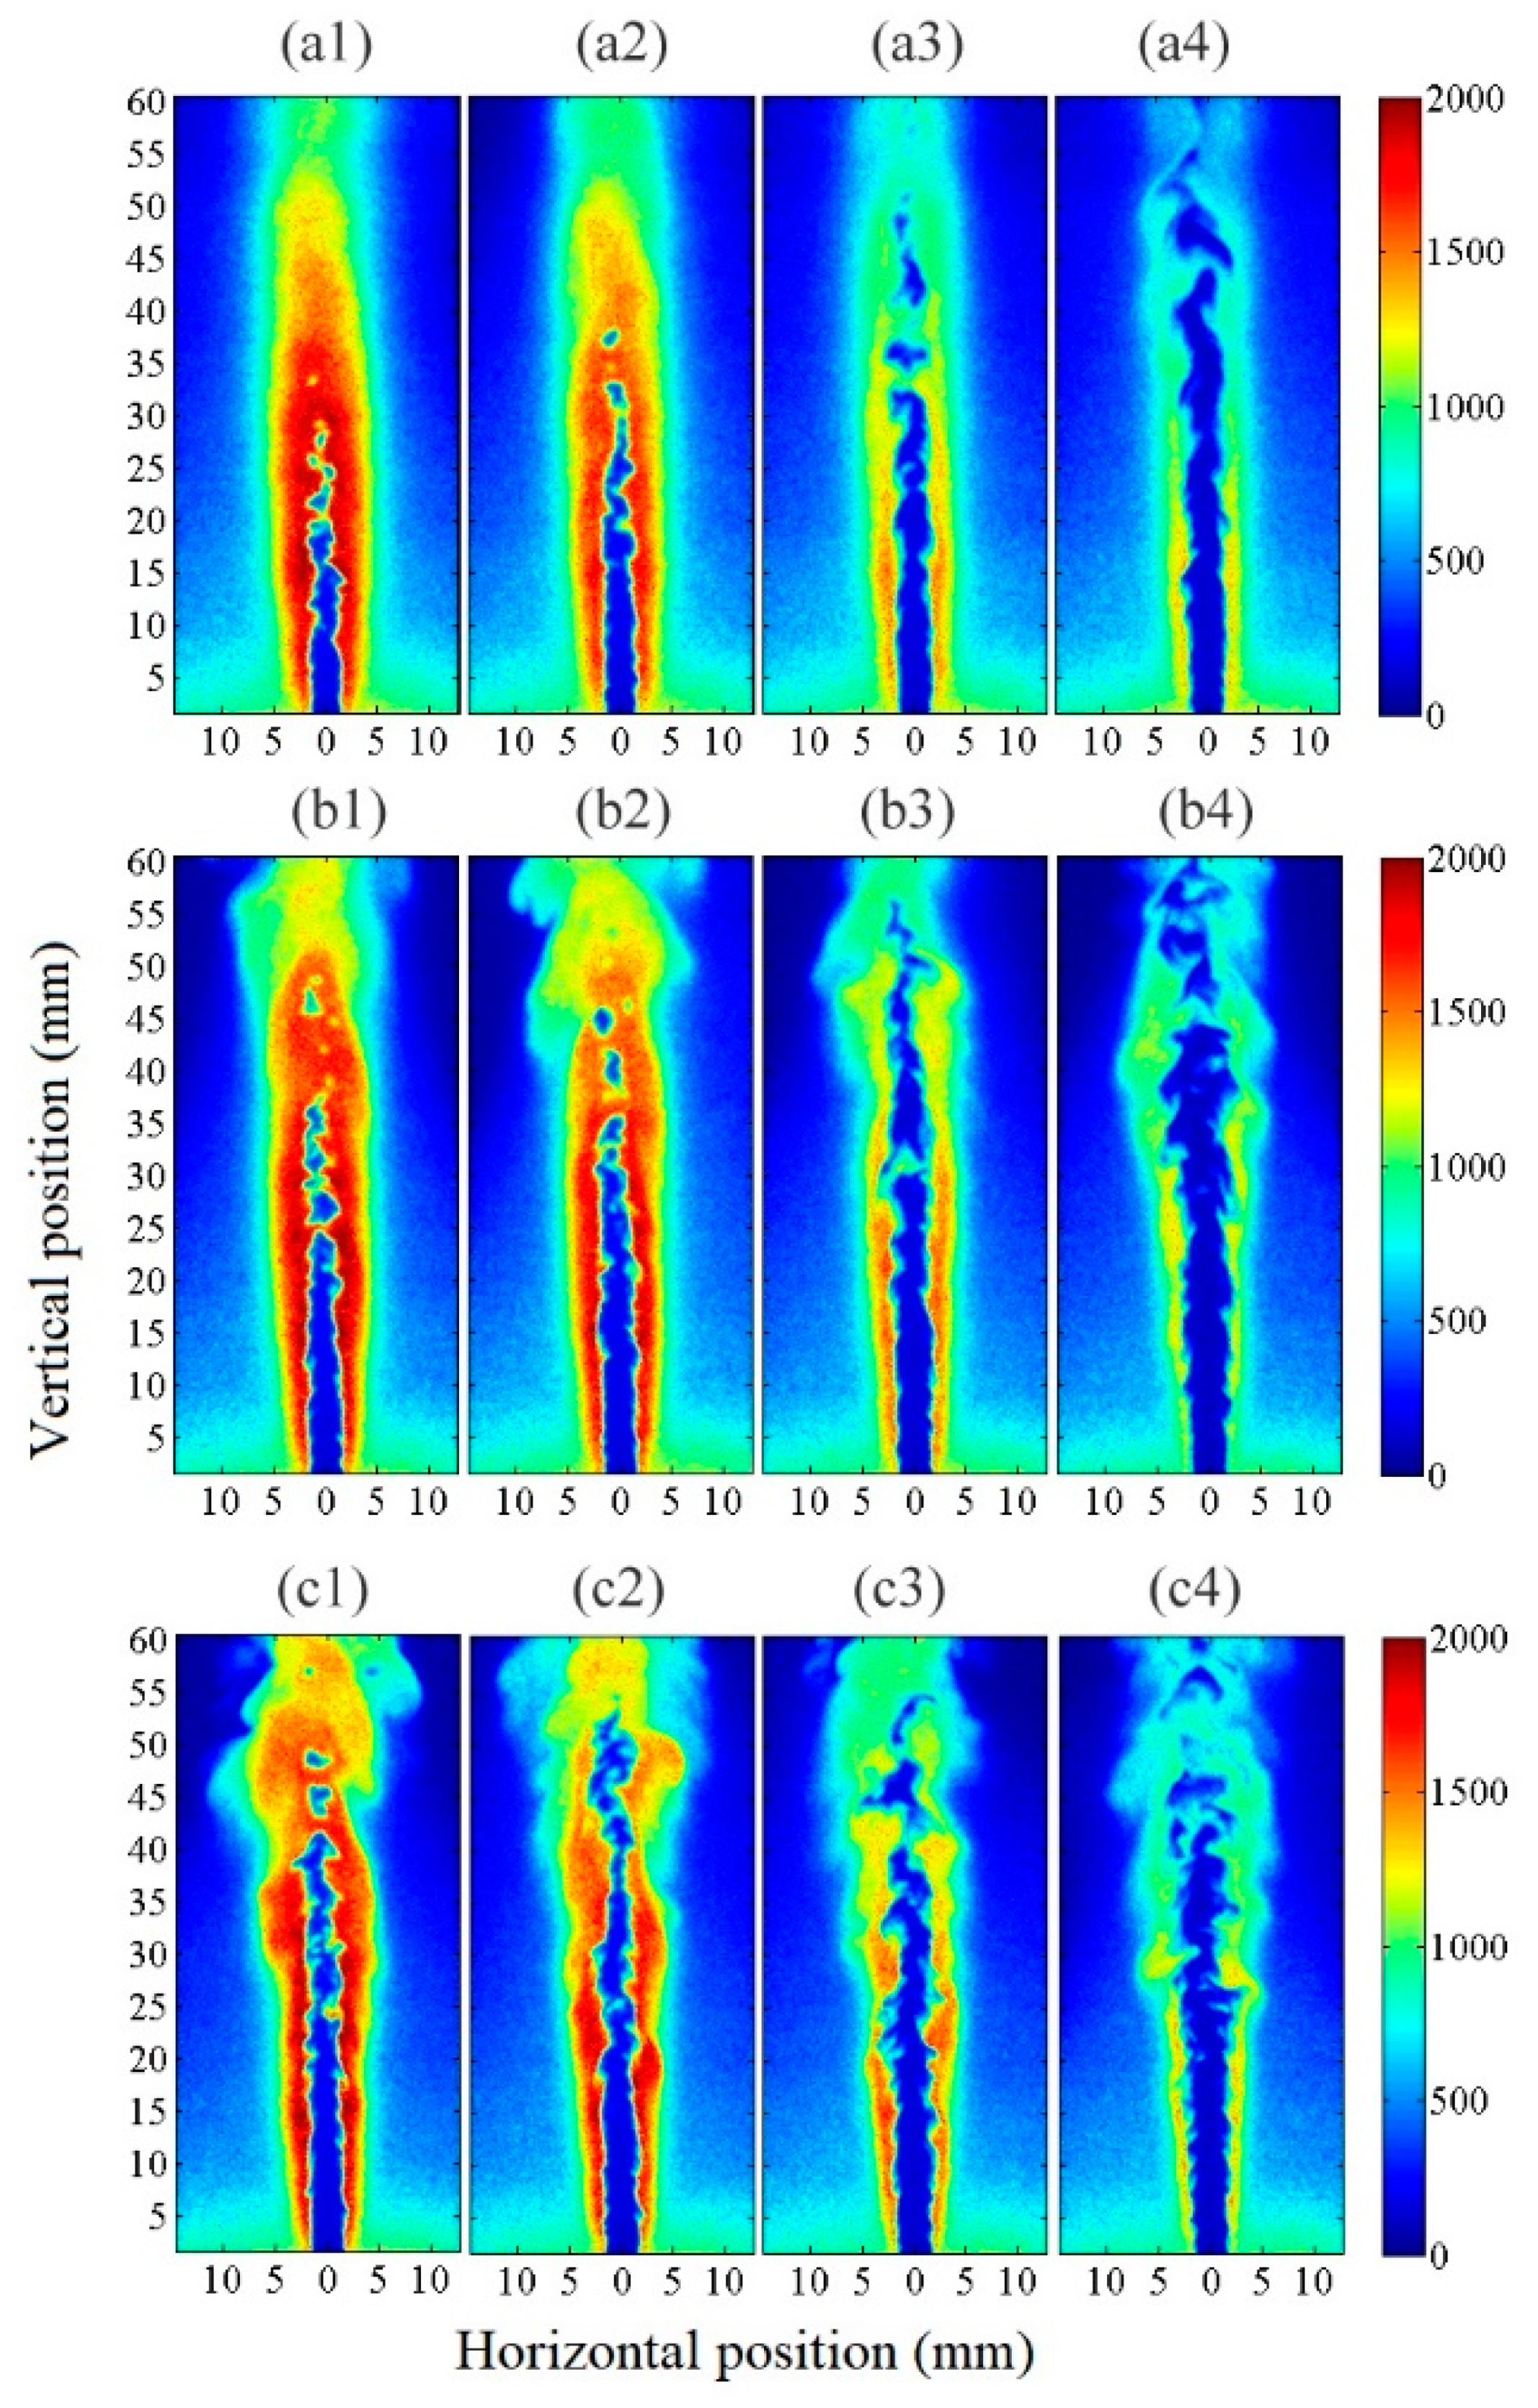
Figure 8 show the instantaneous OH distributions of different volumetric ratios of 5%H2–95%CO, 25%H2–75%CO, 50%H2–50%CO, and 75%H2–25%CO with different dilutions and Reynolds number at different outlets. As can be seen from these figures, the common point was that increasing the nitrogen dilution proportion greatly reduced the concentration of the OH radical, increased the flame height, and increased the vortex size of the flame. In our previous work, we studied the effects of nitrogen and carbon dioxide dilution on the combustion of gaseous fuels, such as methane [16] and syngas [17]. The effect of nitrogen and carbon dioxide dilution on methane combustion was investigated by formaldehyde-PLIF and OH-PLIF. The dilution resulted in the delay of combustion, the expansion of the unburned zone, and the significant decrease in the concentration of formaldehyde and OH. Compared with the super lean combustion, the dilution combustion more obviously weakened the combustion. Moreover, compared with nitrogen dilution, the OH concentration in the combustion zone was reduced more obviously by carbon dioxide dilution, but the formation of formaldehyde in the unburned zone was not affected.
The increase in the hydrogen content in the syngas increased the concentration of OH to a certain extent, and greatly reduced the size of the flame surface. These changes were greatly affected by the variation of laminar flame velocity characteristics of the premixed syngas, which was consistent with the results discussed in the previous work [18]. In addition, changing the Reynolds number of the jet exit had very similar effects for different fuels. Increasing the exit Reynolds number enhanced the concentration distribution of OH signal, increasing the flame height and the vortex structure of the flame front.
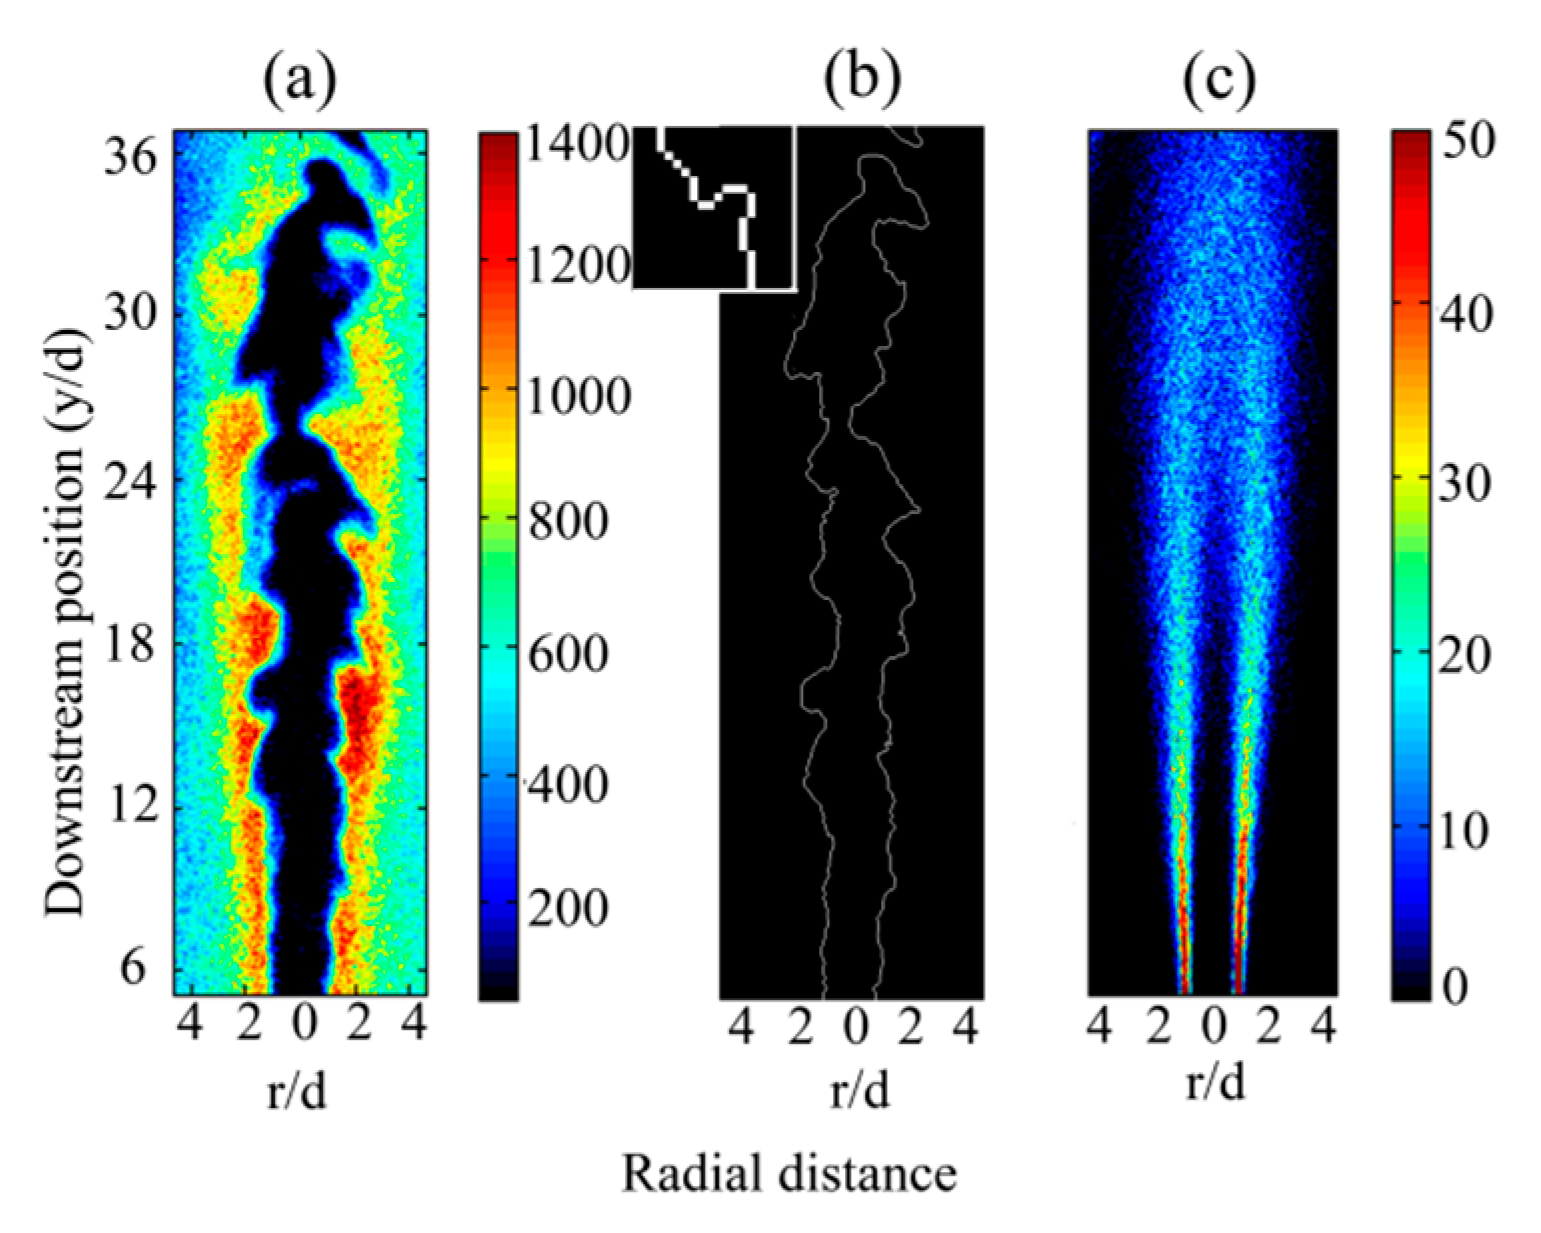
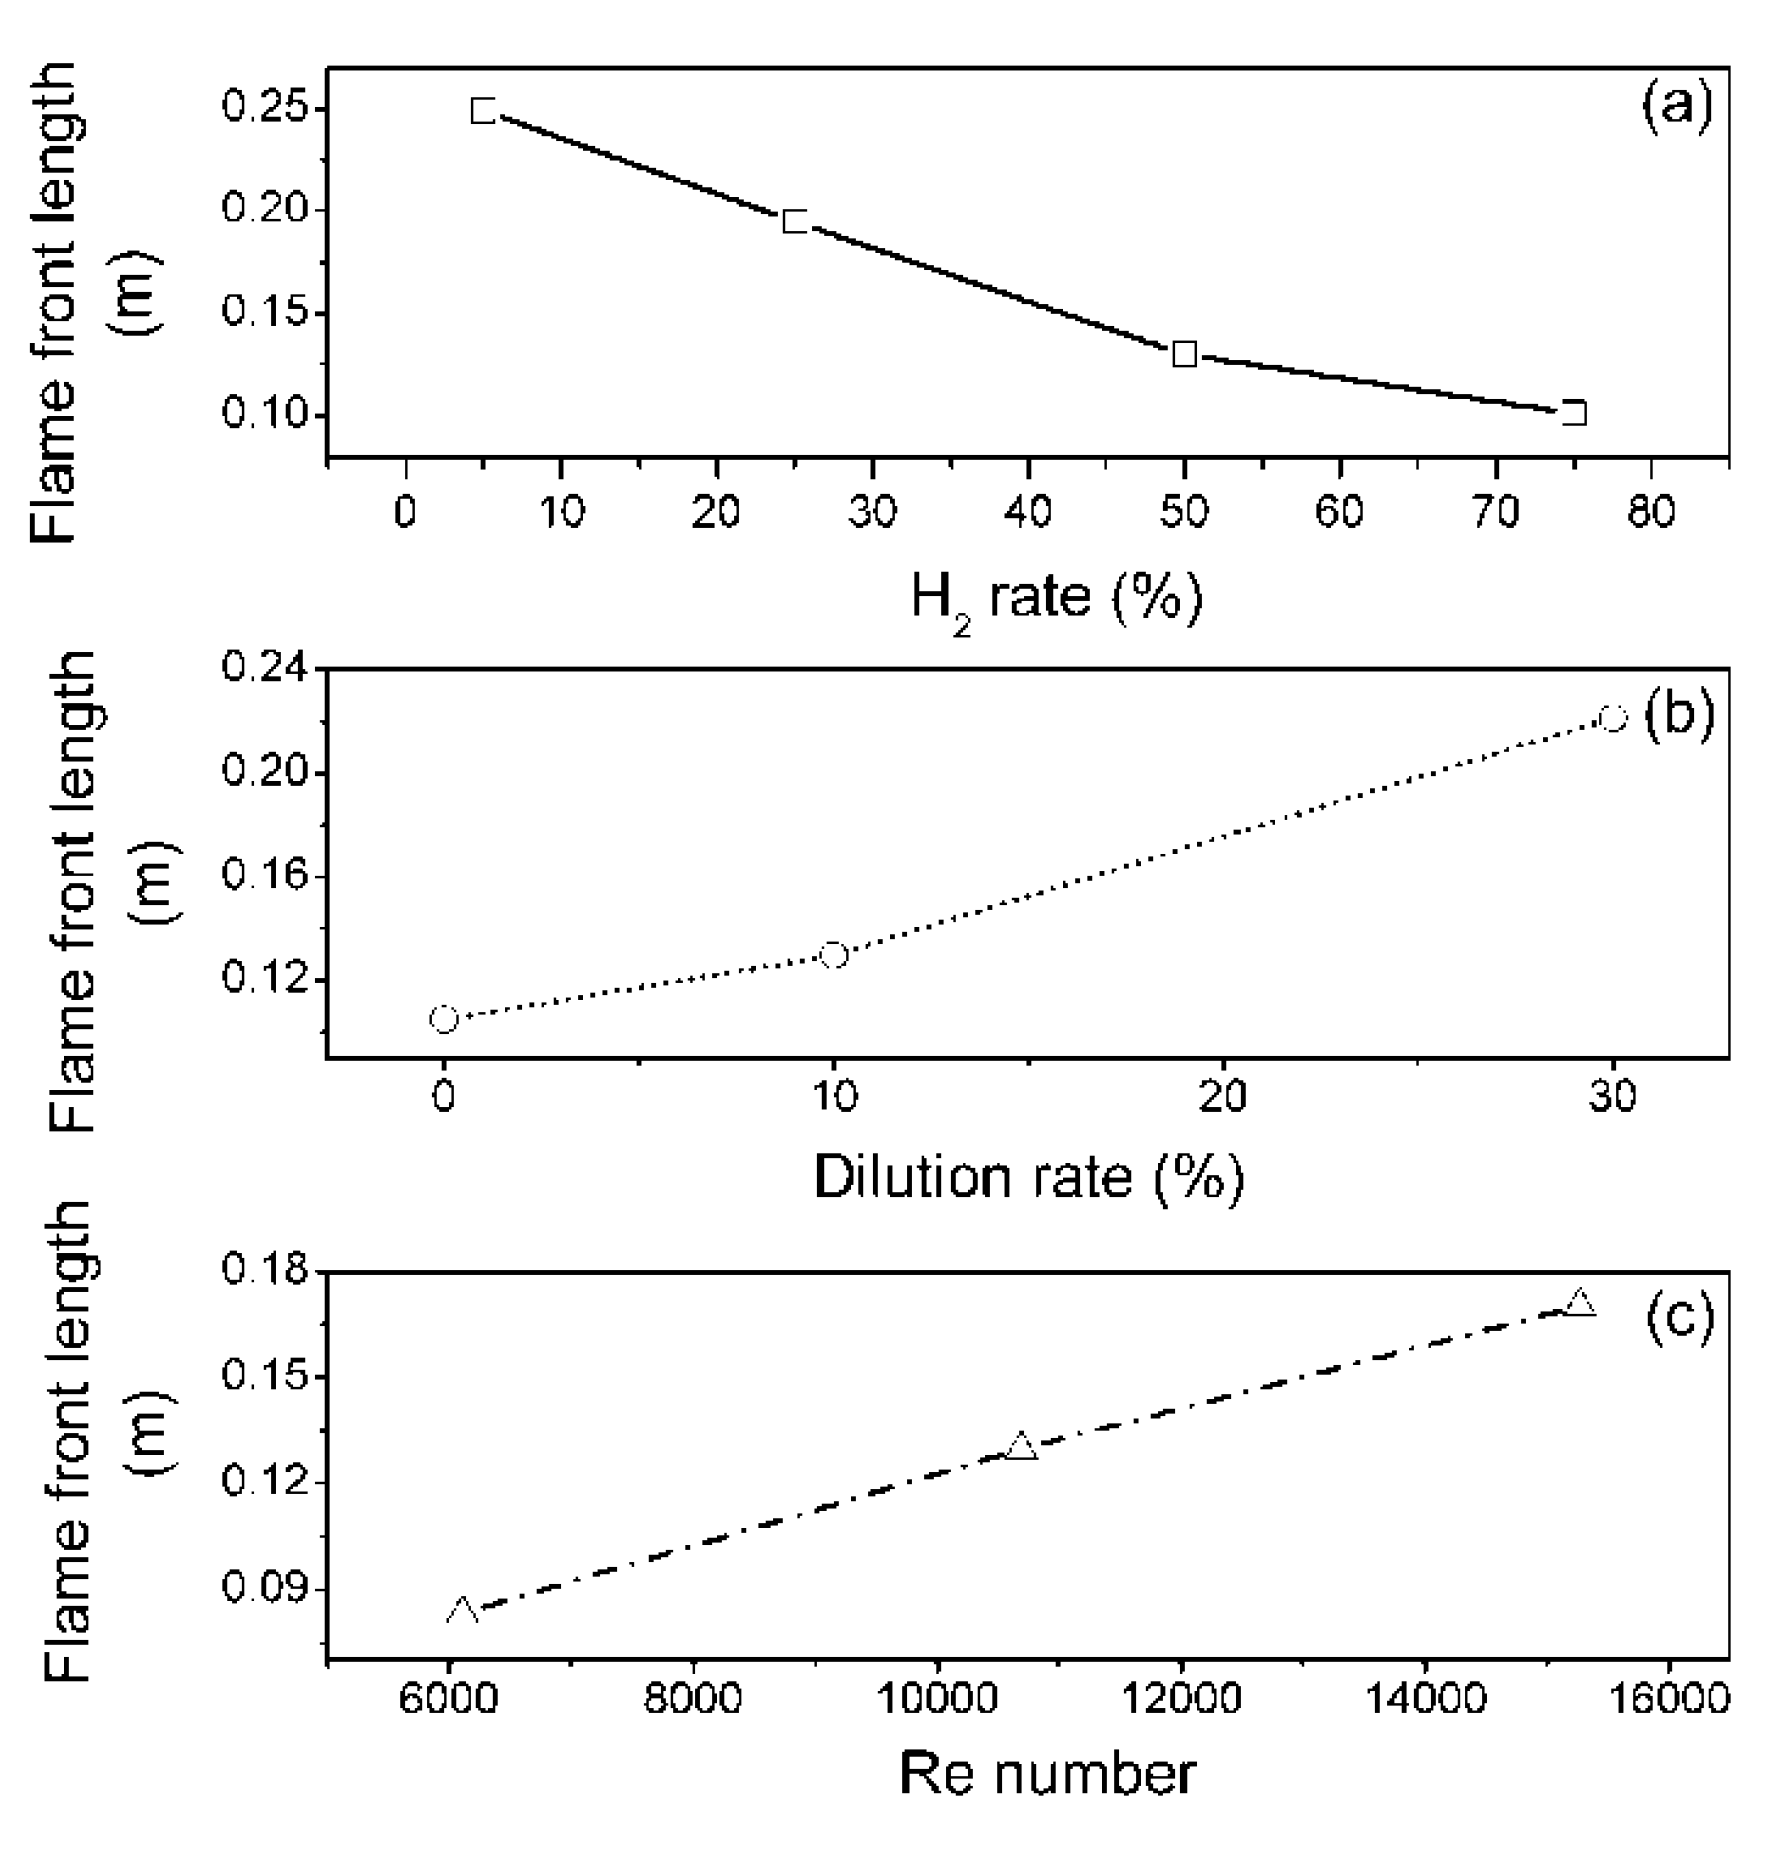
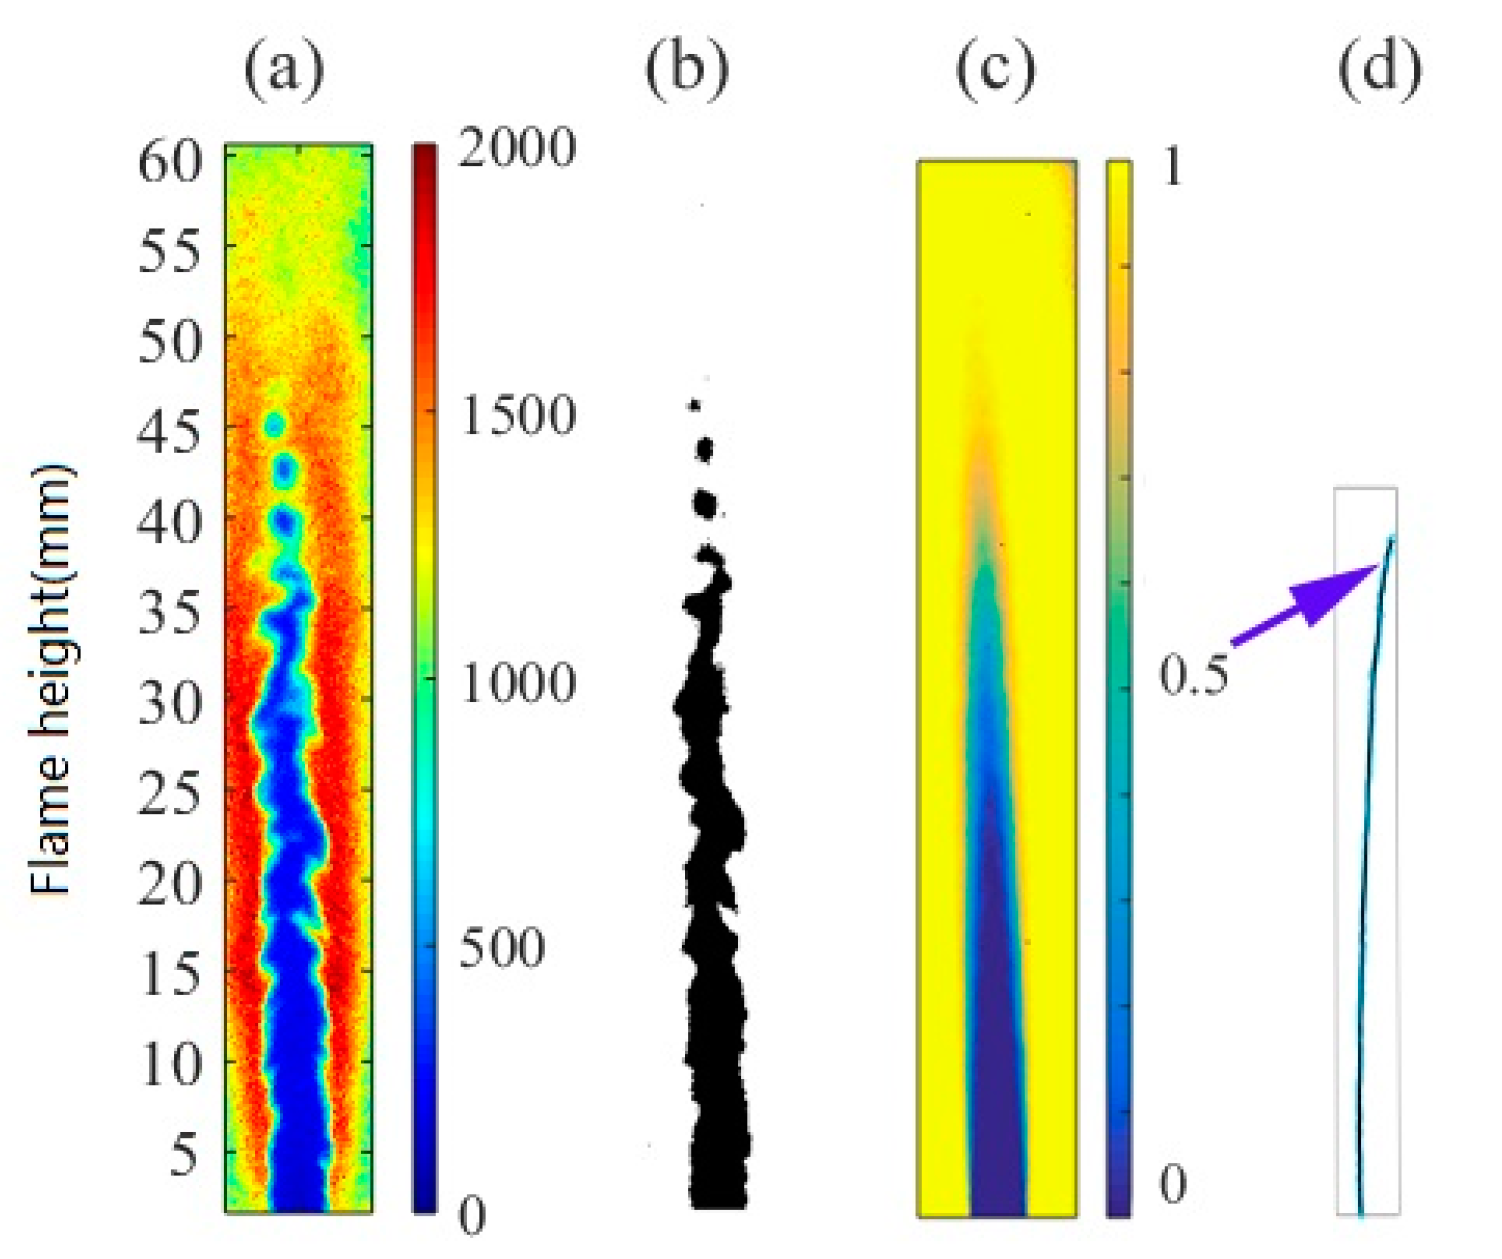
Figure 9 shows the length of the wrinkled flame front under different flame conditions. The results show that the total length of the flame front increased as the hydrogen proportion in the fuel decreased and the nitrogen dilution increased. This was mainly affected by the laminar flame velocity of the fuel. A smaller laminar flame velocity resulted in a larger flame front to sustain constant combustion under the condition of the same exit velocity. In addition, the total length of the flame front increased with the increase in turbulence intensity.
In order to obtain the effect of turbulence on combustion, the average flame front length and the total length of the wrinkled flame front are normalized in Figure 10 to obtain the wrinkled rate of the flame front surface. It can be seen that the trend of the wrinkled rate was consistent with that of the total length of the wrinkled flame front in Figure 9. Firstly, the wrinkled rate of flame front increased as the exit Reynolds number increased. Secondly, more abundant flame wrinkles were present in the turbulent combustion for the fuel with a lower laminar flame velocity. The increase in the wrinkle rate was mainly due to the increase in the higher wrinkle rate area caused by the expansion of the flame volume.
In order to understand the variation in the flame wrinkled rate at different flame positions under different flame conditions, Figure 11 and Figure 12 show the wrinkled rates at different flame heights with different hydrogen contents and Reynolds numbers at different outlets. Under different working conditions, the maximum wrinkled rate does not change much. The increase in the wrinkled rate in Figure 10 is mainly due to the increase in the area with the high wrinkled rate caused by the change in the flame volume.
In the present work, the maximum exit velocity of turbulent jet flow was 100 m/s. It should be noted that the exit velocity of the turbulent jet flow was different from the turbulent flame velocity/speed. The exit velocity of the turbulent jet flow indicates the flow velocity of unburned premixed fuel gases and is closely related to the Reynolds number (jet flow exit velocity of 100 m/s corresponds to Reynolds number of 15,270, as shown in Table 1), whereas the turbulent flame velocity denotes the turbulent flame propagation speed. Based on the previous studies [19], the turbulence intensity was estimated to be about 1% of the exit velocity of the jet flow. Therefore, the turbulence intensity at the front of the present experimental flame was about 100 cm/s. The laminar flame velocity of the syngas used in the present experiment was about 100 cm/s. Thus, it was estimated that the turbulent premixed jet flame in the present experiment basically lies in the wrinkled and corrugated flamelets. In these wrinkled and corrugated regions, the area of the flame front surface, the average area of the flame surface, the wrinkled rate of the flame surface, and the rate of unburned premixed gas consumption per average flame front area—the so-called turbulent flame velocity—were analyzed.
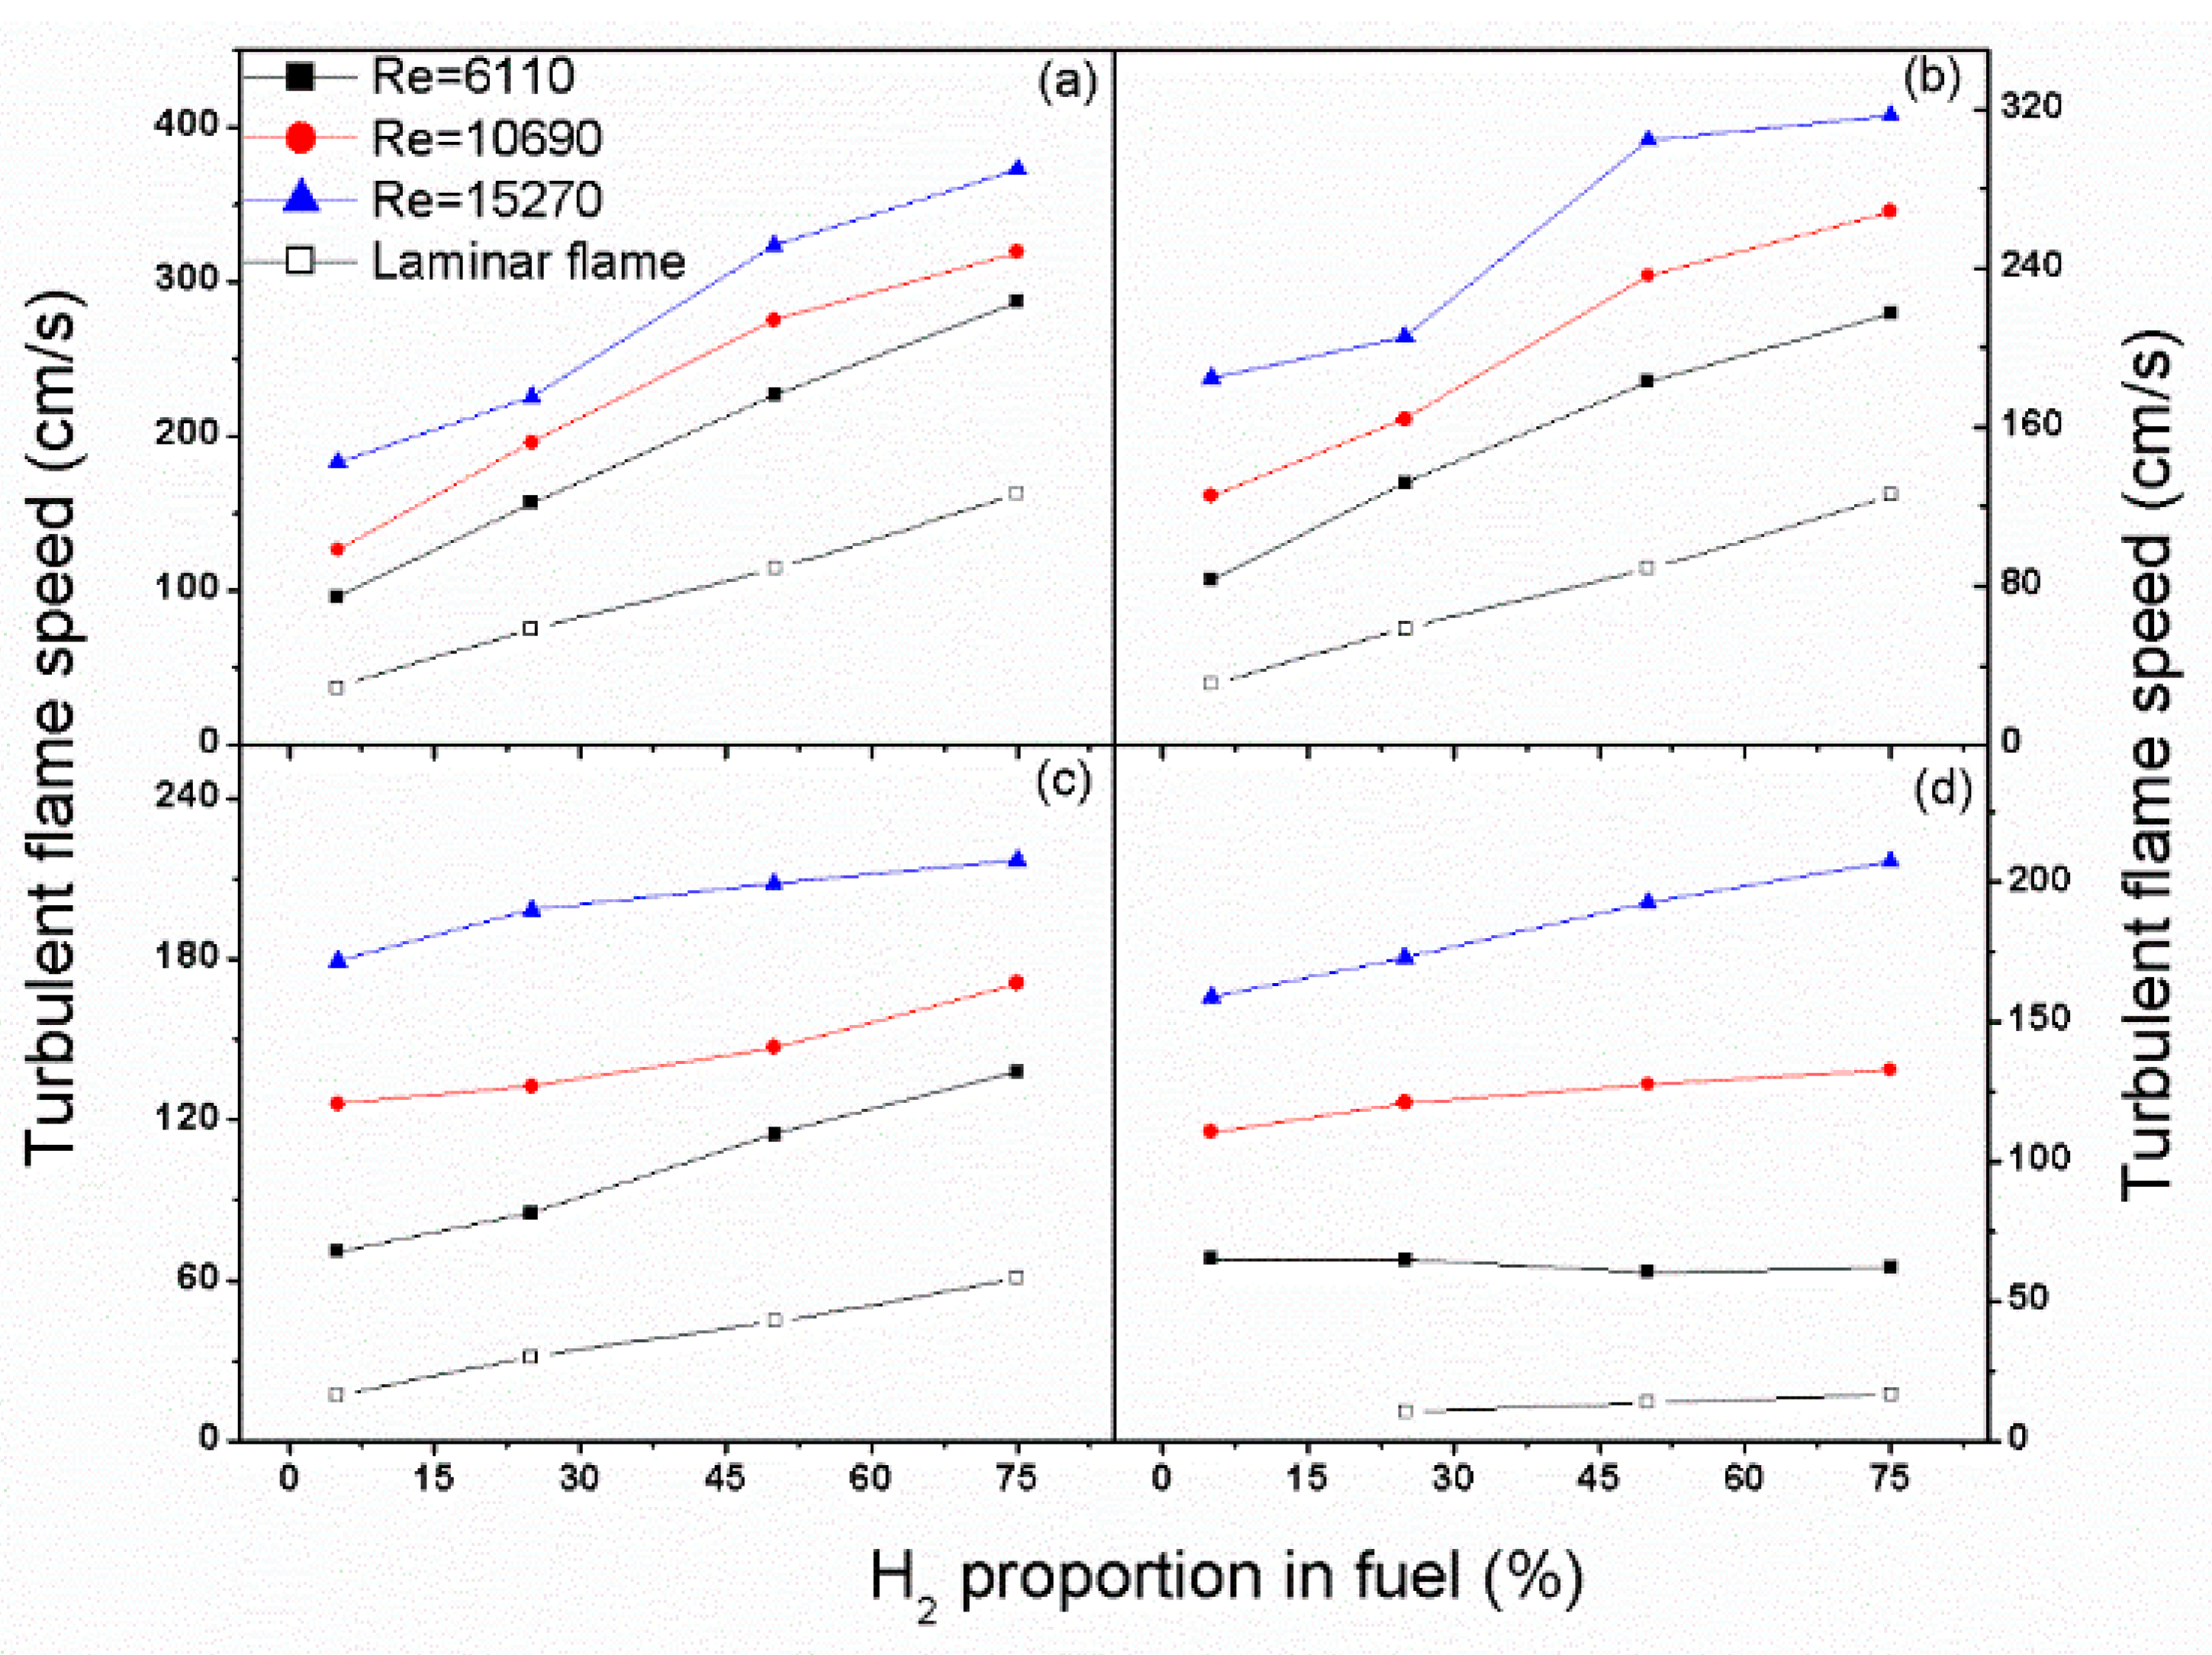
Figure 13 shows the tendency of the turbulent flame velocity to vary with the proportion of hydrogen in syngas. Compared with the laminar flame velocity obtained by CHEMKIN simulation, the turbulent and laminar flame velocities had a very similar changing trend. It can be seen that the turbulent flame velocity was basically controlled by the laminar flame velocity under invariable turbulent intensity.
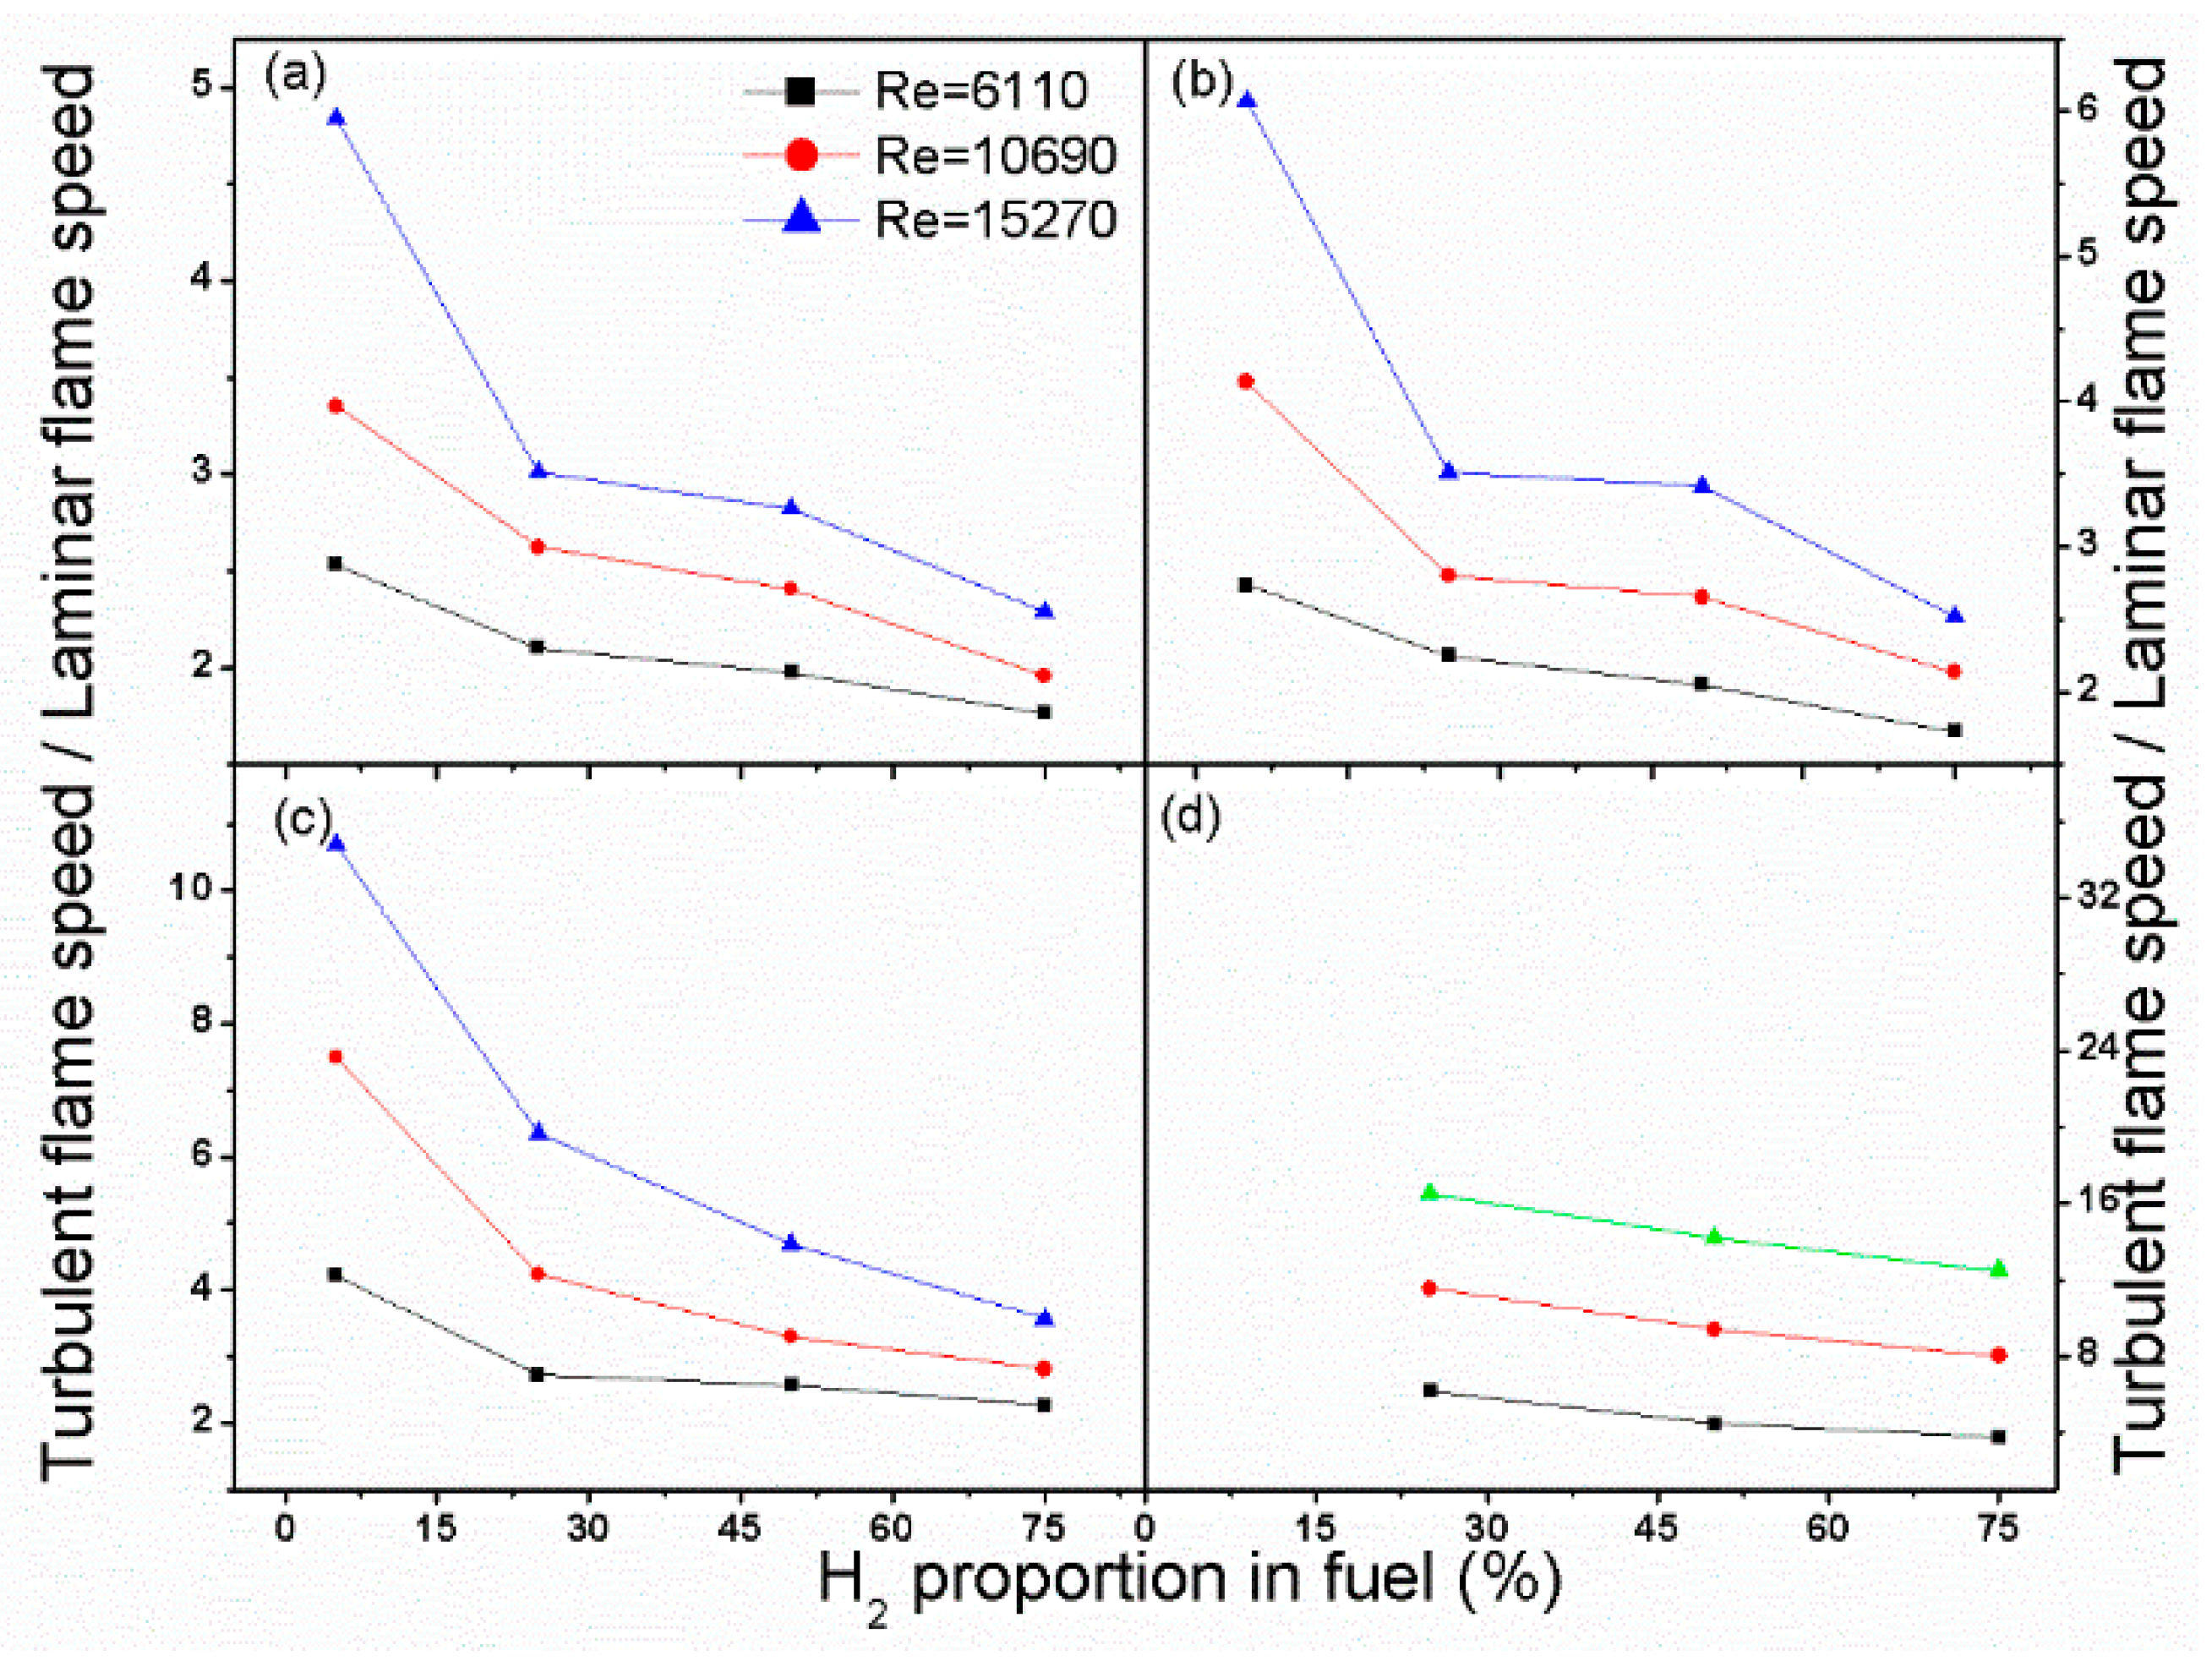
In order to study the effect of the exit velocity on turbulent flame velocity, the ratio of the turbulent flame velocity to the laminar flame velocity of syngas with the same composition was obtained, as shown in Figure 14.
As can be seen from Figure 14, the ratio of turbulent flame velocity to laminar flame velocity decreased significantly with the increase in hydrogen content in syngas under invariable turbulent intensity. For different operation conditions of syngas, the increase in turbulent flame velocity was consistent with the increase in exit Reynolds number, as shown in Figure 13. Therefore, the increase in laminar flame velocity directly resulted in the decrease in the ratio of turbulent flame velocity to laminar flame velocity.
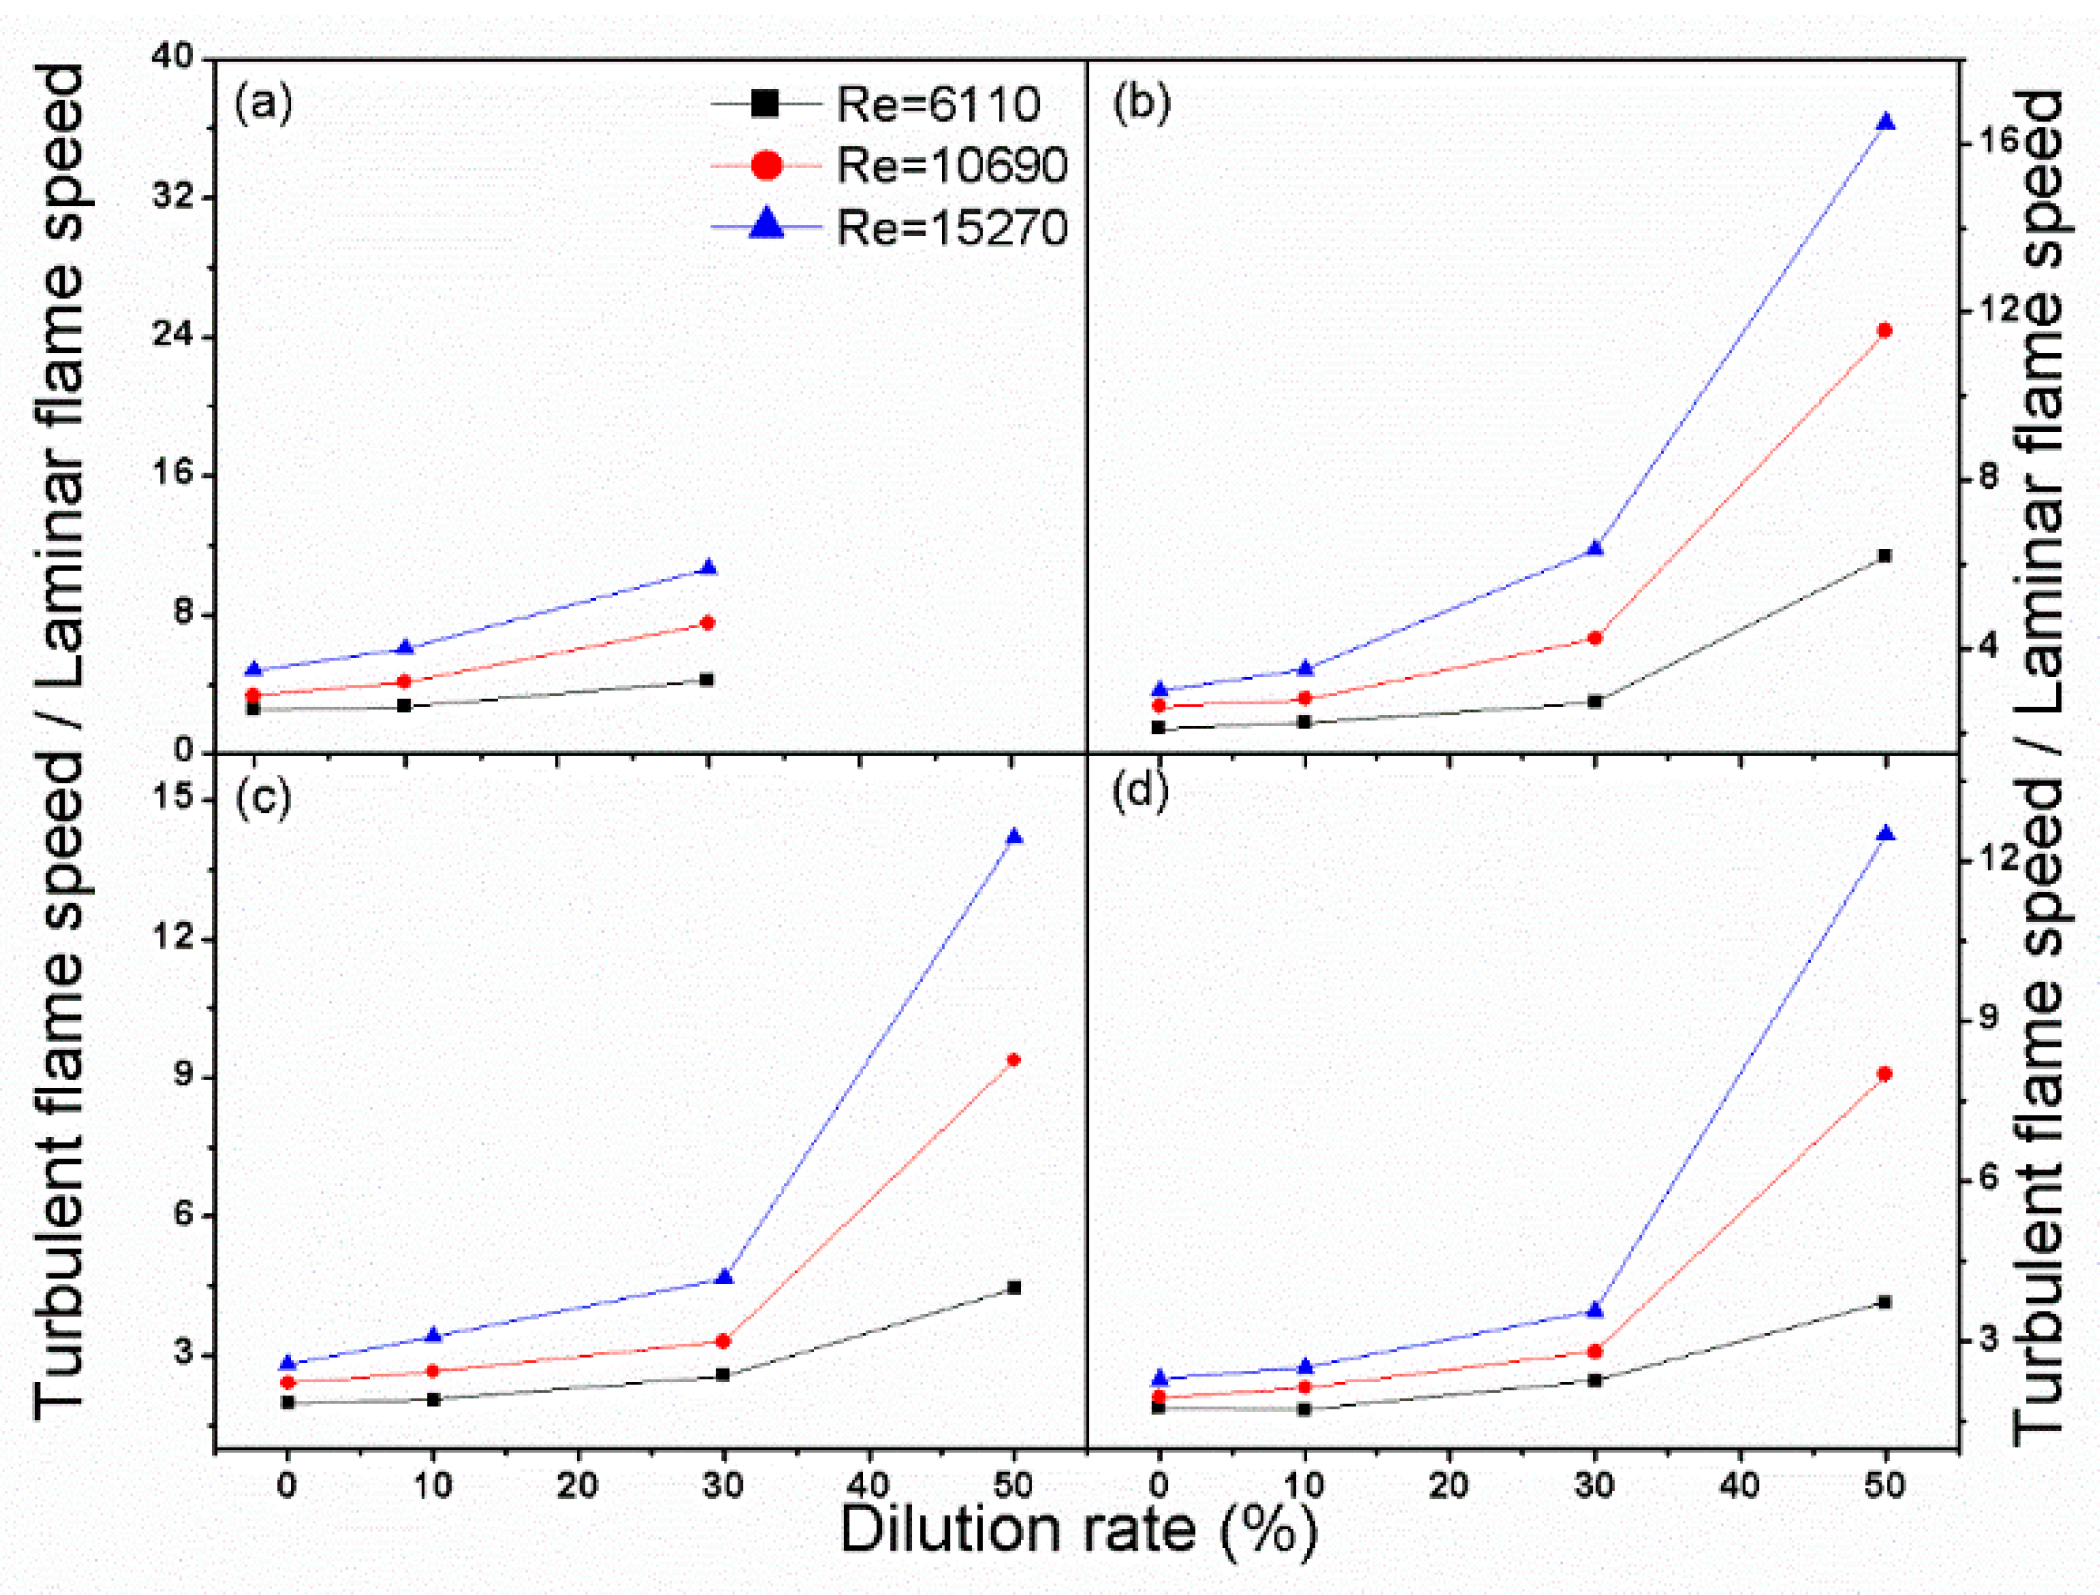
The effect of nitrogen dilution on the turbulent flame velocity of syngas is shown in Figure 15. Similar to the effect of different hydrogen proportions on the turbulent flame velocity, the variation in the turbulent flame velocity was consistent with that of the laminar flame velocity under different nitrogen dilution ratios. Moreover, at higher dilution, the ratio of the turbulent flame velocity to the laminar flame velocity increased obviously due to the lower laminar flame velocity, as shown in Figure 16. According to scholars, the ratio of the turbulent flame velocity to the laminar flame velocity, and the ratio of the turbulent intensity to the laminar flame velocity under lower turbulent intensity, are linear and expressed by the following formula:
ST/SL = 1 + u′/SL
where ST stands for turbulent flame velocity, SL stands for laminar flame velocity, and u′ represents turbulence intensity. The relationship between the ratio of the turbulent flame velocity to the laminar flame velocity, and the ratio of the outlet flow velocity to the laminar flame velocity, were studied in present work, as shown in Figure 14. It can be seen that there was a strong linear relationship between these two ratios. This was found by fitting the linear relationship, which can be expressed as:
ST/SL = 0.96 + 0.0163 × U0/SL
According to Formula (3), it was obvious that the fitting formula obtained from the present experiment was in good agreement with Formula (2). Furthermore, it was clearly seen that the turbulent flame velocities of different syngases with different hydrogen proportions and nitrogen dilution ratios was consistent. In addition, as shown in Formula (3), there was a strong linear relationship between the exit velocity and the corresponding turbulent flame velocity, as follows:
ΔST = 0.0163 × ΔU0
Therefore, the exit velocity used in the present work was 40, 70, and 100 m/s according to the experimental conditions. The exit velocity difference remained at a fixed value of about 30 m/s, corresponding to the turbulent flame velocity difference of about 50 cm/s, which is consistent with those shown in Figure 9 and Figure 15. According to Formula (2), the turbulent intensity of the flame front surface in the present experimental system was about 0.016 of the exit velocity, which was very close to the reference value of 0.01 in the literature [19].
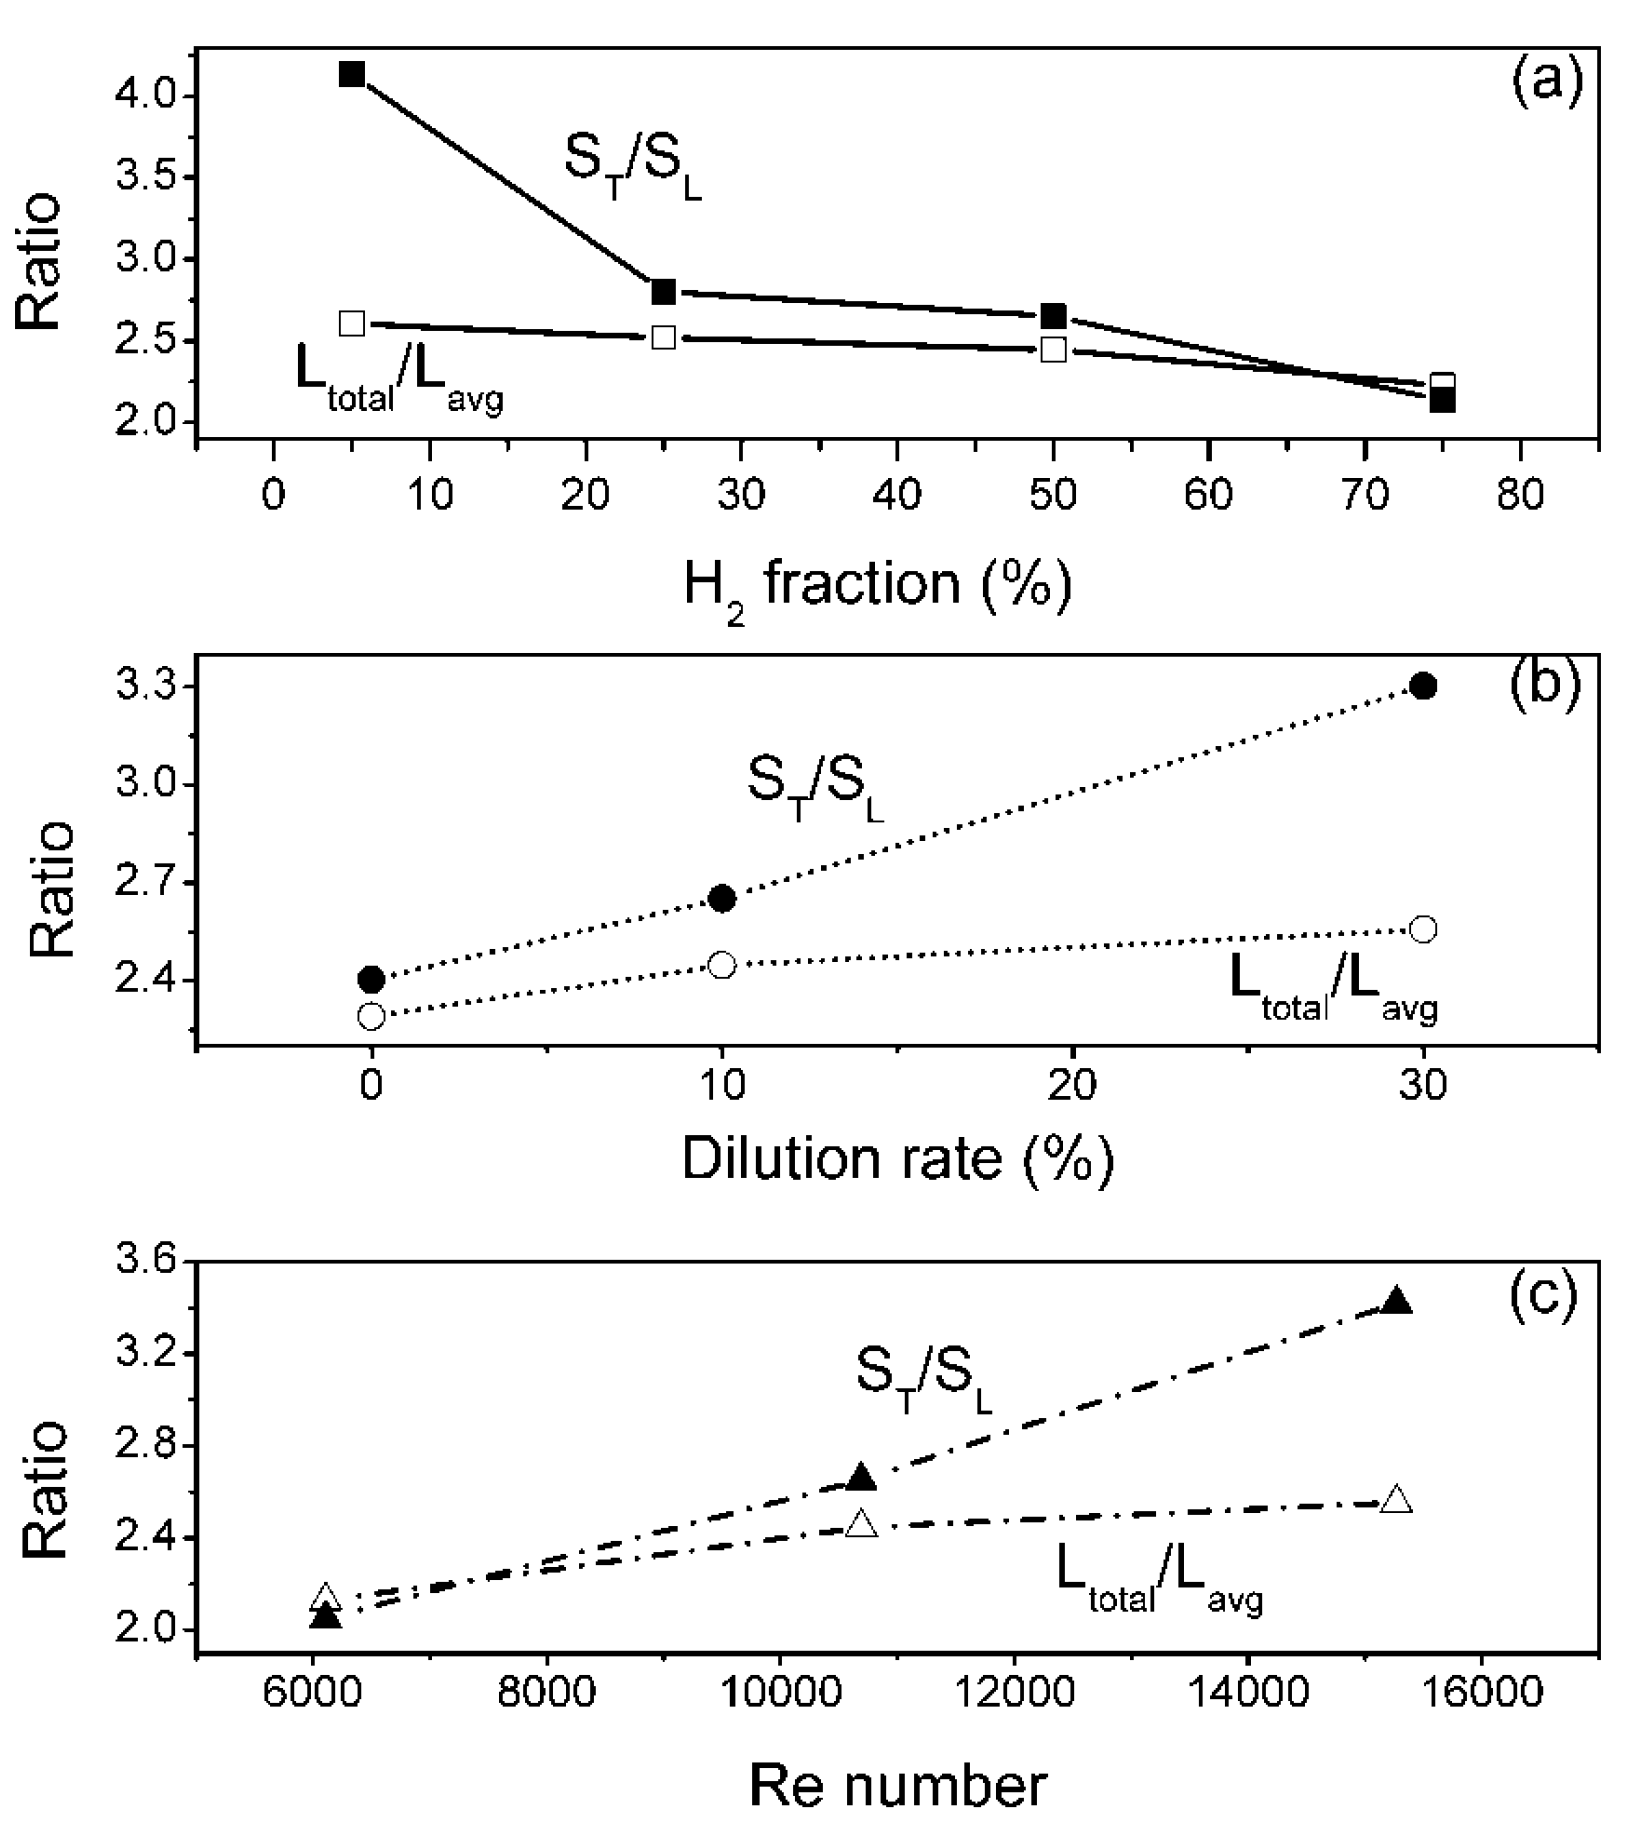
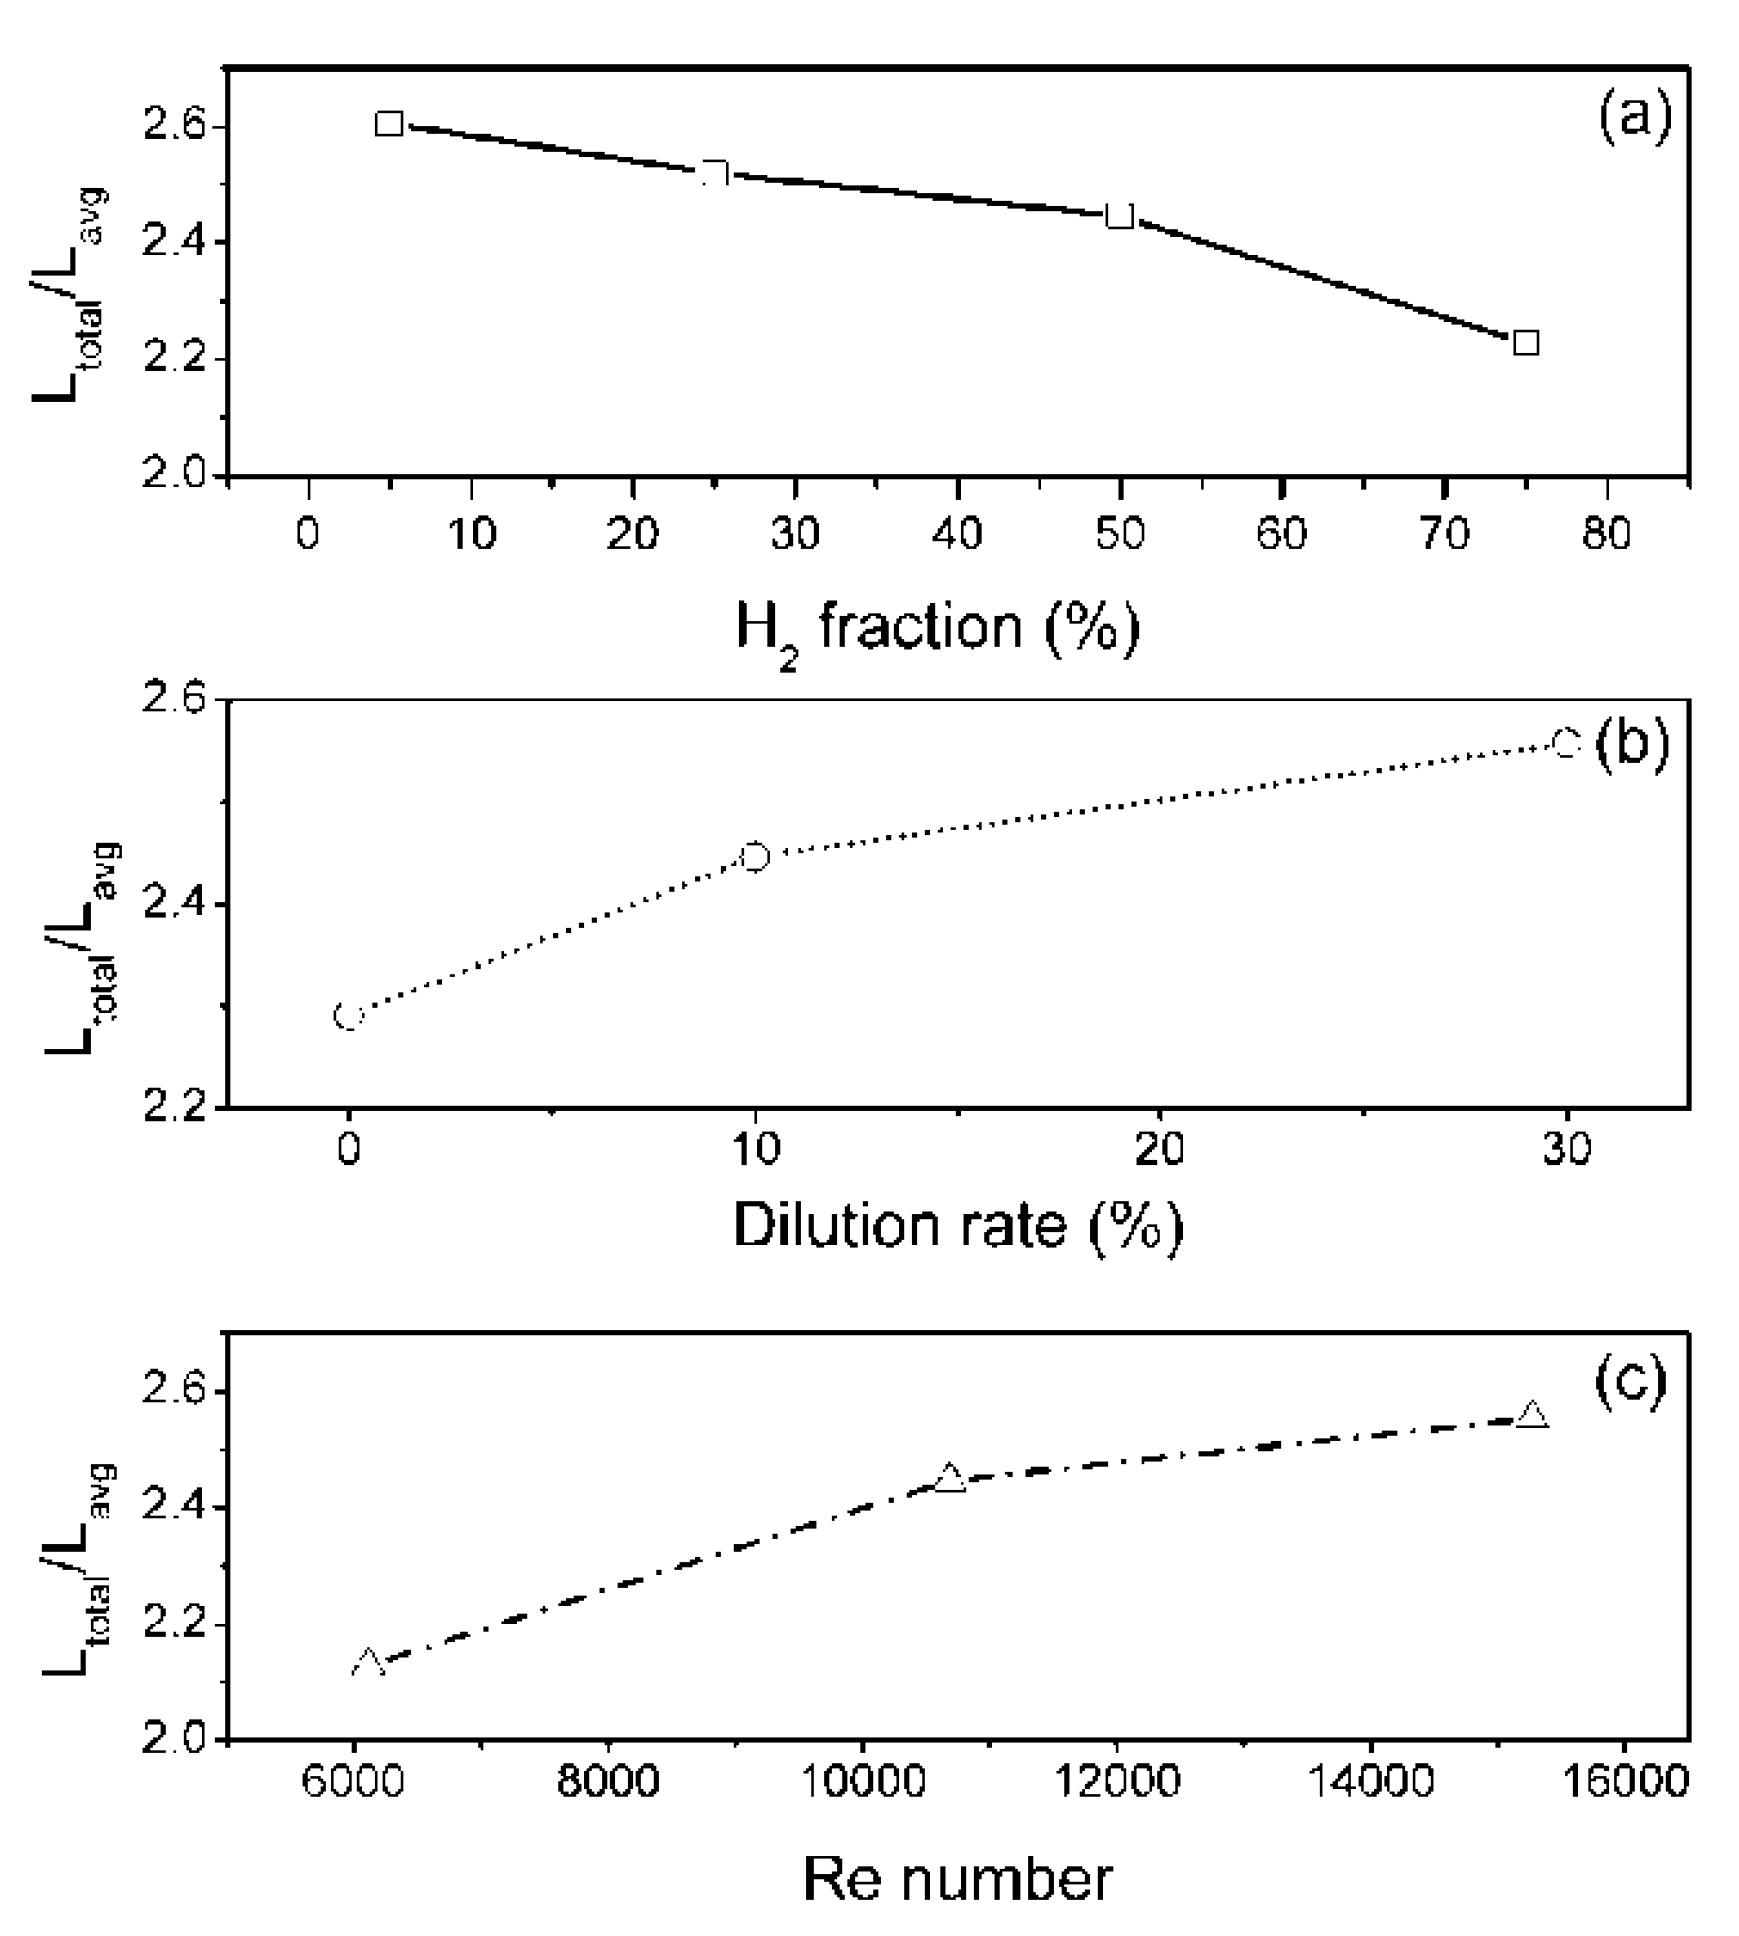
According to the definitions of laminar flame velocity and turbulent flame velocity, there was a strong correlation between the wrinkled rate obtained by the flame front length and the ratio of the turbulent flame velocity to the laminar flame velocity, which means Ltotal/LavgAtotal/AavgST/SL. Figure 17 shows both ratios for comparison, and the results show that the ratio of the turbulent flame velocity to the laminar flame velocity was generally greater than the wrinkled rate obtained previously, especially for the conditions of lower hydrogen proportion, higher nitrogen dilution rate, and larger Reynolds number. In addition, it was obvious that there was a large error in the structure of the flame front surface obtained from the two-dimensional instantaneous image and the corresponding wrinkled rate, which was smaller than that of the actual flame situation. Furthermore, the ratio of the turbulent flame velocity to the laminar flame velocity was calculated based on the laminar flame velocity under room temperature. However, higher local laminar flame velocity would occur in the turbulent flame under actual operating conditions due to the turbulent effect, which increased the preheating effect. This was consistent with our previous work on syngas [17], which indicated that nitrogen dilution restrained the flame speed of syngas, whereas higher preheat temperature accelerated the flame speed. Through changes in the thickness of the OH layers and signal intensities, the reaction layer can be compressed by intensifying turbulence and, thereby, the combustion processes of syngas. For these reasons, the ratios in Figure 18 were somewhat higher than those in actual conditions.

4. Conclusions

In this paper, the combustion characteristics of a turbulent premixed flame with different proportions of hydrogen and carbon monoxide, and different nitrogen dilution rates and exit Reynolds numbers were investigated. The results showed that the increase in the hydrogen proportion contributed to the formation of the OH radical in the flame, increased the burning velocity, and decreased the flame size under a certain outlet Reynolds number. As the dilution of syngas increased, the concentration of the OH radical decreased and the flame size enlarged due to the weakening of combustion intensity. By comparing different Reynolds numbers at the exit, the effect of turbulence intensity on the flame was mainly focused on the structure of the flame front surface. The higher turbulence intensity led to more complicated folds of the flame front surface, which enhanced the combustion intensity. For the same fuel, higher turbulence intensity increased the OH concentration to some extent and reduced the size of the flame surface.
The instantaneous OH distribution of the syngas jet flame was obtained by an OH-PLIF experiment. The flame front surface and the turbulent flame velocities of different syngases under different outlet Reynolds numbers were calculated and analyzed statistically. The results showed that the variation in the turbulent flame velocity of syngas with the hydrogen proportion and nitrogen dilution rate was similar to that of the laminar flame velocity. The higher the hydrogen proportion, the higher the turbulent flame velocity. A higher dilution rate reduced the turbulent flame velocity, and a higher exit Reynolds number increased the turbulent flame velocity. Furthermore, there was a good linear relationship between the turbulent flame velocity and the exit flow velocity of the experimental gas. For each 30 m/s increase in the outlet flow velocity, the turbulent flame velocity increased by about 50 m/s, regardless of its composition. This also indicates that the effect of turbulence intensity on combustion was not affected by the composition of syngas in the range of the present turbulence intensity.

Author Contributions

Data curation, W.W.; Funding acquisition, L.Y.; Methodology, Y.H.; Project administration, Y.Z.; Supervision, Z.W. and Z.L.; Writing-original draft, W.W.; Writing-review and editing, L.Y. and Y.H. All authors have read and agreed to the published version of the manuscript.

Funding

This research was funded by the National Natural Science Foundation of China [51621005], the Program of Introducing Talents of Discipline to Universities [B08026] and the Key Laboratory for Technology in Rural Water Management of Zhejiang Province, Zhejiang University of Water Resources and Electric Power.

Institutional Review Board Statement

Not applicable.

Informed Consent Statement

Not applicable.

Acknowledgments

The authors would like to thank editor and the reviewers who provided many valuable comments to improve the paper. Li Yang would also like to thank the help of Wubin Weng and the supervisor of Zhihua Wang.

Conflicts of Interest

The authors declare no conflict of interest.

Abbreviations

All the acronyms used in the manuscript are listed as follows:
PLIFplanar laser-induced fluorescence technology
EGRexhaust gas re-circulation
LCVlow calorific value
RSRayleigh scattering
ICCDintensified charge coupled device
RMSroot mean square
ReReynolds number

References

  1. Duwig, C.; Li, B.; Li, Z.; Aldén, M. High resolution imaging of flameless and distributed turbulent combustion. Combust. Flame 2012, 159, 306–316. [Google Scholar] [CrossRef]
  2. Medwell, P.R.; Kalt, P.A.M.; Dally, B.B. Simultaneous imaging of OH, formaldehyde, and temperature of turbulent nonpremixed jet flames in a heated and diluted coflow. Combust. Flame 2007, 148, 48–61. [Google Scholar] [CrossRef]
  3. Kobayashi, H.; Hagiwara, H.; Kaneko, H.; Ogami, Y. Effects of CO2 dilution on turbulent premixed flames at high pressure and high temperature. Proc. Combust. Inst. 2007, 31, 1451–1458. [Google Scholar] [CrossRef]
  4. Zhang, L.; Hui, S.; Yang, Y.; Sun, R.; Ismail, T.M.; El-Salam, M.A.; Ren, X. Numerical and Experimental Assessment of a Novel Multinozzle Burner with CO2 Diluent to Improve the Emissions from a Swirling Flame in a Combustion Chamber. Energy Fuels 2019, 33, 7869–7885. [Google Scholar] [CrossRef]
  5. Nemitallah, M.A.; Rashwan, S.S.; Mansir, I.B.; Abdelhafez, A.A.; Habib, M.A. Review of Novel Combustion Techniques for Clean Power Production in Gas Turbines. Energy Fuels 2018, 32, 979–1004. [Google Scholar] [CrossRef]
  6. Taamallah, S.; Vogiatzaki, K.; Alzahrani, F.M.; Mokheimer, E.M.A.; Habib, M.A.; Ghoniem, A.F. Fuel flexibility, stability and emissions in premixed hydrogen-rich gas turbine combustion: Technology, fundamentals, and numerical simulations. Appl. Energy 2015, 154, 1020–1047. [Google Scholar] [CrossRef]
  7. Wang, Z.; Li, B.; Ehn, A.; Sun, Z.; Li, Z.; Bood, J. Investigation of flue-gas treatment with O3 injection using NO and NO2 planar laser-induced fluorescence. Fuel 2010, 89, 2346–2352. [Google Scholar] [CrossRef]
  8. Osborne, J.R.; Ramji, S.A.; Carter, C.D.; Peltier, S.; Hammack, S.; Lee, T.; Steinberg, A.M. Simultaneous 10 kHz TPIV, OH PLIF, and CH2O PLIF measurements of turbulent flame structure and dynamics. Exp. Fluids 2016, 57, 65. [Google Scholar] [CrossRef]
  9. Elbaz, A.M.; Roberts, W.L. Experimental study of the inverse diffusion flame using high repetition rate OH/acetone PLIF and PIV. Fuel 2016, 165, 447–461. [Google Scholar] [CrossRef] [Green Version]
  10. Johchi, A.; Naka, Y.; Shimura, M.; Tanahashi, M.; Miyauchi, T. Investigation on rapid consumption of fine scale unburned mixture islands in turbulent flame via 10 kHz simultaneous CH-OH PLIF and SPIV. Proc. Combust. Inst. 2015, 3, 3663–3671. [Google Scholar] [CrossRef]
  11. Li, H.; Li, B.; Gao, Q.; Zhang, D.; Li, X.L.Z. Plane laser-Induced fluorescence for flame surface density calculation of OH/CH2O: A comparative study. Combust. Sci. Technol. 2018, 24, 523–527. [Google Scholar]
  12. Zhang, M.; Wang, J.; Huang, Z. Turbulent flame structure characteristics of hydrogen enriched natural gas with CO2 dilution. Int. J. Hydrog. Energy 2020, 45, 20426–20435. [Google Scholar] [CrossRef]
  13. Zhang, W.; Wang, J.; Lin, W.; Li, G.; Ye, J.; Guo, S.; Xia, H.; Zhang, M.; Huang, Z. Effects of hydrogen addition on the detailed flame structure of turbulent flames in thin reaction zone. J. Eng. Thermophys. 2021, 42, 795–801. [Google Scholar]
  14. Han, Y.; Cai, G.; Wang, H.; Bruno, R.; Abdelkrim, B. Flow characterization and dilution effects of N2 and CO2 on premixed CH4/air flames in a swirl-stabilized combustor. Chin. Phys. B 2014, 3, 386–399. [Google Scholar]
  15. Wang, J.; Matsuno, F.; Okuyama, M.; Ogami, Y.; Kobayashi, H.; Huang, Z. Flame front characteristics of turbulent premixed flames diluted with CO2 and H2O at high pressure and high temperature. Proc. Combust. Inst. 2013, 34, 1429–1436. [Google Scholar] [CrossRef]
  16. Yang, L.; Weng, W.; Zhu, Y.; He, Y.; Wang, Z.; Li, Z. Investigation of Dilution Effffect on CH4/Air Premixed Turbulent Flame Using OH and CH2O Planar Laser-Induced Fluorescence. Energies 2020, 13, 325. [Google Scholar] [CrossRef] [Green Version]
  17. Yang, L.; Wang, Z.; Zhu, Y.; Li, Z.; Zhou, J.; Huang, Z. Premixed jet flame characteristics of syngas using OH planar laser induced fluorescence. Chin. Sci. Bull. 2011, 56, 2862–2868. [Google Scholar] [CrossRef] [Green Version]
  18. Wang, Z.; Weng, W.; He, Y.; Li, Z.; Cen, K. Effect of H2/CO ratio and N2/CO2 dilution rate on laminar burning velocity of syngas investigated by direct measurement and simulation. Fuel 2015, 141, 285–292. [Google Scholar] [CrossRef]
  19. Daniele, S.; Mantzaras, J.; Jansohn, P.; Denisov, A.; Boulouchos, K. Flame front/turbulence interaction for syngas fuels in the thin reaction zones regime: Turbulent and stretched laminar flame speeds at elevated pressures and temperatures. J. Fluid Mech. 2013, 724, 36–68. [Google Scholar] [CrossRef] [Green Version]
Figure 1. Schematic of experiment setup.
Processes 09 01894 g001
Figure 2. Flame front surface of (a,c) laminar premixed flame and (b,d) turbulent premixed flame.
Processes 09 01894 g002
Figure 3. Data process and calculation of the turbulent flame speed: (a) flame instantaneous image of typical OH-PLIF; (b) flame instantaneous image of unburned and burned areas; (c) probability distribution images of unburned and burned areas; (d) contour lines of value 0.5 and corresponding fitting lines (extracted from Figure 2c).
Processes 09 01894 g003
Figure 4. Analysis process of flame front surface: (a) instantaneous image of OH-PLIF; (b) flame front of the instantaneous image; (c) overlaying of 500 flame front boundaries.
Processes 09 01894 g004
Figure 5. OH distribution instantaneous image of syngas with volumetric ratio of 5%H2–95%CO under different dilutions and Reynolds numbers: (a1a4) Re = 6110; (b1b4) Re = 10,690; (c1c4) Re = 15,270. 1, 2, 3, and 4 indicate nitrogen dilution volumetric proportions of 0%, 10%, 30%, and 50%, respectively.
Processes 09 01894 g005
Figure 6. OH distribution instantaneous image of syngas with volumetric ratio of 25%H2–75%CO under different dilutions and Reynolds numbers: (a1a4) Re = 6110; (b1b4) Re = 10,690; (c1c4) Re = 15,270. 1, 2, 3, and 4 indicate nitrogen dilution volumetric proportions of 0%, 10%, 30%, and 50%, respectively.
Processes 09 01894 g006
Figure 7. OH distribution instantaneous image of syngas with volumetric ratio of 50%H2–50%CO under different dilutions and Reynolds numbers: (a1a4) Re = 6110; (b1b4) Re = 10,690; (c1c4) Re = 15,270. 1, 2, 3, and 4 indicate nitrogen dilution volumetric proportion of 0%, 10%, 30%, and 50%, respectively.
Processes 09 01894 g007
Figure 8. OH distribution instantaneous image of syngas with volumetric ratio of 75%H2–25%CO under different dilutions and Reynolds numbers: (a1a4) Re = 6110; (b1b4) Re= 10,690; (c1c4) Re= 15,270. 1, 2, 3, and 4 indicate nitrogen dilution volumetric proportion of 0%, 10%, 30%, and 50%, respectively.
Processes 09 01894 g008
Figure 9. Length of wrinkled flame front under different flame conditions: (a) nitrogen dilution volumetric proportion of 10%, Re = 10,690, different hydrogen proportion in fuel; (b) hydrogen volumetric rate of 50%, Re = 10,690, different nitrogen dilution; (c) nitrogen dilution volumetric proportion of 10%, hydrogen volumetric ratio of 50%, different Reynolds number.
Processes 09 01894 g009
Figure 10. Wrinkled rate under different flame conditions: (a) nitrogen dilution volumetric proportion of 10%, Re = 10,690, different hydrogen proportion in fuel; (b) hydrogen volumetric rate of 50%, Re = 10,690, different nitrogen dilution; (c) nitrogen dilution volumetric proportion of 10%, hydrogen volumetric ratio of 50%, different Reynolds number.
Processes 09 01894 g010
Figure 11. Wrinkled rate under different flame heights with nitrogen dilution volumetric proportion of 10%, Re = 10,690, different hydrogen proportion in fuel: (a) hydrogen volumetric rate of 5%; (b) 25%; (c) 50%; (d) 75%.
Processes 09 01894 g011
Figure 12. Wrinkled rate under different flame heights with nitrogen dilution volumetric proportion of 10%, hydrogen proportion of 50%, different Reynolds number: (a) Re = 6110; (b) Re = 10,690; (c) Re = 15,270.
Processes 09 01894 g012
Figure 13. Trend of the turbulent flame velocity of syngas with different nitrogen dilution rates, under different hydrogen proportions in fuel and exit Reynolds numbers: (a) 0%; (b) 10%; (c) 30%; (d) 50% nitrogen dilution volumetric rate.
Processes 09 01894 g013
Figure 14. The ratio of turbulent flame velocity to laminar flame speed of the same syngas with different nitrogen dilution rates under different hydrogen proportions in fuel and exit Reynolds numbers: (a) 0%; (b) 10%; (c) 30%; (d) 50% nitrogen dilution volumetric rate.
Processes 09 01894 g014
Figure 15. Trend in the turbulent flame velocity of syngas with different hydrogen proportions under different nitrogen dilution rates and exit Reynolds numbers: (a) 5%; (b) 25%; (c) 50%; (d) 75% hydrogen volumetric proportion.
Processes 09 01894 g015
Figure 16. Trend in the ratio of the turbulent flame velocity to the laminar flame speed of the same syngas with different nitrogen dilution rates under different hydrogen proportions and exit Reynolds numbers: (a) 5%; (b) 25%; (c) 50%; (d) 75% hydrogen volumetric proportion.
Processes 09 01894 g016
Figure 17. Relationship between the ratio of turbulent flame velocity to laminar flame velocity and the ratio of outlet flow velocity to laminar flame velocity for the same composition of syngas.
Processes 09 01894 g017
Figure 18. Relationship between the winkled rate and the ratio of turbulent flame velocity to laminar flame velocity under different flame conditions: (a) nitrogen dilution volumetric proportion of 10%, Re = 10,690, different hydrogen proportion in fuel; (b) hydrogen volumetric rate of 50%, Re = 10,690, different nitrogen dilution; (c) nitrogen dilution volumetric proportion of 10%, hydrogen volumetric ratio of 50%, different Reynolds number.
Processes 09 01894 g018
Table 1. Operation conditions of syngas/air premixed jet flame.
H2:CO (v/v)Proportion of N2 Dilution (v%) Velocity at the Jet Exit
5:950, 10, 30, 50For each of the above conditions, 40 m/s (Re = 6110), 70 m/s (Re = 10,690) and 100 m/s (Re = 15,270) were selected
25:750, 10, 30, 50
50:500, 10, 30, 50
75:250, 10, 30, 50
Publisher’s Note: MDPI stays neutral with regard to jurisdictional claims in published maps and institutional affiliations.

