Abstract
Biohydrogen production by fermentation has become a promising technology developed in the world. In this study, diluted normal molasses wastewater is used as the raw material, and biohydrogen production efficiency and operation characteristics of an anaerobic baffled reactor (ABR) are studied. The effect of hydraulic retention time (HRT) on biohydrogen production efficiency and operating characteristics of ABR is extensively discussed. Experimental results showed that methanogen residuals were still observed in the last three compartments under HRT of 24 h and COD(Chemical oxygen demand) concentration of 8000 mg/L. Meanwhile, the first three compartments presented an ethanol fermentation type. The characteristics of butyric acid fermentation in Compartment IV were also enhanced. The average removal efficiency of COD was reduced to 15.4%. The average rates of biohydrogen production and specific biohydrogen production were 12.85 and 360.22 L/kg COD, respectively. The extension of HRT was beneficial to enrich hydrogen-producing acetogens and could increase the production rate of biohydrogen by a factor of 1.65. However, with the decrease in the bioactivity of acidogenic fermentation bacteria, the biohydrogen production efficiency of ABR was significantly reduced when HRT was longer than 30 h. The specific biogas production rate decreased from 191 to 92 L/(kg MLVSS·d). The specific biohydrogen production rate also decreased from 24.34 to 2.7 L/(kg MLVSS·d).
1. Introduction
With the rapid development of the modern food industry, the wastewater produced with high organic matter is also gradually increasing. Thus, a huge amount of organic wastewater is directly discharged to receiving water. Normal molasses wastewater is a typical high-strength organic wastewater, which is also the by-product of sugar refinement. Gokcek et al. found that COD removal increased along with the increase of organic loading rate, while the biogas yield decreased [1]. In order to reduce the environmental risks, enhanced biogas and lipid production are well developed. By the enrichment of biohydrogen-producing acetogens, the specific hydrogen and methane yields from COD removal increased by factors of 1.54 and 1.63 in normal molasses wastewater treatment [2]. In addition, lipid production through microalgae cultivation in normal molasses wastewater treatment presented its economic feasibility when a lipid content of 28.9% and lipid productivity of 94.4 mg·m−3·d−1 were finally obtained [3,4].
The use of fermentation to produce biohydrogen is a process in which hydrogen-producing microorganisms metabolize organic matter to produce hydrogen under anaerobic conditions [5]. The mechanism of the fermentation to produce biohydrogen has three possible ways: pyruvate decarboxylation in the EMP(Embden–Meyerhof–Parnas) pathway, the oxidation and reduction balance adjustment of acetyl coenzyme I, and the bacteria producing hydrogen and acetic acid [6]. The Enterobacter aerogenes ho-39 and E. aerogenes hu-10l strains have been adopted to conduct biohydrogen production by non-immobilized and immobilized experiments. The results showed that the continuous and maximum biohydrogen rates of the immobilized model is higher than that of the un-immobilized model [7,8]. Continuous flow fermentation for biohydrogen production on anaerobic-activated sludge (AnAS) with self-flocculation ability broke through the limitation of pure bacteria compartment immobilization and created a new field to enhance biohydrogen production based on non-immobilized mixed strains (AnAS) [9,10].
An anaerobic baffled reactor (ABR) is the third generation of anaerobic bioreactors in which the specific design is to set up a series of vertical baffles in the reactor. Thus, the wastewater can be introduced up and down along the baffle in ABR and then passed through the sludge bed of each compartment [11]. The operation flow path of ABR is similar to that of the plug flow process, which presents the provision of upper and lower baffles to form a compartment [12]. Such processes can connect and effectively separate microorganisms from methanogenic and acidogenic phases [13]. Therefore, two-phase anaerobic digestion can be established in a single reactor. The organic loading rate, influent type, sludge reflux, and agitation, temperature, and mathematical models have been studied comprehensively to achieve biohydrogen production through high-load organic wastewater fermentation in ABR [14,15,16,17].
Methanogens have strict living conditions and slow metabolism and growth rate. The traditional theory considers methanogens as the first rate-limiting step in the anaerobic wastewater treatment process because biohydrogen production and acetic acid production stage is prior to methane production stage [18,19]. High organic matter can lead to low pH value through fermentation [20]. Thus, the inhibition of methanogens caused by relatively low pH is beneficial to increase the biohydrogen production rate. Therefore, this study proposes the startup and operation of ABR to investigate the biohydrogen production performance. In accordance with the regulation of hydraulic retention time (HRT), the characteristics of each compartment are discussed comprehensively. Furthermore, the enhanced biohydrogen production through HPA is discussed to provide a potential approach for eliminating methane production and preserving biohydrogen resources.
2. Materials and Methods
2.1. ABR Configuration and Setup
A four-compartment ABR with a total volume of 28.75 L was adopted in the experiment (Figure 1). Each compartment had an equal size and had downflow and upflow chambers of 2.5 and 11.5 cm in width, respectively. Normal molasses wastewater (NMWW) was introduced to the bottom of the upflow chamber and finally drained through a guide plate with an inclination of 45° at the downflow chamber. The sampling ports were arranged at different heights of each compartment. An effluent pipe was set at the top to connect with the water seal. The sealed water bottle and wet gas flowmeter were filled with HCl (pH of 3) to prevent gas dissolution. The ABR temperature was maintained at 35 ± 1 °C. The operation control of ABR was conducted in stages, and Table 1 presents the specific control mode.
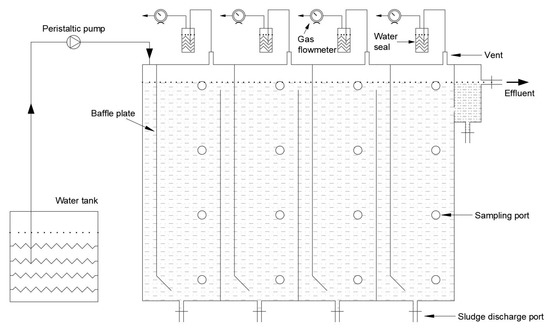
Figure 1.
Schematic diagram of the experiment.

Table 1.
The parameters of an anaerobic baffled reactor (ABR).
2.2. Inoculated Sludge and NMWW
The NMWW (Table 1), with pH ranging from 5.3 to 5.8, was obtained from a sugar beet factory. The total nitrogen of NMWW was 35 mg/L; thus, the corresponding C/N was 230. To maintain the bioactivity of the anaerobic activated sludge, NH4Cl and K2HPO4 were added at a COD:N:P ratio of 200:5:1. NaHCO3 was used to adjust the initial pH value of the wastewater to 7.5–8.0. In addition, a large amount of particulate matter is generated at the bottom of the influent tank after storage for a long period of time, which can significantly reduce the bioactivity of activated sludge. Therefore, a new type of NMWW with litter particulate matter was provided after 32 days of ABR operation to ensure the stable operation of the ABR system and investigate the effect of HRT on biohydrogen production. The inoculated aerobic activated sludge was obtained from Wenchang Wastewater Treatment Plant (Harbin, China), and the anaerobic-activated sludge (AnAS) was collected in a beer brewhouse. The AnAS was initially filtered and washed to remove inorganic particles. In order to enhance biohydrogen production efficiency in each compartment of ABR, different inoculation strategies were adopted to maintain biomass retention and increase the ratio of the functional genus. The first and fourth compartments were inoculated with aerobic and anaerobic sludges, respectively. Compartments 2 and 3 were inoculated with mixed aerobic activated sludge and AnAS in the ratios of 5:2 and 2:5 (v/v), respectively.
2.3. Analytical Methods
COD, pH, alkalinity (ALK, in terms of CaCO3), and mixed liquor volatile suspended solids (MLVSS) were regularly determined by the standard method (APHA, 1995) [21]. The biogas production of ABR compartments was measured with a wet biogas flowmeter. The morphology of AnAS was observed with a scanning electrical microscope (JSM-5610). The components and contents of fermentation biogas, volatile fatty acids (VFAs) in wastewater, and ethanol were determined by gas chromatography [22]. The liquid terminal product was determined with a GC-122 gas chromatograph, which was determined under the following conditions: supporter GDX-103 (60–80 mesh) + 2% H3PO4; size of packed column of 2 m × Φ 5 mm; and carrier gas rates of N2, H2, and air of 50, 50, and 500 mL/min, respectively. The highest temperature of the column box was 250 °C, the temperature of the sampler was 200 °C, and the temperature of the ion chamber was 240 °C. The column temperature was 190 °C, and the sample volume was 2 mL. Before the determination, the sample should be pretreated as follows: after centrifugation or filtration of the water sample from the continuous flow reactor, 5 mL was taken, and 2 drops of 6 mol/L HCl were added. The biogas components in fermentation gas were determined with gas chromatography (Lunan SC-7, Tengzhou, China) under the following conditions: oven temperature of 60 °C, injection temperature of 80 °C, detection temperature of 200 °C, N2 = 28 mL/min, and sample volume of 200 mL.
3. Results
3.1. Biomass and Morphology of AnAS
Figure 2 shows the variations of biomass concentration from each compartment of ABR, in which the initial MLVSS were 7.0, 6.0, 5.8, and 11.5 mg/L, respectively. The biomass in Compartments I to III presented a decrease first and then an increase along with the regulation of HRT (from Stage I to Stage II), indicating that the microbial activity and stable operation of ABR can be well maintained when suitable extension HRT is provided. However, the biomass concentration in Compartment IV notably decreased due to sludge floatation and loss when HRT was extended to 40 h, implying that relatively long HRT is beneficial for the growth of methanogens.
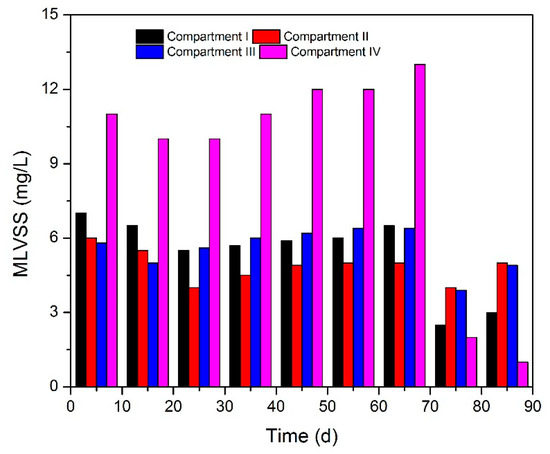
Figure 2.
Biomass concentration trend over time in each compartment of ABR.
Figure 3 illustrates the morphology of AnAS in each compartment during the stable phase of Stage III. The morphology in each compartment was significantly different. The first compartment was dominated by Bacillus, and the population of short Bacillus in Compartment II increased. The dominant bacteria in Compartment III was still Bacillus, and the long Bacillus increased. However, large amounts of cocci were found in Compartment IV, and the number of plump strains decreased significantly. The reason could be due to the lack of substrate, which further led to a decrease in microbial activity.
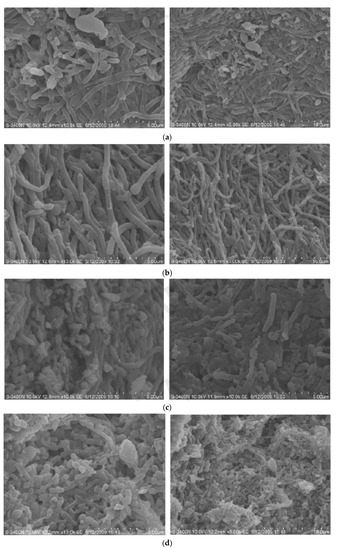
Figure 3.
(a) Morphology of anaerobic-activated sludge (AnAS) in Compartment I at Stage III; (b) morphology of AnAs in Compartment II at Stage III; (c) morphology of AnAs in Compartment III at Stage III; (d) morphology of AnAs in Compartment IV at Stage III.
3.2. Biogas Production Characteristics of ABR
3.2.1. Biogas Production in Compartment I
In the startup phase of Stage I, the biogas production rate in Compartment I was stable at 13 L/d, the biohydrogen content fluctuated between 44.4% and 58.1%, and the methane content was always below 0.5% (Figure 4). On day 7, the biogas production rate was approximately 13.4 L/d, and the biohydrogen content increased to 68.9%. However, a decrease in biohydrogen content occurred from day 21, and the methane content was always below 0.5%.
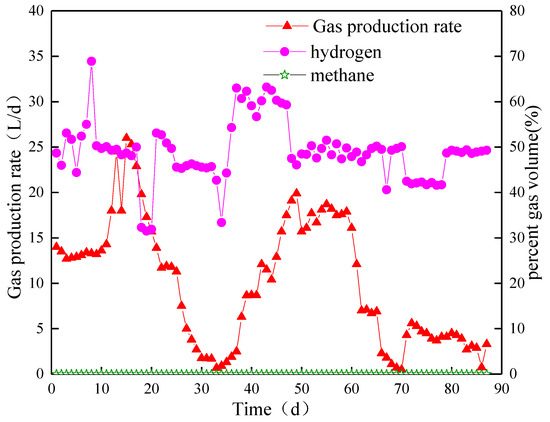
Figure 4.
Biogas yield and content in Compartment I.
After HRT was extended to 30 h (Stage II), the biogas production rate in Compartment I increased rapidly and reached a peak of 26 L/d on day 15. However, the biohydrogen production rate decreased to 1.7 L/d on day 32. The biohydrogen content did not change immediately with the variation in pH. The content increased to approximately 50% on day 17 and remained at nearly 45% on day 32. By introducing a new type of NMWW to ABR, the biogas production started to recover from day 36 and continued to increase to the highest value of 19.9 L/d on day 49. The biohydrogen production rate dropped to 7 L/d on day 62 and further reduced to less than 1 L/d. The biohydrogen content suddenly decreased to the lowest value of 33.4% on day 34, gradually recovered to 54.3% on day 36, and remained stable until the end of Stage II. The average biohydrogen content in the stable period was approximately 50%, and the methane content was always below 0.5%.
In Stage III, with the increase in HRT (HRT = 40 h), the biogas production rate increased rapidly from less than 1 to 4.3 L/d on day 71 and reached 5.6 L/d on day 72. On days 73 to 87, the ABR system was still unable to recover to the previous level. In other words, the microbial activity was severely inhibited, and the biogas production continued to decline. The biohydrogen content decreased to 42.5% and finally stabilized at approximately 49%.
3.2.2. Biogas Production in Compartment II
The variation in biogas production in Compartment II was different from that in Compartment I. The biogas production rate reached a maximum value of 26.0 L/d on day 4 and then dropped to 15.7 L/d on day 8 (Figure 5). The biohydrogen content gradually increased to 51% and suddenly decreased to 28.45% on day 8 but was recovered immediately on day 9. At the end of Stage I, the biohydrogen content was approximately 50%.
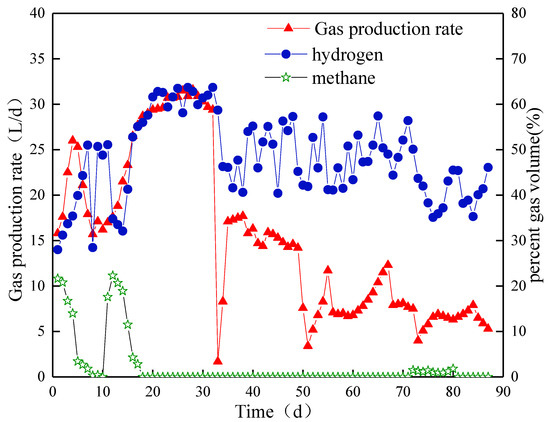
Figure 5.
Biogas yield and content in Compartment II.
In Stage II, the biogas production rate achieved a peak value of 31.6 L/d on day 28. As HRT was regulated to 30 h, the biohydrogen content decreased rapidly and began to rise on day 15. The content reached 63.7% on day 32. However, by introducing a new type of NMWW to ABR, the biogas production rate significantly reduced to 1.7 L/d and fluctuated between 14.3 and 17.7 L/d from day 36 to day 47. The rate suddenly dropped to the lowest value of 3.4 L/d. The biogas production started to increase slowly from day 56 and stabilized at approximately 8.1 L/d at the end of this stage (day 70). The biohydrogen content decreased slightly and fluctuated between 40% and 60% in this stage, while the methane content was always below 0.5%.
In the third stage, the biogas production did not change immediately after HRT was extended. However, the rate suddenly decreased to 4.0 L/d on day 73 and then slowly increased to 7.9 L/d after 84 days. At the end of this stage, no significant change in biogas production was observed. The biohydrogen content slightly decreased and stabilized at approximately 46% at the end of this stage. Methane production occurred from day 72, but the content was always below 2%.
3.2.3. Biogas Production in Compartment III
The biohydrogen production rate slightly changed at the beginning of Stage I. Specifically, the value fluctuated between 10.9 and 13.8 L/d (Figure 6). Meanwhile, the biohydrogen content was always below 5%. The methane content drastically dropped and was 28% at the end of Stage I. From day 7, the biohydrogen content increased rapidly and reached 40.5% on day 10. In Stage II, the biogas production rate increased to 19.6 L/d at the maximum. After HRT was increased, the biohydrogen content decreased rapidly to 7.1% but reached a peak of 68.3% on day 34. The methane content increased to 35.8% and then rapidly dropped to below 0.5% on day 32. By introducing a new type of NMWW to ABR, the biogas production rate suddenly decreased to 6.2 L/d due to sludge floatation and loss. The biogas production rate gradually recovered and reached 7.4 L/d on day 70. The biohydrogen content decreased slowly to the lowest value of 19.8% on day 61, which further remained at approximately 40% until the end of this stage. On day 39, the content of methane suddenly increased to 12.4% and remained at 13.7% to 16.6%, although it reduced to 3% on day 47. In Stage III, the biohydrogen content suddenly dropped to 25.4% and then fluctuated at approximately 27.3%. The methane content suddenly increased to 21.8% on day 79.
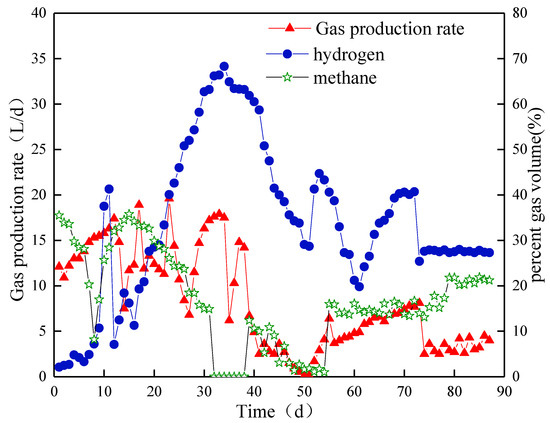
Figure 6.
Biogas yield and content in Compartment III.
3.2.4. Biogas Production in Compartment IV
The average biogas production in compartment IV slightly changed and remained at approximately 2 L/d (Figure 7). The methane content was higher than 40% at Stage I. In Stage II, the biohydrogen content increased slowly and reached 11.7% on day 32, and the methane content reached 29.6%. On day 33, the biohydrogen content suddenly increased to 29.0% by introducing a new type of NMWW to ABR. However, the content dropped to the lowest value of 3.4% on day 56 and reached approximately 18% on day 70. The methane content drastically dropped to below 0.5% and recovered to approximately 11%. In Stage III, although the volume load was reduced, the biohydrogen content in Compartment IV dropped to below 2% on day 72. Meanwhile, the methane content increased to approximately 23%.
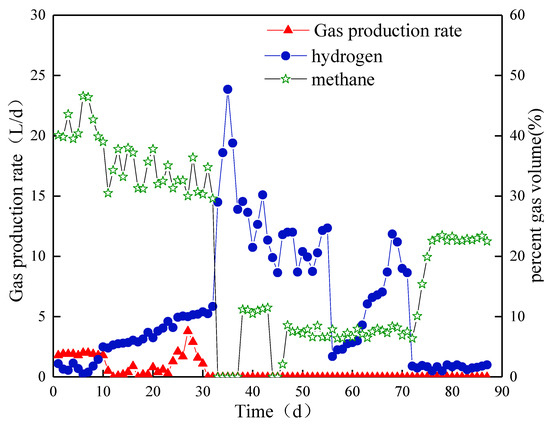
Figure 7.
Biogas yield and content in Compartment IV.
3.2.5. Comparison of Biogas Production Rate in Each Compartment
Figure 4, Figure 5, Figure 6 and Figure 7 shows that, in the early phase of Stage I, the biogas production rate in Compartments I and III slightly changed. At the same time, the biogas production rate in Compartment II gradually decreased, and that in Compartment IV was always at a low level. With the increase in HRT to 30 h on day 11, the biogas production rate in the first three compartments rapidly increased and reached the highest values on days 15, 28, and 23. However, the biogas production rate decreased thereafter. The biohydrogen content in the first compartment increased to 32% after HRT promotion, but it showed a downward trend in Compartment I. Therefore, the microbial activity in Compartment I was low. The content of biohydrogen in Compartments II and III decreased rapidly, while the contents of biohydrogen and methane in Compartment IV increased slowly but remained at a low level. By introducing a new type of NMWW to ABR, the biogas production rate of the first three compartments drastically decreased. The biogas production rate in Compartments II and III were maintained at a low level due to sludge floatation and loss. The biohydrogen content in Compartment I decreased rapidly on day 33 and then slowly recovered to approximately 30%, and the methane content was below 0.5%. The content of methane in Compartments III and IV greatly changed, both of which experienced a sudden increase and then a rapid decrease. Moreover, the content of methane in Compartment IV even dropped to below 0.5% on days 33 and 44. This result indicates that the bioactivity of methanogens is difficult to improve. The average biohydrogen production capacities of ABR gradually decreased with values of 0.46, 1.87, and 1.32 L/d in Compartments I, II, and III, respectively. After the increase in HRT to 40 h, the biogas production rate in Compartments II and III slowly decreased, while that in Compartment I increased rapidly. However, the biohydrogen content decreased to 24.5% and continued to decline. Methane was detected in Compartment II during this stage, and its content in Compartments III and IV increased. However, the microbial activity of methanogens was ineffectively enhanced due to the low rate of total biogas production.
3.3. Characteristics of Fermentation Products of ABR
3.3.1. Fermentation Products in Compartment I
In the early phase of Stage I, the content of VFAs in Compartment I was relatively stable, and the ethanol content gradually decreased. In Stage II, the content of ethanol continued to decrease to 473 mg/L at 18 days, and the total amount of VFAs also decreased to its lowest value. From day 19, the ethanol content gradually increased to 1314 mg/L, and the total amount of VFAs reached 2129 mg/L at day 23 (Figure 8). Subsequently, the content of ethanol continued to decrease, and the total amount of VFAs decreased to 805 mg/L. By introducing a new type of NMWW to ABR, the content of ethanol reached 818.8 mg/L at day 38, and the total amount of VFAs was as high as 2086.7 mg/L. From days 39 to 56, the content of ethanol gradually increased, during which the content of acetic acid slowly increased and reached the highest value of 1356.8 mg/L. The total amount of VFAs was up to 2412.2 mg/L on 56 days. From day 57, the content of ethanol and acetic acid decreased, and the total amount of VFAs decreased to 1258.2 mg/L. In Stage III, the content of ethanol changed greatly and showed a decreasing trend. Meanwhile, the other components of volatile acid changed slightly, and the total amount of VFAs also showed a decreasing trend. The ethanol content also exceeded 50% of the total volatile acid, and the acetic acid content was approximately 26.3%. The ethanol and acetic acid contents accounted to approximately 84.8% of the total VFA content. Thus, the ethanol fermentation type in Compartment I was a typical one. In Stages II and III, although the content of ethanol was reduced, the contents of ethanol and acetic acid still accounted for more than 80% of the total content of VFAs content. Therefore, the fermentation maintained the ethanol fermentation type.

Figure 8.
Ethanol and volatile fatty acids (VFAs) yields in Compartment I.
3.3.2. Fermentation Products in Compartment II
The VFA content was stable at Stage I. On day 10, the ethanol content rapidly increased to 1217.6 mg/L, while the content of other components was stable. The total amount of VFAs decreased rapidly to 2114.3 mg/L (Figure 9). In Stage II, the ethanol content continued to increase to 2651.4 mg/L at the highest level on the 15th day. At this time, the contents of acetic and butyric acids increased to 1505.4 and 356.5 mg/L, respectively, and the total amount of VFAs reached 4867.0 mg/L. From day 16, the content of VFAs decreased, and the total amount of VFAs decreased to 2794.6 mg/L with the decrease in the content of ethanol. With the operation of ABR, the content of ethanol increased to 2404.4 mg/L, and the total amount of VFAs increased to 3926.7 mg/L in day 23. At this time, the acetic acid content was 1217.2 mg/L, and the propionic and butyric acid contents were 268.5 and 118.0 mg/L, respectively, which presented a typical ethanol fermentation type. By introducing a new type of NMWW to ABR, the VFA content significantly decreased. On day 34, the ethanol content drastically decreased from 1340 to 140.4 mg/L. The total amount of VFAs decreased to 1173.9 mg/L with the decline in acetic acid. The content of ethanol recovered to 1154.3 mg/L from day 39 and slightly fluctuated with the operation of ABR. The acetic acid content gradually recovered to 1194.7 mg/L and then decreased slowly. The propionic and butyric acid contents remained at approximately 219.4 and 261.4 mg/L. The total amount of VFAs was approximately 2000 mg/L, which denoted ethanol fermentation type. In Stage III, the ethanol content began to decrease from day 76. However, the other components changed slightly, and the total amount of VFAs was approximately 1916 mg/L, which still showed ethanol fermentation type.
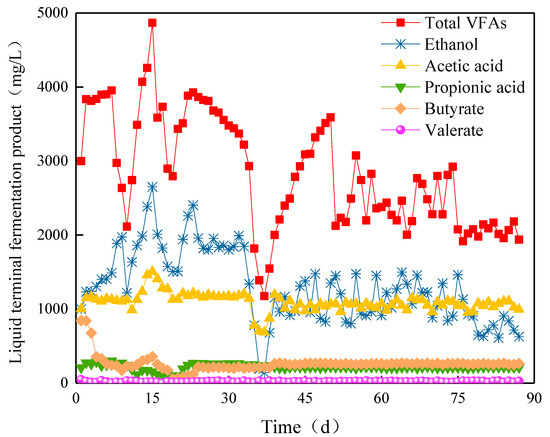
Figure 9.
Ethanol and VFAs yields in Compartment II.
3.3.3. Fermentation Products in Compartment III
In the early phase of Stage I, the content of ethanol and the total amount of VFAs in Compartment III drastically changed. However, the VFAs gradually became stable with the ABR operation. In Stage II, the butyric acid content increased, and the ethanol content began to decrease and remained stable at approximately 769.3 mg/L when HRT was prolonged to 40 h (Figure 10). The total amount of VFAs was approximately 2553.8 mg/L in the stable period. The acetic, propionic, butyric, and valeric acid contents were approximately 1000, 280, 530, and 70 mg/L, respectively, which presented mixed acid fermentation type.
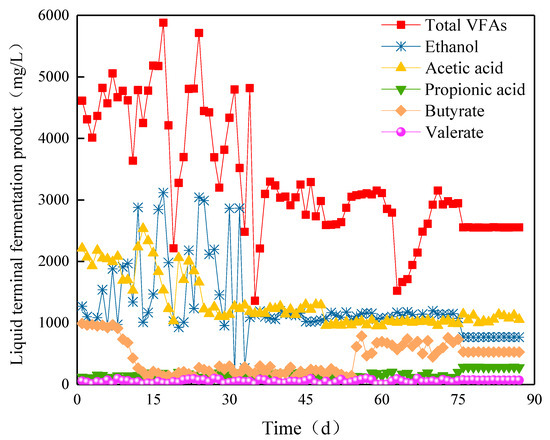
Figure 10.
Ethanol and VFAs yields in Compartment III.
3.3.4. Fermentation Products in Compartment IV
The variation in fermentation products in Compartment IV was different from those in Compartments I, II, and III. The content of acetic acid was higher than that of ethanol in Stage I, which denoted mixed acid fermentation type. From Stage III, the content of acetic acid suddenly decreased due to the extension of HRT, while the content of ethanol kept increasing, and ethanol fermentation type finally formed. Moreover, the contents of ethanol, acetic acid, propionic acid, and valeric acid tended to be stable. The butyric acid content suddenly increased from 334.5 to 990.2 mg/L at day 56. At this time, the contents of ethanol, acetic acid, propionic acid, and valeric acid were 960.1, 1146.3, 246.3, and 58.8 mg/L (Figure 11), respectively, with a total amount of 3401.7 mg/L, which showed mixed acid fermentation type.
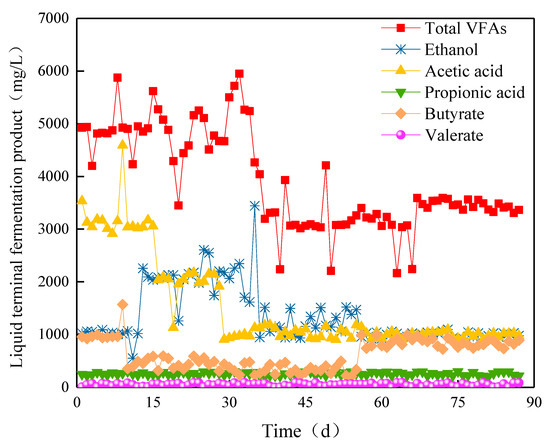
Figure 11.
Ethanol and VFAs yields in Compartment IV.
3.3.5. Comparison of Fermentation Products in Each Compartment
The variations in fermentation products of each compartment showed similar performance to biogas production (Figure 8, Figure 9, Figure 10 and Figure 11). Before the promotion of HRT, stable ethanol fermentation type was presented in Compartments I, II, and III, and Compartment IV denoted butyric acid fermentation type. After the extension of HRT to 30 h, the ethanol content in Compartment I decreased significantly with a value of 473 mg/L on day 18 and a value of 180 mg/L on day 32. Furthermore, the total amount of VFAs decreased to 805 mg/L. However, the fermentation types in the first three compartments did not change. The content of acetic acid in Compartment IV suddenly decreased, and that of ethanol increased rapidly, and thus indicated an ethanol fermentation type. By introducing a new type of NMWW to ABR, the content of butyric acid in Compartment IV increased to 990 mg/L on day 60. However, the composition of other liquid terminal products changed slightly. The fermentation characteristics of AnAS in Compartment IV were restored to butyric acid fermentation type. With the extension of HRT to 40 h, the ethanol content in the first three compartments decreased. However, the contents of ethanol and acetic acid still accounted for more than 60% of the total amount of VFAs. Therefore, the fermentation type was still ethanol fermentation, and that in Compartment IV denoted a butyric acid fermentation type.
3.4. Variations in pH, Alkalinity, and COD
3.4.1. Variations in pH and Alkalinity
Figure 12 and Figure 13 demonstrate the variation in pH value and alkalinity in the ABR system. In the early phase of Stage I, the pH value of the influent was nearly 6.6, but the pH values of the compartments decreased to below 4.7, 5.3, 5.3, and 5.0. The alkalinity of each compartment greatly changed due to sludge loss in Compartments I and IV. The alkalinity of each compartment was oscillatory. Specifically, the alkalinity in Compartment I increased from 510 to 640 mg/L, and that in Compartment IV decreased from 1780 to 860 mg/L.
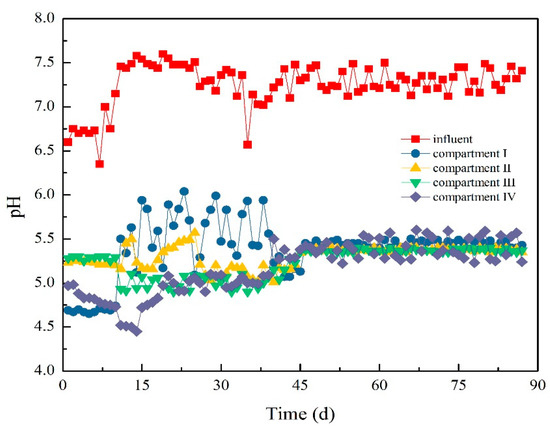
Figure 12.
Variation of pH values in each compartment.
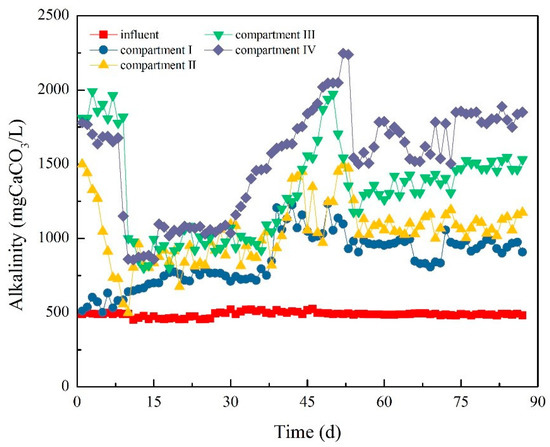
Figure 13.
Variation of alkalinity in each compartment.
At the beginning of Stage II, the pH and alkalinity of each compartment slightly changed. By introducing a new type of NMWW to ABR, the pH value in Compartments I and II began to decrease, while those in Compartments III and IV began to increase. On day 39, the pH value in Compartment I was the highest, and the pH values in the last three compartments were close. The pH value in Compartment IV exceeded that in Compartment I and reached approximately 5.2 on day 45. After operation for more than 50 days, the pH values in each compartment were similar. The effect on pH value and alkalinity was only slight when HRT was prolonged to 40 h.
3.4.2. Relationship between COD Removal and Biohydrogen Production Efficiency
COD removal by anaerobic treatment system was mainly realized by methanogenic bacteria. The ABR system, which was characterized by the metabolism of acidogenic fermentation bacteria, could remove COD mainly through the release of CO₂ and H₂ because the pH value was not conducive to the relatively high bioactivity of methanogens. However, most COD was converted into volatile acids, including acetic, propionic, and butyric acids. Thus, the removal rate of COD was relatively low. Figure 14 shows the variation in COD from the effluent of each compartment during the operation of ABR. In the early phase of Stage I, the influent and effluent COD of each compartment were relatively stable, and the COD removal efficiency showed a slow upward trend (Figure 14). Subsequently, the COD concentration in each compartment also changed with the fluctuation of influent due to the fluctuation of COD. However, the COD removal efficiency of COD changed slightly and maintained at approximately 18%. In Stage II, the influent COD concentration still fluctuated, but the removal efficiency of COD increased to 27.3% and then stabilized at 18.0%. With the continuous fluctuation of COD concentration from influent, the content of VFAs in each compartment changed accordingly, and the removal efficiency of COD decreased to approximately 11.4% at the end of this stage. In Stage III, the COD concentration of each compartment was insignificantly improved with the further extension of HRT. Meanwhile, the COD removal efficiency gradually increased and finally stabilized at approximately 15.5%.
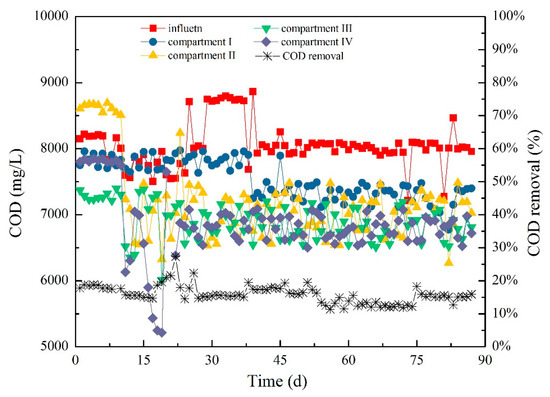
Figure 14.
Variation of COD in each compartment.
4. Discussion
4.1. Effect of Biomass on Biohydrogen Production Efficiency
When HRT was extended to 30 h, the biomass of each compartment firstly began to decrease, and that in Compartment IV decreased to less than 20% of the original biomass (Figure 2). At the same time, biogas and biohydrogen production rates showed a slow decline (Figure 4, Figure 5, Figure 6 and Figure 7), which indicated that the microorganisms with poor adaptability and low microbial activity in the reaction system were gradually discharged from the ABR. After further extension of HRT, the sludge bioactivity continued to decrease. In Compartment II, the total specific biogas production rate decreased from 285 to 191 L/(kg·MLVSS·d). However, the biogas production capacity in Compartment IV increased, while the sludge bioactivity in the three other compartments significantly decreased. The specific biogas and biohydrogen production rates of AnAS in Compartment I were 76 and 55 L/(kg·MLVSS·d), those in Compartment II were 81 and 73 L/(kg·MLVSS·d), and those in Compartment III were 53 and 41 L/(kg·MLVSS·d).
The microbial community structure in ABR was no longer suitable for the current operating conditions [6,17] when HRT was extended to 40 h; the possible reason could be due to the continuous loss of biomass. The biogas and biohydrogen production capacities of each compartment significantly decreased, with the total specific biogas production rate reduced to 92 L/(kg·MLVSS·d). The specific biohydrogen production rate of each compartment decreased by more than 30%. The specific biogas production rate of AnAS in Compartment I decreased to 29 L/(kg·MLVSS·d), and those in Compartments II, III, and IV were 43, 18, and 1.6 L/(kg MLVSS·d), respectively. In Compartment IV, the biogas production rate decreased the least; the reason was attributed to the further enrichment of methanogens (Figure 4, Figure 5, Figure 6 and Figure 7) in Stage II. The presence and metabolism of methanogens were conducive to the enrichment of HPA [2,6]. However, the biohydrogen production efficiency in Compartment IV was low due to the hydrogen consumption [23,24] and still showed a decreasing trend. At this time, the ABR operation performance was poor because the microbial community structure of AnAS tended to be stable along with the operation of ABR, and the metabolic speed became slow.
4.2. Enrichment of HPA and Biohydrogen Production Efficiency of ABR
The COD concentration reached 8000 mg/L and was stable for 10 days. The biogas production rate, biohydrogen, and methane content in Compartments III and IV remained at a low level. The enrichment effect of HPA was not obvious (Figure 4, Figure 5, Figure 6 and Figure 7). After HRT was extended to 30 h, the decrease in OLR reduced its effect on the system. As a result, the overall pH value of the system improved for biohydrogen production [25]. Figure 5 shows that, after HRT was extended to 30 h, the ethanol concentration in Compartment I and other formats continued to decrease. The concentration of acetic acid in Compartments III and IV decreased evidently, while the contents of methane and biohydrogen in biogas increased correspondingly. Therefore, the production rates of biohydrogen, acetic acid, and methane in the reaction system were gradually increasing, and the corresponding bacteria groups were gradually enriched [6]. The biohydrogen production efficiency of the system increased from 14.78 L/d in Stage I to 20.46 L/d (Figure 6 and Figure 7). After HRT was extended for 40 h, the ethanol and butyric acid contents in the first three compartments continued to decrease and led to a significantly high metabolic transformation effect [6,26]. However, the contents of ethanol and acetic acid still accounted for more than 60% of the total amount of VFAs, which was still manifested as an ethanol fermentation type, and the fermentation type in Compartment IV was maintained. Compared with the performance in Stage II (HRT 30 h), the contents of biohydrogen and methane in biogas of Compartment III were significantly increased. HPA gradually become prevalent because HPA microflora has a transitional role in anaerobic wastewater treatment [17,27]. For Compartment IV, the content of biohydrogen in biogas increased significantly in the previous stage and then decreased, while the content of methane significantly increased. Therefore, the methanogens in Compartment IV were further enriched and presented dominant position [2,6,14] although the biomass was relatively low. The presence and metabolism of methanogens were conducive to the enrichment of HPA. However, the biohydrogen production efficiency in Compartment IV was only 0.1 L/d due to the biohydrogen consumption (Figure 7).
5. Conclusions
The increase in influent COD led to the transformation of fermentation type and metabolism characteristics of AnAS. When influent COD increased to 8000 mg/L, methanogen residues were still observed in the last three compartments. The first three compartments showed the characteristics of an ethanol fermentation type, while the last compartment presented as a butyric acid fermentation type. The average removal efficiency of COD in ABR reduced to 15.4%, and the average biohydrogen production rate and biohydrogen production by COD removal capacity were 12.85 L/d and 360.22 L/kg COD, respectively. However, the specific biohydrogen production rate was 48 L/(kg MLVSS·d). Appropriately prolonging HRT was beneficial to the enrichment of hydrogen-producing acetogen and could improve the efficiency of biohydrogen production. When HRT was extended to 30 h, the biohydrogen production rate increased from 14.78 to 24.34 L/d. However, the bioactivity of acidogenic fermentation bacteria decreased, and the biohydrogen production efficiency of ABR drastically reduced when HRT increased to 40 h. The biogas production rate decreased to 92 L/(kg MLVSS·d), and the specific biohydrogen production rate finally decreased to 2.7 L/(kg MLVSS·d).
Author Contributions
Formulated the idea of the study and wrote the manuscript, F.J. and Z.P.; carried out the experiment and performed the analytical calculation, F.J. and H.L.; contributed the interpretation of the experimental results and revised the manuscript, J.L.; provided critical feedback and proposed the experiment in discussions, S.W. All authors have read and agreed to the published version of the manuscript.
Funding
This research was supported by the Major Science and Technology Program for Water Pollution Control and Treatment (2015ZX07306-001, 2017ZX07201-001).
Acknowledgments
Special thanks to Tay Joo Hwa for the contribution to this work; may you rest in peace. Additionally, the authors are grateful to the editors and anonymous reviewers for their constructive comments.
Conflicts of Interest
The authors declare no conflict of interest.
References
- Gokcek, O.B.; Sarioglu, M. Anaerobic treatment of the mixture of automotive industry and molasses wastewater for different organic loading rates in an upflow anaerobic sludge blanket (UASB) reactor. Desalin. Water Treat. 2018, 105, 83–91. [Google Scholar] [CrossRef]
- Wang, S.; Li, J.; Zheng, G.; Du, G.; Li, J. Bioaugmentation with Mixed Hydrogen-Producing Acetogen Cultures Enhances Methane Production in Molasses Wastewater Treatment. Archaea 2018, 2018, 4634898. [Google Scholar] [CrossRef] [PubMed]
- Dong, X.; Zhao, Y.; Li, T.; Huang, L.; Zhao, P.; Xu, J.; Ma, H.; Yu, X. Enhancement of lipid production and nutrient removal of Monoraphidium sp. FXY-10 by combined melatonin and molasses wastewater treatment. J. Taiwan Inst. Chem. Eng. 2019, 99, 123–131. [Google Scholar] [CrossRef]
- Ma, C.; Wen, H.; Xing, D.; Pei, X.; Zhu, J.; Ren, N.; Liu, B. Molasses wastewater treatment and lipid production at low temperature conditions by a microalgal mutant Scenedesmus sp Z-4. Biotechnol. Biofuels 2017, 10, 111. [Google Scholar] [CrossRef] [PubMed]
- Wang, J.; Yin, Y. Fermentative biohydrogen production using various biomass-based materials as feedstock. Renew. Sustain. Energy Rev. 2018, 92, 284–306. [Google Scholar] [CrossRef]
- Li, J.; Zheng, G.; He, J.; Chang, S.; Qin, Z. Biohydrogen-producing capability of anaerobic activated sludge in three types of fermentations in a continuous stirred-tank reactor. Biotechnol. Adv. 2009, 27, 573–577. [Google Scholar] [CrossRef]
- Kurokawa, T.; Tanisho, S. Effects of formate on fermentative biohydrogen production by enterobacter aerogenes. Mar. Biotechnol. 2005, 7, 112–118. [Google Scholar] [CrossRef]
- Tsioptsias, C.; Lionta, G.; Samaras, P. Microalgae-activated sludge treatment of molasses wastewater in sequencing batch photo-bioreactor. Environ. Technol. 2017, 38, 1120–1126. [Google Scholar] [CrossRef]
- Ren, N.; Li, J.; Li, B.; Wang, Y.; Liu, S. Biohydrogen production from molasses by anaerobic fermentation with a pilot-scale bioreactor system. Int. J. Hydrog. Energy 2006, 31, 2147–2157. [Google Scholar] [CrossRef]
- Grobicki, A.; Stuckey, D.C. Hydrodynamic characteristics of the anaerobic baffled reactor. Water Res. 1992, 26, 371–378. [Google Scholar] [CrossRef]
- Wei, W.; Zhang, Y.; Huang, Q.; Ni, B. Polyethylene terephthalate microplastics affect hydrogen production from alkaline anaerobic fermentation of waste activated sludge through altering viability and activity of anaerobic microorganisms. Water Res. 2019, 163, 114881. [Google Scholar] [CrossRef] [PubMed]
- Zhu, G.; Li, J.; Liu, C. Fermentative Hydrogen Production from Soybean Protein Processing Wastewater in an Anaerobic Baffled Reactor (ABR) Using Anaerobic Mixed Consortia. Appl. Biochem. Biotechnol. 2012, 168, 91–105. [Google Scholar] [CrossRef] [PubMed]
- Mahdieh, S.; Mahmood, S.K.; Reza, R.M.; Babak, G.; Hossein, S.K. Preparation and characterization of cellulose nanocrystals from bacterial cellulose produced in sugar beet molasses and cheese whey media. Int. J. Biol. Macromol. 2019, 122, 280–288. [Google Scholar]
- Zou, R.; Zhu, G.; Kumar, J.A.; Liu, C.; Huang, X.; Liu, L. Hydrogen and methane production in a bio-electrochemical system assisted anaerobic baffled reactor. Int. J. Hydrog. Energy 2014, 39, 13498–13504. [Google Scholar]
- Li, J.; Li, B.; Zhu, G.; Ren, N.; Bo, L.; He, J. Hydrogen production from diluted molasses by anaerobic hydrogen producing bacteria in an anaerobic baffled reactor (ABR). Int. J. Hydrog. Energy 2007, 32, 3274–3283. [Google Scholar] [CrossRef]
- Li, S.; Nan, J.; Gao, F. Hydraulic characteristics and performance modeling of a modified anaerobic baffled reactor (MABR). Chem. Eng. J. 2016, 284, 85–92. [Google Scholar] [CrossRef]
- Zheng, G.; Li, J.; Zhao, F.; Zhang, L.; Wei, L.; Ban, Q.; Zhao, Y. Effect of illumination on the hydrogen-production capability of anaerobic activated sludge. Front. Environ. Sci. Eng. 2012, 6, 125–130. [Google Scholar] [CrossRef]
- Pan, J.; Ma, J.; Zhai, L.; Luo, T.; Mei, Z.; Liu, H. Achievements of biochar application for enhanced anaerobic digestion: A review. Bioresour. Technol. 2019, 292, 122058. [Google Scholar] [CrossRef]
- Vasily, A.V.; Sergey, V.R.; Ljudmila, Y.L.; Jukka, A.R.; Gerasimos, L. Simplified hydrolysis models for the optimal design of two-stage anaerobic digestion. Water Res. 2001, 35, 4247–4251. [Google Scholar]
- Noblecourt, A.; Christophe, G.; Larroche, C.; Fontanille, P. Biohydrogen production by dark fermentation from pre-fermented depackaging food wastes. Bioresour. Technol. 2018, 247, 864–870. [Google Scholar] [CrossRef]
- APHA. Standard Methods for the Examination of Water and Wastewater, 20th ed.; American Public Health Association: Washington, DC, USA, 1998. [Google Scholar]
- Liu, C.; Li, J.; Wang, S.; Nies, L. A syntrophic propionate-oxidizing microflora and its bioaugmentation on anaerobic wastewater treatment for enhancing methane production and COD removal. Front. Environ. Sci. Eng. 2016, 10, 13. [Google Scholar] [CrossRef]
- Öztürk, M. Conversion of acetate, propionate and butyrate to methane under thermophilic conditions in batch reactors. Water Res. 1991, 25, 1509–1513. [Google Scholar] [CrossRef]
- Nielsen, H.B.; Uellendahl, H.; Ahring, B.K. Regulation and optimization of the biogas process: Propionate as a key parameter. Biomass Bioenergy 2007, 31, 820–830. [Google Scholar] [CrossRef]
- Barredo, M.S.; Evison, L.M. Effect of propionate toxicity on methanogen-enriched sludge, methanobrevibacter-smithii, and methanosprillum-hungatii at different pH values. Appl. Environ. Microbiol. 1991, 57, 1764–1769. [Google Scholar] [CrossRef] [PubMed]
- Chaucheyras, F.; Fonty, G.; Bertin, G.; Gouet, P. In-vitro H2 Utilization by a ruminal acetogenic bacterium cultivated alone or in association with an archaea methanogen is stimulated by a probiotic strain of saccharomyces-cerevisiae. Appl. Environ. Microbiol. 1995, 61, 3466–3467. [Google Scholar] [CrossRef]
- Rajhi, H.; Puyol, D.; Martinez, M.C.; Diaz, E.E.; Sanz, J.L. Vacuum promotes metabolic shifts and increases biogenic hydrogen production in dark fermentation systems. Front. Environ. Sci. Eng. 2016, 10, 513–521. [Google Scholar] [CrossRef]


© 2020 by the authors. Licensee MDPI, Basel, Switzerland. This article is an open access article distributed under the terms and conditions of the Creative Commons Attribution (CC BY) license (http://creativecommons.org/licenses/by/4.0/).