1. Introduction
The ongoing sustainable development of the constantly growing worldwide population will not be possible if the existing water treatment issues are not addressed. Furthermore, water resources require treatment to remove hazardous pollutants before they can be reused, but technical progress in this regard has been relatively limited. The use of natural oxidation, such as artificial aeration [
1] or pulse corona discharge [
2], to neutralize the water pollutants of complex organic and inorganic origin, represents an optimal solution. During the oxidation process, harmful complex-structure pollutants are converted into prime elements that are non-hazardous.
Dissolved air flotation (DAF) processes have been developed over the past few decades and have been found to represent feasible technical solutions for the removal of contaminants from water [
3]. Conceptually, DAF processes use solution aeration to remove contaminants such as ions, liquid effluent or solid particles [
4,
5,
6], or fast oxygenation to chemically disintegrate hazardous compounds [
3,
7]. Hence, DAF can be used in various applications, including mining, mineral processing, metallurgy, and tailing water processing. Municipal and agricultural waste treatment can also benefit from the technology because DAF is relatively cheap and simple to operate [
8].
The formation of bubbles of a certain size is crucial within DAF applications. For example, in fine mineral flotation, an efficient bubble size distribution (BSD) favours the presence of coarser bubbles (100–600 μm) in addition to microbubbles [
4,
9,
10]. The bubbles can be formed as the result of gas suction under the influence of reduced water pressure. The reduced pressure is organized via the Venturi pipe principle of a sudden reduction in cross-section area. However, the Venturi pipe incorporates a significant pressure drop, which reduces the energy of the pumped water stream [
11]. In a recent study of a Venturi microbubble generator, Huang et al. mentioned the low void fraction (below 0.1), the bubble fast deceleration in the diffusor and the high-pressure losses among the limitations for the studied bubble generator [
12]. Liquid phase turbulence enhances particle–bubble collision efficiency, while optimal turbulent eddies keep particles attached to bubbles. Both phenomena benefit flotation rate of fine and intermediate particles [
13]. The oppressed turbulence is undesirable when gas–liquid mass transfer enhancement is the target because the turbulence promotes microscale mixing and bubbles breakage, increasing the gas–liquid contact area [
14]. Moreover, the reduced energy of a flow can potentially be used as a transporting force in flotation tanks.
The drawbacks of the conventional sparging system in DAF units were tackled within the development of Outotec (Filters) Oy, which resulted in the design of a gas sparging system that produced a wider range of bubbles and diminished the pressure drop caused by the solid structure of the sparger.
The applications of the gas–liquid ejectors is not limited to the production of bubbles of a size crucial to DAF processes but has high potential in flue gas purification, organized in bioreactors where the transport of the volatile organic compounds into liquid media is important [
15]. The high gas adsorption capability of hydro ejector is also demanded in novel wastewater treatment concepts using an advanced oxidation process such as that proved by Biard et al. (2007) [
16].
The aim of the current work was to experimentally study the self-aerated gas sparger mounted in a lab-scale, closed-loop reactor (CLR). The effect of the aerator on the liquid phase flow hydrodynamics was considered. The sparger was designed by Outotec (Finland) Oy, and unfortunately, the detailed structure of the sparger is not shown for commercial reasons. The aeration capacity and bubble sizing in the aerated flow stream were measured using a high-speed camera. The oxygenation efficiency of the studied system was compared to that of the available gas–liquid contactors at lab scale. The proposed system offered basic insights into the performance of the sparger; however, it can be readily scaled to industrial size through the incorporation of more nozzles.
2. Materials and Methods
2.1. The DAF Sparger Design
Several geometrical modifications of classical Venturi tube were proposed in the literature. Opletal et al. measured and correlated the gas entrainment and gas–liquid mass transfer rates in the up-flow ejector loop reactors to various gas–liquid ejector geometries and operational conditions [
17]. The turbulence energy of the axial flow after the pressure drop, caused by the ejector diameter reduction, is mainly used in gas–liquid dispersion. Enlargement in the contraction angle of the diffuser promotes production rate as the result of the gas entrainment. The entrainment is organized by the turbulent jet pushing the gas bubbles into the side pockets. Varying major dimensional parameters Jensen et al. estimated the performance of the modified Venturi tube in regards to air-water mass transfer in silico and experimentally in a CLR [
18]. They concluded that the venture pipe can efficiently produce small bubbles below a certain gas-to-liquid flow rates ratio. Wang et al. proposed several air inlets mounted tangentially to produce swirling two-phase flow and enable more break-up mechanisms under higher gas–liquid ratios [
19]. Nevertheless, the typical Venturi tubes with minor modifications experience a high pressure drop and the effective gas aspiration rate is rather limited.
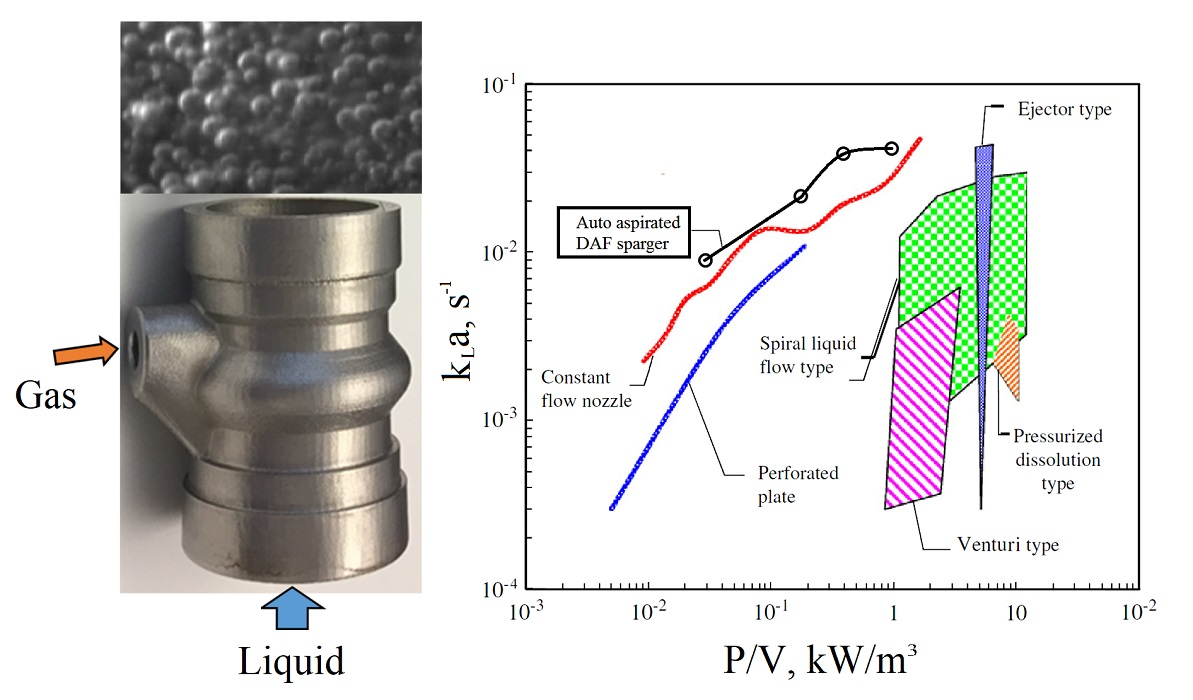
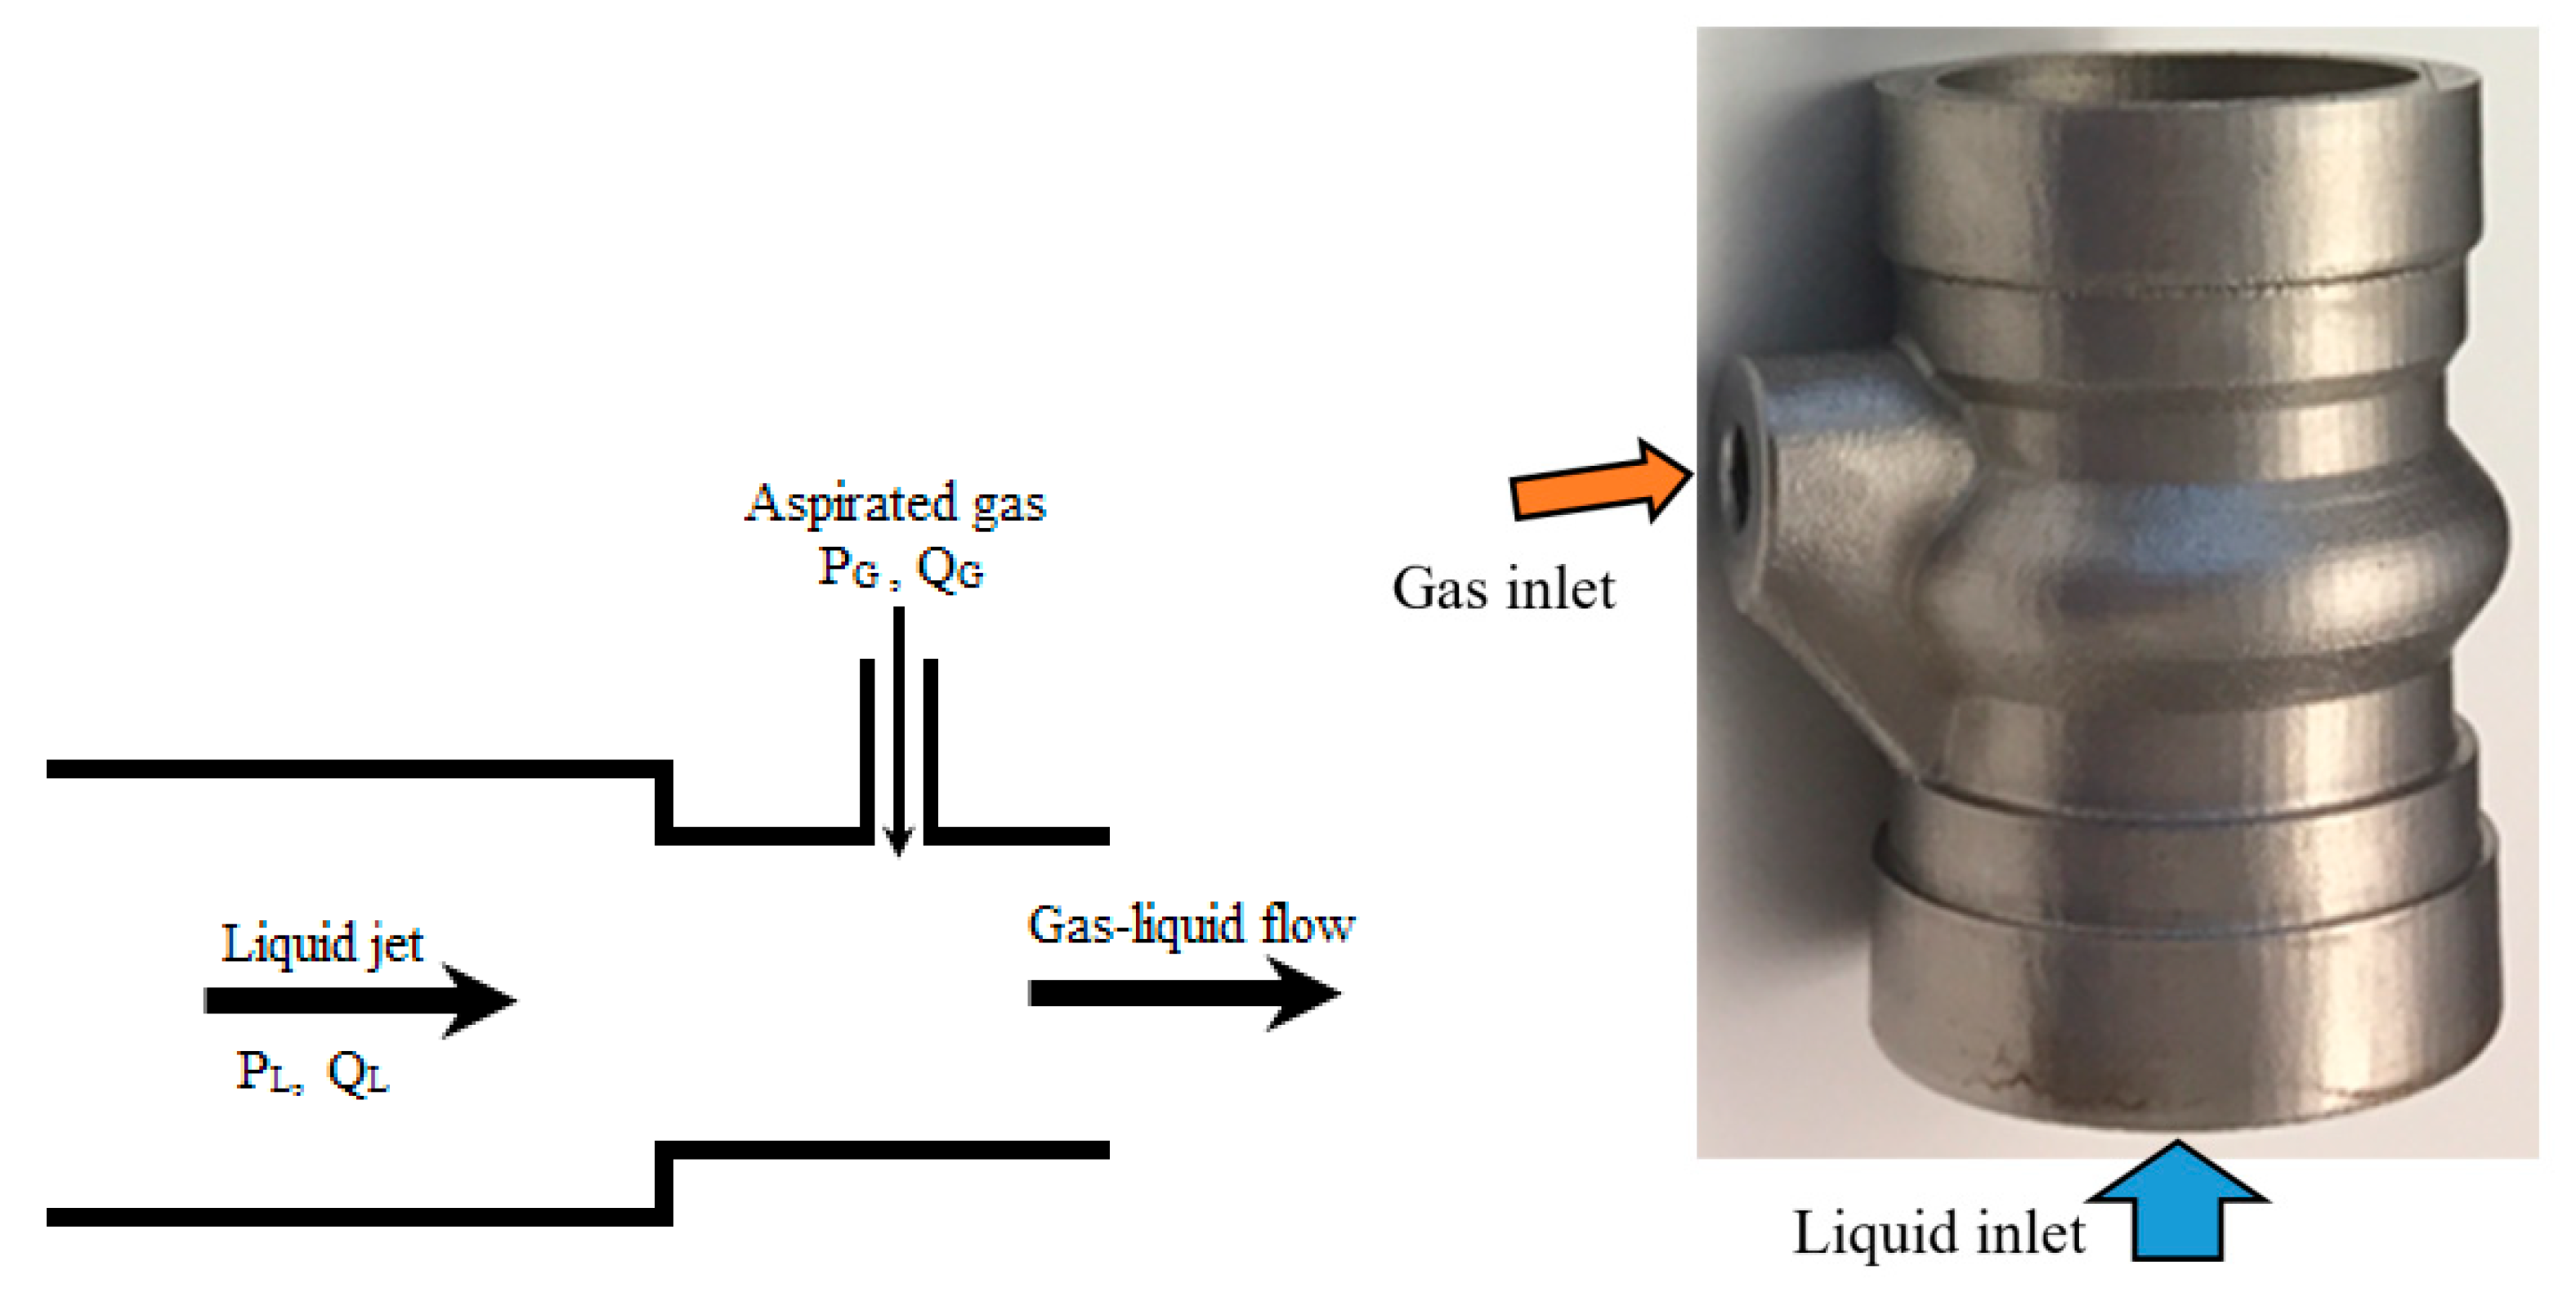
Computer-aided design, computational fluid dynamics (CFD) simulation, and 3D printing allow ideas to be developed and explored in ways that were not previously possible. The current study aimed to develop an efficient gas–liquid ejector, based on Venturi pipe principle (
Figure 1, left), for DAF units that produced macro- and microbubbles that were evenly distributed in the space of the liquid flow to prevent the coalescence of bubbles. Hence, the performance of the DAF sparger, which consisted of perforated channels that were placed regularly in the mouth of the cross-section of the ejector, was modelled numerically, and the aerator was then printed in stainless steel.
Figure 1 (right) presents an annotated image of the DAF sparger that highlights the water and air inlets. Initially, CFD simulations were used to assess the effect the sparger design had on the resulting multiphase flow characteristics and BSD. The number, shape, and size of the channels, the diameter of the openings, and the spatial distribution were examined using modelling tools to identify the optimal geometrical parameters of the sparger.
The air supply was organized through a network of perforated channels. The overall network frame of the channels was oriented along the fluid flow. The flow through the solid structure was expected to be regular in space without strong circulation that could trap bubbles.
The sparger created by 3D printing had a surface roughness. As such, it was important to experimentally verify how this roughness, in combination with the properties of the materials, affected the performance of the system.
2.2. Closed-Loop Reactor
The sparger tests were conducted in a closed-loop reactor at lab scale. The CLR used in the current study was comparable to that used by Dumont and Héquet [
21] and Jensen et al. [
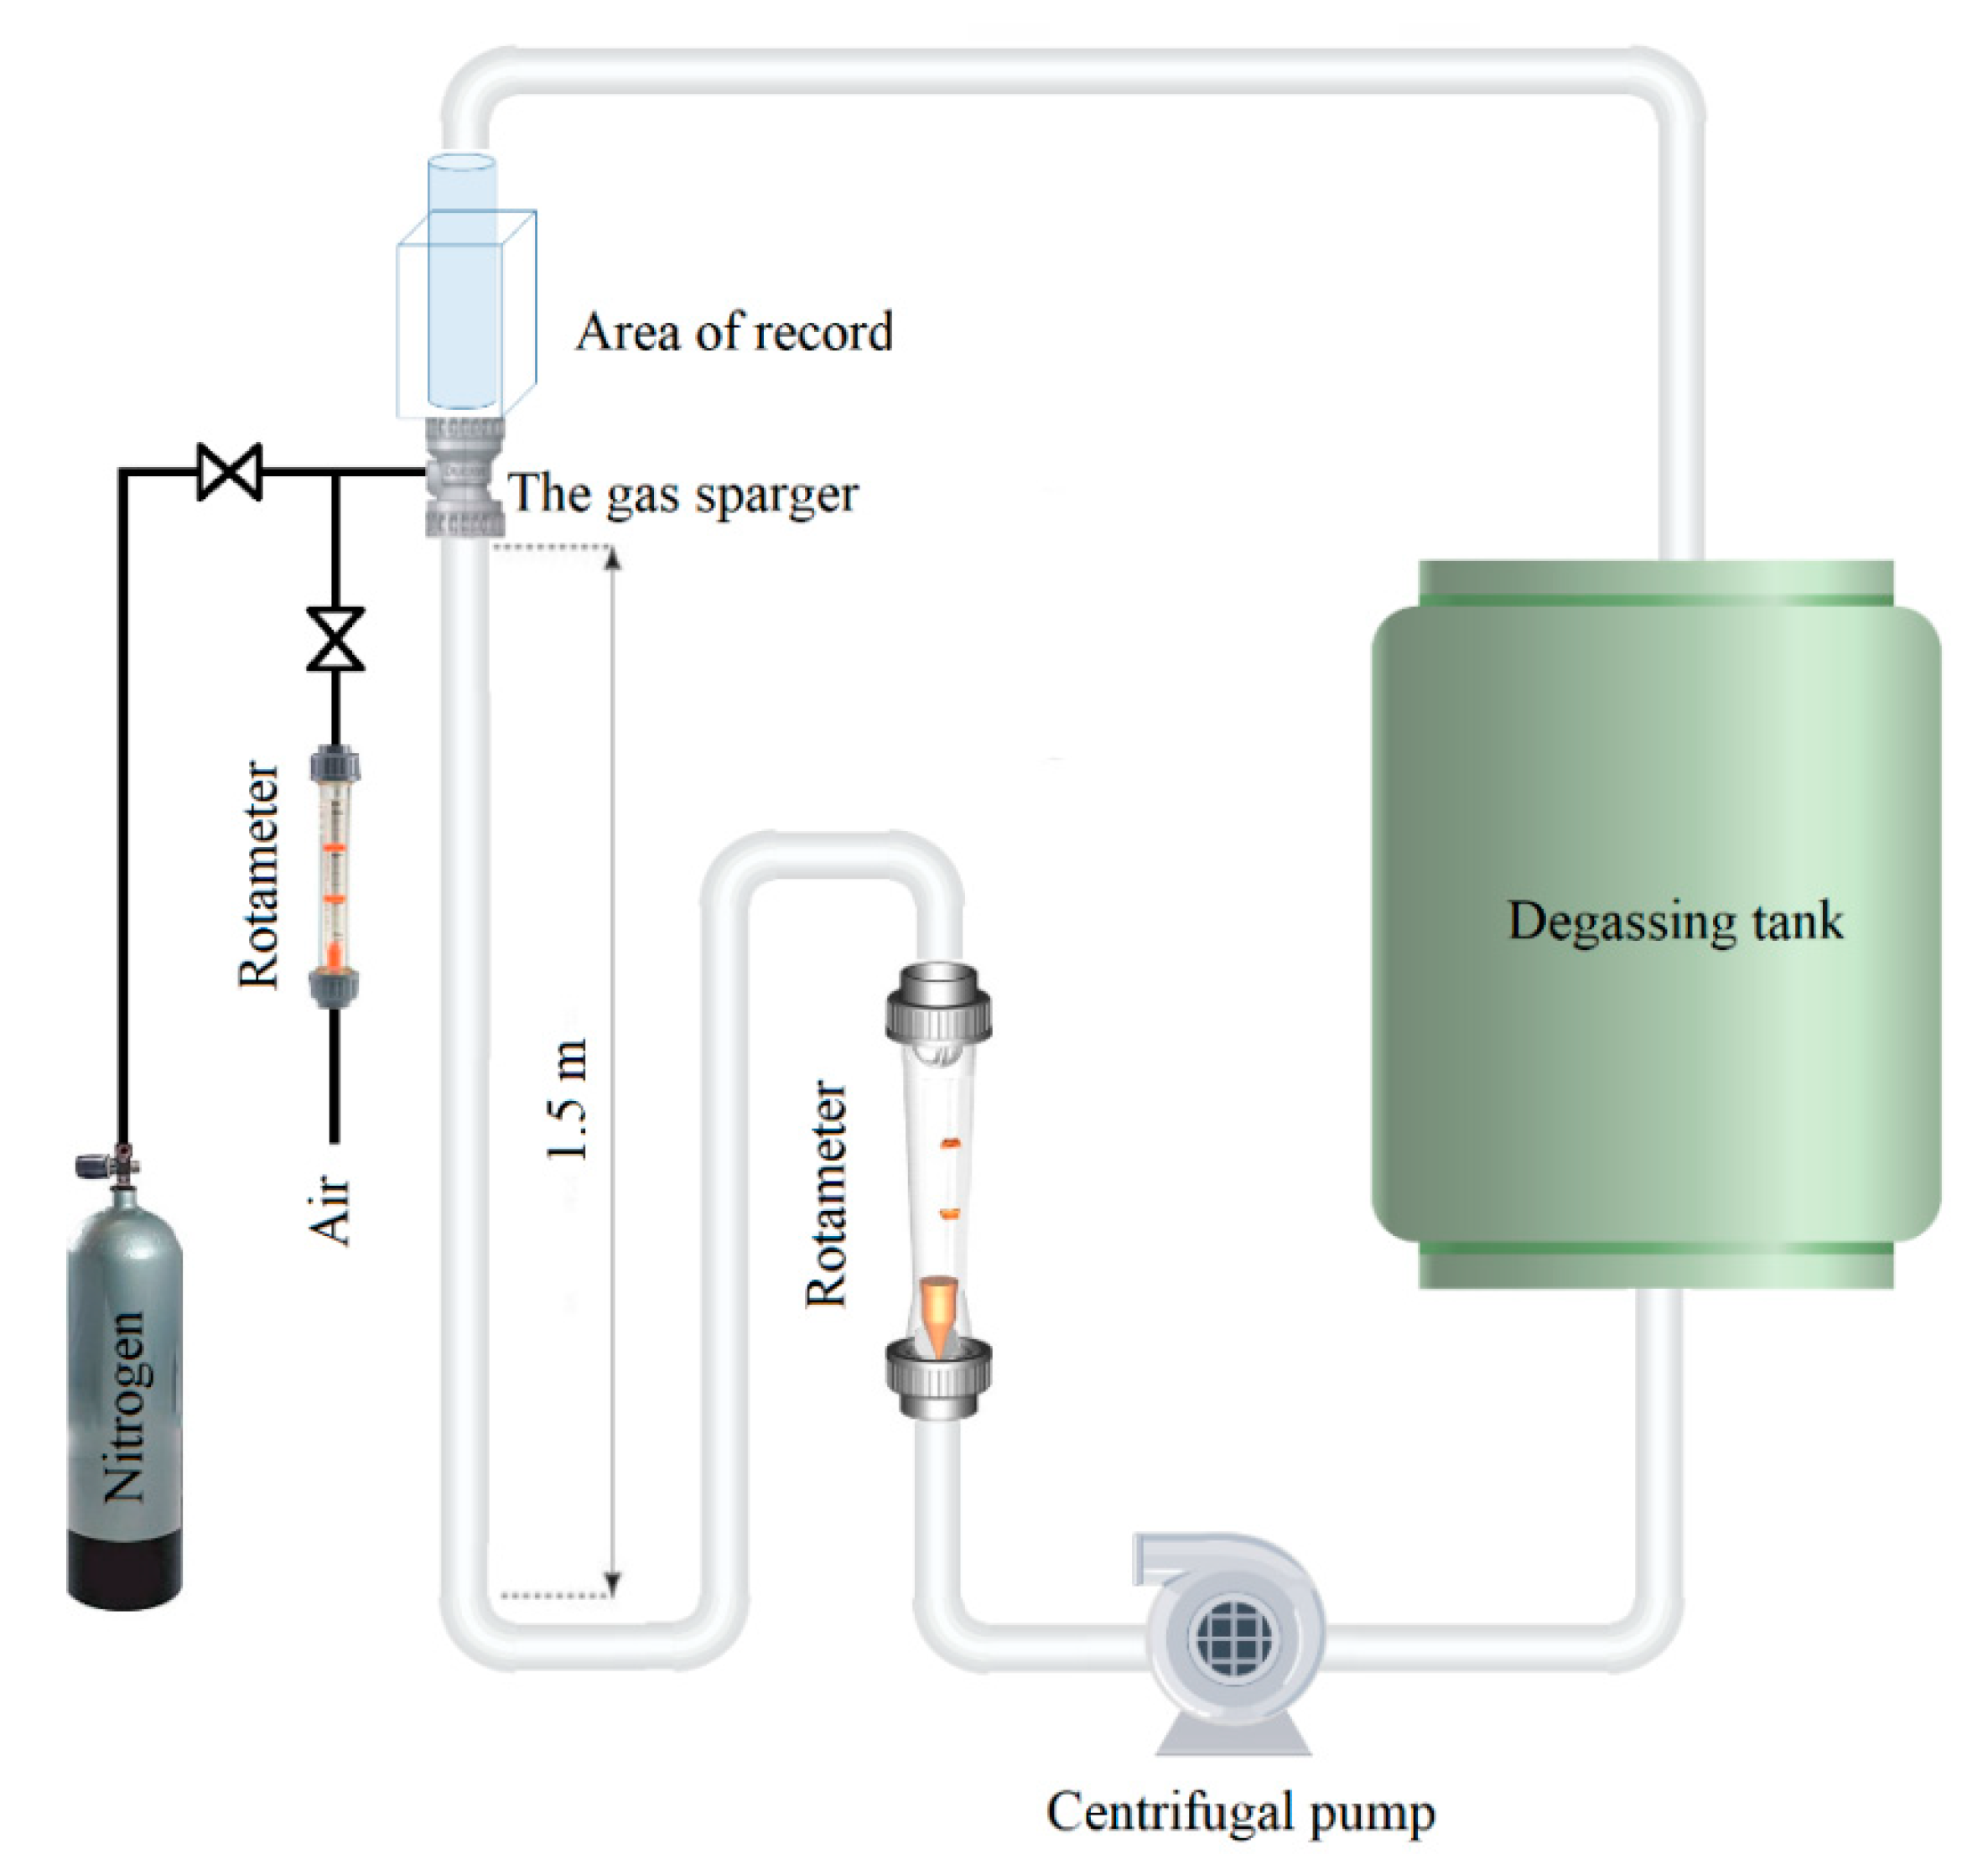
18], and is schematically presented in
Figure 2. A centrifugal turbine pumped a solution from an open storage tank, also used as a degassing unit, through a pipeline with a mounted flow rotameter in a closed-loop system. A straight part of the pipeline, 1.5 m in length and 0.05 m in diameter, was mounted vertically to promote fully developed turbulent flow before the sparger. The part of the pipe after the sparger was placed in a perplex container that was filled with water. This made it possible to visually study the aerated flow without the optical distortions caused by the circumferential surface of the pipe. A separate gas supply system was established for the volumetric mass transfer measurements. The gas pipeline was equipped with valves and an air rotameter to control the gas supply. The total volume of the solution was 0.1 m
3. The pump speed was adjusted via a frequency converter. The pipeline was also equipped with pressure gauges to monitor the pressure drop.
The aeration provided by the sparger was studied in the range of 0.2–2.8 m/s of the water flow rate. The gas pipe was left open to allow air to be sucked by the stream-induced low pressure. A rotameter was installed in the gas pipeline to monitor the self-aeration rate. The pressure drop measured using an in-line pressure gauge was used to find power consumption of the pump.
The aeration feasibility of the system was compared with the available gas–liquid contactors of a similar scale that have been studied previously in our lab; namely, a flat-bottomed stirred tank reactor [
22], air-lift reactor [
23], and the draft-tube stirred tank reactor [
24]. More details are available in the stipulated references. The total power consumption of the CLR was calculated using Equation (1), while the energy demand for the competitive apparatuses included both air supply (Equation (2)) and or mixing power (Equation (3)), in the case of pressurized gas supply
where
is the volumetric flow rate, m
3/h,
is the pressure difference, Pa,
is the gas density, kg/m
3,
is the superficial gas velocity, m/s,
is the mixing speed, s
−1, and
is the measured torque, N·m.
2.3. Particle Image Velocimetry
The anticipated size range of the bubbles produced by the system under investigation was 0.01–3 mm. Based on the studied operational conditions, the Stokes number (
) varied between 0.002 and 0.13, which indicated that the gas bubbles were following along the flow [
25]. Thus, the bubbles shared the changes in water flow hydrodynamics perturbations caused by the solid structure of the sparger. Particle image velocimetry (PIV) was used to analyse the effect of the geometry of the sparger on the flow. This technique measures velocity flow fields by capturing the movement of the tracing particles that are small enough to follow the flow. By slicing the flow with a laser sheet, PIV can produce a two-dimensional picture of the fluid motion within the illuminated space. Vector velocity fields are then reconstructed based on the linear shifts (
) of tracer-particles moving in the two-dimensional plane illuminated by laser pulses. The laser shoots pulses in pairs at a pre-set, short time interval (
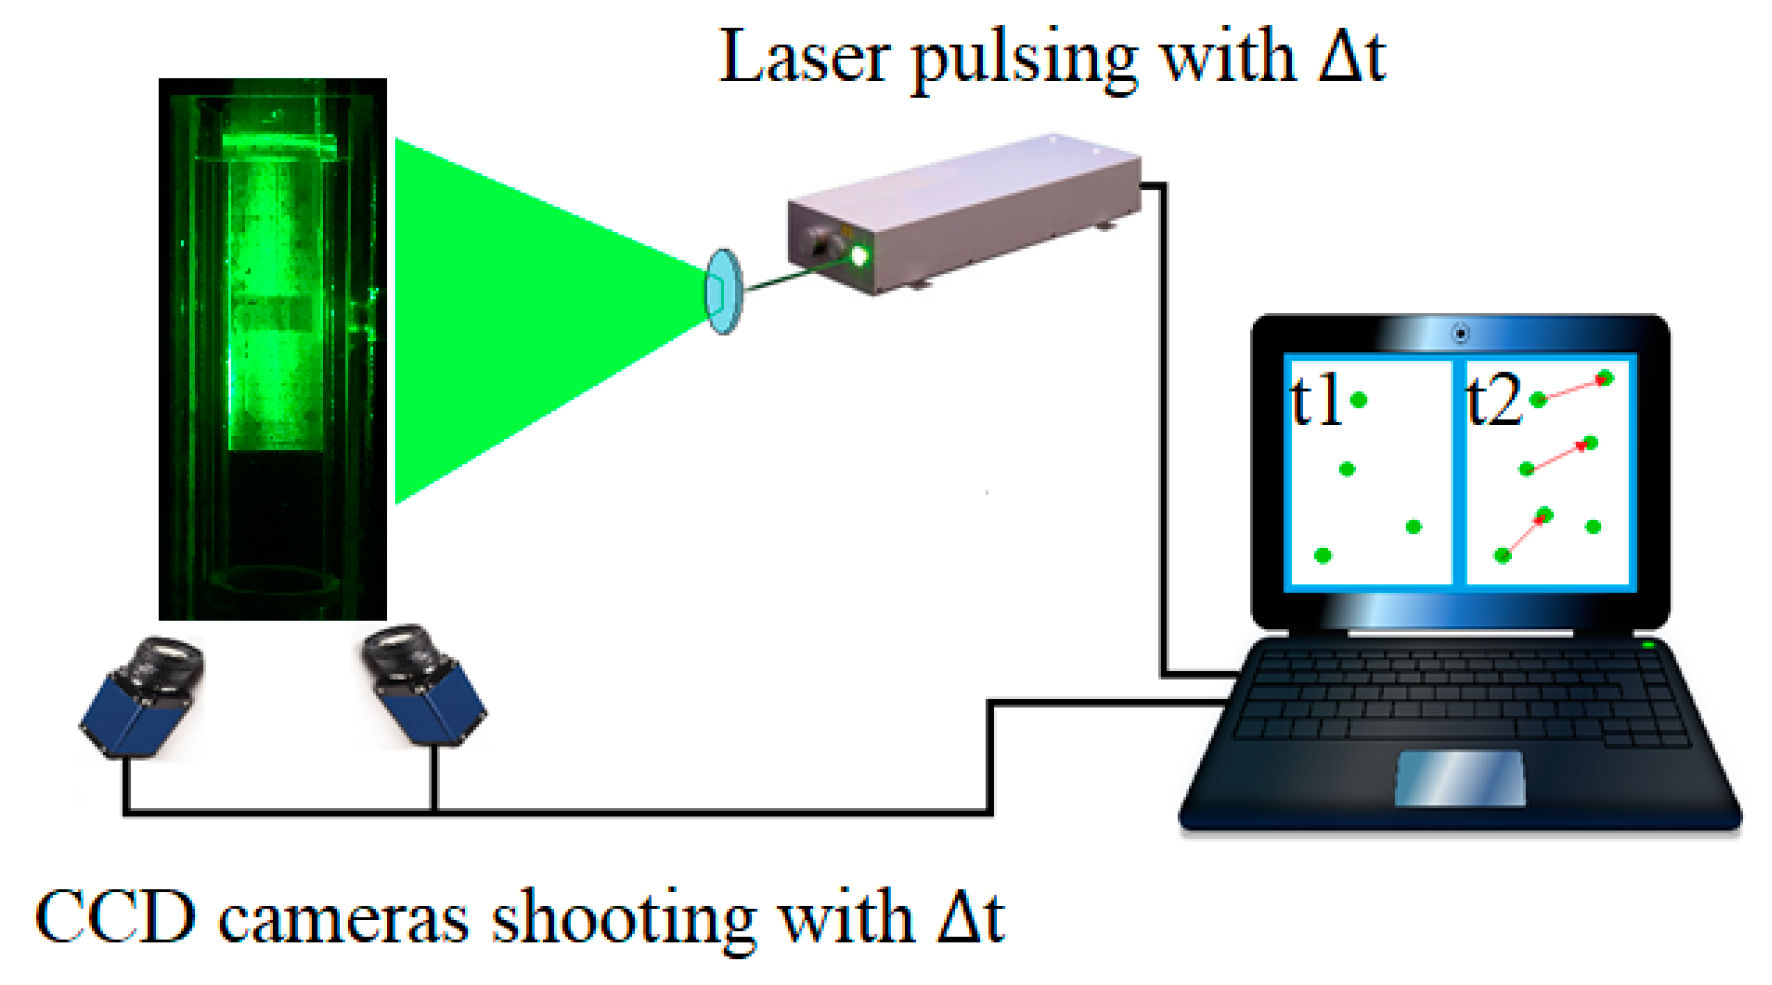
) between the pulses (Equation (4)). The time interval between pairs is much bigger, but it does not affect the results in this study as the flow is continuous. The tracer shift imaging was carried out by two charged-coupled device (CCD) cameras synchronized with laser pulsing. Thus, the velocity vector fields of the axial and radial components were measured in 2D plane. During the calibration procedure, a calibration plate was used with a known distance between the marks. The detention time between the pulses was set separately for each flow rate to maintain a particle shift of around eight pixels. The PIV set-up, including a double-pulsed Nd:Yag laser and two CCD cameras with a resolution of 1600 × 1200 pixels, is schematically presented in
Figure 3. The laser and the cameras were controlled by Davis 7.2 PIV software [
26].
To measure the liquid phase flow, borosilicate glass hollow spheres of 100 μm were used as tracers. Backside of the prism box was covered with a black mate paper to remove the reflections from the background. Grey filters were mounted on the CCD cameras to protect the cameras’ matrixes from strong light [
27]. The velocity of a tracer shift (
) can be found as
where
is the tracers’ shift, m,
is the time, s.
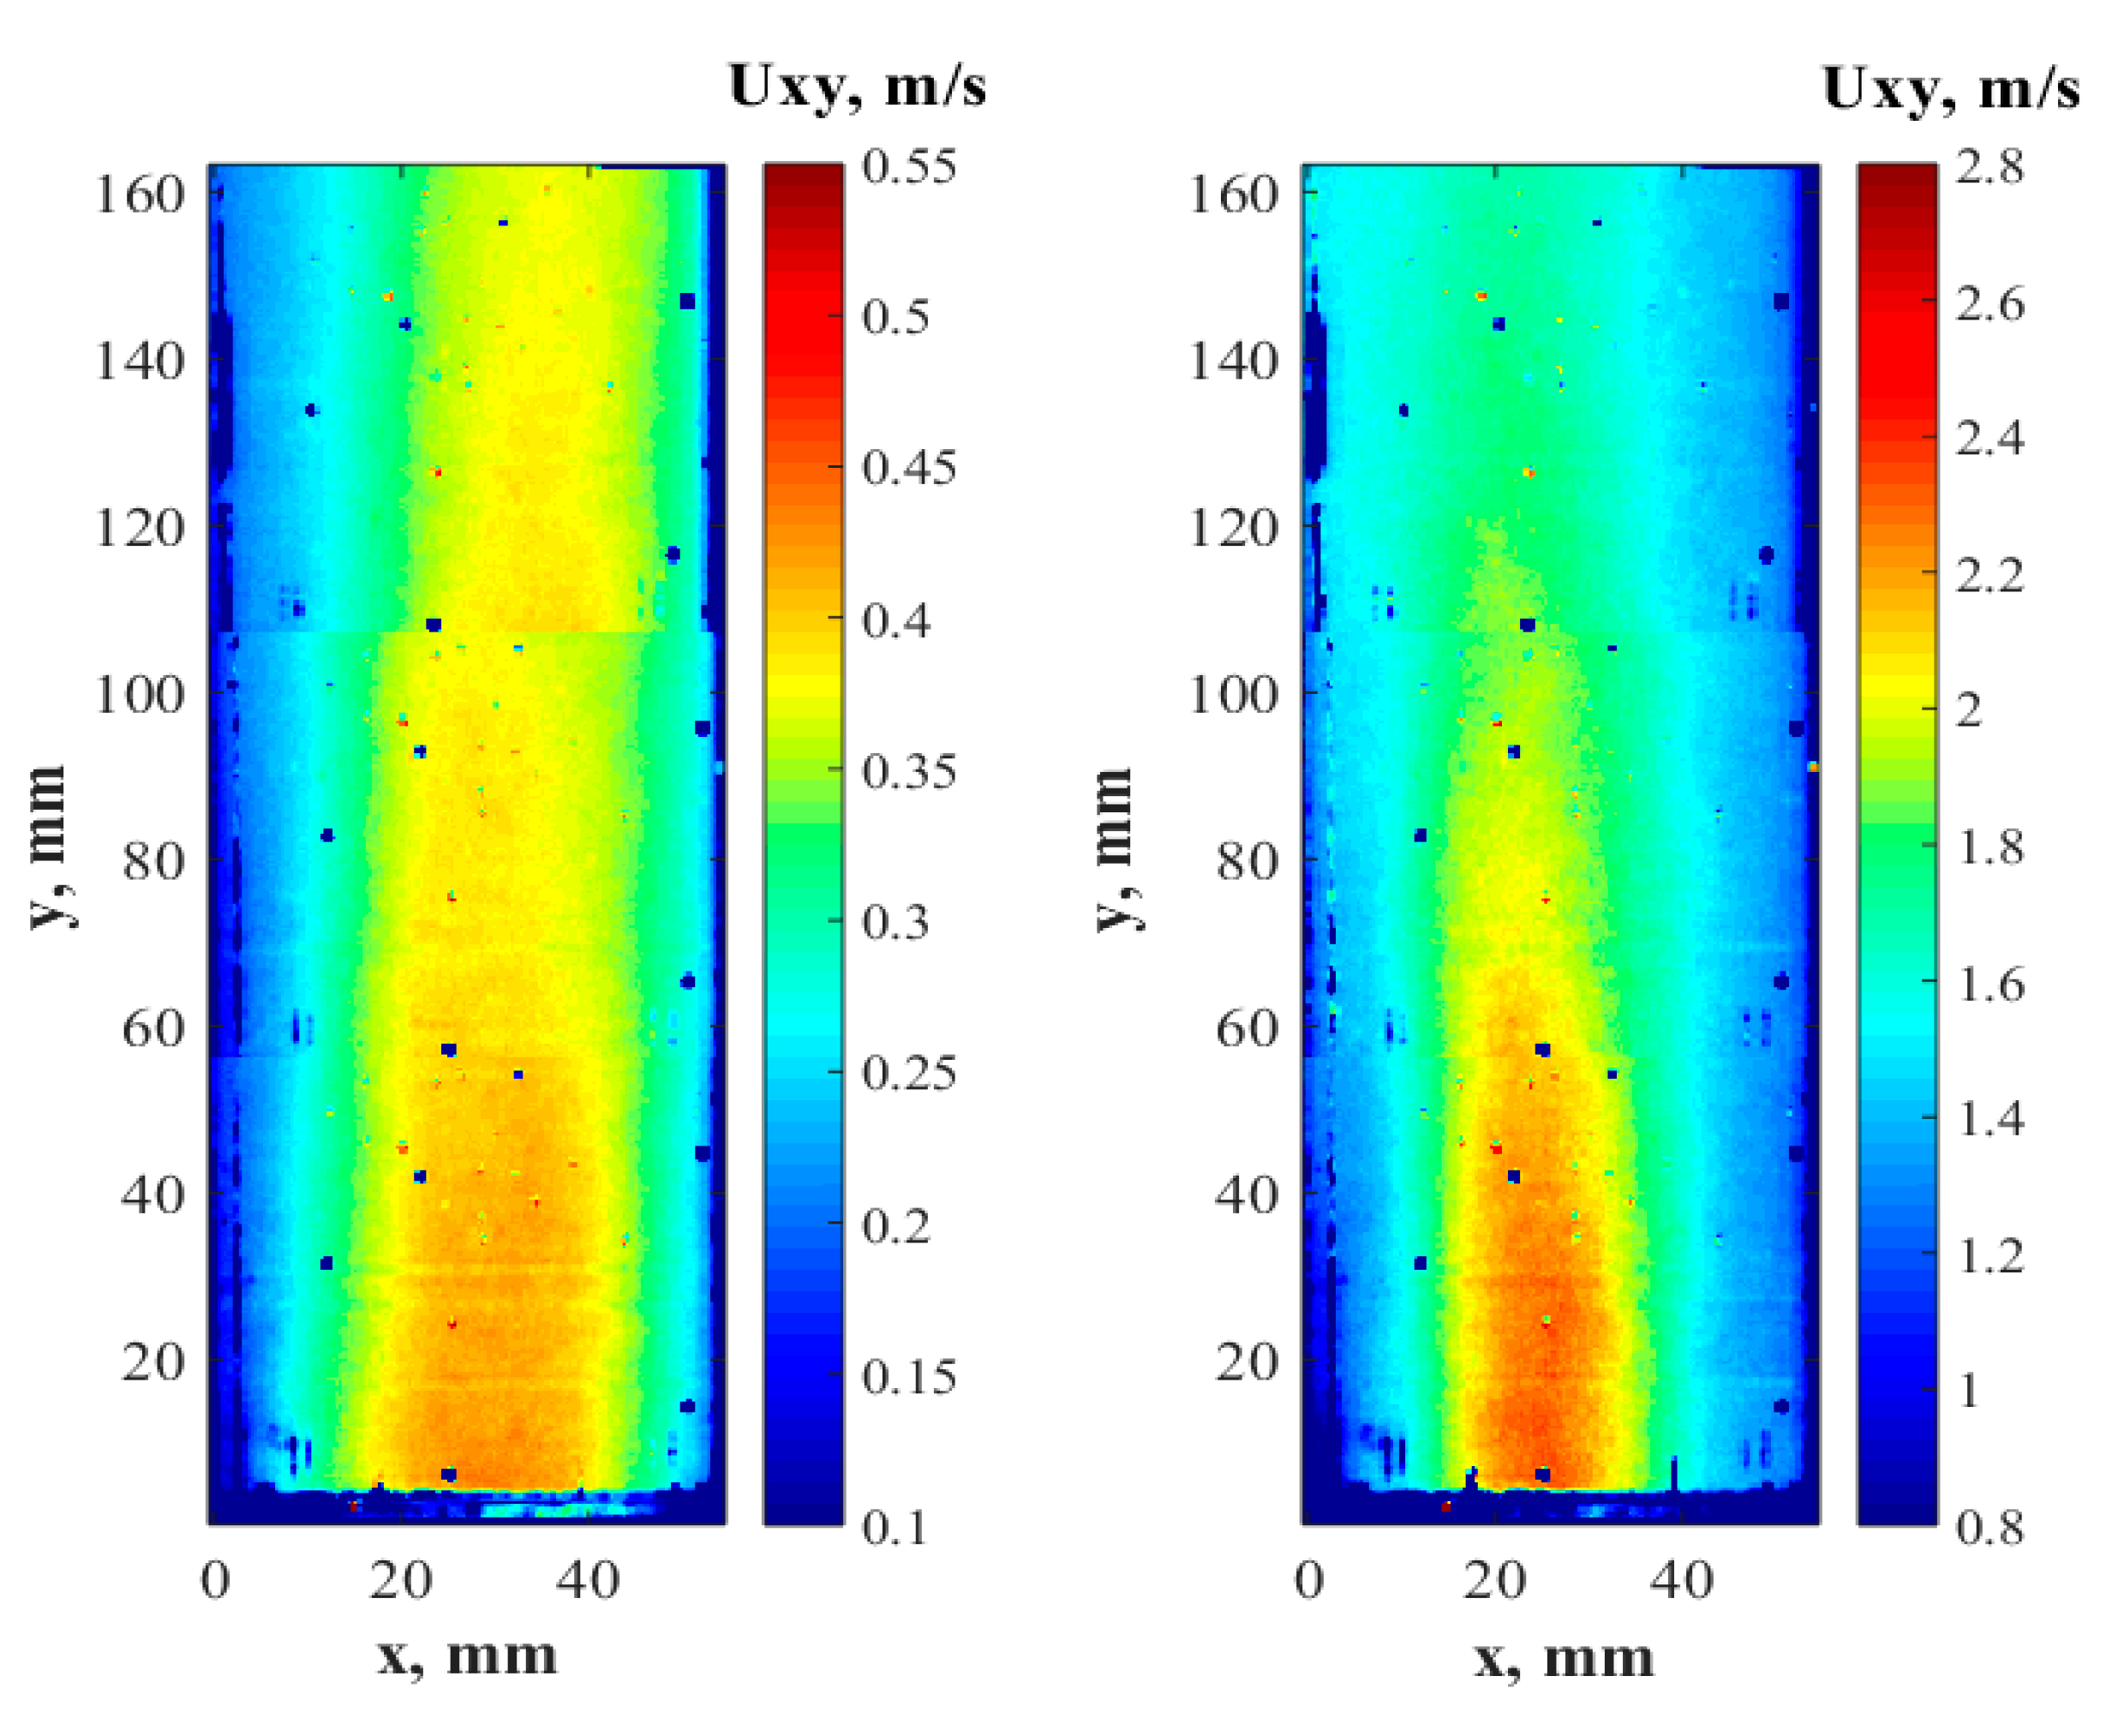
The laser sheet was positioned vertically in the middle of the flow because the construction geometry of the DAF sparger has reflectional symmetry. The size of the single frame taken (measurement window) depended on the camera resolution, distance of the camera from the laser sheet, and focal length of the objective. The typical size of the measurement frame was 60 × 60 mm. The acquired frames were processed in the PIV software twice via a cross-correlation algorithm. A multi-pass algorithm was applied in combination with a decreasing interrogation window resolution with 50% overlap. Hence, the PIV software split the frame area into interrogation areas of 128 × 128 pixels to search the vectors. The interrogation area was then decreased to 16 × 16 pixels, and the frame was treated once more to facilitate the search for the shift in tracer particles more precisely. The camera resolution, the size of the interrogation area, and the physical size of the measurement window gave a resolution of 0.41 mm for the PIV results. Three frames at different heights along the vertical axis with a 10 mm overlap were recorded at each flow rate. The cameras, calibrated with the laser plane, were fixed in a metal frame that was mounted on a translational station that was digitally controlled. Thus, when the captured frames were assembled, a full image of the stream in the pipe of 55 × 160 mm was obtained (
Figure 4). The post-processed resolution of the vertically combined frames was 135 × 400 vectors.
The statistical convergence test for the computed mean velocity contour was performed using different number of the recorded frames. The averaging procedure was carried out over 100, 300, 500, 800, and 1000 frames. The deviation of the results was assessed via the root mean square error (RMSE) normalized with the maximum speed. Using more than 300 frames resulted in an insignificant improvement that was under 1% of the RMSE. Therefore, 300 frames were used to obtain time-averaged results.
Turbulence has an impact on the way bubbles move in liquid solution because the bubbles trapped in turbulent vortexes are more likely to coalesce, decreasing the interphase contact area [
28]. Therefore, there was a need to study the effect of the solid structures in the sparger on the passing liquid. Turbulence can be characterized by turbulence kinetic energy (
). The liquid velocity of the studied flow was measured in 2D plane, hence the
can be estimated from the measurements using a pseudo isotropic approximation (Equation (5)) made by the PIV [
29]
where
is the instantaneous velocity, m/s,
is the radial direction,
is the axial direction.
2.4. High Speed Camera Imaging
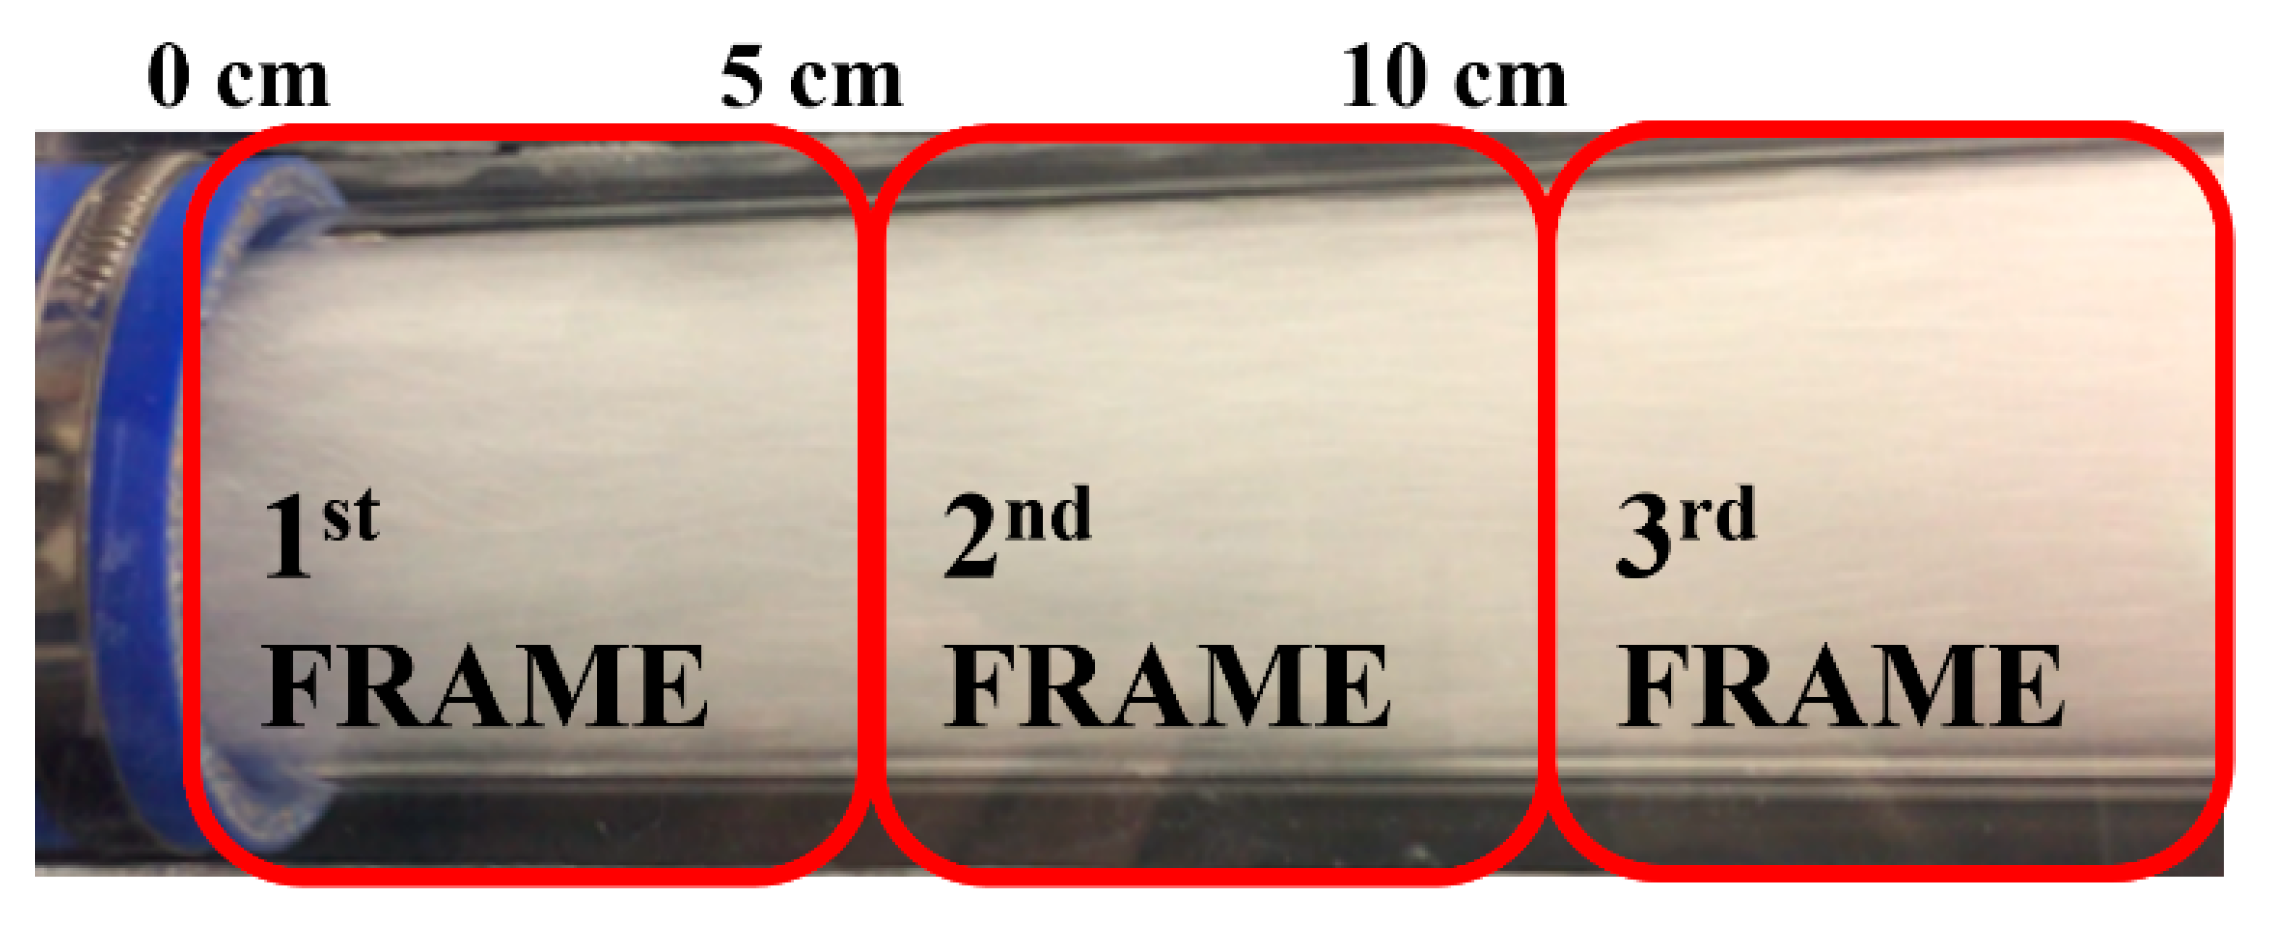
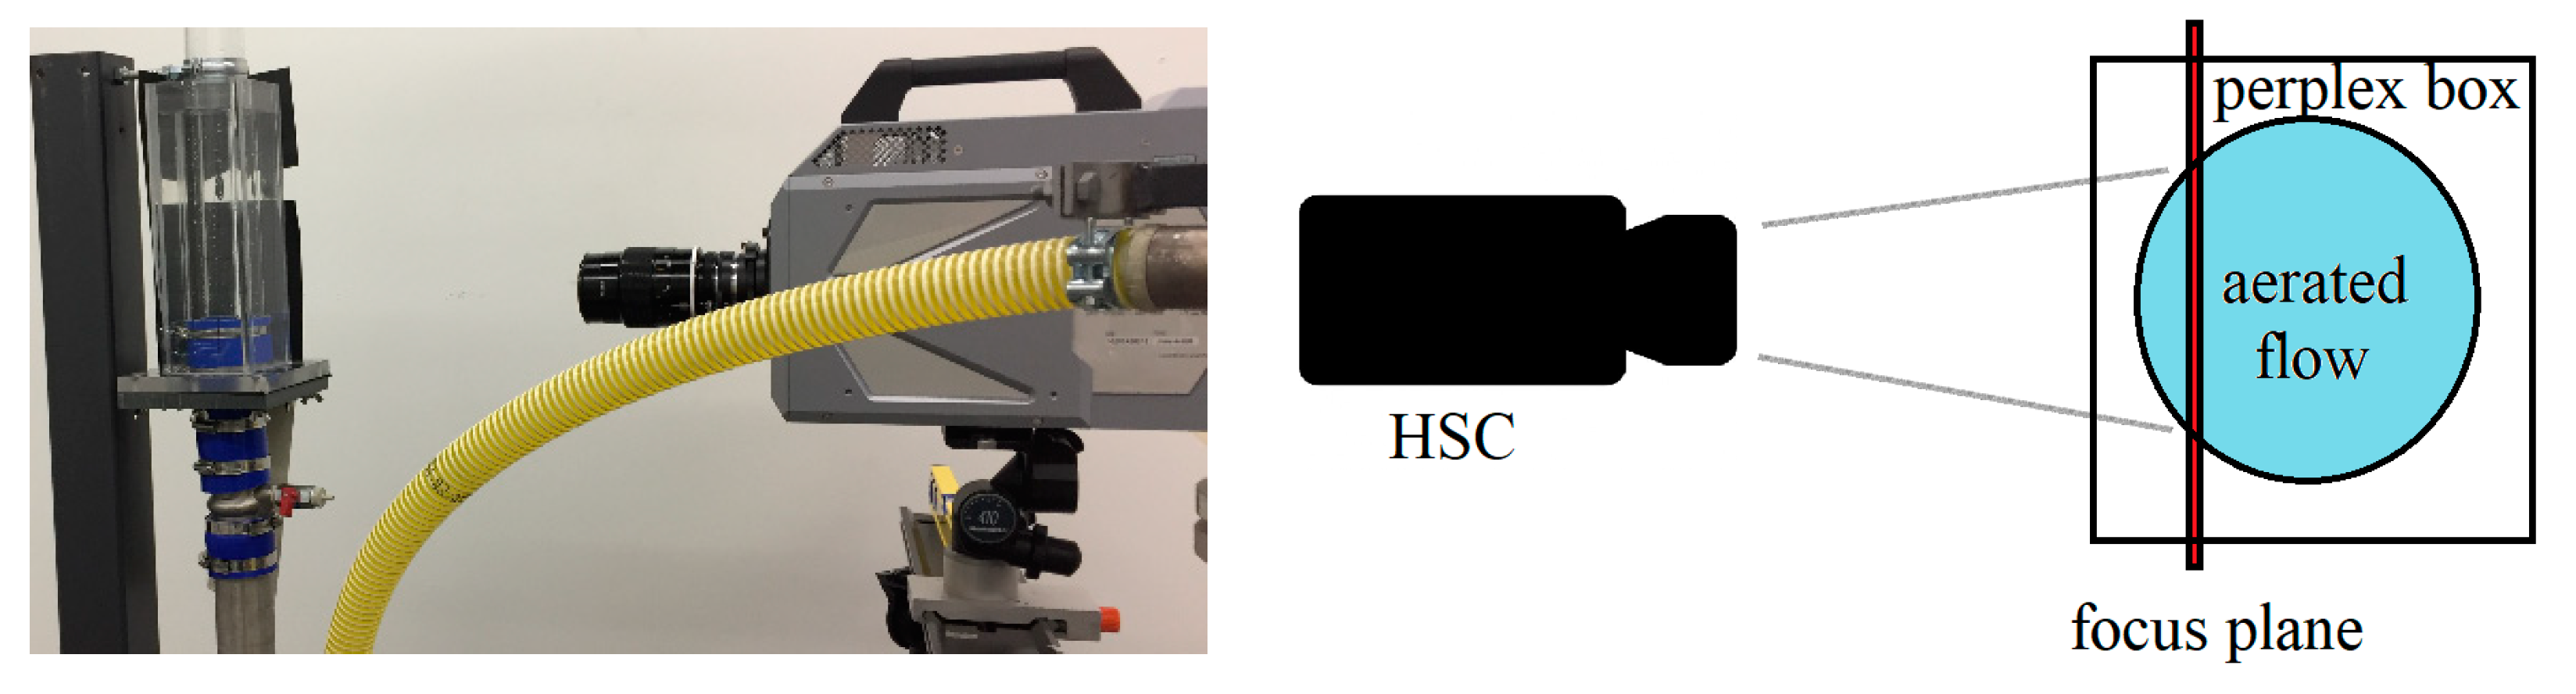
A high-speed camera (FASTCAM SA-Z type 2100K, Photron Deutschland Gmbh, Reutlingen, Germany) was used to record images of the aerated stream (
Figure 5, left). The focal distance was about 30 cm, corresponding to a 1 cm depth from the pipeline wall towards the centre of the aerated stream (
Figure 5, right). The camera was mounted on a translation stage that was controlled from a computer. At each flow rate, three shootings were taken at different stage heights at a frame rate of 3000 frames per second. To avoid motion blur, the shutter speed was adjusted according to the stream flow rate. The frames that were recorded at three vertical positions were combined into 6 × 16 cm
2 images with a resolution of 53.3 μm/pixel.
2.5. Mass Transfer
Gas–liquid mass transfer is crucial for water treatment processes as fast solution enrichment with oxygen affects the rate at which pollutants decompose. In this work, the impact of the aerator designed for DAF units on aeration capacity and efficiency was tested using the dynamic method (Equation (6)) of
measurement [
30]. The method was based on the dynamic measurement of a dissolved gas concentration by a probe while the gas-free solution was aerated with the gas. An oxygen probe MARVERT BASIC 2000 (Elke Sensor OÜ, Tallinn, Estonia) was used to track the oxygen concentration in water. In the beginning of each test, nitrogen bubbling was used to remove the dissolved oxygen from water, after which the nitrogen valve was closed, and the air valve was opened. The aeration lasted until a stable maximum concentration of the dissolved oxygen. The recorded dynamic measurements contained a time delay between the actual oxygen concentration at a time and the probe reading. Therefore, data fitting was performed to calculate the oxygenation dynamics from the measured data. The time constant (12 s) was measured separately using a concentration step-change method [
31]
where
is the saturated oxygen concentration in water, M/m
3,
is the oxygen concentration in liquid at
and
, M/m
3,
is the time constant of the measuring probe, s
−1.
Gas–liquid volumetric mass transfer characterizes the oxygenation capacity of a reactor and should not be biased by a gas concentration in bubbles, changing dynamically as the bubbles are moving in solution [
32]. Therefore,
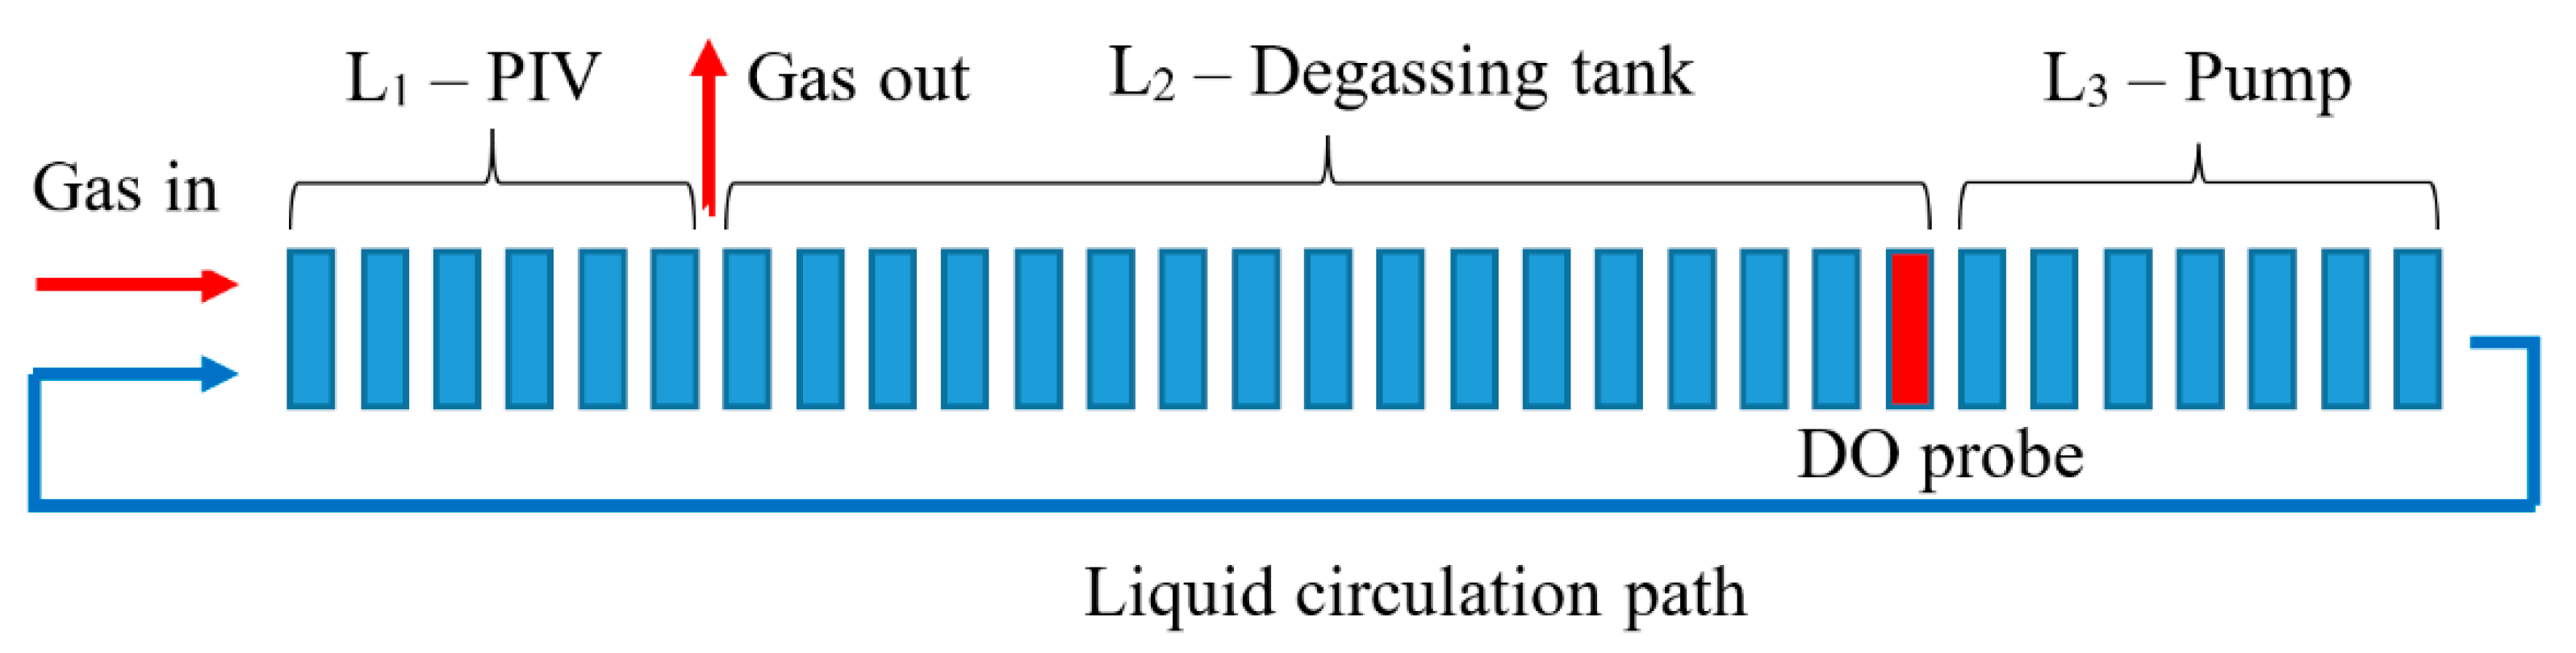
modelling was required. The CLR was assumed to be similar to a plug-flow reactor (
Figure 6) described mathematically in Equations (7)–(12) [
33]. The assumption deviated somewhat from the reality, as the aerated flow was flowing into the degassing tank, where the bubbles were retained for a while. In addition, some gas bubbles were captured by the liquid stream and reached another loop of the liquid circulation. Nevertheless, the models used in the current study were determined to be reasonable for the studied CLR.
Initial conditions
where
is the liquid superficial velocity, m/s,
is the reactor cross-section area, m
2,
is the overall gas hold-up,
is the volumetric gas flow rate, m
3/s,
is the length of the CLR reactor, m.
The volume of the circulated liquid in the CLR was schematically split into three zones. L1 corresponded to the pipeline length from the sparger to the degassing tank. The flow in the tank was not perfectly mixed but could be assumed to be linearly displaced; therefore, L2 represented the length of the pipeline of the volume equal to that of the degassing tank. Marked in red, the last bit of the zone denotes the location of the probe. The length of the last zone from the degassing tank to the gas sparger was denoted as L3. The stream diameter was assumed to be constant in all the zones.
3. Results
3.1. The Effect of the Sparger Geometry onto the Flow Hydrodynamics in the Non-Aerated CLR
The velocity contours, presented in
Figure 7, show the water flow hydrodynamics created by the geometry of the studied sparger in non-aeration mode at different pump flow rates. The blue spots in the contours exhibited a regular spatial pattern because of the burned pixels in the CCD cameras matrixes or/and dust on the lens. Nevertheless, the missing data were deemed to be insignificant, and the results are useful.
In general, the hydrodynamics along the distance of 160 mm can be characterized as a smooth flow without significant velocity gradients, which means that the regular arrangement of the solid structures in the sparger did not promote significant turbulence, leading to bubble entrainment and, hence, coalescence. One can notice the tendency of the higher velocity magnitude at the left side of the contours. This can be explained by the slight inclination in the vertical pipe in the lab set-up. As the flow rate increased, the velocity contours became more uniform.
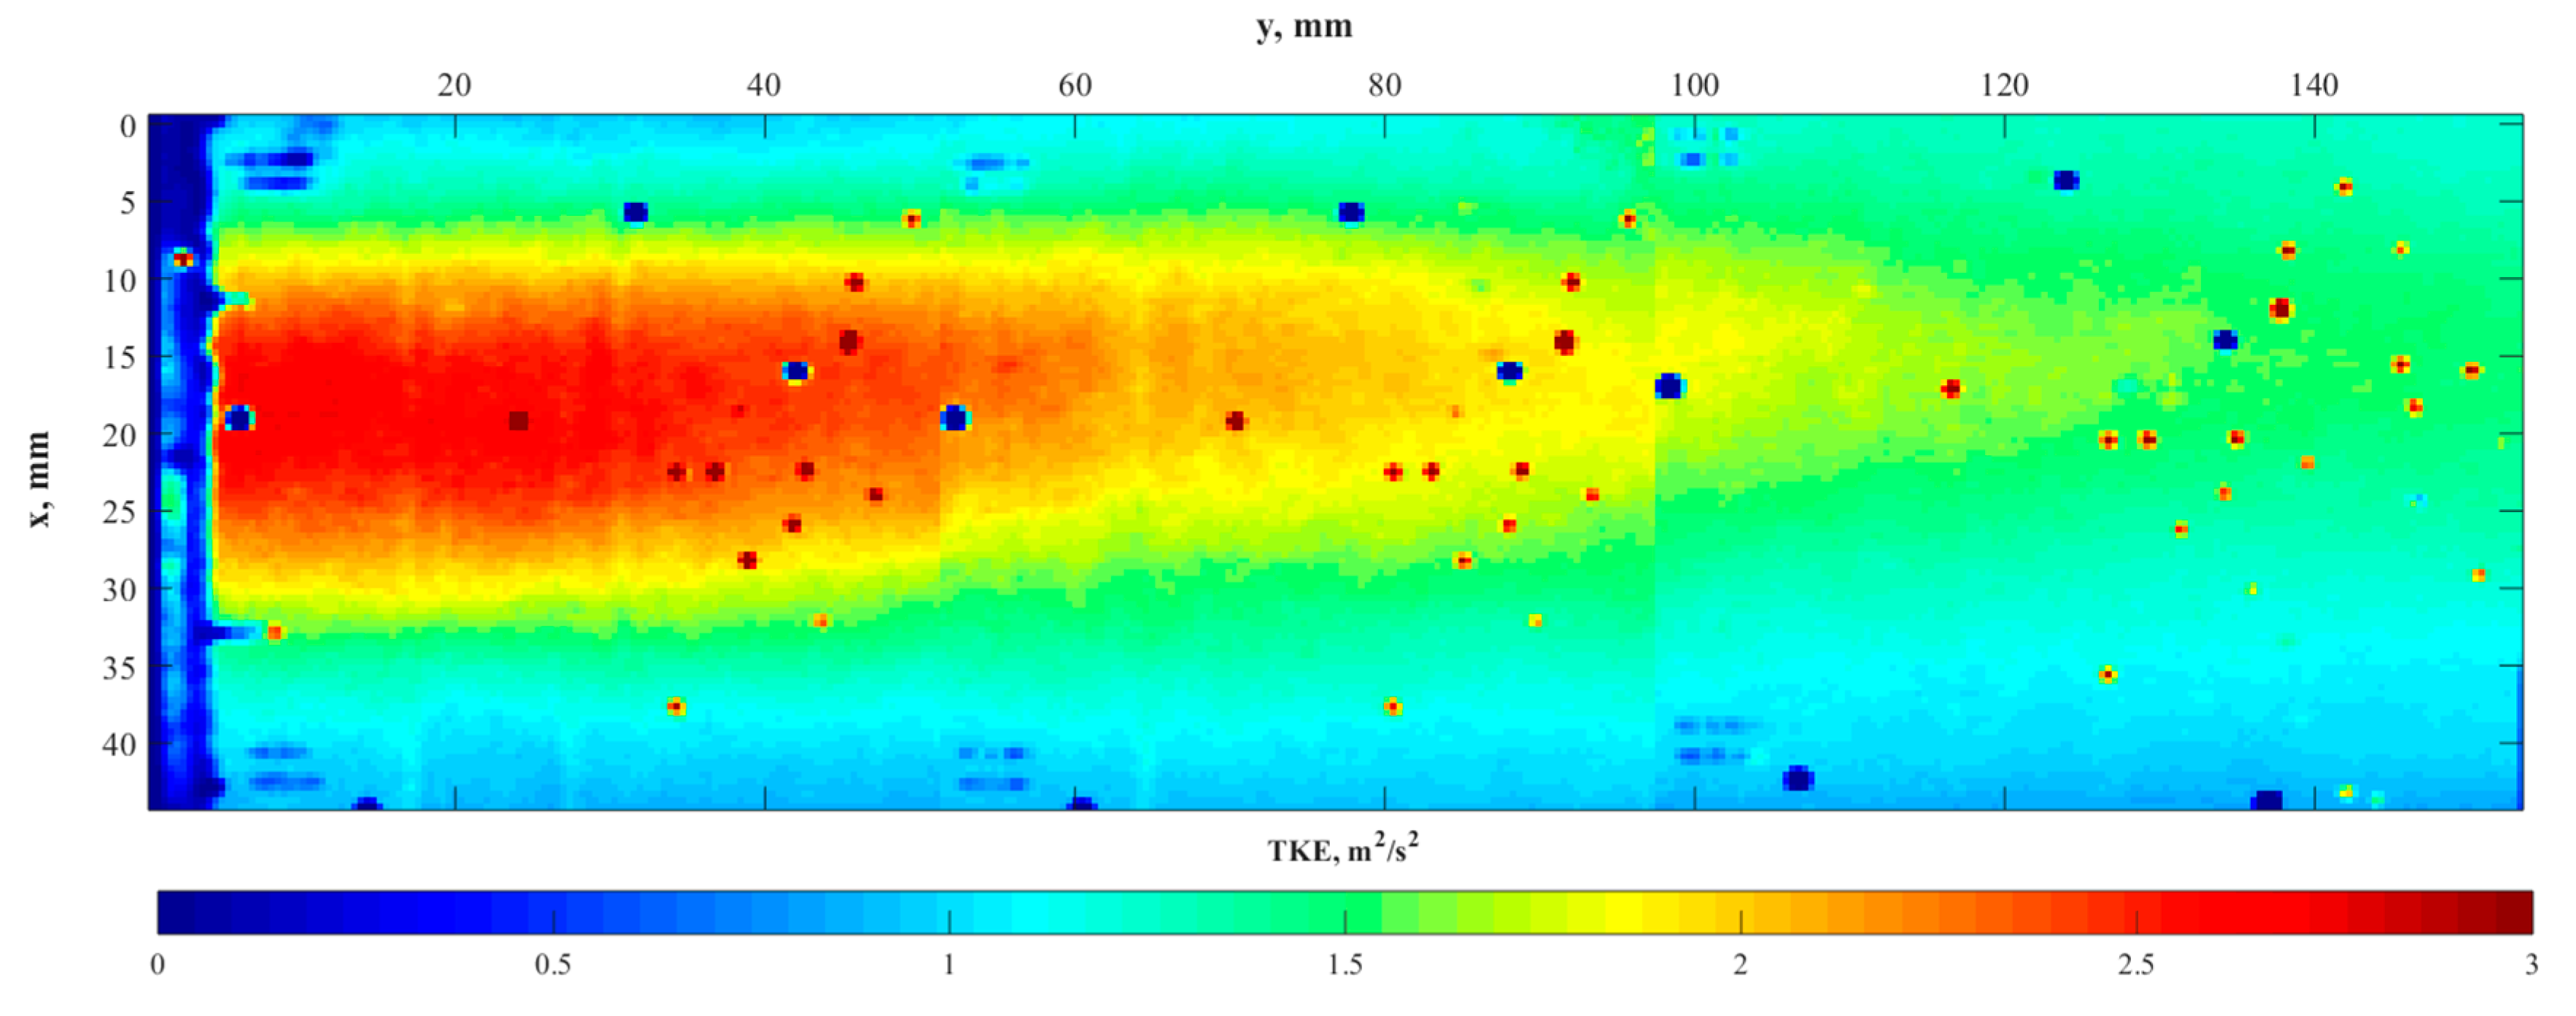
The contours of the instantaneous velocity were processed using Equation (3) to estimate the local turbulence kinetic energy.
Figure 8 presents the contour of local time-averaged turbulence kinetic energy (TKE) at a 1.4 m/s water flow rate.
The contour in the middle of the pipe demonstrates the area of high TKE near the sparger outlet that dissipated over a distance of approximately two sparger diameters. The major lump of the coalescence was expected to take place in this area, in the centre of the flow. At a high flow velocity, the residence time of bubbles in this area was most likely insufficient for effective coalescence and, hence, the growth of the bubble size was minimal.
3.2. The General Performance of the Aerated Stream in the CLR
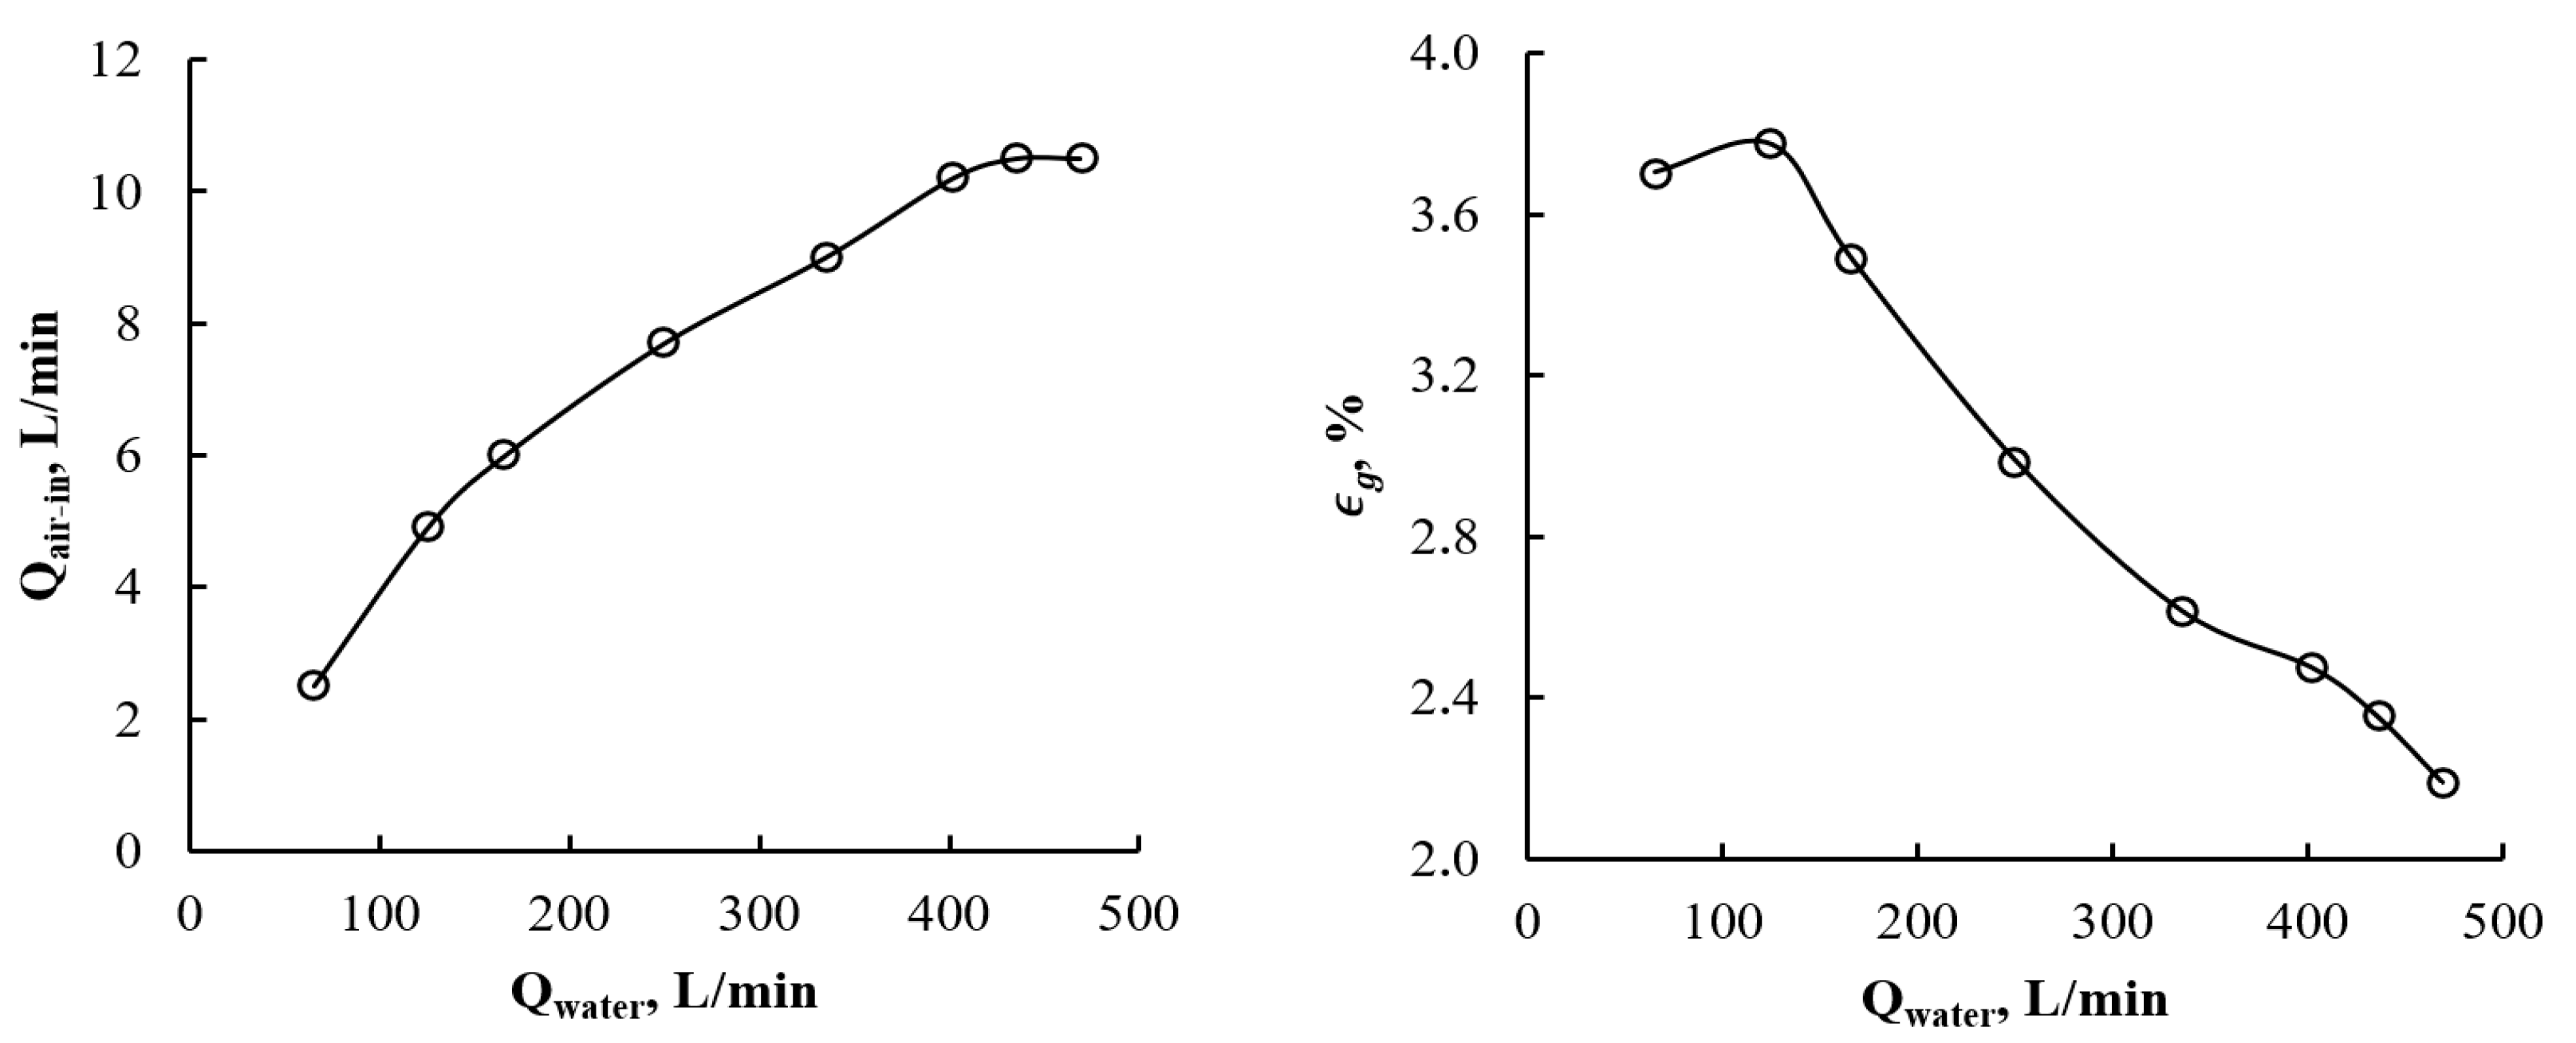
The CLR setup was tested in terms of its water-induced aeration rate and gas hold-up (
Figure 9). The air inflow rate was measured by inline gas rotameter (
Figure 2). As the water passed through the solid structures of the sparger, it created areas of reduced pressure to which the air was dragged at a rate proportional to the liquid speed. However, the linearity of the correlations was broken by the friction that developed between the air and the sparger channel’s network. Furthermore, the solid structures limited the maximum flow rate of the dragged air. On the other hand, the elevated water speed decreased the gas hold-up in the L
1 part of the pipeline, reducing the time the gas bubbles resided in the solution. The plateau in the air inflow rate provided an indication of the use of pressurized air as a means of increasing the aeration rate.
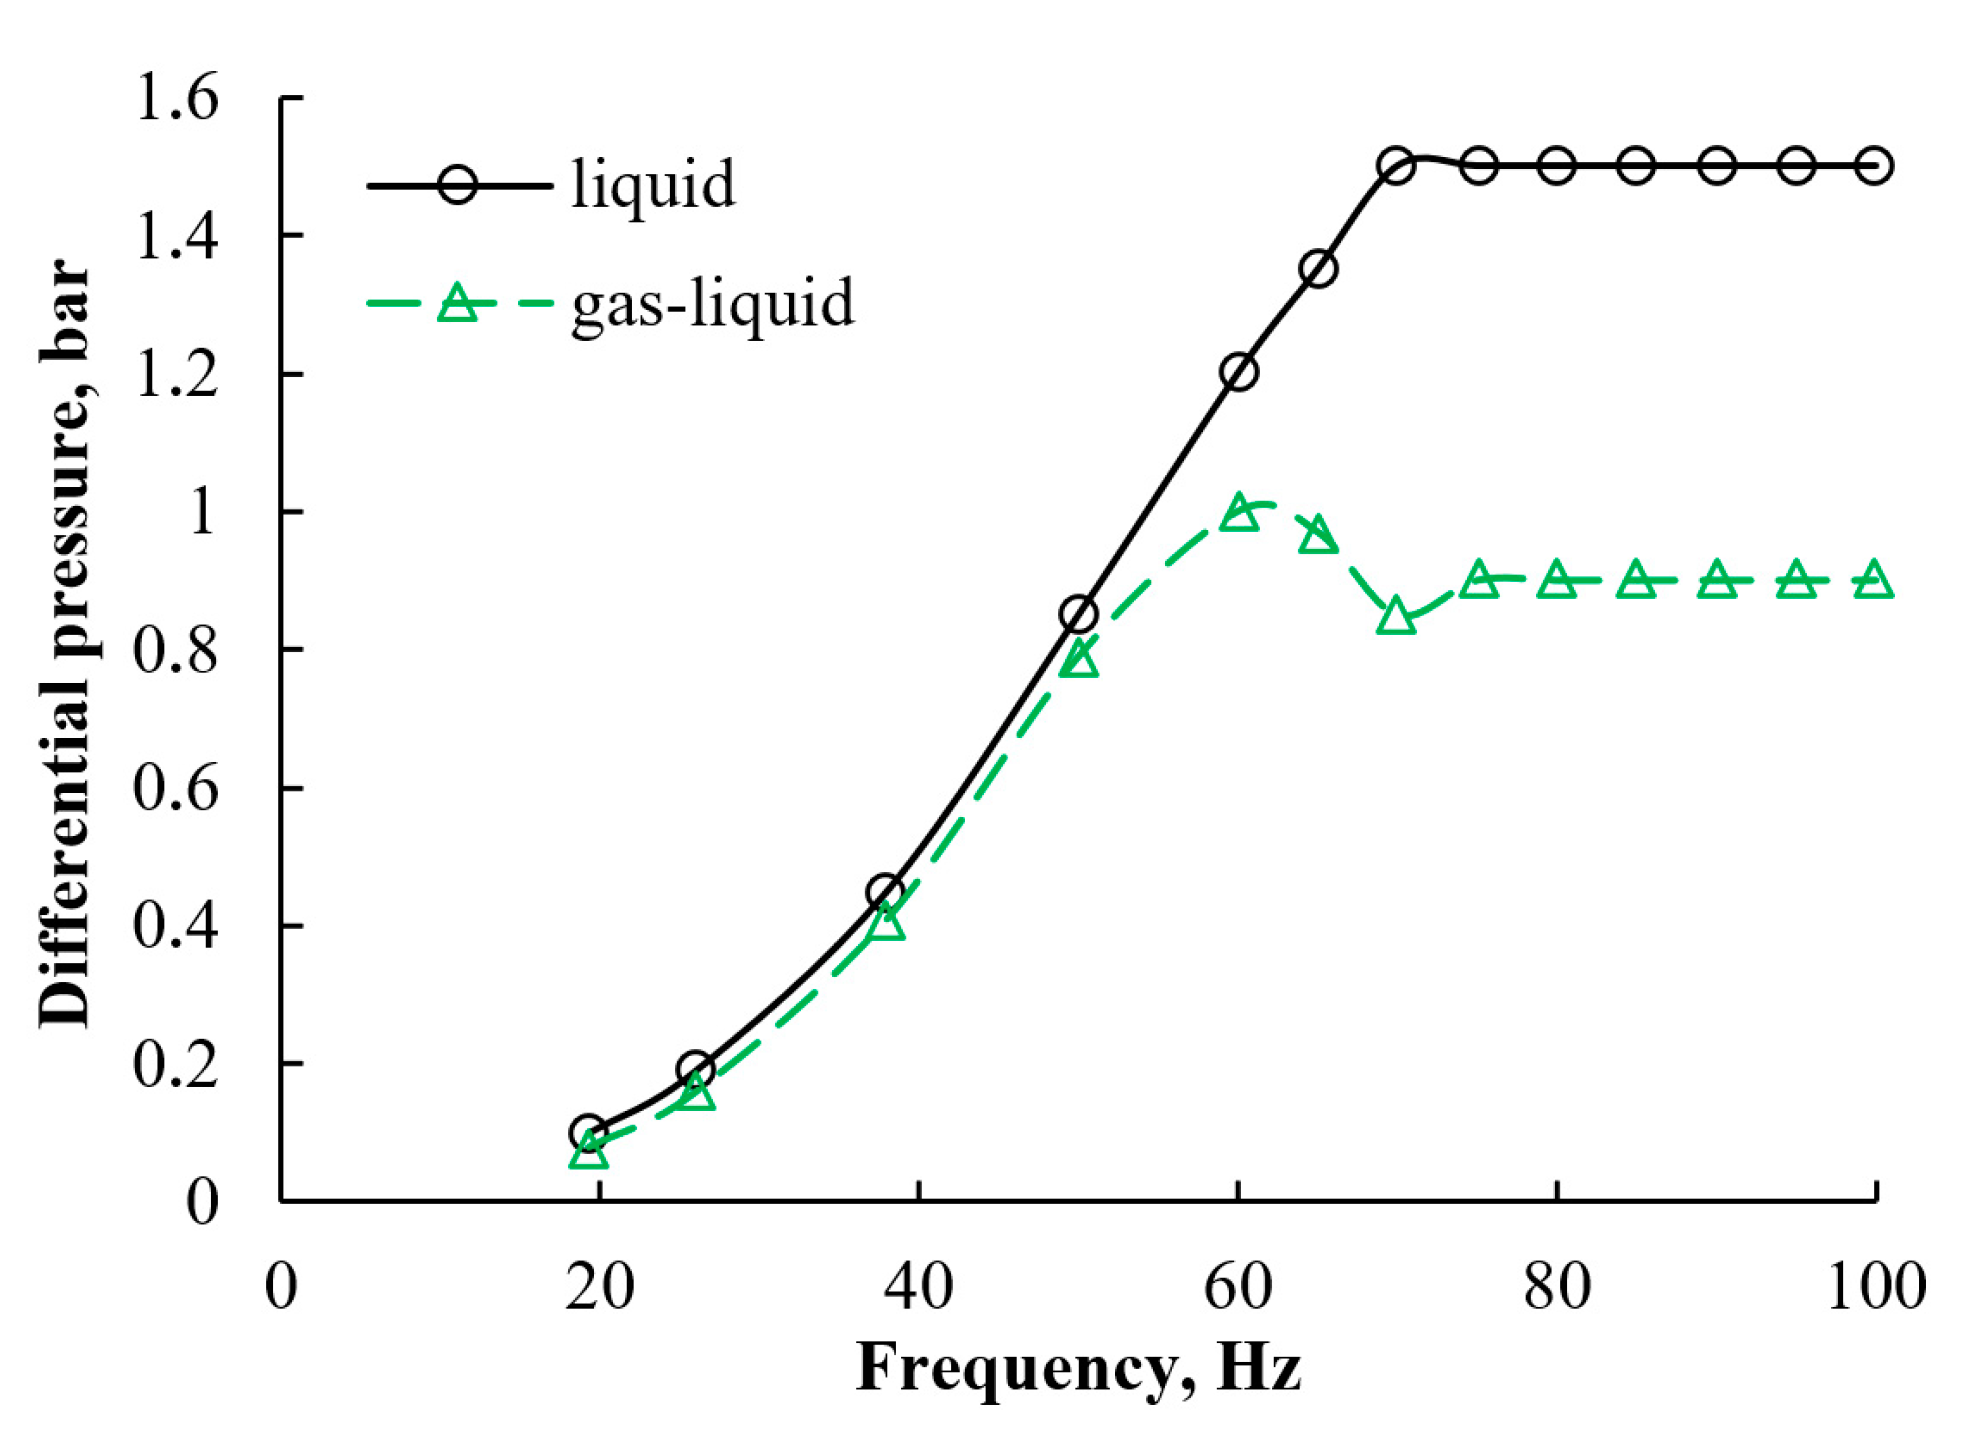
The dynamic pressure, measured by the gauge, resembled the working limits of the pump in the CLR in terms of efficiency (
Figure 10).
An increase in the pump frequency beyond 70 Hz in the non-aerated and 60 Hz for the aerated streams did not lead to an increase in the differential pressure due to the drag forces in the pipeline. The presence of the compressible and less dense phase in the stream reduced the effective differential pressure. An accumulation and compression of the air caused the drop in the pressure at 70 Hz. In response to a further incremental increase in the pump speed, the air compression reached its limits in the system, and a plateau was observed.
3.3. The BSD in the Aerated CLR
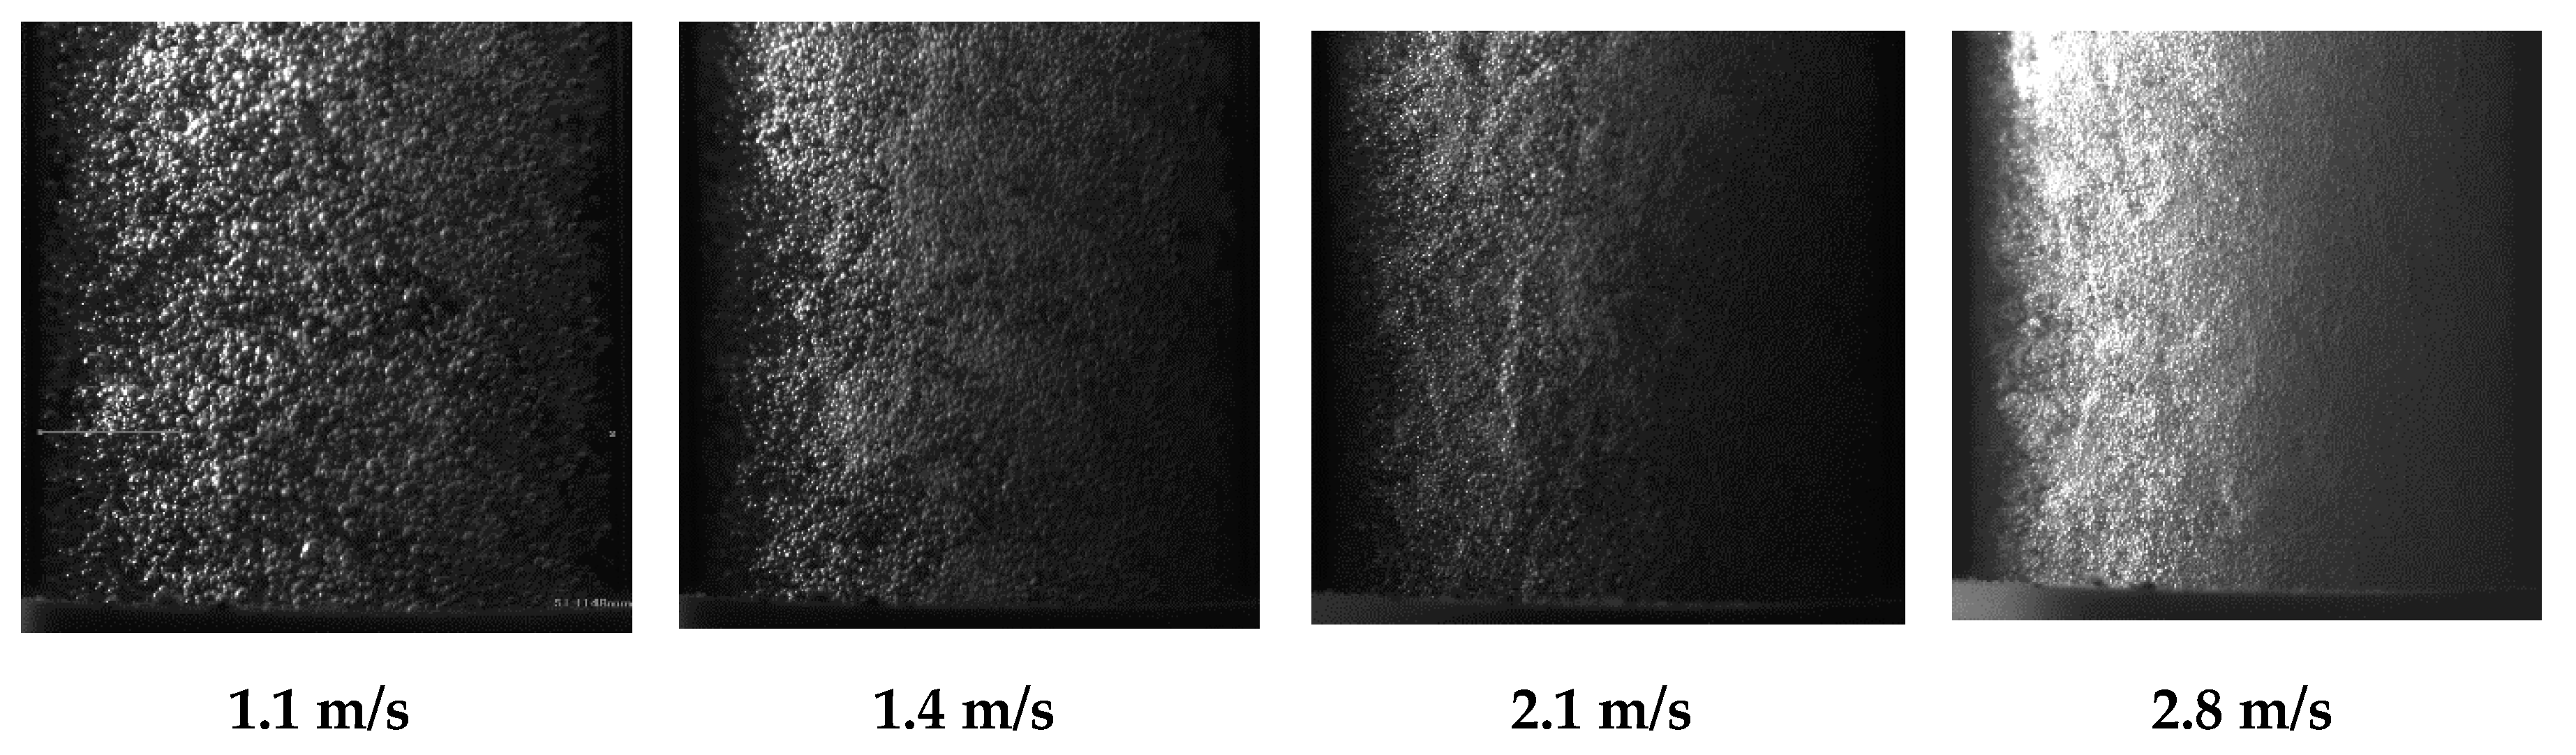
During the tests, it was difficult to use the PIV technique to accurately measure the bubble size, especially above 0.6 m/s of the flow velocity. Nevertheless, the PIV was used to estimate an average bubble size produced at lower flow rates. At higher aeration rates, the bubble density significantly distorted the laser illumination. Therefore, the outer part of the aerated stream was recorded by focusing the HSC at the front part of the transparent pipe. Thus, the inner part of the pipe, where major coalescence can be expected, remained unstudied. However, the HSC was applied to the aerated flows of high intensity where the residence time in the most turbulent part is low, and the coalescence is minimal. The samples of the images recorded at high temporal resolution by a high-speed camera are presented in
Figure 11.
The presented images clearly depict a reduction in the bubble size as the stream flowrate grows. The growing kinetic energy of the flow minimized the contact time between the newly developed bubbles and the orifice and dragged them away into the liquid bulk flow. However, rare big bubbles can be observed. The recorded area, presented in
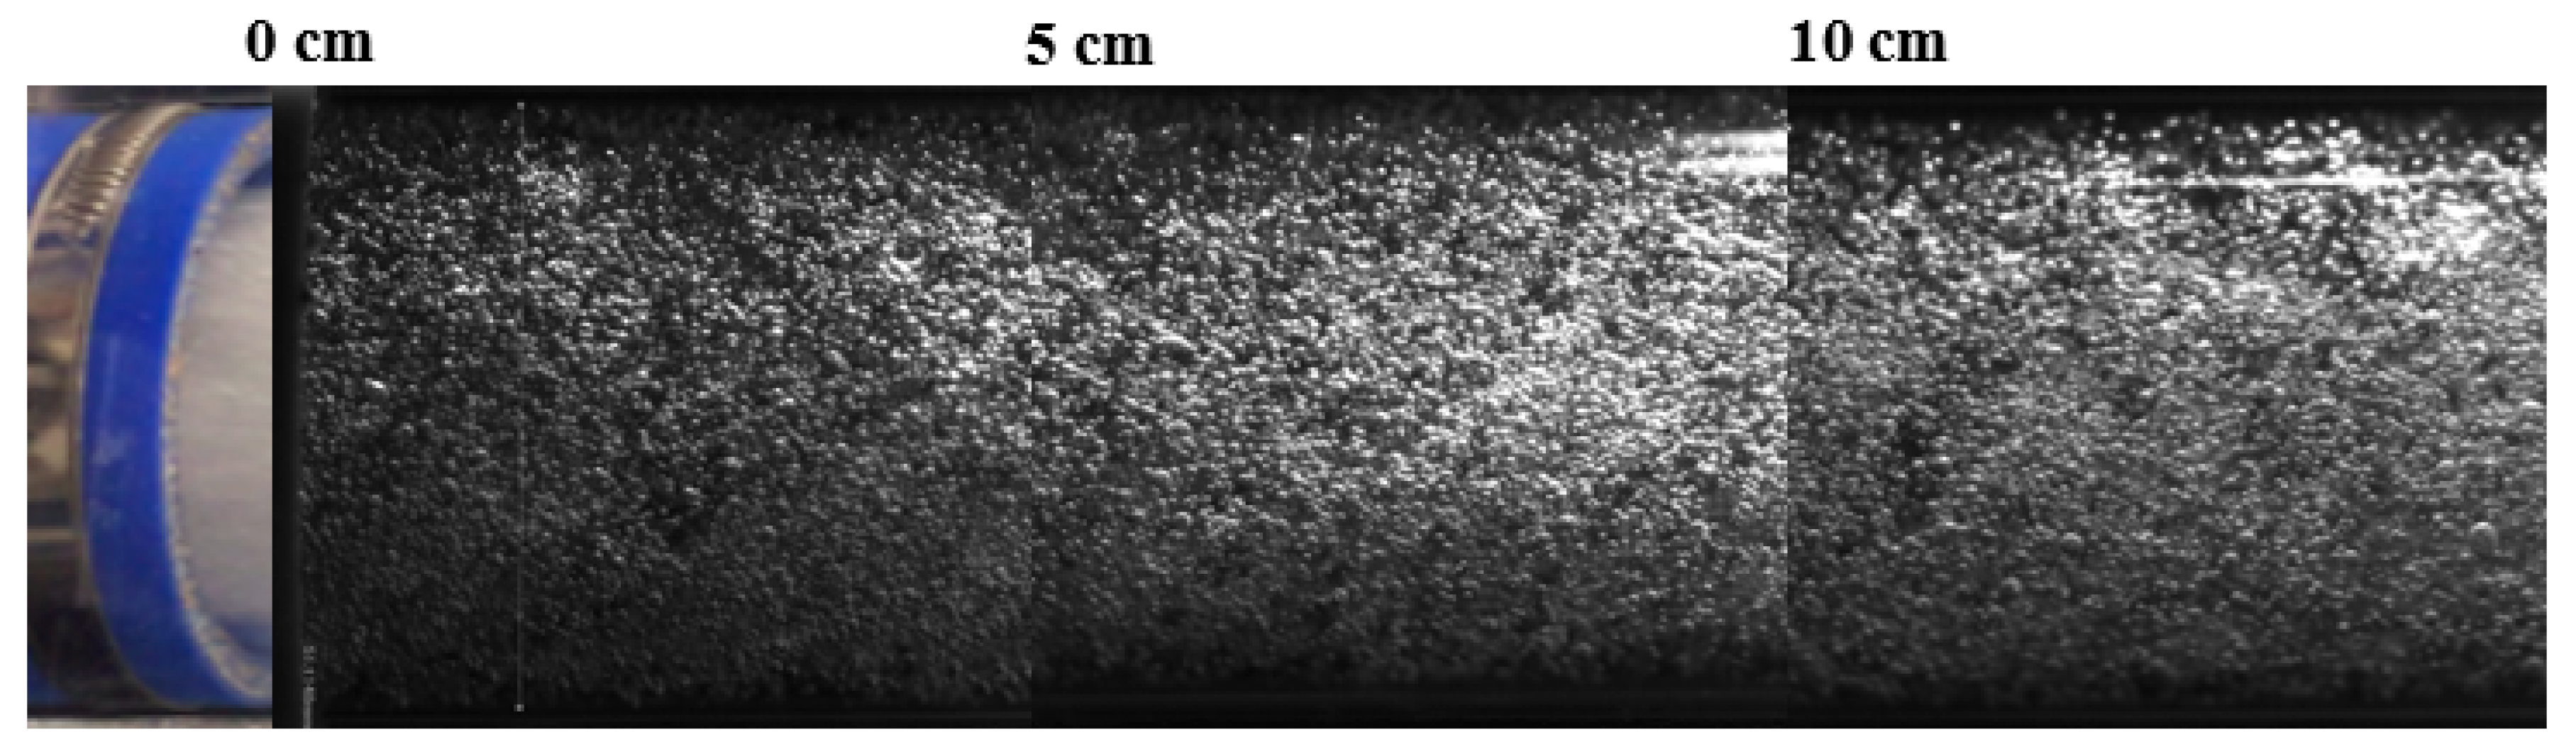
Figure 11, shows only 5 cm of the flow length when the residence time was short, and a further increase in the bubbles may occur along the flow. Therefore, a bigger flow path was monitored to study the dynamics of BSD along the flow. An example of the studied flow at 1.1 m/s is presented in
Figure 12, which shows the BSD from the sparger outlet along 15 cm of the flow.
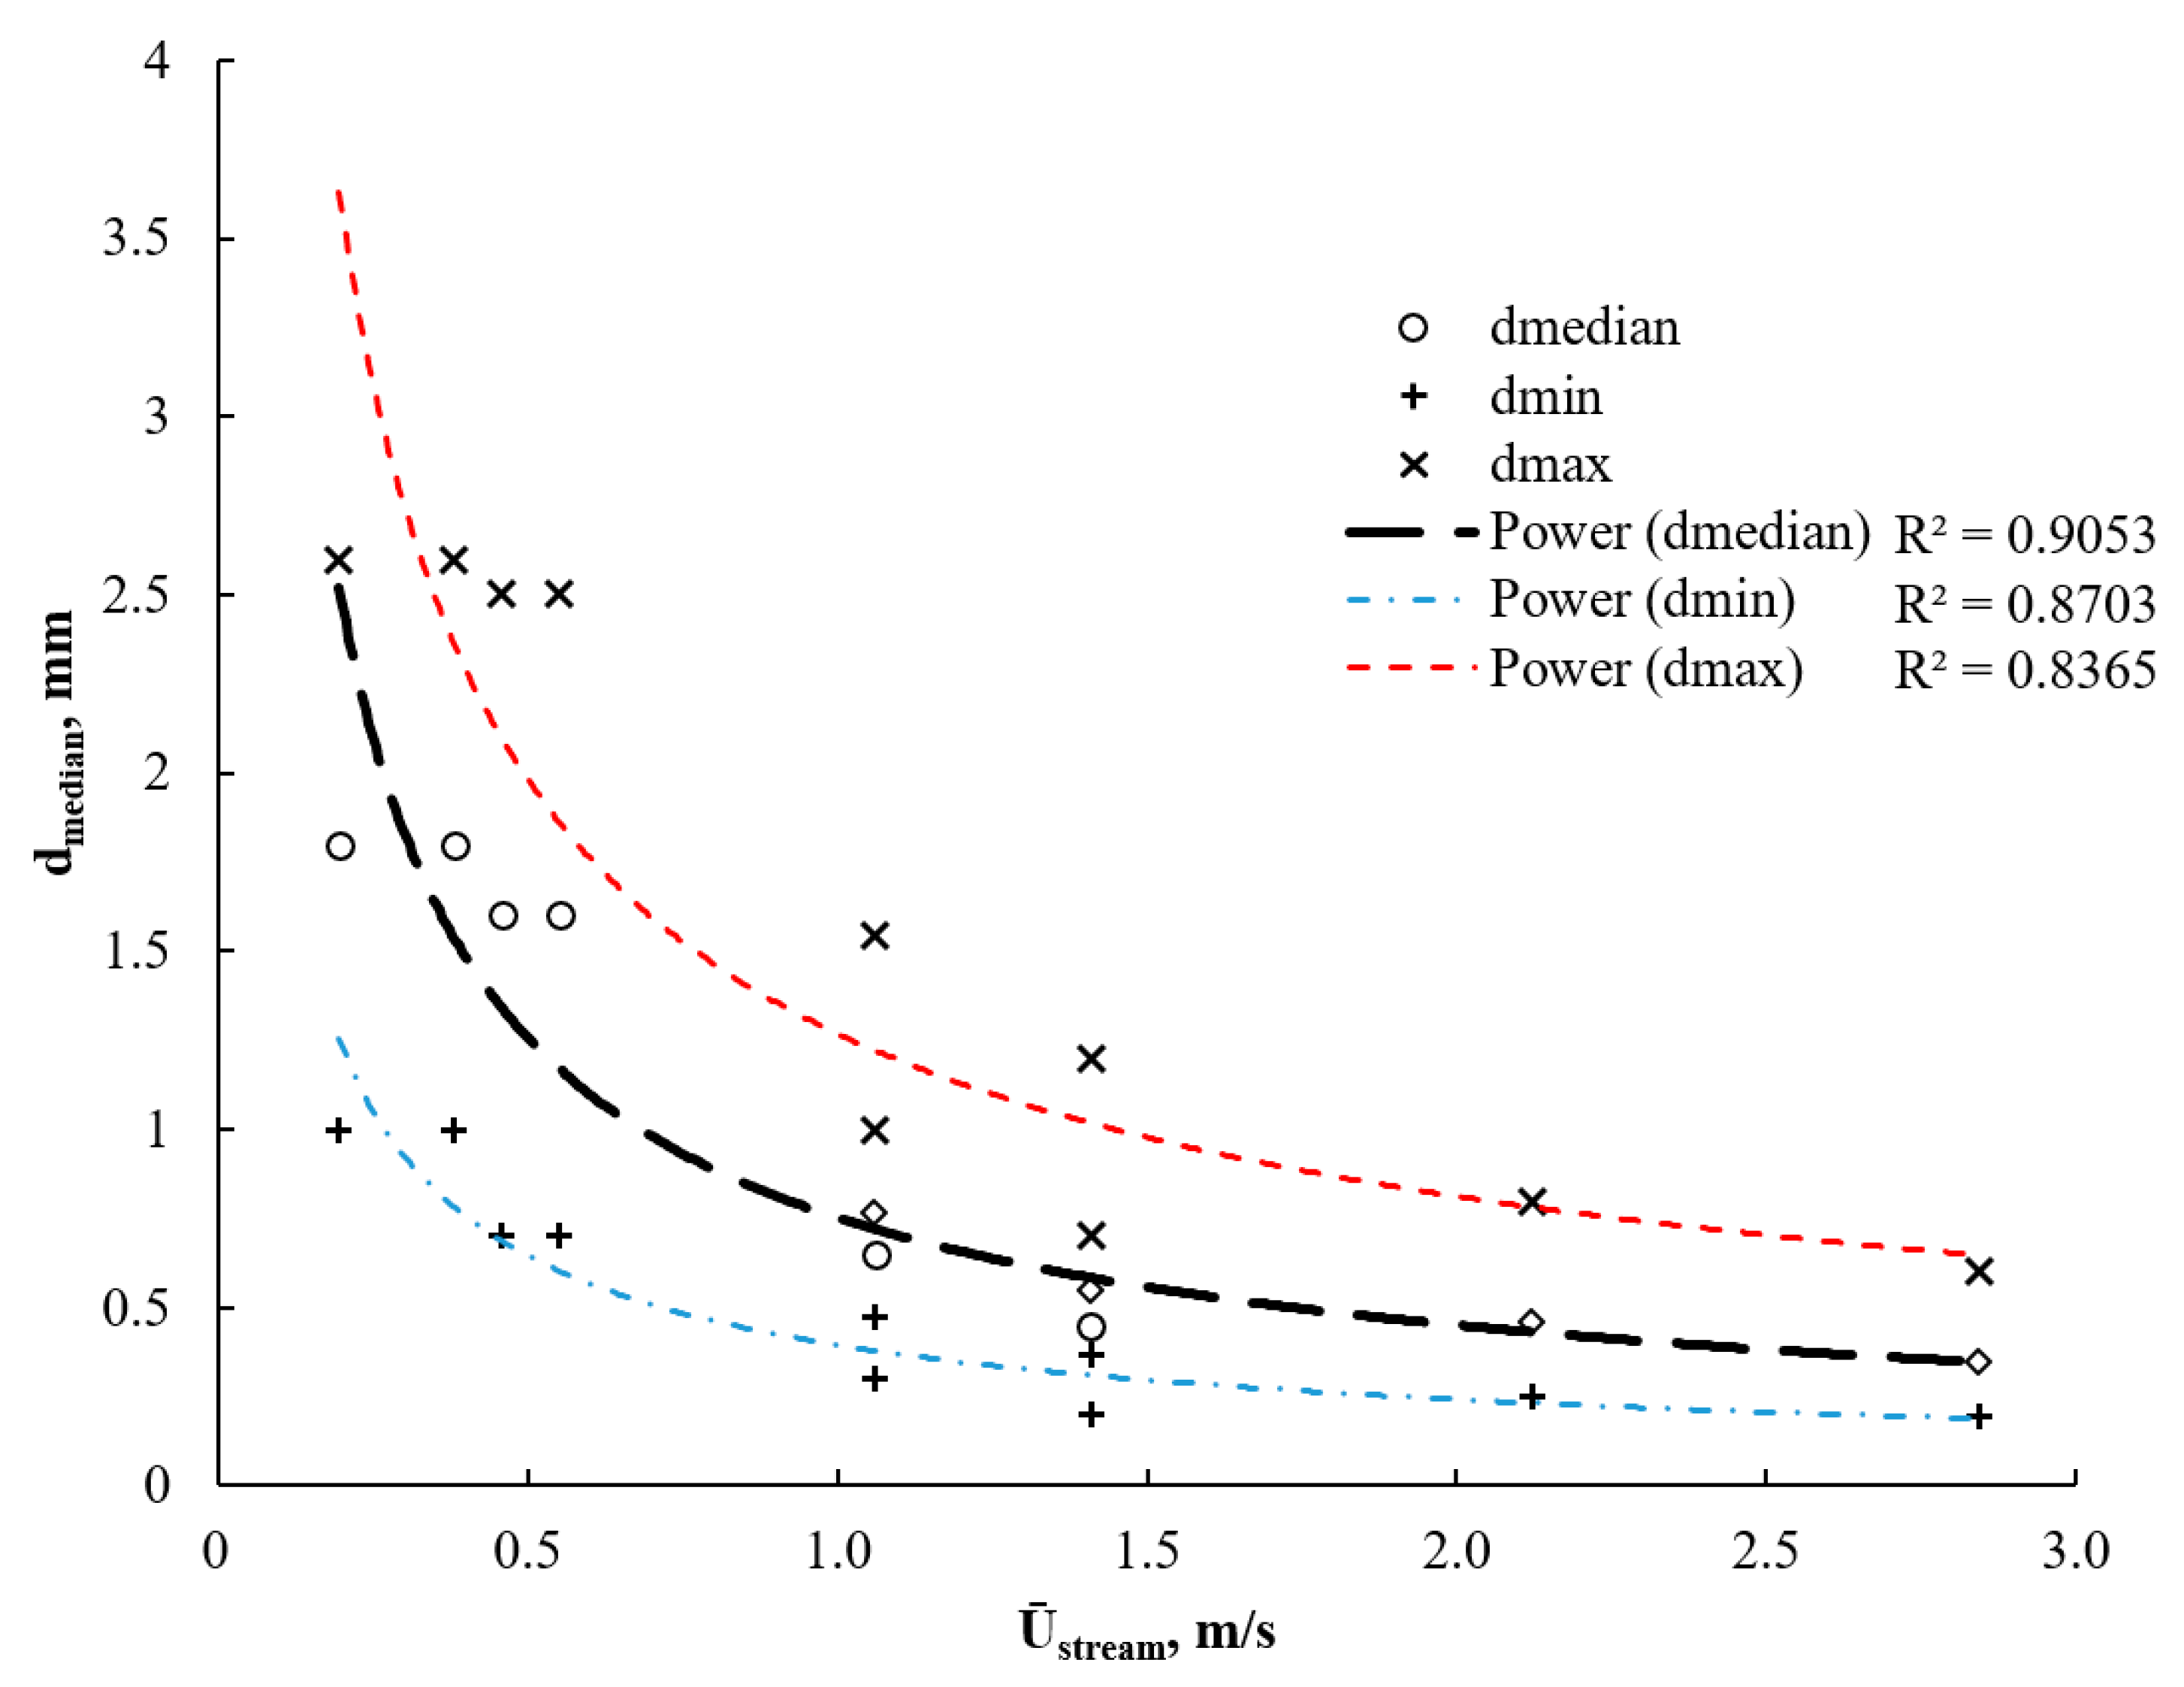
The uniform size and spatial distribution of the bubbles in the flow can be observed. The size of the bubbles on the PIV and HSC images were manually measured until statistical convergence (less than 5% deviation) of bubble size was not reached, that practically resulted in 40 to 80 images in each test. The resulting correlation between median diameters of bubbles and the stream velocity is shown in
Figure 13.
An almost linear reduction in the bubble size occurred at the beginning of the stream velocity elevation. However, the trend followed a power-law relation as the energy of the bubble surface tension grows faster than that of the flow stream. In turn, the elevated energy of the stream was able to handle higher gas hold-ups that increased the ability of the pressurized air supply to increase the oxygenation rate. Bubble size distribution can be effectively controlled in the range of 1000–2500 μm and 190–600 μm correspondingly at the lowest and highest flow rates.
3.4. The Volumetric Mass Transfer
The BSD produced by the sparger had a high potential in the gas–liquid mass transfer. The mild pressure drop of the stream as it passed through the solid structure of the aerator benefit to the potential application of the sparger in efficient oxygenation as a water treatment process. The high energy of the flow, which intensified the micromixing within the gas–liquid contact area, and the large contact area promoted the mass transfer rate. 0.1 m
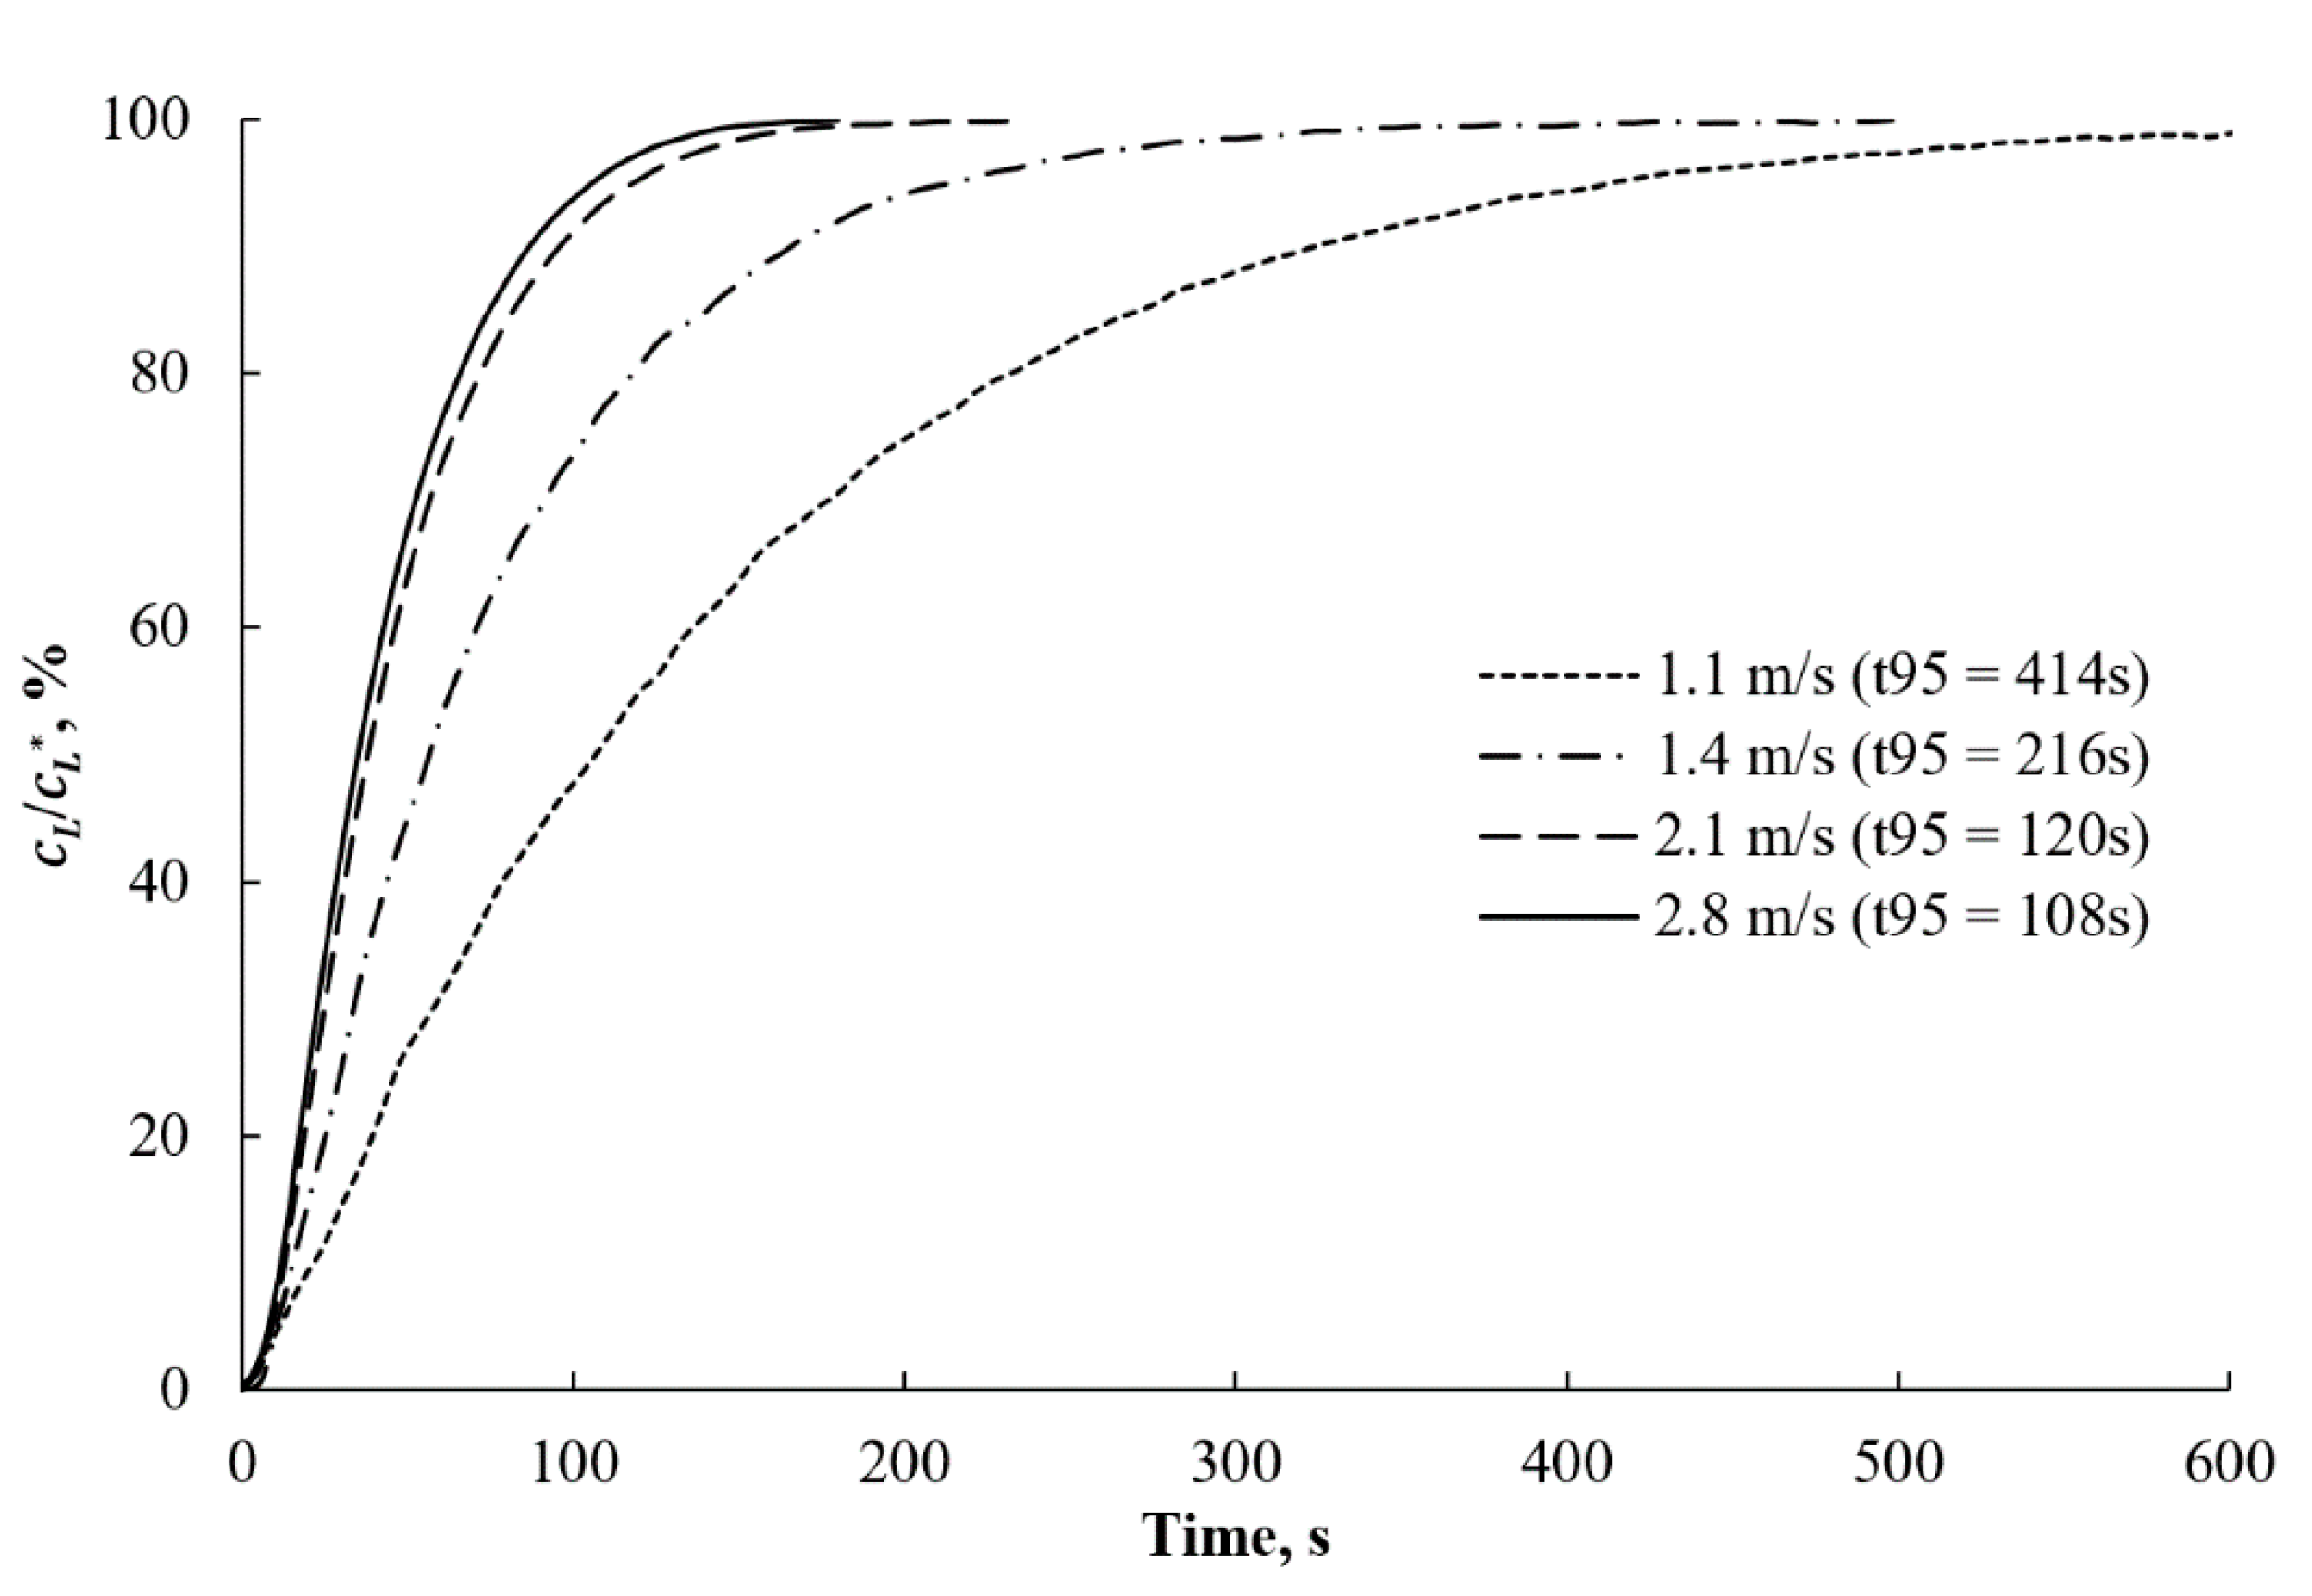
3 of tap water was aerated at different stream flow rates to estimate the oxygenation rates achieved by using the DAF sparger. The heat produced by the motor increased the liquid temperature, thereby affecting the saturated concentration of the oxygen. The dynamics of the oxygen concentration, normalized by the corresponding saturation concentration, are presented at different flow stream velocities in
Figure 14.
The elevated velocity of the solution stream increased the gas supply and gas–liquid interface that promoted the oxygen dissolution rate in the liquid. Analogous to the bubble size trend previously observed, the oxygenation rate growth was not linear. As such, at some point, a further increase in the stream velocity will not significantly improve mass transfer due to the minor change in the bubble size. Another potential explanation for the reduction in the increment of the oxygen transfer rate in response to the increase in the stream velocity is the depletion of oxygen in gas bubbles because of the intensive mass transfer. Therefore, there was a requirement to test pure oxygen and pressurized gas supply.
3.5. Comparison to Other Aeration Systems
The efficiency of the aeration represents an important parameter that has to be evaluated to judge the feasibility of the sparger application. Various pressures were measured during the tests to estimate the power consumption of the aeration. The oxygenation efficiency was compared with that of the available operational units equipped with different sparger types—namely, airlift reactor, bubble column, stirred tank, draft tube stirred reactor [
34,
35,
36,
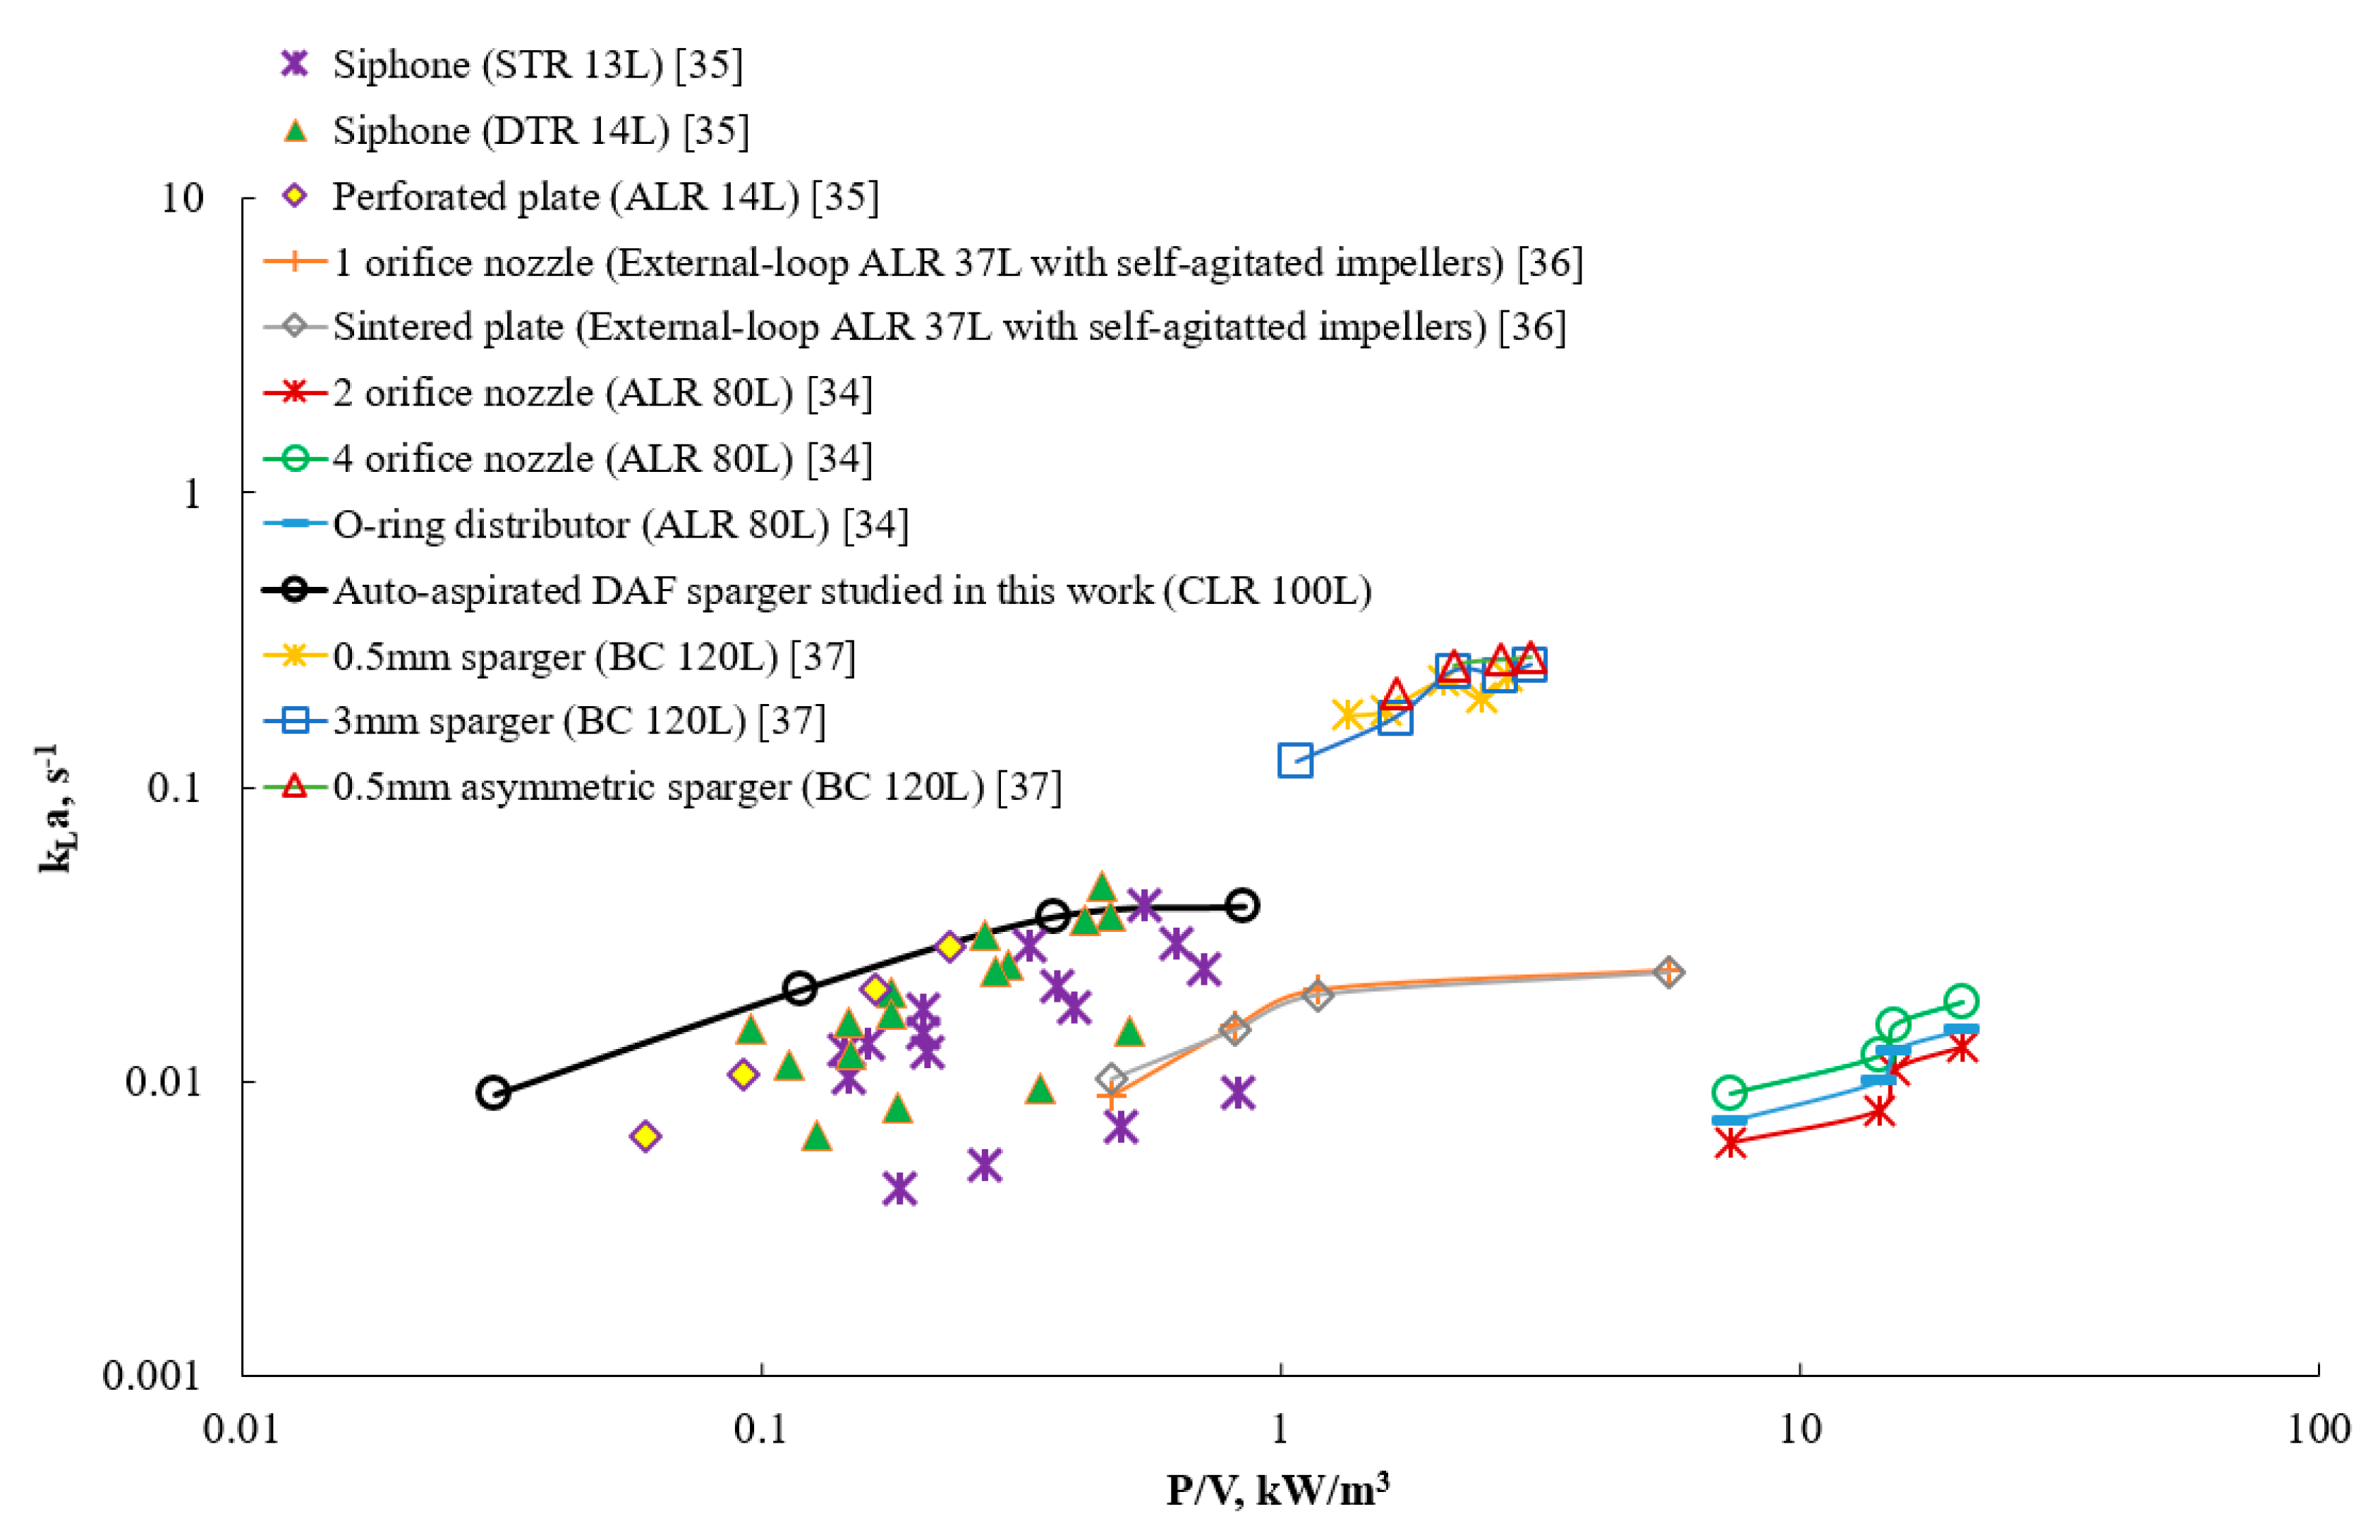
37]. The specific volumetric power consumed during the aeration process was estimated, taking into account the power air supply and mixing power consumption. The results are presented in
Figure 15.
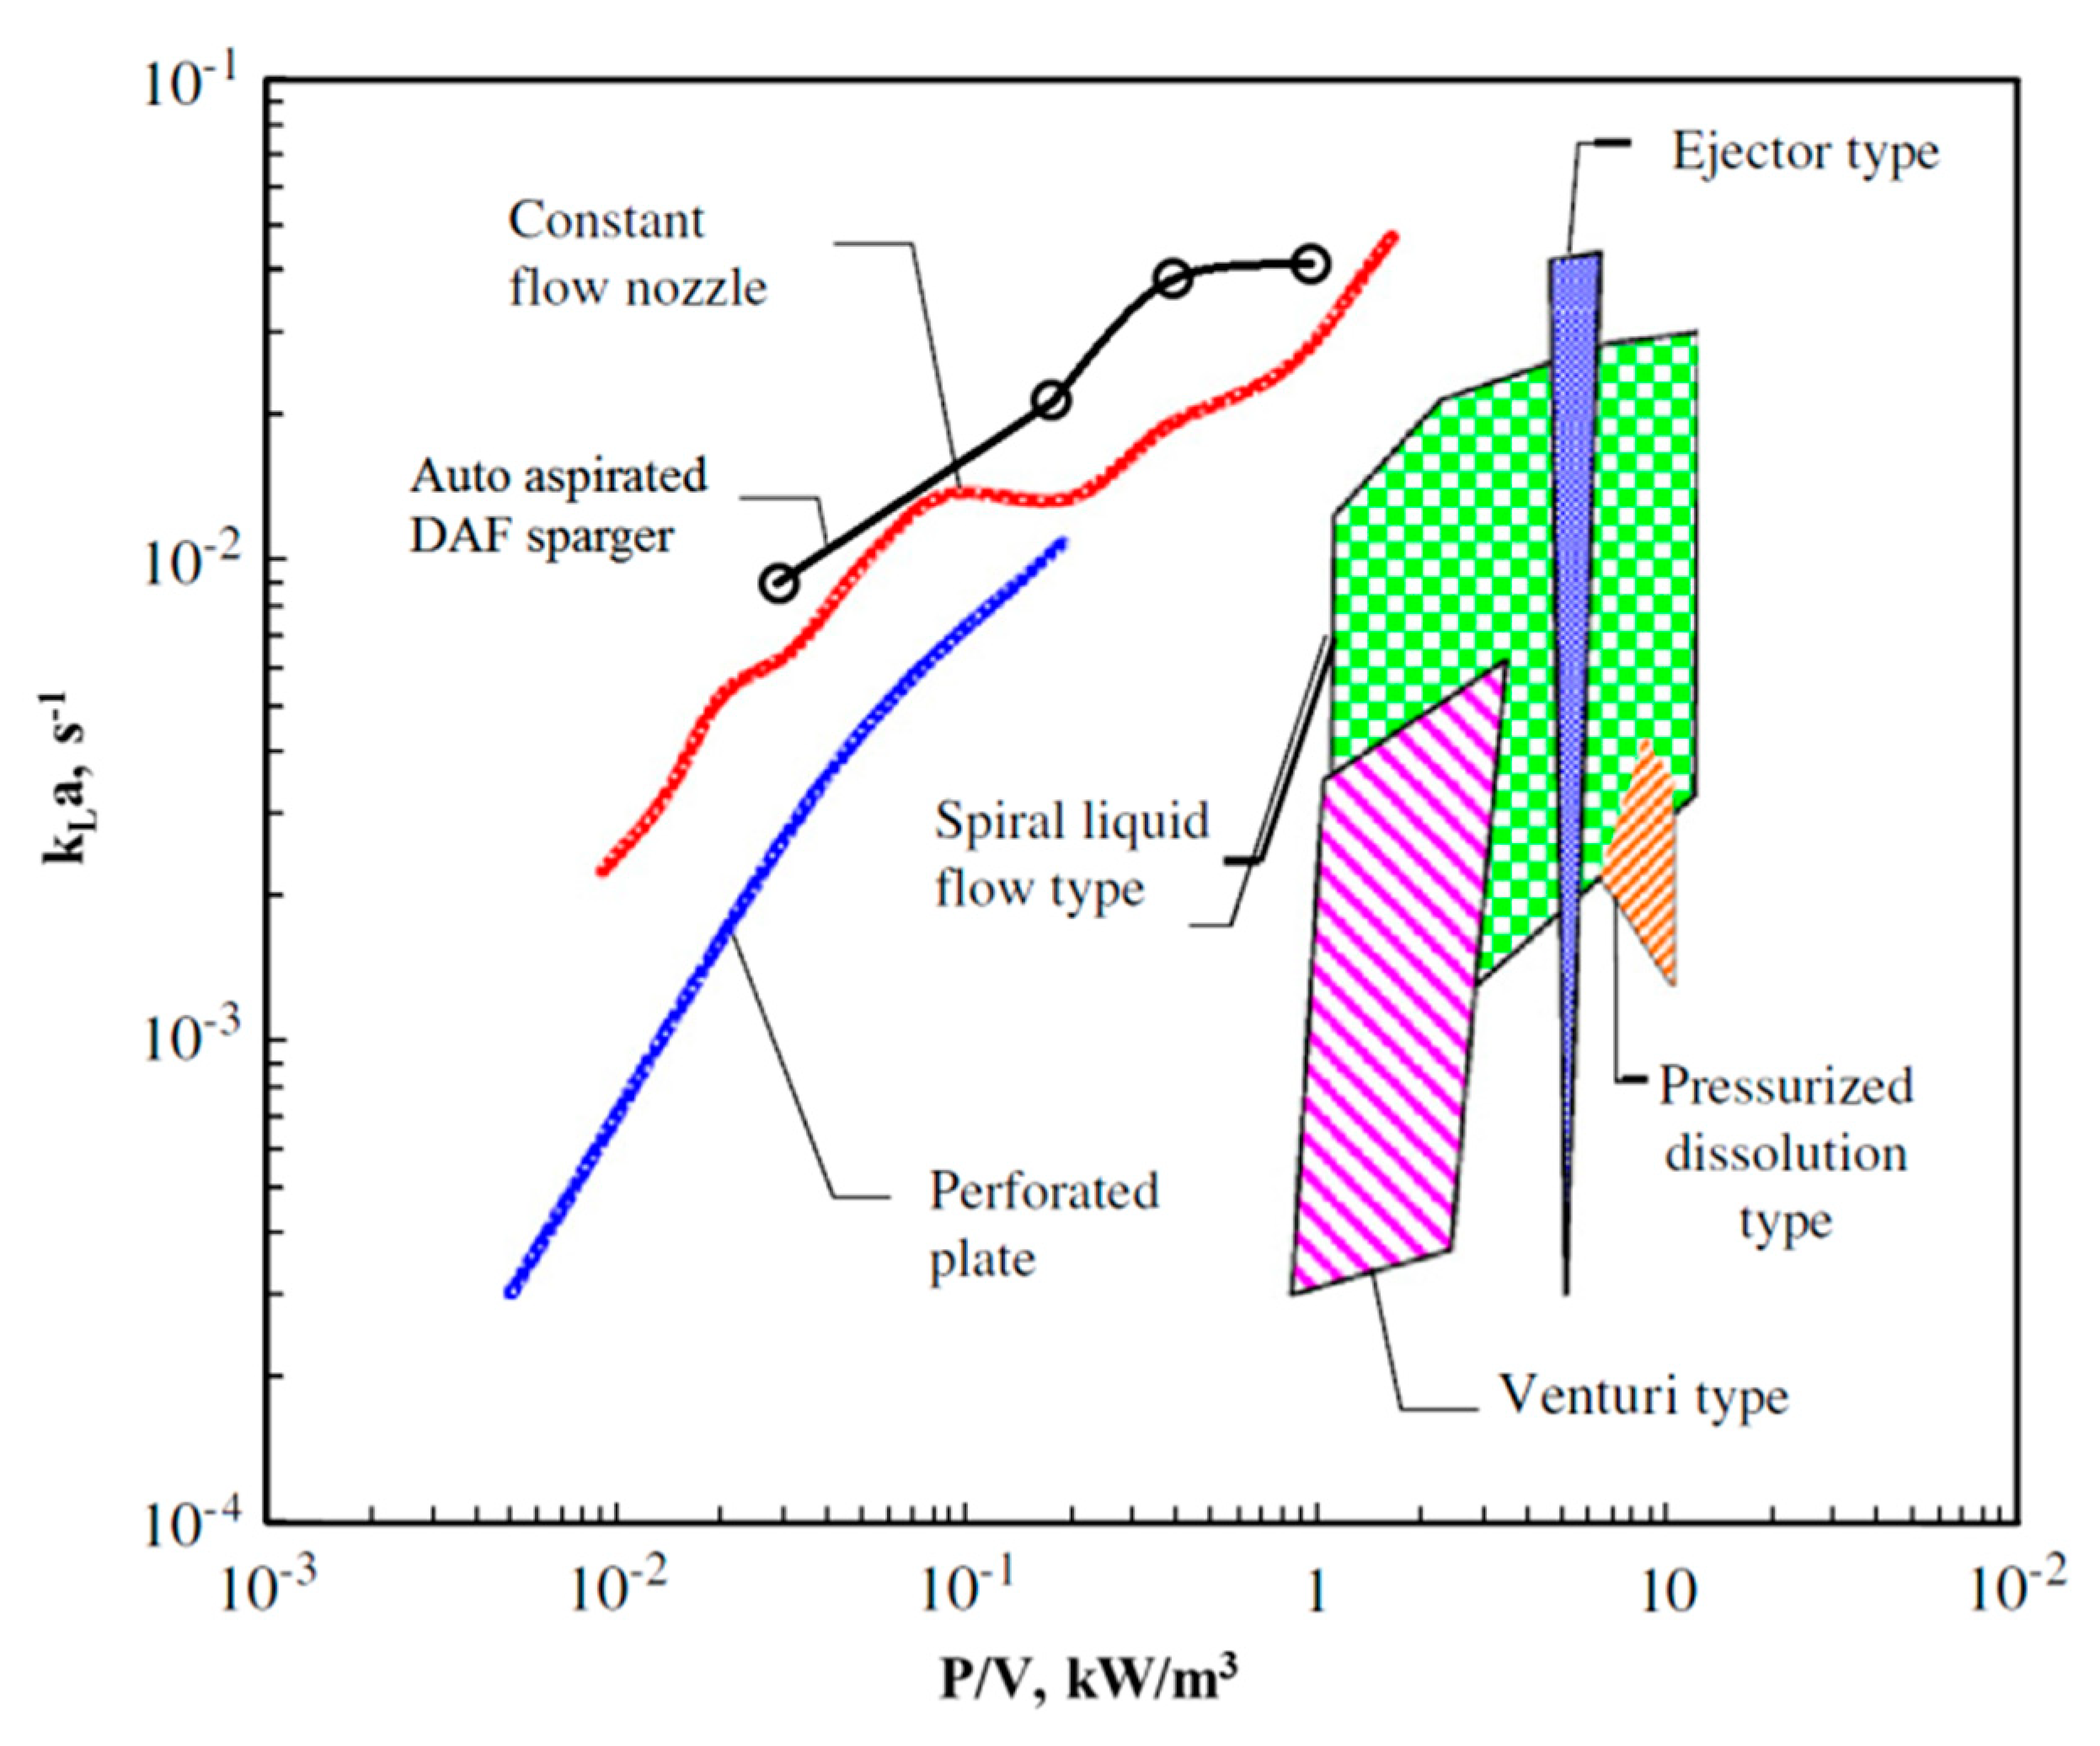
More specifically, the specific volumetric air–water mass transfer was added to the map (
Figure 16) presented by Terasaka et al. (2011) of the specific power requirements of various aerators to dissolve oxygen into water [
38].
The air sparger mounted in the CLR exhibited high potential among the studied conventional aerators, especially at the mild power consumption. Furthermore, pressurized air usage could increase mass transfer at low energetic costs. Using pure oxygen further increased the .
4. Discussion
Using 3D printing technology, the unique shape of the designed gas sparger was manufactured in metal. The solid internal structure of the sparger caused a mild pressure drop. Most of the coalescence was observed in the centre of the stream, and this was attributed to the high turbulence. The region of high turbulence was cylindrical with a radius of 0.5 and height of 2.
The bubble size dynamics exhibited a power-law function of water flow rate approaching a stable minimum value of the bubble size. The stable mean bubble size was the result of the balance between the energies of water flow and bubble surface tension. Potentially, the energy of the water stream at high rates can be used to handle higher gas intake rates, which permits the use of a pressurized air supply. The HSC results revealed that the generated bubbles were uniform in size and had an even spatial distribution. Along the monitored length of the flow stream, the bubble size did not change significantly in the constraint domain of the CLR. However, when supplied to a tank or any other unconstrained domain, the BSD dynamics is expected to be even smaller. Nevertheless, to judge the sparger performance in a bigger reactor experimental verification is required.
The oxygen transfer rate was intensive and dependent on the stream velocity. In the regime of the stream induced aeration, the effective throughput capacity of the CLR was limited by 3.4 m/s stream velocity due to high wall friction. A flow rate above 2.1 m/s did not significantly improve the mass transfer due to intensive oxygen depletion. Therefore, pressurized air or pure oxygen can be used to improve the gas–liquid mass transfer rate.
Among the studied gas–liquid contactors at lab scale, the CLR equipped with the sparger showed the greatest efficiency due to the mild pressure drop and uniform BSD of the dispersed air. Due to its efficiency, low cost, and ease of installation, the sparger can have a variety of practical applications in water processing.
The studied sparger produced bubbles that were well-dispersed in space along the flow at low-pressure drop and was found to be efficient in air-enrichment processes in comparison to the studied gas–liquid contactors at lab scale. However, the conditions studied in this research were limited to idealized tap water solution; in practice, fluid properties vary significantly and affect the aeration rate. Therefore, there is a need to test various liquids of, for instance, high ionic content and low surface tension. It may also be worthwhile to experiment with viscous solutions from the viewpoint of oil treatment in DAF units.
The high OTR capacity of the sparger opens up new areas of potential applications such as CO2 dissolution in liquid. In view of global warming, the ability to capture carbon dioxide represents a commercially attractive alternative for aerator usage. The efficient transport of CO2 from industrial off-gasses into a solution to synthesize new products can be a core technology within power stations and plants that use fossil fuels. Mounted in a floating platform that operates autonomously, the studied aerator can be used to aerate poorly oxygenated areas of ponds and lakes to save local biocenoses.
Author Contributions
Conceptualization, D.V.G., J.K. and T.K.; methodology, D.V.G. and T.K.; software, D.V.G.; validation, D.V.G. and A.S.; formal analysis, D.V.G.; investigation, D.V.G. and T.K.; resources, T.K. and K.U.; data curation, D.V.G.; writing—original draft preparation, D.V.G. and A.S.; writing—review and editing, D.V.G., A.S. and T.K.; visualization, D.V.G. and A.S.; supervision, T.K. and K.U.; project administration, J.K. and T.K.; funding acquisition, T.K. All authors have read and agreed to the published version of the manuscript.
Funding
This research was funded by Outotec (Finland) Oy.
Acknowledgments
The authors are grateful to Outotec (Finland) Oy for the provided equipment, active supervision, and financial support.
Conflicts of Interest
The funders had no role in the collection, analyses, or interpretation of the data; in the writing of the manuscript, however the funders participated in the agreement of the proposed design of the study and they used their right not to disclose the details on the internals of the designed self-aspirated sparger studied in this work.
References
- Jizheng, P.; Houhu, Z.; Xuejun, L.; Yong, L.; Min, Z.; Hongling, X. Enhanced nitrogen removal by the integrated constructed wetlands with artificial aeration. Environ. Technol. Innov. 2019, 14, 100362. [Google Scholar] [CrossRef]
- Singh, R.K.; Philip, L.; Ramanujam, S. Continuous flow pulse corona discharge reactor for the tertiary treatment of drinking water: Insights on disinfection and emerging contaminants removal. Chem. Eng. J. 2019, 355, 269–278. [Google Scholar] [CrossRef]
- Prakash, R.; Majumder, S.K.; Singh, A. Flotation technique: Its mechanisms and design parameters. Chem. Eng. Process. Process Intensif. 2018, 127, 249–270. [Google Scholar] [CrossRef]
- Rodrigues, R.T.; Rubio, J. DAF-dissolved air flotation: Potential applications in the mining and mineral processing industry. Int. J. Miner. Process. 2007, 82, 1–13. [Google Scholar] [CrossRef]
- Ross, C.C.; Valentine, G.E.; Smith, J.B.M.; Pierce, P.E.J.P. Recent Advances and Applications of Dissolved Air Flotation for Industrial Pretreatment. In Proceedings of the Industrial Water/Wastewater Program North Carolina AWWA/WEA Conference, Greensboro, NC, USA, 15–17 April 2012. [Google Scholar]
- Aliff Radzuan, M.R.; Abia-Biteo Belope, M.A.; Thorpe, R.B. Removal of fine oil droplets from oil-in-water mixtures by dissolved air flotation. Chem. Eng. Res. Des. 2016, 115, 19–33. [Google Scholar] [CrossRef]
- Agarwal, A.; Ng, W.J.; Liu, Y. Principle and applications of microbubble and nanobubble technology for water treatment. Chemosphere 2011, 84, 1175–1180. [Google Scholar] [CrossRef]
- Palaniandy, P.; Adlan, H.M.N.; Aziz, H.A.; Murshed, M.F.; Hung, Y.T. Waste Treatment in the Service and Utility Industries. In Waste Treatment in the Service and Utility Industries; Taylor & Francis: Boca Raton, FL, USA, 2017. [Google Scholar]
- Perez-Garibay, R.; Martinez-Ramos, E.; Rubio, J. Gas dispersion measurements in microbubble flotation systems. Miner. Eng. 2012, 26, 34–40. [Google Scholar] [CrossRef]
- Perez-Garibay, R.; Ramirez-Aguilera, N.; Bouchard, J.; Rubio, J. Froth flotation of sphalerite: Collector concentration, gas dispersion and particle size effects. Miner. Eng. 2014, 57, 72–78. [Google Scholar] [CrossRef]
- Zhu, J.; Miller, C.F.; Dong, C.; Wu, X.; Wang, L.; Mukhtar, S. Aerator Module Development Using Venturi Air Injectors to Improve Aeration Efficiency. Appl. Eng. Agric. 2007, 23, 661–667. [Google Scholar] [CrossRef]
- Huang, J.; Sun, L.; Du, M.; Liang, Z.; Mo, Z.; Tang, J.; Xie, G. An investigation on the performance of a micro-scale Venturi bubble generator. Chem. Eng. J. 2020, 386, 1–12. [Google Scholar] [CrossRef]
- Hassanzadeh, A.; Azizic, A.; Kouachid, S.; Karimie, M.; Celika, M.S. Estimation of flotation rate constant and particle-bubble interactions considering key hydrodynamic parameters and their interrelations. Miner. Eng. 2019, 141, 1–18. [Google Scholar] [CrossRef]
- Shu, S.; Vidal, D.; Bertrand, F.; Chaouki, J. Multiscale multiphase phenomena in bubble column reactors: A review. Renew. Energy 2019, 141, 613–631. [Google Scholar] [CrossRef]
- Billerbeck, G.M.; Condoret, J.S.; Fonade, C. Study of mass transfer in a novel gas-liquid contactor: The aero-ejector. Chem. Eng. J. 1999, 72, 185–193. [Google Scholar] [CrossRef]
- Biard, P.-F.; Dang, T.T.; Bocanegra, J.; Couvert, A. Intensification of the O3/H2O2 advanced oxidation process using a continuous tubular reactor filled with static mixers: Proof of concept. Chem. Eng. J. 2007, 344, 574–582. [Google Scholar] [CrossRef]
- Opletal, M.; Novotný, P.; Linek, V.; Moucha, T.; Kordač, M. Gas suction and mass transfer in gas-liquid up-flow ejector loop reactors. Effect of nozzle and ejector geometry. Chem. Eng. J. 2018, 353, 436–452. [Google Scholar] [CrossRef]
- Jensen, M.B.; Pedersen, P.L.; Ottosen, L.D.M.; Fauchéa, J.; Smeda, M.O.; Fischerc, K. In silico screening of Venturi designs and operational conditions for gas-liquid mass transfer applications. Chem. Eng. J. 2020, 383, 1–9. [Google Scholar]
- Wang, X.; Shuai, Y.; Zhang, H.; Sun, J.; Yang, Y.; Huang, Z.; Jiang, B.; Liao, Z.; Wang, J.; Yang, Y. Bubble breakup in a swirl-venturi microbubble generator. Chem. Eng. J. 2021, 403, 126397. [Google Scholar] [CrossRef]
- Rainer, B.; Fonade, C.; Moser, A. Hydrodynamics of a new type of ejector. Bioprocess Eng. 1995, 13, 97–103. [Google Scholar] [CrossRef]
- Dumont, É.; Héquet, V. Determination of the Clean Air Delivery Rate (CADR) of photocatalytic oxidation (PCO) purifiers for indoor air pollutants using a closed-loop reactor. Part I: Theoretical considerations. Molecules 2017, 22, 407. [Google Scholar] [CrossRef]
- Gradov, D.V.; González, G.; Vauhkonen, M.; Laari, A.; Koiranen, T. Experimental and Numerical Study of Multiphase Mixing Hydrodynamics in Batch Stirred Tank Applied to Ammoniacal Thiosulphate Leaching of Gold. J. Chem. Eng. Process Technol. 2017, 8, 1–17. [Google Scholar] [CrossRef]
- Han, M. Hydrodynamics and Mass Transfer in Airlift Bioreactors: Experimental and Numerical Simulation Analysis. Ph.D. Thesis, Lappeenranta University of Technology, Lappeenranta, Finland, 19 December 2017. [Google Scholar]
- Gradov, D.V.; Han, M.; Tervasmäki, P.; Latva-Kokko, M.; Vaittinen, J.; Pihlajamäki, A.; Koiranen, T. Numerical Simulation of Biomass Growth in OKTOP®9000 Reactor at Industrial Scale. Ind. Eng. Chem. Res. 2018, 57, 13300–13311. [Google Scholar] [CrossRef] [PubMed]
- Crowe, C.T.; Gore, R.; Troutt, T.R. Particle Dispersion by Coherent Structures in Free Shear Flows. Part. Sci. Technol. 1985, 3, 149–158. [Google Scholar] [CrossRef]
- LaVision. DaVis FlowMaster Software Evaluation; Operational Manual; LaVision: Göttingen, Germany, 2005. [Google Scholar]
- Raffel, M.; Willert, C.E.; Wereley, S.T.; Kompenhans, J. Particle Image Velocimetry—A Practical Guide, 2nd ed.; Springer: Berlin/Heidelberg, Germany, 2007. [Google Scholar]
- Luo, H.; Svendsen, H.F. Theoretical Model for Drop and Bubble Breakup in Turbulent Dispersions. AIChE J. 1996, 42, 1225–1233. [Google Scholar] [CrossRef]
- Khan, F.R.; Rielly, C.D.; Brown, D.A.R. Angle-resolved stereo-PIV measurements close to a down-pumping pitched-blade turbine. Chem. Eng. Sci. 2009, 61, 2799–2806. [Google Scholar] [CrossRef]
- Pinelli, D.; Liu, Z.; Magelli, F. Analysis of kLa Measurement Methods in Stirred Vessels: The Role of Experimental Techniques and Fluid Dynamic Models. Int. J. Chem. React. Eng. 2010, 8, 1–38. [Google Scholar] [CrossRef]
- Casas López, J.L.; Rodríguez Porcel, E.M.; Oller Alberola, I.; Ballesteros Martin, M.M.; Sánchez Pérez, J.A.; Fernández Sevilla, J.M.; Chisti, Y. Simultaneous determination of oxygen consumption rate and volumetric oxygen transfer coefficient in pneumatically agitated bioreactors. Ind. Eng. Chem. Res. 2006, 45, 1167–1171. [Google Scholar] [CrossRef]
- Linek, V.; Beneš, P.; Vacek, V. Dynamic pressure method for kLa measurement in large-scale bioreactors. Biotechnol. Bioeng. 1989, 33, 1406–1412. [Google Scholar] [CrossRef]
- Luo, L.; Yuan, J. Modeling of mass transfer in an internal loop airlift reactor. Chem. Eng. Technol. 2015, 38, 511–520. [Google Scholar] [CrossRef]
- Luo, L.; Liu, F.; Xu, Y.; Yuan, J. Hydrodynamics and mass transfer characteristics in an internal loop airlift reactor with different spargers. Chem. Eng. J. 2011, 175, 494–504. [Google Scholar] [CrossRef]
- Han, M.; Gradov, D.V.; Bogatenko, D.; Tervasmäki, P.; Laari, A.; Koiranen, T. Applicability assessment of gas-liquid contactors to the fermentation processes. In Proceedings of the 10th World Congress of Chemical Engineering, Barcelona, Spain, 1–5 October 2017. [Google Scholar]
- Lukić, N.L.; Šijački, I.M.; Kojić, P.S.; Popović, S.S.; Tekić, M.N.; Petrović, D.L. Enhanced mass transfer in a novel external-loop airlift reactor with self-agitated impellers. Biochem. Eng. J. 2017, 118, 53–63. [Google Scholar] [CrossRef]
- McClure, D.D.; Liu, Z.; Barton, G.W.; Fletcher, D.F.; Kavanagh, J.M. Oxygen transfer in pilot-scale contactors: An experimental and computational investigation into the effect of contactor design. Chem. Eng. J. 2018, 344, 173–183. [Google Scholar] [CrossRef]
- Terasaka, K.; Hirabayashi, A.; Nishino, T.; Fujioka, S.; Kobayashi, D. Development of microbubble aerator for waste water treatment using aerobic activated sludge. Chem. Eng. Sci. 2011, 66, 3172–3179. [Google Scholar] [CrossRef]
| Publisher’s Note: MDPI stays neutral with regard to jurisdictional claims in published maps and institutional affiliations. |
© 2020 by the authors. Licensee MDPI, Basel, Switzerland. This article is an open access article distributed under the terms and conditions of the Creative Commons Attribution (CC BY) license (http://creativecommons.org/licenses/by/4.0/).

 ,
, 


