Abstract
In a moderate, transitory climate, to prevent freezing of outdoor pipes and collectors in solar thermal systems, anti-freezing fluids are commonly used. There is little experience of using water without any additives as a solar thermal fluid in such a climate. Based on these findings, to fill the knowledge gap this article presents the long-term results of thermal performance and anti-freeze protection of a solar heating system with heat pipe evacuated tube collectors with water as a solar thermal fluid. The operation of this system under real conditions was analysed for five years in southern Poland. The annual value of solar insolation ranged from 839 to almost 1000 kWh/m2. The monthly efficiency of the solar collectors from March to October was usually higher than 25%, and the lowest was between November and January. The anti-freeze protection system consumed annually from 7 to 13% of the heat generated by the collectors in the installation. Supporting the operation of the central heating system in the building during the winter season highly improved the efficiency of the solar collectors. Results show that it is possible to use water without any additives as a solar thermal fluid in a moderate, transitory climate.
1. Introduction
Energy is an essential commodity in many aspects of human life and industrial production, in both developing and developed economies. To reconcile the economic growth with the ever-increasing global demand for energy, energy-efficient and environmentally-friendly solutions are being sought in various branches of human activity. For this reason, equipment using renewable energy sources is becoming more and more important. Commonly used solar collectors (SCs) use one of these sources, i.e., solar energy. These devices are nothing more than a special type of heat exchanger in which solar radiation is converted into heat, transferred to the appropriate medium in the system, or used for different purposes [1].
The literature on the subject provides, as a rule, a division of SCs into stationary (fixed, non-tracking) ones, which include flat plate collectors, evacuated tube collectors (ETCs) and compound parabolic collectors [2,3]. The tracking collectors in turn, which track the position of the sun so that the sun’s rays always fall perpendicularly on them, include a parabolic trough collector, cylindrical trough collector, linear Fresnel reflector, circular Fresnel lens, parabolic dish reflector and central tower receiver [2,4]. SCs can also be classified into concentrating (e.g., compound parabolic collectors) and non-concentrating (e.g., flat plate collectors, ETCs) [2]. Another equally important criterion for the division of SCs is the type of solar fluid used (i.e., liquid or gas) [5].
Flat collectors, due to their simple design and low operating cost, are most often used in countries with high insolation levels and warm climates. However, they offer low efficiency, low outlet temperatures of the fluid and high convective heat loss through the glass cover from the collector plate [5,6]. ETCs are characterised by lower convective heat loss due to the presence of a vacuum in the tube spaces. They are used in countries with moderate climates [7,8].
According to [9], the available types of ETCs can be categorised into two groups: the single-walled glass evacuated tube and the Dewar tube. Many variations of these two basic types can be found on the market: with a U-pipe, heat pipe or direct liquid contact [10]. The heat pipe evacuated tube collector (HPETC) with a Dewar tube consists of vacuum-sealed tubes with the absorber surface on the inner glass tube. Heat generated in the absorber is transmitted via a path through a metal (usually aluminium) insert to the heat pipe installed in it. The heat pipe consists of a high thermal conductance sealed tube (copper), which contains a small amount of a low boiling point fluid. During the operation of the collector, the liquid in the heat pipe evaporates and then condenses in the upper part of the heat pipe, transferring heat to the fluid flowing in the manifold ETC [11].
The selection of the solar fluid mainly depends on the application of the solar system (i.e., the working temperature) which also affects the long-term operation, safety and energy efficiency of the system. Water, oils and glycol solutions are commonly used worldwide [1,4]. Due to climatic conditions in Poland, i.e., a moderate transient climate, the most commonly used solar liquids are 35–50% aqueous solutions of propylene or ethylene glycol. Such mixtures, together with refining additives, effectively protect the solar system from freezing of the working medium at outdoor temperatures reaching around −36 °C during the winter. In comparison to water, such solutions have several times higher viscosity, which generates greater hydraulic resistance when pumping liquid in the solar system and, consequently, an increased consumption of electricity by the circulating pump [12,13]. Other disadvantages of these fluids compared to water include:
- -
- lower specific heat values in the range of typical operating temperatures of the working fluid;
- -
- thermal degradation with precipitation of, among others, lactates, acetates and formates, as well as insoluble ethers depositing on the inner surface of the solar system components,
- -
- hindering heat transfer and increasing the freezing point of the solar fluid;
- -
- can be highly corrosive, resulting in accelerated clogging of the collectors and in some cases other system components;
- -
- risk of poisoning as a result of accidental ingestion;
- -
- much higher price per unit volume [12,13,14].
In solar systems operating in moderate climate conditions, it is possible to use environmentally safe water without the addition of substances reducing the freezing point. It is then necessary to apply a solution that protects the system against the freezing of water. In the literature, several solutions can be found:
- -
- automatic control system equipped with an anti-freeze protection (AFP) function which, by switching on the solar pump, allows for the transfer of heat from the heat storage to the SC;
- -
- use of an additional component, e.g., electric heating system (heating tapes), that keeps the water temperature in the part of the system exposed to freezing at a safe level;
- -
- a drain-back system in which solar liquid is discharged from elements exposed to freezing to a special tank;
- -
- a drain-out system in which the system is emptied completely of water;
- -
- use of flexible materials which can withstand the occasional freezing of liquids in system elements, e.g., flexible silicone peroxide pipes insides copper pipes in the SC;
- -
- the use of a phase-change material in the SCs with a transformation temperature <10 °C which does not directly protect the pipes of the solar system [11,12,15,16,17,18,19].
The AFP which, by switching on the solar pump, makes it possible to transfer heat from the heat storage to SCs does not require any additional hydraulic changes in currently used solar systems. In this case, the use of an appropriate automatic protection control system is of utmost importance.
The use of water as a solar fluid is recommended especially in systems
- -
- with a short total length of piping exposed to freezing;
- -
- in which the majority of piping is located inside heated areas, and piping outside the building is well insulated;
- -
- equipped with an SC with a low external heat loss coefficient, e.g., for ETCs.
The purpose of this article is to analyse the thermal performance and AFP system of a solar heating system with HPETCs with water as a solar thermal fluid, while indicating the advantages and disadvantages of such a solution. The installation uses a specially selected automatic control system that switches on the solar pump in order to maintain the appropriate water temperature in the SCs and the pipeline. There are no devices that heat the installation components exposed to freezing of water, e.g., heating tapes. The operation of this system under real conditions was analysed for five years in a residential and retail building located near Kraków in Southern Poland. The HPETCs are mainly used for preparing domestic hot water (DHW), as well as for supporting central heating. They are part of a multivalent hybrid system where, for the production of heat and cold, three different heating devices (brine-to-water heat pump, biomass boiler and gas condensing boiler) are additionally used [20].
2. Description of the System
An experimental solar system with HPETCs was set up at the beginning of September 2011 on the roof of a detached, two-storey building located a few kilometres outside Kraków, Poland (latitude 50.12°N and longitude 20.03°E). The building footprint area is about 268 m2. The roof with metal roofing tiles is symmetrical, with an inclination of 35° deviated from the south by 10° to the easterly direction. The solar system consists of one 12-pipe and five 20-tube HPETCs with a total aperture area of 10.53 m2. The collectors were installed parallel to the roof surface. The basic technical data for the SCs used are summarised in Table 1.

Table 1.
Basic heat pipe evacuated tube collector (HPETC) data.
The SCs are connected in series and parallel (three collectors for each series) by means of a DN16 corrugated stainless steel tube, insulated with a 25 mm layer of rubber foam. The total length of the piping on the roof of the building is 12 m and 11 m at the unheated attic.
The main function of the group of collectors in the system is to supply generated heat for DHW by the lower coil of the combined tank (CT) named SG (K) 800/200 with a total capacity of 800 L (Figure 1). DHW is heated in an internal tank with a capacity of 200 L. From the beginning of September 2011 to 24 March 2012, the solar fluid was a 40% aqueous propylene glycol solution. At the end of March 2012, the solar fluid used was replaced with demineralised water.
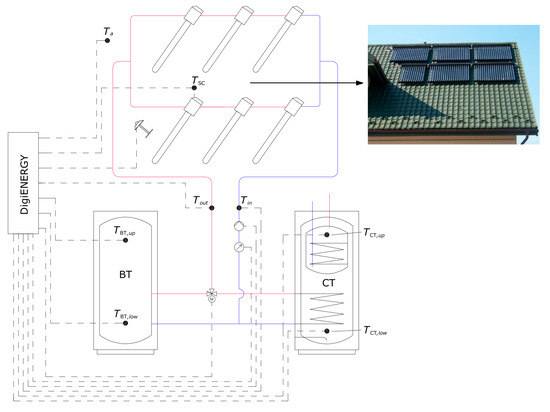
Figure 1.
Scheme of the solar installation and photo of the solar collectors (SCs) installed on the roof of a building.
The heat generated by the SCs can also be directed, through appropriate switching of the three-way valve, directly to the buffer tank (BT) with a capacity of 1500 L. This process takes place without an additional heat exchanger, since the same liquid, the deionised water, remains in the solar circuit and the BT. The HPETCs used are characterised by low values of linear and quadratic heat loss coefficients (Table 1); therefore, it was possible to use deionised water as an intermediate fluid in transferring heat from the SC to the tanks. In addition to a number of benefits resulting from this, the main drawback of such a solution in the installation used throughout the year is the possibility of water freezing in the piping or in the manifold at low outdoor temperatures in winter.
2.1. The AFP System Strategy
Safe operation of the solar system in the winter, without the risk of leaks or damage, required activation of the AFP function in the DigiENERGY control system. The operation of the system is shown in Figure 2 over four selected days differing in insolation patterns, outside air temperature (Ta) and temperature of water in the lower part of the BT (TBT,low) and the lower part of the CT (TCT,low). The AFP operation consisted of short-term switching of the solar pump when the water temperature measured in one of the SC heads (TSC) was lower than 9.5 °C. As a result, the transfer of heat accumulated in the lower part of the BT followed on to the collectors on the roof of the building, as well as to the piping. This lasted until TSC and the return water temperature rose above 20 °C.
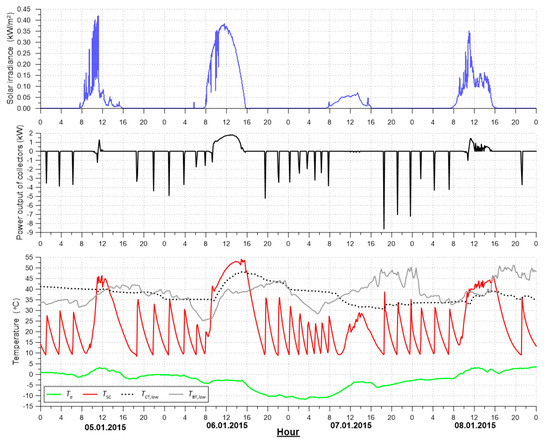
Figure 2.
Selected parameters of SC operation from 5 to 8 January 2015.
The AFP system was most often activated during the winter period (at low outside temperatures) during the night hours and during the day when insolation was low (Figure 2). The AFP switching frequency was dependent upon Ta: when it was around 0 °C, it was switched on every 2.5 h on average (5–6 January 2015), whilst at −10 °C it switched on every 1.5 h (07 January 2015). The result of the system operation was the negative heating power of the SCs, shown in Figure 2 as peaks ranging from −1.5 to −9.5 kW. These values mean the heat flux that was taken from the buffer tank and used to maintain the appropriate temperature of the solar fluid, i.e., water in solar collectors and pipelines. If, during the day, the appropriate solar radiation intensity was applied to the surface of the SC, the collectors produced heat and returned it to the CT, which can be observed as the increase of TCT,low. At low radiation intensity, only the increase of water temperature in the collectors was recorded, so that from 8.00 a.m. to 6.00 p.m., the AFP system did not start the circulation pump.
2.2. Data Measurement and Acquisition
The visualisation, monitoring, remote maintenance and data recording of the installation in real time was provided by a DigiENERGY control system. All the measuring apparatus and parameters are listed in Table 2. The temperature sensors were mounted in an OG-type outer sheath, or in the TT-532/B housing. A secondary standard pyranometer was installed in parallel to the surface of the SCs.
Table 2.
Basic HPETC data.
3. Results and Discussion
3.1. Solar Insolation
Measurements of the intensity of solar radiation acting on the SC surface, which are necessary to determine the HPETC work efficiency in real conditions, were carried out from 18 April 2012 using the CM21 pyranometer. Figure 3 presents summarised values of monthly and annual insolation for the location of the solar system in question in years under review. Annual solar insolation for 2012 is not marked, because full measurement data for this year was not collected. It can be seen that during the year, the lowest values of monthly insolation occur in two months: December and January. In turn, the peak of insolation intensity fell in July. In the period from April to September, from 74 to 79% of the total annual insolation reached the surface of the SCs. In these months, the greatest differences in relation to the average insolation value were present (average in Figure 3).
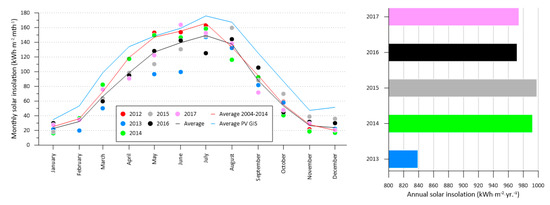
Figure 3.
Measured monthly and annual solar insolation from 2012 to 2017.
For comparison, the average monthly insolation values in the years 2004–2014 are presented (average for 2004–2014) in Figure 3 for Kraków, as described in the paper [21]. Additionally, the average values of insolation for the period 2013–2016 obtained from the PV GIS database [22] are shown. The line graphs of the average monthly insolation for the three databases compared are similar. The differences might have been caused mainly by a different installation angle of the pyranometer and other device installation locations, resulting in slightly different weather conditions (cloudiness, fog, dust, etc.). Annually, 839 kWh/m2 (2013) to nearly 1000 kWh/m2 (2015) reached the surface of the SC during the period under review (Figure 3). On average, in Poland, annual insolation per horizontal surface ranges from 980 to 1074 kWh/m2 [21].
3.2. The Analysis of AFP Operation in the Long-Term
Figure 4 shows the daily energy consumption for the AFP system (QAFP,d) and the change in the mean daily external temperature over a given period of time. Each year, the AFP’s operation began in September and ended in May.
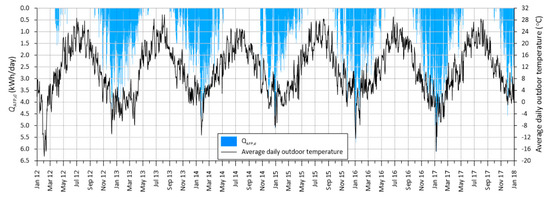
Figure 4.
Anti-freeze protection (AFP) system energy consumption and outdoor temperature in the years 2012–2017.
From December to February, the average daily air temperature was usually below 4 °C. However, the highest air temperatures, exceeding 20 °C, occurred between June and July. The peak of the energy demand for the AFP system was naturally in the winter months, with a low outside temperature reaching several kWh.
Figure 5 shows the relationship between QAFP,d and the average daily outside temperature. For an average daily air temperature below −3.0 °C, the value of QAFP,d ranged from 1.5 to even 6 kWh. Above 0 °C, QAFP,d was below 4.5 kWh. As can be seen at a given average daily outside air temperature, a wide range of energy consumption by the AFP occurred. There are several reasons for such a result:
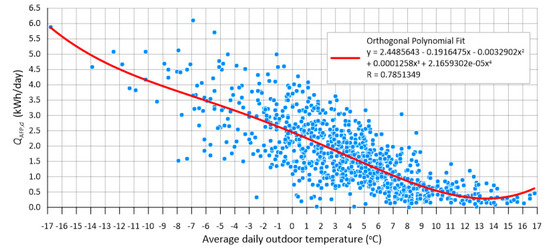
Figure 5.
Dependence of the AFP system energy consumption on outdoor temperature.
- -
- the average daily outside temperature, by definition, does not show the temperature spread over a given day;
- -
- the chart does not take into account the influence of insolation;
- -
- the chart does not show the pattern of fluid temperature in the BT from which energy was drawn for the AFP system to run.
Figure 6 shows the results of monthly energy consumption by the AFP system (vertical boxes under 0 kWh) and heat production by the SCs in particular years. In May and September each year, the monthly heat consumption by the AFP system was just a few kWh. However, heat quantities above 50 kWh were consumed in January (from 22 to 33% of the total annual heat consumption for AFP), as well as in December (18–23%).
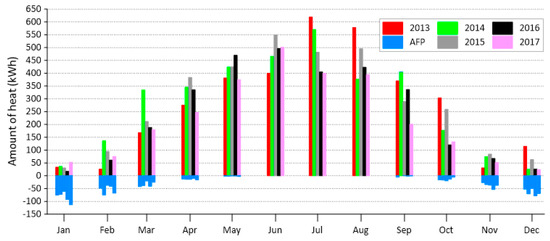
Figure 6.
Heat production and energy consumption by the AFP system from 2013 to 2017.
Due to the monthly amount of energy from insolation (available to SCs), the monthly heat production distribution pattern was similar to the monthly insolation (Figure 3). The greatest amount of heat for the AFP system was used in January 2017 (113 kWh), due to the very low values of Ta (Figure 4). From May to August, the SCs produced over 350 kWh of heat in the installation monthly. In December and January each year, more energy was spent on the AFP system than the SCs were able to generate.
3.3. HPETC Long-Term Operation Effects
In the years under review, the monthly efficiency of the collectors (calculated as the ratio of monthly heat production of SCs and the value of monthly solar radiation multiplied by the aperture area of solar collectors) from March until October was usually higher than 25% (Figure 7). The lowest monthly efficiency was recorded between November and January. Supporting the operation of the heating system in the building in the winter season highly improved the efficiency of the SCs (October and December 2013; February, March, October and November 2014). In September 2014, the SCs returned part of the heat produced to the BT, from which the energy was transferred to the ground probes of a vertical heat exchanger of a heat pump for thermal regeneration of the soil surrounding three boreholes. This process also caused an increase in the average monthly efficiency of SCs to above 40%.
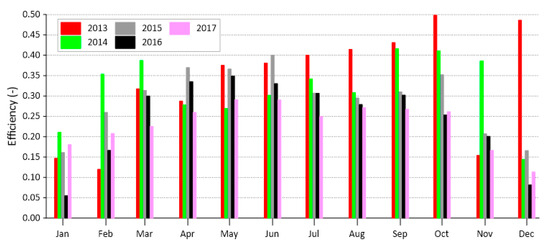
Figure 7.
The monthly efficiency of HPETCs.
The data shown in Figure 7 could suggest that the efficiency of the SC decreased in subsequent years. This disturbing tendency was primarily caused by the smaller consumption of DHW by the occupants of the building in subsequent years—the number of occupants was 11 in 2012 and only 5 in 2017. Over the years, this fact was particularly noticeable in the summer months, when the amount of available solar energy was the greatest, and the SCs, due to a lower DHW consumption, operated in temperatures above 60 °C, reaching a lower efficiency by definition.
Figure 8 shows the relationship between the daily efficiency of SCs and the production of heat in the years 2013–2017. The daily heat production values of SCs were determined from the data recorded by the control system of the installation on a given day (from the measurements of the solar fluid flow rate, the difference in fluid temperature at the outlet and inlet of the solar system, and the appropriate values of density and specific heat of water). On the other hand, daily SC efficiency values were calculated as the ratio of daily heat production and the value of daily solar radiation measured by a pyranometer converted to the aperture area of solar collectors (10.53 m2). If the daily production of heat by SCs exceeded 24 kWh, their efficiency was over 30%, and above 28 kWh, it ranged from 38 to 57%. The daily efficiency of the SCs above 60% was achieved within 39 days, most of which fell on the winter days in which the SCs also produced heat for central heating. Figure 8 demonstrates that the daily efficiency of SCs increased with the amount of heat produced. This can be explained by the fact that only favourable conditions for the production of heat (adequate insolation, Ta, TBT,low and TCT,low) allow for the production of large amounts of heat, which also translates into high efficiency SCs.
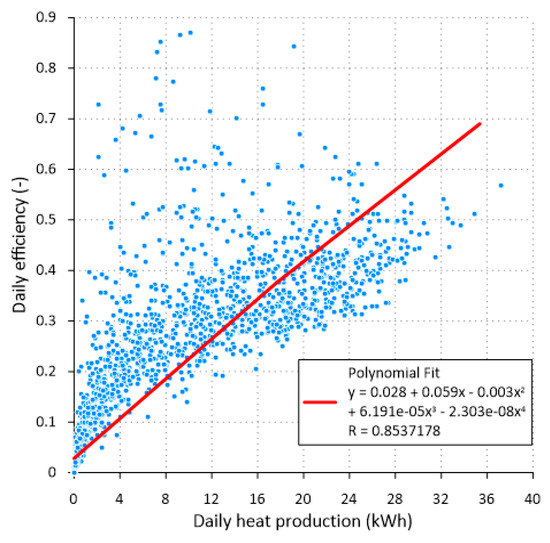
Figure 8.
Dependence of the daily efficiency on heat production.
Table 3 summarises the data on the annual results of operation of the solar system in the analysed years. The greatest annual SC efficiency figures, amounting to more than 30%, were achieved in the years 2013–2015, at the same time generating the greatest amount of heat and solar pump operating time. The annual amount of energy used for the AFP system was from 7 to 13% of the heat generated in the system. In 2017, the lowest efficiency of the solar installation was achieved due to low DHW consumption in the building (especially during the summer) and the lack of support for the central heating system in winter.
Table 3.
Summary of annual solar installation results.
4. Conclusions
This article presents several years of results of the solar thermal system’s operation in a moderate, transitory climate. Because water was used as a solar thermal fluid, the AFP system was applied. The operation of the HPETSCs was analysed from 2013 until 2017 in a residential and retail building located near Kraków, Poland. The collected data was used to discuss topics relating to thermal performance, energy production and consumption of energy by a solar and AFP system.
The functioning of the AFP system in a moderate, transitory climate is associated with the consumption of heat accumulated in the heat storage during months with low outside temperatures and low insolation. In the analysed installation, the AFP system worked from September to May and consumed annually from 7 to 13% of the heat generated by the SCs in the installation. The greatest amounts of heat, above 50 kWh/day, were consumed in January and December. As demonstrated in this article, in these months, more energy was spent on running the AFP system than the SCs were able to generate.
The AFP system employed was characterised by the minimal investment cost of the project compared to other systems using, among other methods, heating of the piping with electric heating tapes and gravity drainage of the piping into a special tank (so-called drain-back system). Moreover, such a protection solution requires neither additional hydraulic modifications in the system nor a complex control system, as most currently used solar system controllers have a built-in AFP function. It is also worth noting that water without additives that reduce the freezing point is environmentally-friendly, unlike other substances used in solar systems. Traditional methods of producing propylene glycol are based on the processing of crude oil. In these technologies, propylene oxide obtained from the crude oil component (propylene) is subjected to high-temperature and high-pressure hydrolysis. This method of producing glycol has a negative impact on the natural environment.
In the years under review, the monthly efficiency of the SCs from March to October was usually higher than 25%, and the lowest efficiency was recorded between November and January. The change in the number of building residents, which translated into reduced DHW consumption, had a significant impact on the all-year efficiency of HPETSCs. The greatest annual SC efficiency figures, amounting to more than 30%, were achieved in the years 2013–2015, at the same time generating the greatest amount of heat and solar pump operating time. During the study, no system failures were recorded which could have caused the water to freeze in the system. Furthermore, there was no overheating of water or stagnation in the SCs.
While designing a solar system running with water, it should be noted that the length of piping between the SCs and the heat receiving device should be as short as possible. Similarly, the length of the piping between the collectors and that in the immediate vicinity of the outside air should be kept as short as possible. If these conditions are not met, the temperature of the fluid should be additionally monitored at the appropriate points of the system piping.
The experimental results of the AFP system presented in this paper can be used as a basis for optimisation works in terms of the appropriate strategy of switching on and duration of operation of circulation pumps, temperature settings of the AFP system switching on and off, or modifying insulation parameters of solar pipes. Such results have not been comprehensively presented so far in relation to a moderate, transitory climate. Moreover, they can be useful for comparison among different working strategies of AFP solar systems with water as a solar fluid.
Funding
This research received no external funding.
Conflicts of Interest
The author declares no conflict of interest.
References
- Sarsam, W.S.; Kazi, S.N.; Badarudin, A. A review of studies on using nanofluids in flat-plate solar collectors. Sol. Energy 2015, 122, 1245–1265. [Google Scholar] [CrossRef]
- Gorjian, S.; Ebadi, H.; Calise, F.; Shukla, A.; Ingrao, C. A review on recent advancements in performance enhancement techniques for low-temperature solar collectors. Energy Convers. Manag. 2020, 222, 113246. [Google Scholar] [CrossRef]
- Shamsul Azha, N.I.; Hussin, H.; Nasif, M.S.; Hussain, T. Thermal Performance Enhancement in Flat Plate Solar Collector Solar Water Heater: A Review. Processes 2020, 8, 756. [Google Scholar] [CrossRef]
- Suman, S.; Khan, M.K.; Pathak, M. Performance enhancement of solar collectors—A review. Renew. Sustain. Energy Rev. 2015, 49, 192–210. [Google Scholar] [CrossRef]
- Daghigh, R.; Shafieian, A. Theoretical and experimental analysis of thermal performance of a solar water heating system with evacuated tube heat pipe collector. Appl. Therm. Eng. 2016, 103, 1219–1227. [Google Scholar] [CrossRef]
- Genc, A.M.; Ezan, M.A.; Turgut, A. Thermal performance of a nanofluid-based flat plate solar collector: A transient numerical study. Appl. Therm. Eng. 2018, 130, 395–407. [Google Scholar] [CrossRef]
- Sabiha, M.A.; Saidur, R.; Mekhilef, S.; Mahian, O. Progress and latest developments of evacuated tube solar collectors. Renew. Sustain. Energy Rev. 2015, 51, 1038–1054. [Google Scholar] [CrossRef]
- Sakulchangsatjatai, P.; Wannagosit, C.; Kammuang-Lue, N.; Terdtoon, P. Theoretical and experimental investigation of the evacuated tube solar water heater system. Therm. Sci. 2019, 24, 795–808. [Google Scholar] [CrossRef]
- Gao, Y.; Zhang, Q.; Fan, R.; Lin, X.; Yu, Y. Effects of thermal mass and flow rate on forced-circulation solar hot-water system: Comparison of water-in-glass and U-pipe evacuated-tube solar collectors. Sol. Energy 2013, 98, 290–301. [Google Scholar] [CrossRef]
- Elsheniti, M.B.; Kotb, A.; Elsamni, O. Thermal performance of a heat-pipe evacuated-tube solar collector at high inlet temperatures. Appl. Therm. Eng. 2019, 154, 315–325. [Google Scholar] [CrossRef]
- Duffie, J.A.; Beckman, W.A. Solar Engineering of Thermal Processes, 4th, ed.; John Wiley & Sons, Inc.: Hoboken, NJ, USA, 2013. [Google Scholar]
- Pater, S. Energy efficiency of solar collectors using water, as solar liquid. J. Civ. Eng. Environ. Archit. 2014, 61, 401–410. [Google Scholar] [CrossRef]
- ASHRAE. 2001 ASHRAE Handbook Fundamentals; ASHRAE: Atlanta, GA, USA, 2001; Volume 53, ISBN 9788578110796. [Google Scholar]
- Rimar, M.; Fedak, M.; Vahovsky, J.; Kulikov, A.; Oravec, P.; Kulikova, O.; Smajda, M.; Kana, M. Performance evaluation of elimination of stagnation of solar thermal systems. Processes 2020, 8, 621. [Google Scholar] [CrossRef]
- Liu, H.; Zhang, S.; Jiang, Y.; Yao, Y. Feasibility study on a novel freeze protection strategy for solar heating systems in severely cold areas. Sol. Energy 2015, 112, 144–153. [Google Scholar] [CrossRef]
- Botpaev, R.; Louvet, Y.; Perers, B.; Furbo, S.; Vajen, K. Drainback solar thermal systems: A review. Sol. Energy 2016, 128, 41–60. [Google Scholar] [CrossRef]
- Vera-Medina, J.; Lillo-Bravo, I.; Hernández, J.; Larrañeta, M. Experimental and numerical study on a freeze protection system for flat-plate solar collectors with silicone peroxide tubes. Appl. Therm. Eng. 2018, 135, 446–453. [Google Scholar] [CrossRef]
- Zhou, F.; Ji, J.; Yuan, W.; Zhao, X.; Huang, S. Study on the PCM flat-plate solar collector system with antifreeze characteristics. Int. J. Heat Mass Transf. 2019, 129, 357–366. [Google Scholar] [CrossRef]
- Zhou, F.; Jie Ji, W.Y.; Modjinou, M.; Zhao, X.; Huang, S. Experimental study and performance prediction of the PCM-antifreeze solar thermal system under cold weather conditions. Appl. Therm. Eng. 2019, 146, 526–539. [Google Scholar] [CrossRef]
- Pater, S. Field measurements and energy performance analysis of renewable energy source devices in a heating and cooling system in a residential building in southern Poland. Energy Build. 2019, 199, 115–125. [Google Scholar] [CrossRef]
- Matuszko, D.; Celiński-Mysław, D. Solar conditions in Cracow and their use fulness for helioenergetics. Acta Scientiarum Polonorum. Formatio Circumiectus 2016, 15, 103–111. [Google Scholar] [CrossRef]
- PVGIS European Communities 2001–2020. Available online: https://re.jrc.ec.europa.eu/pvg_tools/en/#MR (accessed on 8 October 2020).
Publisher’s Note: MDPI stays neutral with regard to jurisdictional claims in published maps and institutional affiliations. |
© 2020 by the author. Licensee MDPI, Basel, Switzerland. This article is an open access article distributed under the terms and conditions of the Creative Commons Attribution (CC BY) license (http://creativecommons.org/licenses/by/4.0/).